
Abstract
Financial burden from health expenditure is a serious cause of concern for low-income and developing countries. Studies have shown that low public investment in health, lack of adequate safety net mechanisms and poor quality of public health system in these countries are few basic grounds for placing high financial burden on people. In order to make both ends meet during illness, poor people resort to various alternative means. One of the popular strategies adopted is to reduce or reallocate the consumption bundle, so as to meet the medical expenditure. The impact of out of pocket (OOP) health expenditure on the consumer expenditure has immediate and direct impact especially among the poor sections of the society. This article aims to study the impact of out of pocket health expenditure on the constituents of consumer expenditure and how the composition of consumer expenditure differs with the levels of out of pocket expenditure among different consumption quintiles. The study uses IHDS household level survey data for the year 2011–2012. A mean comparison test is carried out to check whether significant difference exists in the consumption bundles of households with and without medical expenditure. A system of Engel curves is estimated with seemingly unrelated regression equation (SURE) to study the impact of out of pocket medical expenses on the consumption bundle. The results show that there exists significant difference in the share of different consumption items in the consumption bundles of households with and without out of pocket expenditure. Despite having larger share for food expenditure, poor households tend to protect the consumption of food share in the bundle. Compensation for rise in medical expenses is reflected in the reduced share of non-food expenditure items like fuel, education, entertainment, clothing and footwear. With high share of out of pocket expenditure, poor households in the states with high public health expenditure mainly reduced their education expenditure whereas consumption of most of the non-food items were reduced by poor households in low public health expenditure states.
Keywords
Introduction
Financial burden from health expenditure is a serious cause of concern for low- and middle-income countries as they belong to the most vulnerable group. Studies have shown that low public investment in health, lack of adequate safety net mechanisms and poor quality of public health system in these countries are few basic grounds for placing high financial burden on people (Audibert & Mathonnat, 2013; El-Sayed, Vail, & Kruk, 2018). High out of pocket expenditure tends to push households into poverty or deepen their existing poverty (McIntyre, Thiede, Dahlgren, & Whitehead, 2006; Van Doorslaer et al., 2006; Xu et al., 2003). For instance, approximately 3.5 per cent of the India’s population is pushed below the poverty line in 2011–12 due to out of pocket medical expenses (Hooda, 2017). Even studies have shown the influence of high out of pocket expenditures in creating poverty traps called ‘medical poverty traps’ in developing countries (Whitehead, Dahlgren, & Evans, 2001). World Health Organization has therefore recognized protection from financial burden of health expenditure as the fundamental objective of health systems (World Health Organization [WHO], 2000). An ideal health system thus protects people not only from illness but also from its after-effects in terms of financial burden.
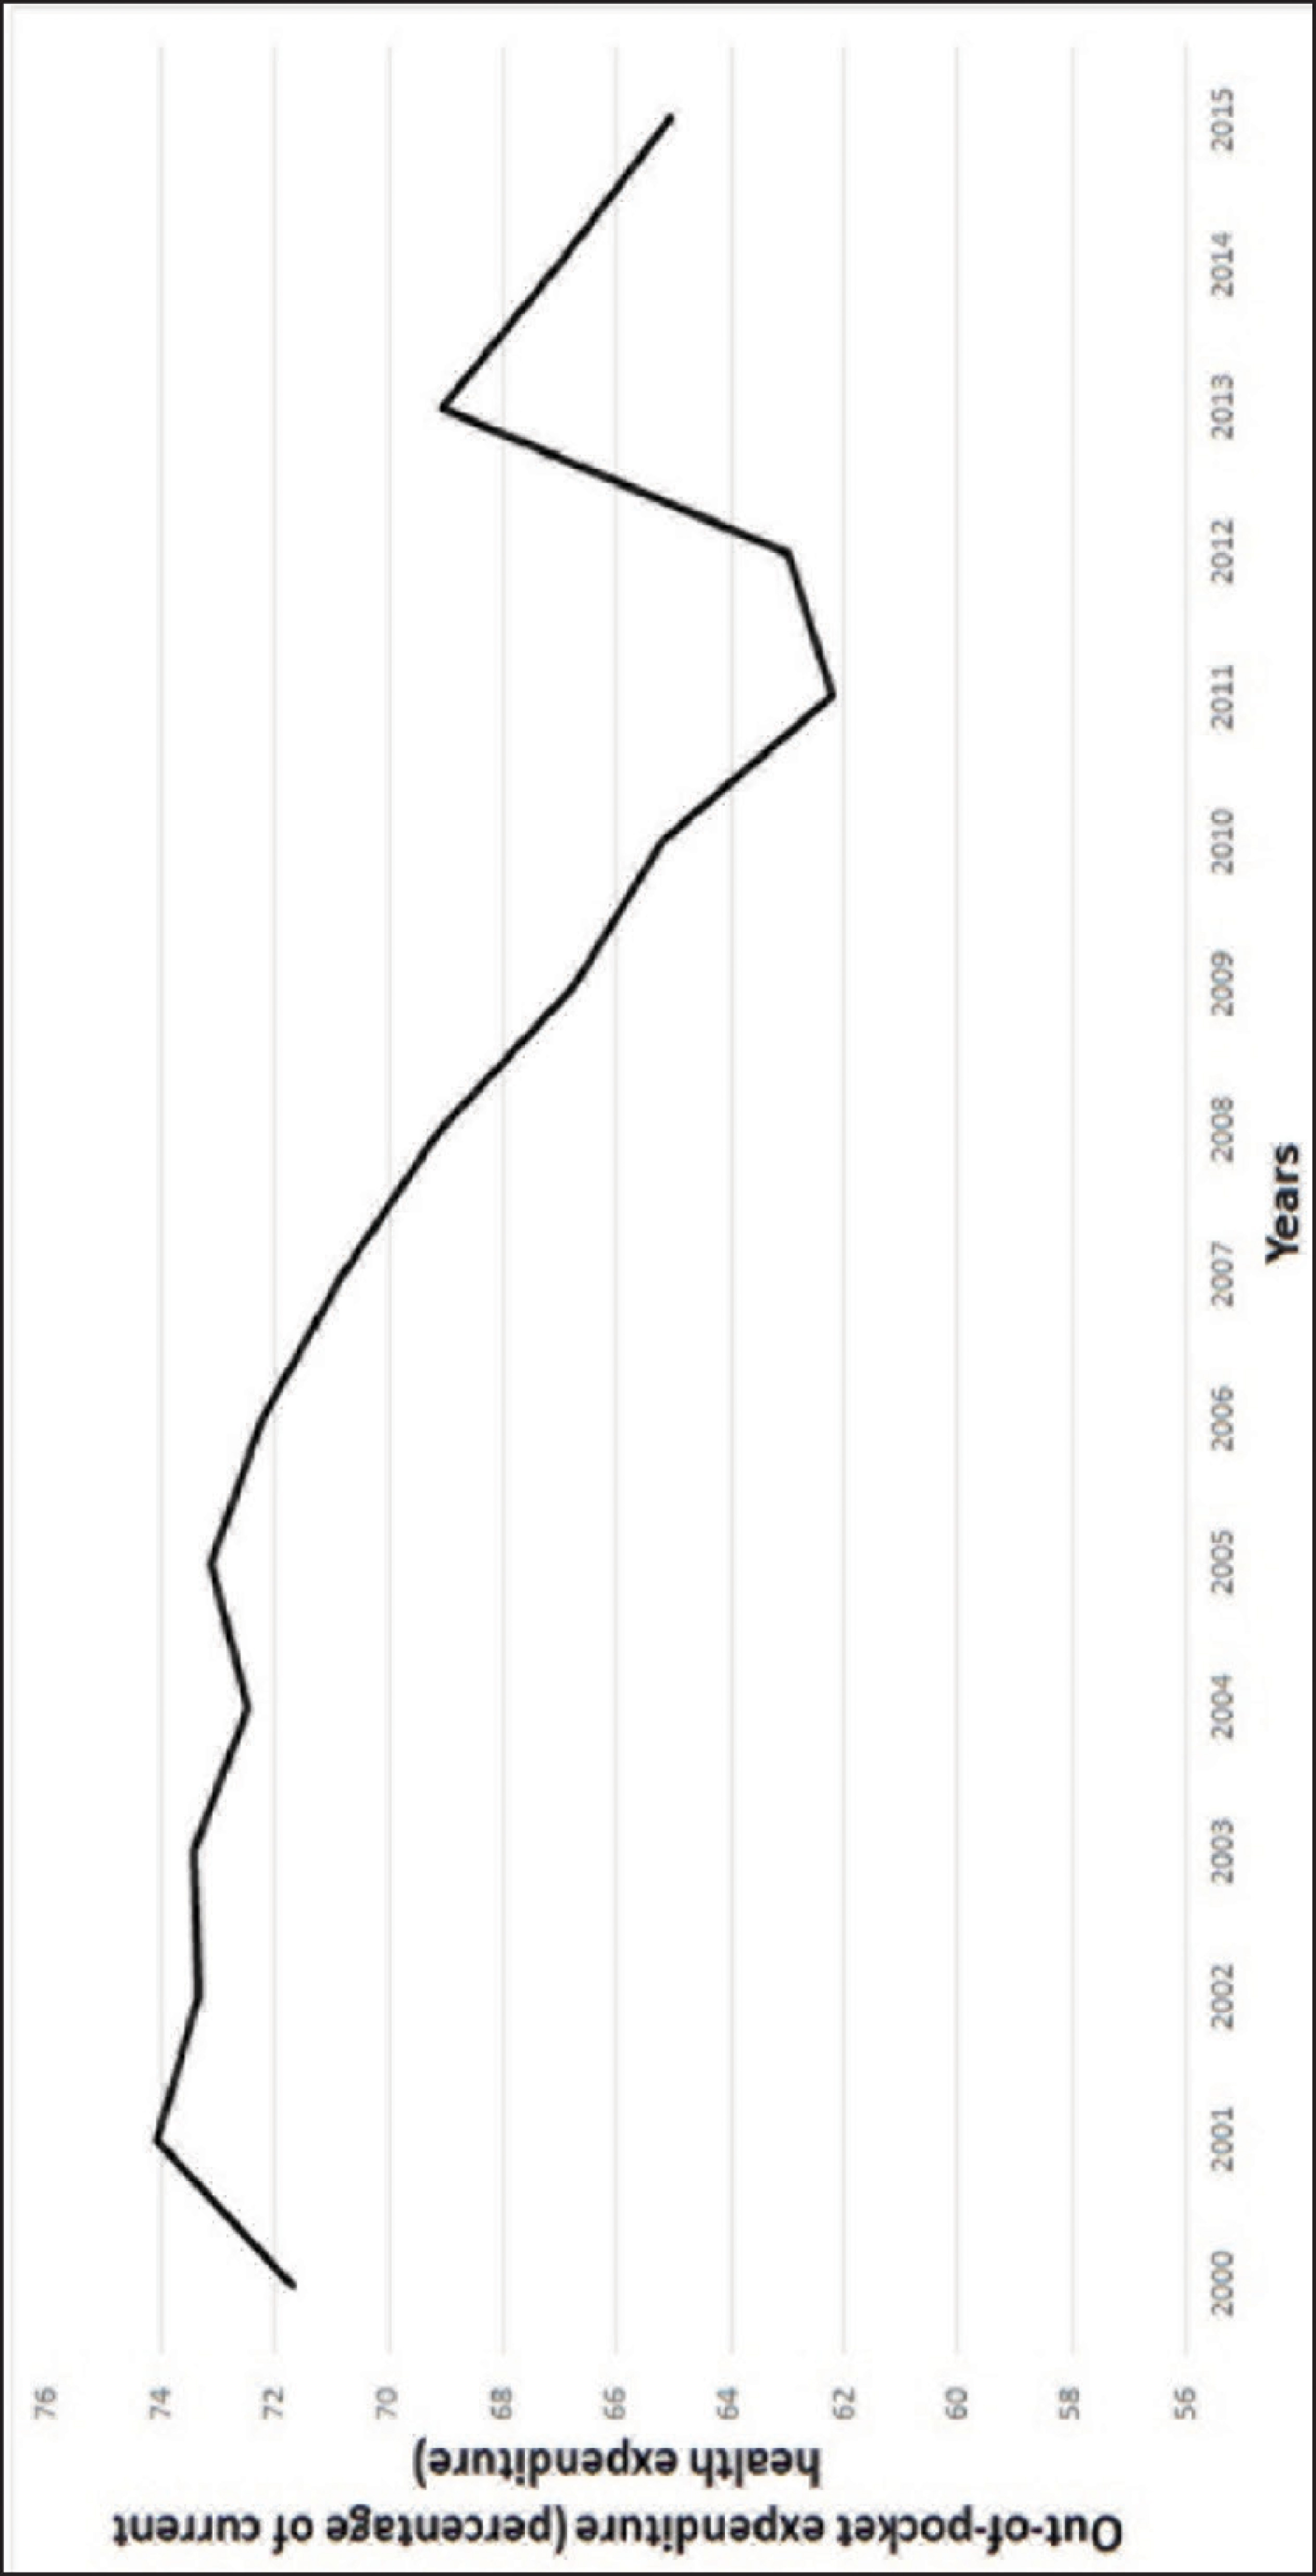
India is one of those countries which face high risk of financial burden as its share of out of pocket expenditure stands as high as 65.06 per cent of total current health expenditure (World Bank, 2018) (Figure 1). Karan (2015) has pointed out that risk of financial burden is highly faced by poor and daily wage labourers in India. Coping strategies adopted to survive from financial burden generally include borrowing of money from friends, relatives or money lenders, reduction or adjustment within consumption bundle of households and sale of assets to compensate the amount spent. Poor households mostly resort to borrowing and second to consumption modification to cope with out of pocket health expenditure (Dhanaraj, 2016; Flores, Krishnakumar, O’donnell, & Van Doorslaer, 2008; Nguyen et al., 2012). All coping mechanisms employed have short-term and long-term implications on the economic well-being of the households. The impact of out of pocket expenditure on the modification of consumption bundle has immediate and direct impact especially among the poor sections of the society as they strive to make both ends meet. Therefore the way in which households modify their consumption share of different items with rise in share of out of pocket health expenditure have significant role in understanding the financial burden caused by illness.
This article aims to study how different is the consumption bundle of households with and without out of pocket health expenditure among different economic strata. It also studies the impact of out of pocket health expenditure on the consumption shares of items like food, clothing, housing, education, etc., and how the composition of consumer expenditure differs with the different levels of out of pocket expenditure among different consumption classes especially among poor households. A comparative impact analysis is also carried out among poor households in the states with high and low public health expenditure.
Unexpected illness is a leading source of economic risk (Miller, Pinto, & Vera-Herna´ndez, 2013). Financial expenditure incurred through illness are mainly financed from out of pocket in many developing countries including India. People therefore resort to different methods to adapt to these financial risk caused by illness. Russell (1996) showed that people go for alternative means to mobilize resources to pay for health care even when it goes beyond their capacity. One of the main alternative means includes sacrificing basic needs like food and education. Meyerhoefer, Sahn, and Younger (2007) have also proved that consumers are very responsive to the consumption of food, non-food and leisure expenses with rise in medical expenses. This is further substantiated by Foster (1994). He showed that calorie consumption of households will be affected with the incidence of illness especially among the poor households. Similarly, study by Kabir, Rahman, Salway, and Pryer (2000) showed that reduction in household consumption expenditure is second common response of coping strategy adopted against high medical expenditure. Food, fuel and transportation cost are the most likely affected items while reducing household expenditure.
World health organization (Leive & Xu, 2007) did an impact analysis of out of pocket expenditure on the household consumption composition in six African countries using Engel curves. A two-part model was further used to understand absolute changes in expenditure. The study identified that with increase in levels of out of pocket medical expenditure, expenditure allocated to goods other than food decreases. Medical expenses from pocket were compensated by compromising the consumption on housing, education and other items. It was also found that though households protect consumption of food there is decline in the food expenditure in absolute terms. Another impact analysis of health care cost on the consumption patterns of households in Tanzania by Somi, Butler, Vahid, Njau, and Abdulla (2009) showed that consumption of luxury items reduced with incidence of illness and reallocated the funds to health and health care products. The study substantiated the hypothesis that households strategically cope with health expenditure by reallocating their funds. Similar study of Indian households was analyzed by Pal (2013) using conditional Engel curves. Ten broad categories of goods which include food, intoxicants, fuel, clothing, footwear, education, entertainment, travel, rent, durables and other goods were considered for the analysis. Study used 61st round of National Sample survey on socio economic conditions of Indian households. It was found that poorer households increase consumption of food, fuel and travel and decrease the consumption of clothing and education to cope with health expenditure. Author also did a comparative study across subgroups of less developed states and developed states as well as states with low public expenditure and others. Poor states and states with low public investment are the worst affected than their counter parts due to high out of pocket health expenditure.
The literature reveals that there exists a negative impact of out of pocket medical expenditure on consumption of items other than food for a household. Households generally protect the food expenditure and make adjustments with education, clothing and other consumption items. As the poor sections of the society spent large share of their income on food and strives to meet other non-food expenses, the article tries to look at how out of pocket medical expenditure impact the consumption pattern of essential goods like food, clothing, education among different consumption classes with a special focus on below poverty line households.
Data and Methodology
Data and Variables
Data used in the study are from India Human Development Survey 2011–12 (IHDS), a nationally representative, multi-topic panel survey of 42,152 households in 384 districts, 1,420 villages and 1,042 urban neighbourhoods across India with the exception of Andaman and Nicobar and Lakshadweep. This survey is organized by University of Maryland in association with National Council of Applied Economic Research (NCAER). The samples in the data are drawn using stratified sampling technique for rural and urban areas. Survey period covers almost a year which helps in reducing the seasonality bias. The data set provides information on household consumption expenditure, employment, economic status, marriage, fertility, gender relations, social capital, medical and educational status of households in India.
To analyze the impact of out of pocket medical expenditure on a household’s allocation to different consumption goods, consumption items are classified into 11 broad categories (Table 1), such as food, essentials, fuel, out of pocket health expenditure, clothing and footwear, intoxicants, education, entertainment, rent, durables and others. They are measured in terms of total value of goods in Indian rupees for a year. It includes both grown and purchased items by the households. Out of pocket medical expenditure (OOP), prime variable of interest is considered as the share of capacity to pay, after reducing the amount received through insurance reimbursement for medical expenses. Based on the ratio, it is categorized into four categorical variables. The base category OOP10 has the ratio of less than 10 per cent. OOP20 has the share between 10 and 20 per cent followed by OOP30 with share in between 20 and 40 per cent. OOP40 represents share of more than 40 per cent. OOP as a ratio is considered with the assumption to capture the impact of financial burden not just with high OOP in absolute terms but also in relative terms (Leive & Xu, 2007). Capacity to pay is considered as the effective income minus subsistence expenditure which gives non-food expenditure of household. Expenditure on food items are categorized into two parts, essentials and food. Essentials include essential items available through Public Distribution System (PDS), such as rice, wheat, sugar, kerosene and other cereals. Food includes total value of all food items purchased or grown excluding expenditure on pan tobacco intoxicants, food ate at restaurants and items in the category of essentials. The data on items like food, essentials, fuel, rent and outpatient medical expenses are provided over a 30 days reference period. Expenditure on education, clothing, durables, entertainment and inpatient medical expenses are provided with a reference period of 365 days due to its low frequency purchase.
Description of Variables

Description of Variables
Socio economic and demographic variables such as social groups, highest education of adult in the household, household size, debt incurred for medical expenses, share of elderly persons, share of children, share of regular salaried persons, access to electricity, assets, medical insurance coverage, age and sex of household head are also considered. The data is classified into quintiles based on their per capita consumption expenditure for analysis. First and second quintile represent the lowest consumption households. Below poverty line households considered in the analysis are those whose per capita expenditure falls below the poverty line suggested by Tendulkar committee 2012. Table 1 shows the labels and definition of the variables used in the analysis.
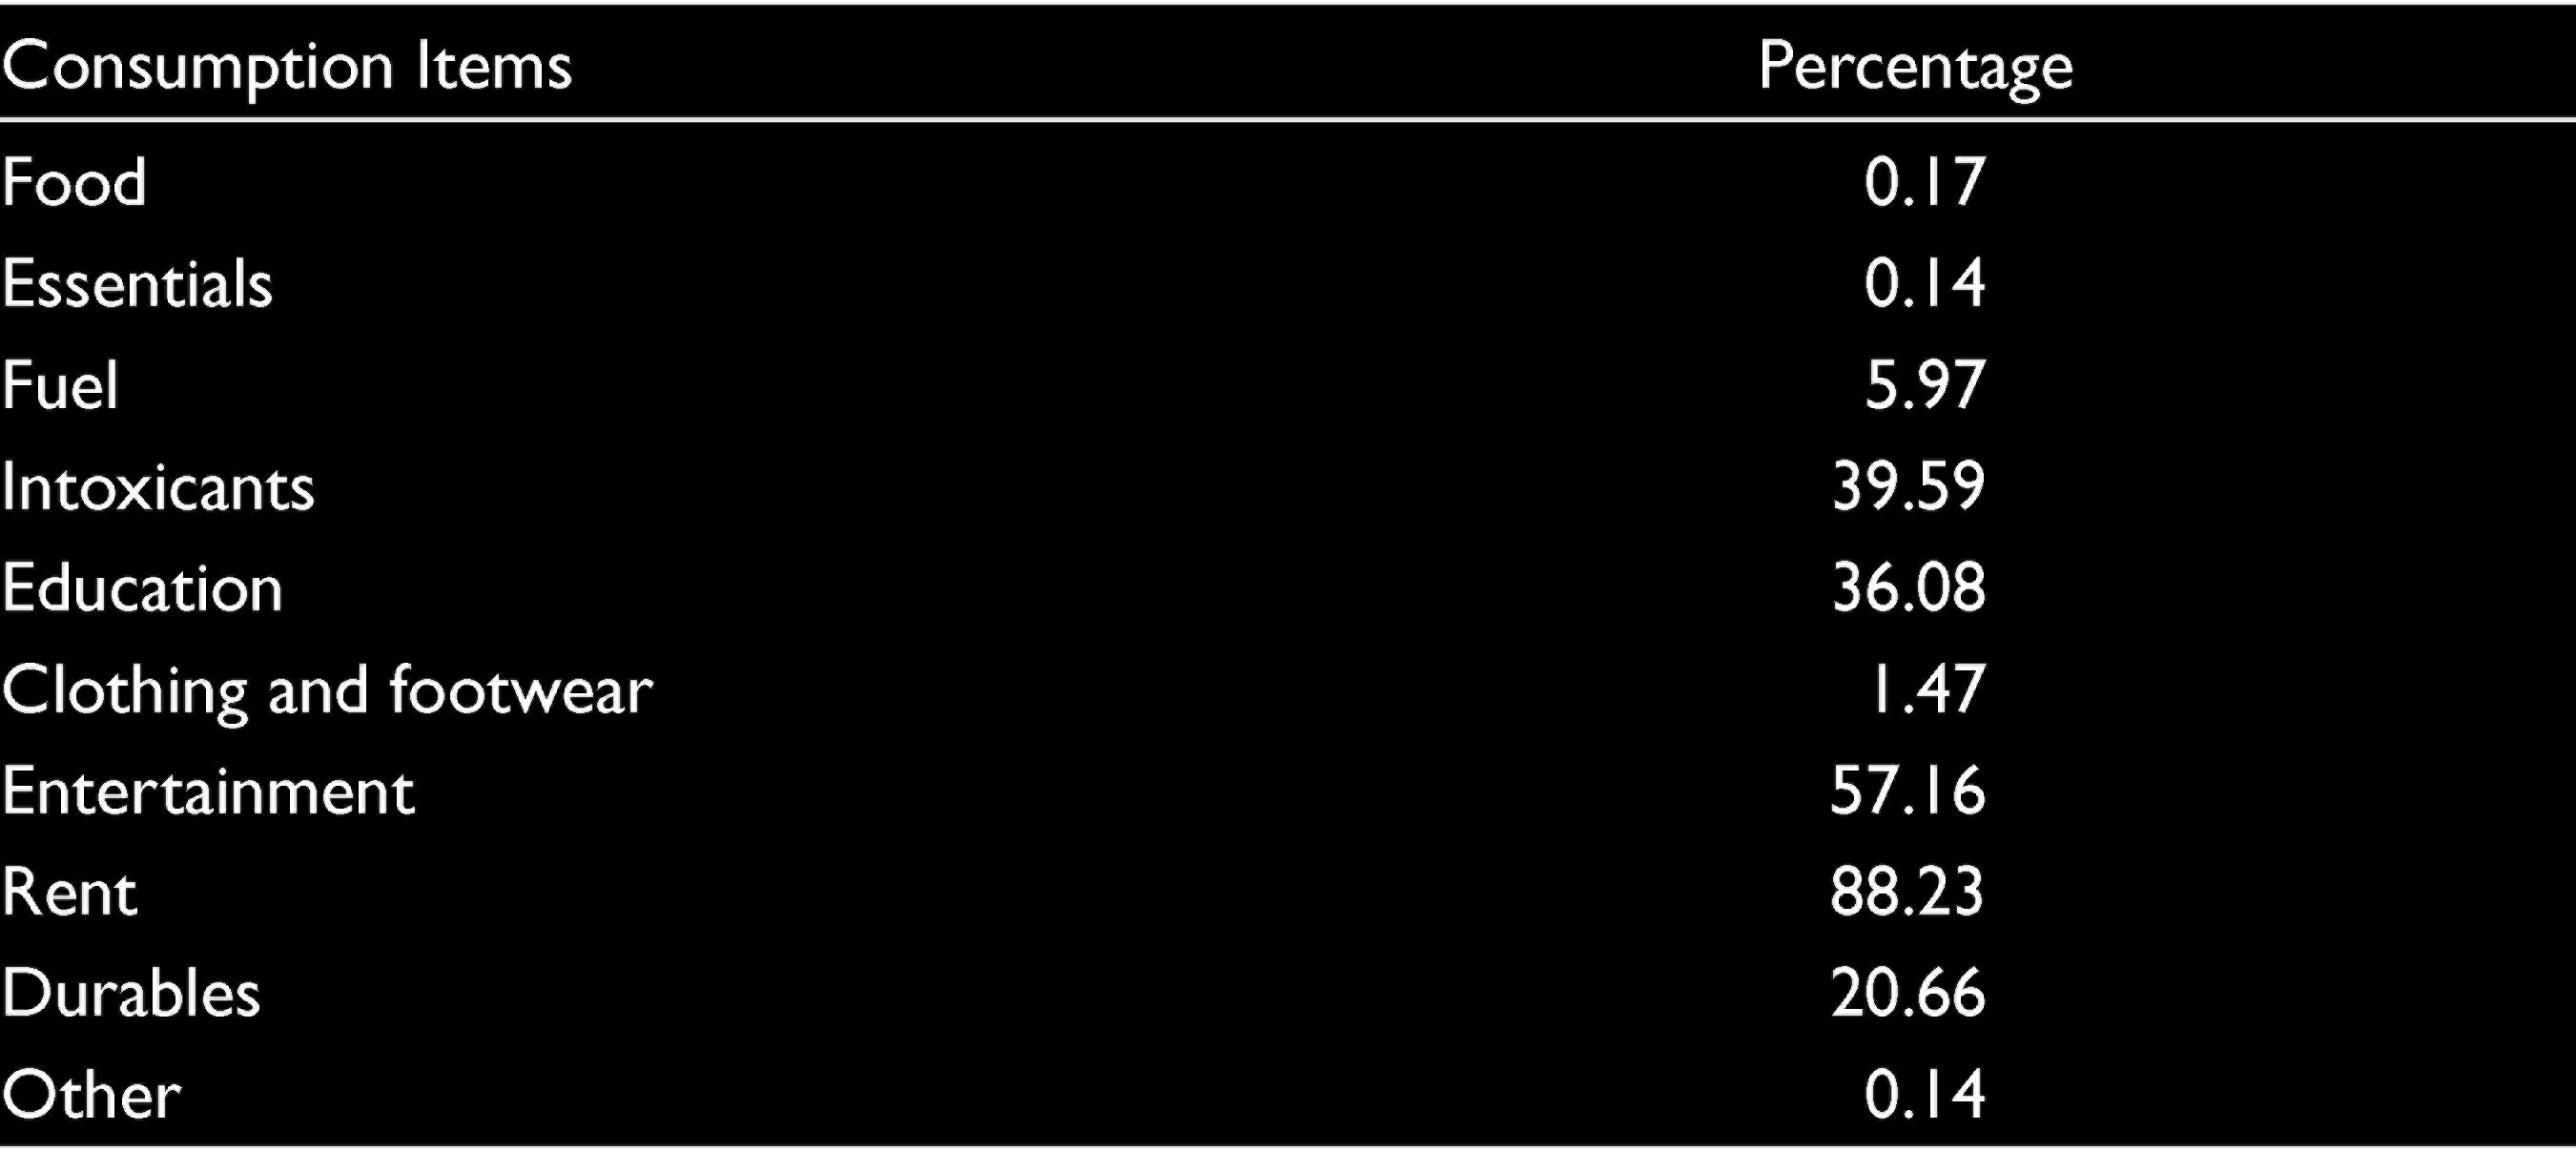
The presence of zero expenditure for the consumption item is assumed to be due to the infrequency in the purchase of items (Table 2).
Percentage of Observations with Zero Expenditure
Methodology
Around 18 per cent of non-food expenditure is covered by out of pocket medical expenses in India (IHDS 2011–2012). Due to significant presence of out of pocket medical expenses in the consumption bundle, there is high probability that it affects household’s consumption bundle and its composition. First, mean comparison test is carried out to find out whether out of pocket medical expenditure cause significance difference in the consumption of households with and without medical expenditure. Since other variables can also influence the consumption pattern of households a multivariate analysis is carried out further.
Methodology by Leive and Xu (2007) is used to find out how out of pocket medical expenditure affects the consumption bundle of households. A system of Engel curves is estimated to explore the impact of OOP medical expenditure on consumption bundle of households. Engel curve in the form of Working-Leser form is used in the analysis.

where
wih = expenditure share of good i in the household h and
xh = total expenditure excluding health of household h.
Engel curve shows the relationship between consumption expenditure of a particular commodity with respect to income or total expenditure of the consumer and prices of the commodity. Since cross sectional data is used all the households face same price, therefore prices are held constant in the analysis. Engel curve is estimated for nine broad categories of goods excluding out of pocket medical expenditure and others. Expenditure shares of 10 non health expenditure items add to one. So equation for category of ‘others’ is not considered in the analysis. The specification of Engel curve used in the analysis is as follows:

where
Sih = expenditure share of good i in the household h,
TEXP h = total expenditure excluding health expenditure of household h,
Xh = socioeconomic and demographic controls of household h and
U = random error term.
All the equations for nine categories are considered at a time for estimation as there could be correlation among the error terms of these equations. In order to consider all equations simultaneously, seemingly unrelated regression equation (SURE) and three stage least square (3SLS) are carried out. There is possibility for total non-health expenditure (TEXP) to be endogenous as it is jointly determined by the expenditure shares or due to measurement error. In order to address the same, instrument variables are used for 3SLS in the analysis. Total income of the household and short-term morbidity health insurance coverage are used as instruments. Instruments passed the test of validity and relevance, which proves that instruments used in the analysis are not weak and are exogenous in nature. If the total non-health expenditure of the household is an endogenous variable, the estimates of 3SLS stands more efficient than the estimates of SURE. Estimate of 3SLS are compared to the estimate of SURE using Hausman test to test the efficiency. It helps to check whether total non-health expenditure (TEXP) is endogenous or not. If the estimates of 3SLS are more efficient than SURE, Hausman test will reject the null hypothesis, thus proving the endogeneity of total non-health expenditure. But the results show Hausman test as insignificant, which means the estimates of SURE are more efficient and total non-health expenditure is not endogenous in nature. Therefore SURE is considered for analysis.
SURE is carried out among below poverty line households apart from all the consumption classes. It is important to understand the consumption modification behaviour among below poverty line households as they struggle to meet their daily expenses. The burden caused by out of pocket medical expenses on consumption bundle can have important implications on the present and future economic status of the household. A comparative analysis is also done for poor households among high and low public health expenditure states to understand the consumption bundle modification against out of pocket medical expenses. States with high public health expenditure are the ones whose share of public health expenditure falls above the national average. The states with shares of public expenditure lower than national average are treated as states with low public health expenditure.
Results
Mean comparison test compares the average share of consumption items among all the quintiles of the population (Table 3). The average share of food among different quintiles shows that it is highest among the lowest quintiles and its share decreases with the higher consumption class. A reverse trend is seen in case of education expenditure with lowest quintile spending a small share compared to higher economic class. The average share of food is higher for households with medical expenses compared to those without medical expenses among all consumption classes. First quintile (Q1), which is the lowest 20 per cent in terms of per capita expenditure shows significant difference in the consumption of essentials, fuel, clothing and footwear, education, durables and rent. Average shares of fuel, clothing and footwear and rent are higher among households without medical expenses. Second (Q2), third (Q3) and fourth (Q4) quintiles also showed a similar result with significant difference and higher share for households without medical expenses for consumption items, such as fuel, clothing and footwear, rent, entertainment and other items. But for fifth quintile (Q5), households without medical expenditure exhibit significant higher share of consumption only for fuel, rent entertainment and others.
Mean Comparison Test for Households with and Without Medical Care Expenses

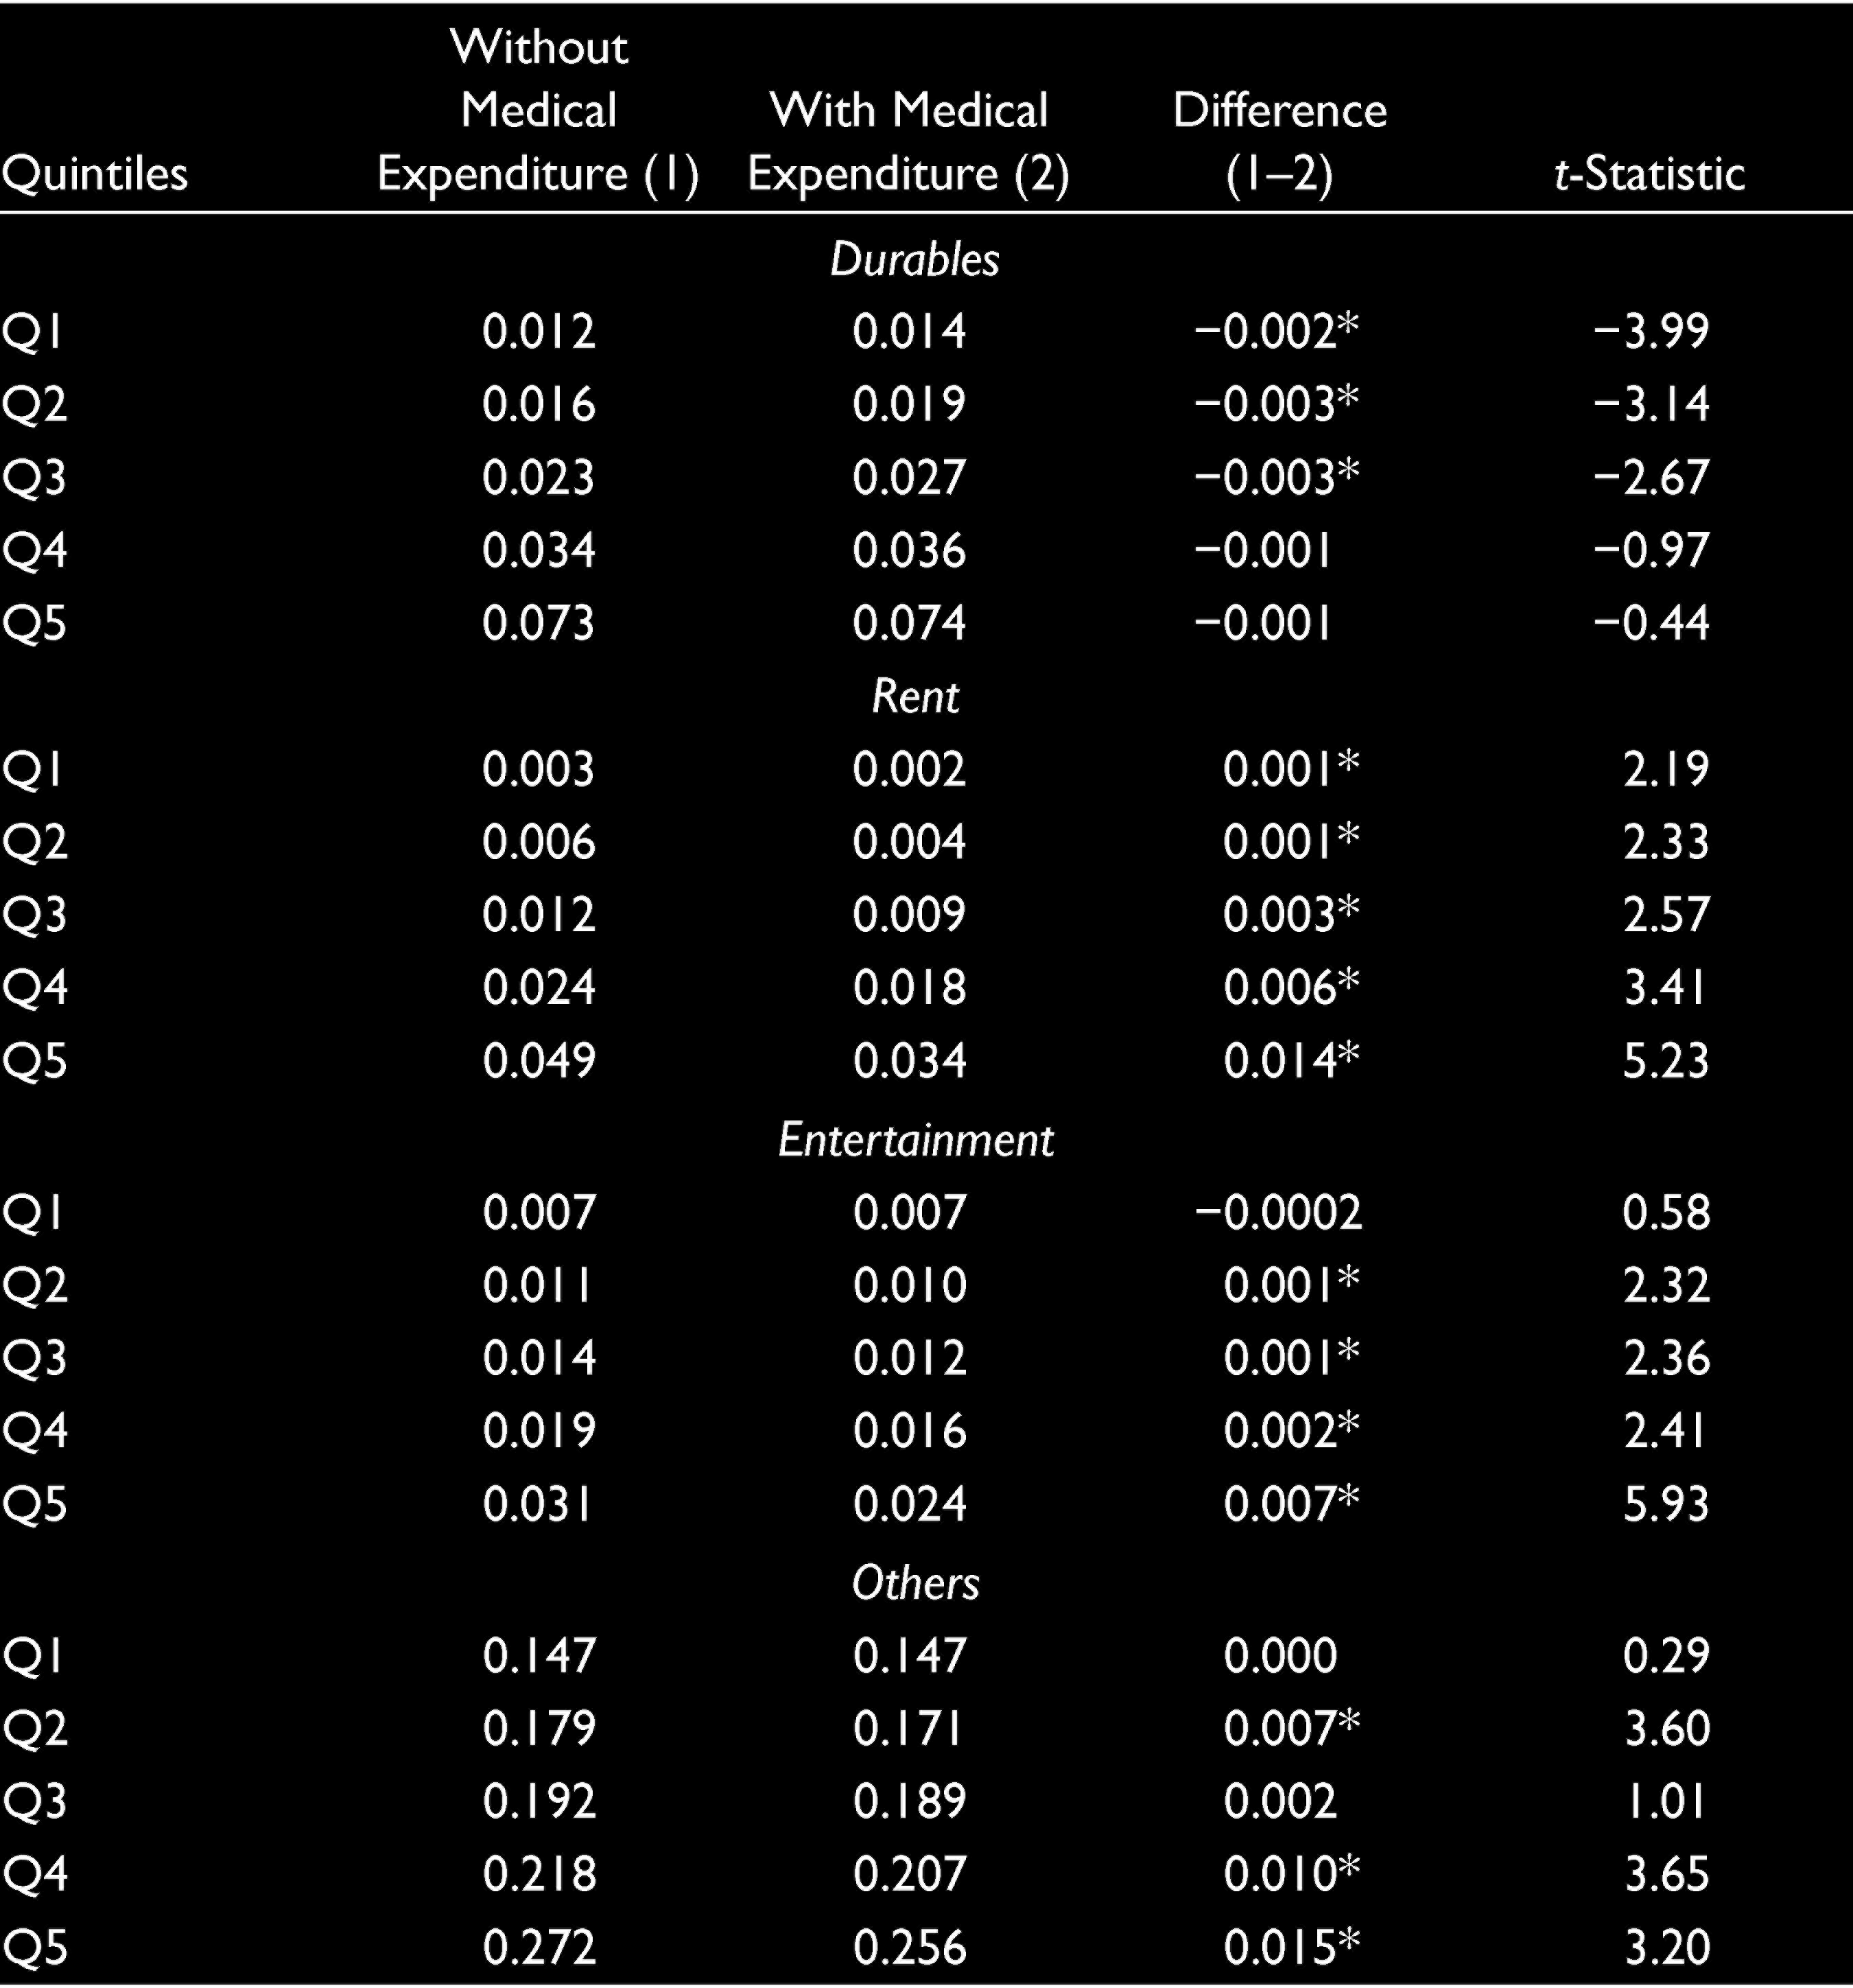
Mean Comparison Test for Households with and Without Medical Care Expenses
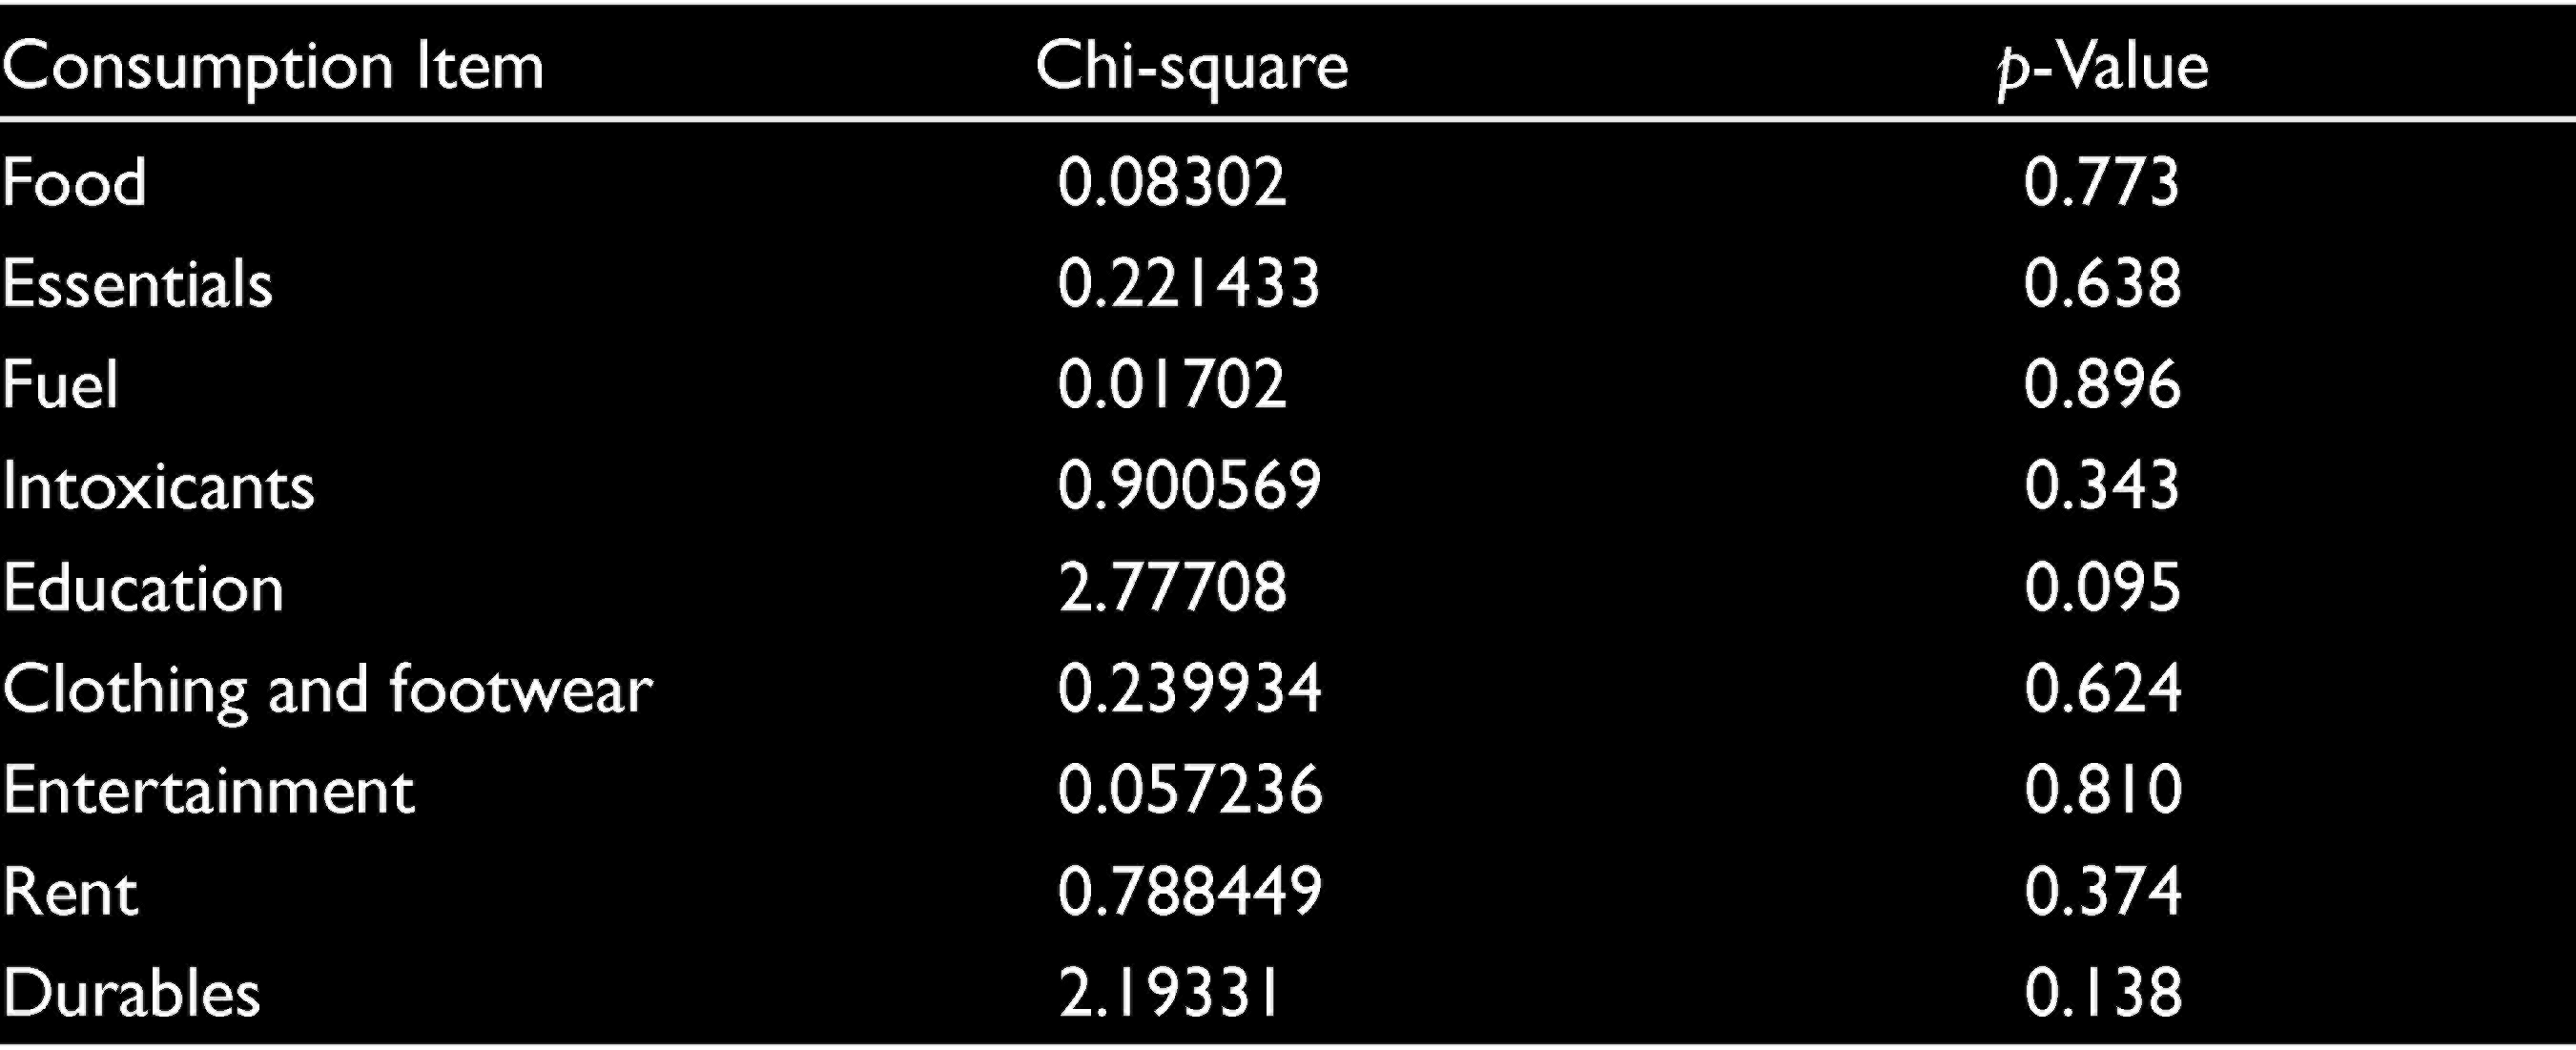
Mean comparison test shows that there is significant difference in the consumption bundle with and without medical expenditure among all the consumption classes. Since these differences could also be caused by other factors, a multivariate analysis is carried out further to understand the impact of medical expenses on consumption bundle of households. For multivariate analysis methods of SURE and 3SLS are used to estimate Engel curves for each category of commodities. Hausman specification test is used to compare the efficiency of estimates of both the methods for testing endogeneity of total non-health expenditure (TEXP). If Hausman test reject the null and accepts the alternative hypothesis that estimates of 3SLS is more efficient, TEXP is endogenous in nature. If it is not, estimates of SURE will be more efficient. The instruments used in 3SLS passed the test of validity (Tables 4 and 5) (over identification) and relevance using Hansen’s J-statistic and F-statistic, respectively. In all the equations p-value of the Hansen’s J-statistic showed insignificant values (above 0.05), thus proving the null hypothesis that instruments used are valid. Value of F-statistic is above 10 (Table 6) and therefore passing the relevance test. The validity and relevance of the instruments prove that instruments used in the analysis are strong, non-correlated with error term and exogenous in nature. Results of Hausman test point (Table 7) that SURE could not be rejected as consistent estimator at 5 per cent level of significance. With p-value higher than significant level, Hausman test could not reject the null hypothesis, and thus proves that total non-health expenditure (TEXP) is not endogenous. Therefore SURE is carried out as the estimation by 3SLS is less efficient than SURE when expenditure is exogeneous.
Over Identification Test Using Hansen’s J-statistic

Over Identification Test Using Hansen’s J-statistic
F-statistics—Relevance Test of Instruments Used

Hausman Test of 3SLS Versus SURE

Results of SURE regression gives significant positive coefficients for food and essentials for different levels of out of pocket expenditure for all the consumption classes (Table 8). Coefficients also show a rise in value with increase in share of out of pocket medical expenses for all types of households. At the same time most of the consumption items other than food and essentials have significant negative coefficients for categorical variables of out of pocket expenditure. This shows that households tend to protect their consumption of food and essentials irrespective of their consumption class. Households compensate the medical expenses by reducing the consumption of other items like fuel, education, clothing and footwear and durables. Consumption of fuel is negatively impacted for the lowest two quintiles while fifth quintile showed a positive impact. It reflects more consumption of fuel with higher out of pocket expenditures. First, second and third quintiles showed a significant negative impact of the consumption of clothing and footwear while fourth and fifth quintiles did not have any significant impact. Results reflect adverse effect on the expenditure on education and entertainment irrespective of the consumption class. Shares of rent do not have any significant impact among lower quintiles while higher quintiles show an adverse impact. Reduction in the consumption share of durables is also observed with higher out of pocket expenditure among all quintiles except the lowest one. Third consumption quintile showed negative coefficients for all the non-food expenditure items.
Coefficients of Out of Pocket Expenditure Variables by Equation

The coefficients of SURE analysis show that poor households also tend to protect their consumption of food expenditure. Most of the non-food expenditures show a significant negative coefficient. This implies that poor households protect their food expenditure by reducing the consumption of non-food expenditure especially items such as fuel, clothing and footwear, education, intoxicants and other. Shares of expenditure on durables also reduced when out of pocket expenses went above 40 per cent of household’s capacity to pay.
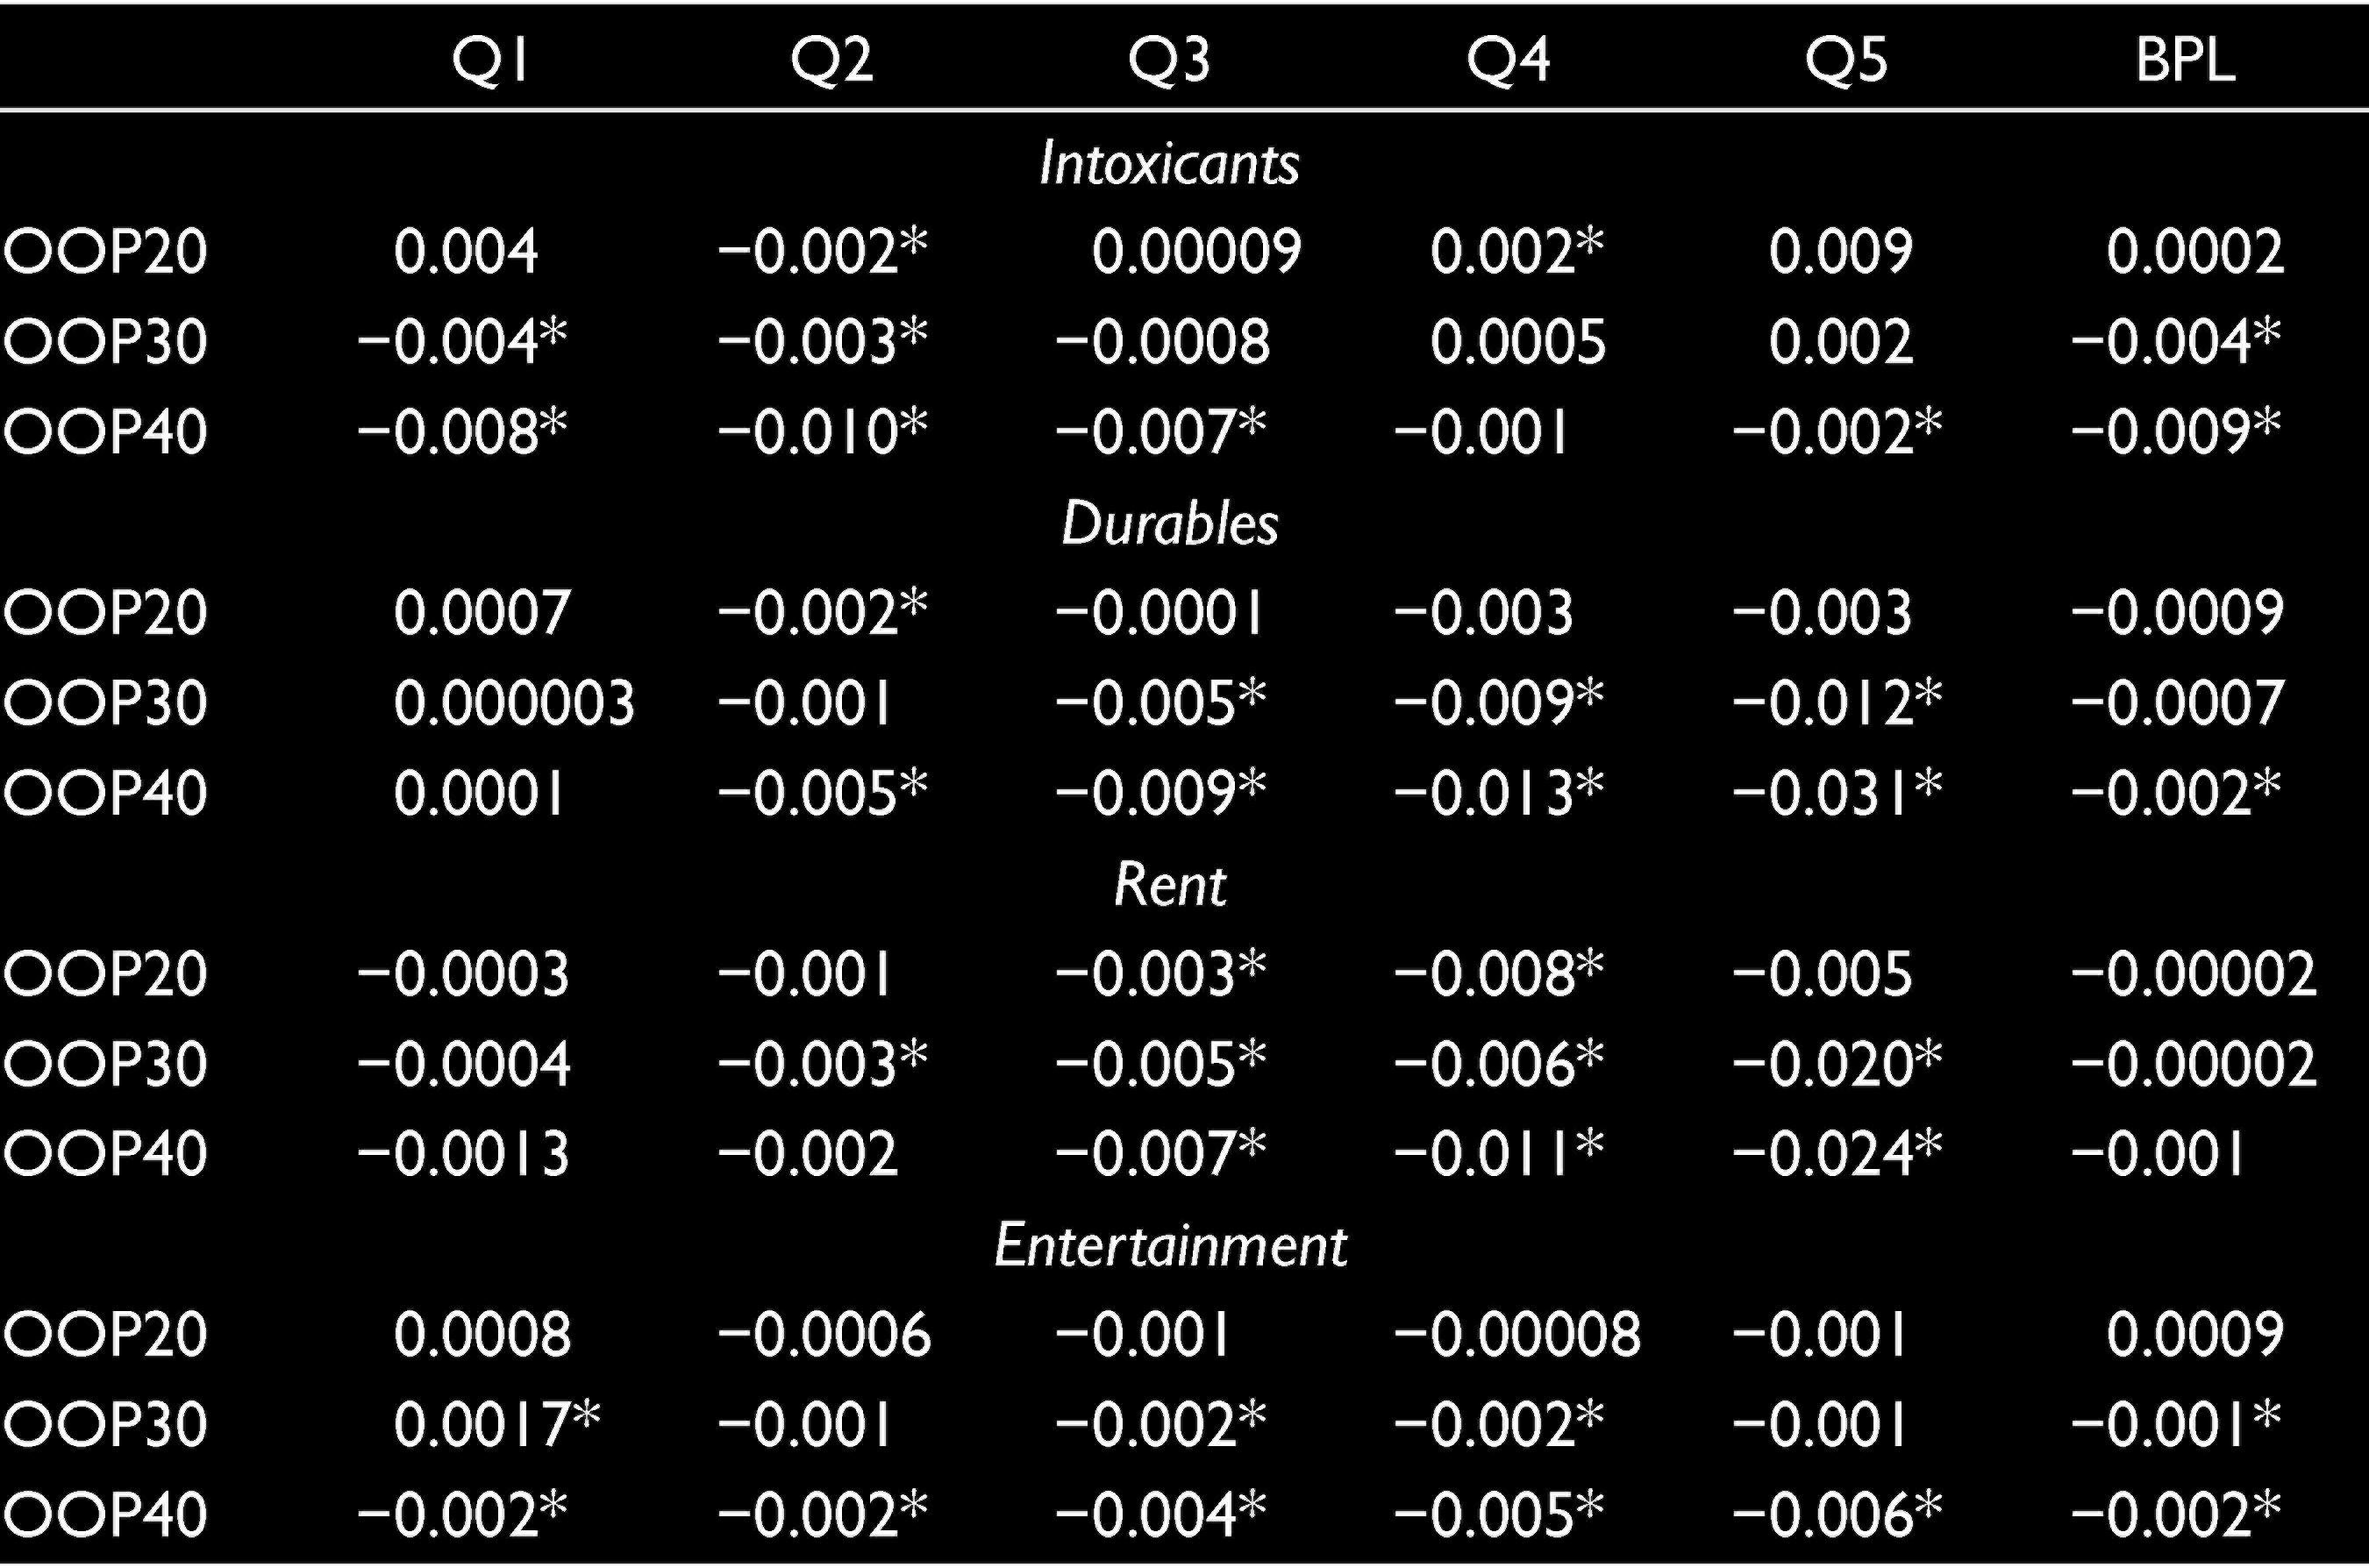
Comparative analysis among the below poverty line households of states with high and low public health spending shows that poor households among low public health spending face significant reduction in all non-food expenditures except intoxicants rent and entertainment (Table 9). When out of pocket expenditure went above 40 per cent of household’s capacity to pay, consumption of durables and intoxicants showed a reduction among poor households of low public health expenditure states. Poor households of states with high public expenditure on health have significant negative impact only on the consumption of education, clothing and footwear and intoxicants. This adverse impact is only affected when the shares of out of pocket expenditure goes above 20 per cent of household’s capacity to pay. Please refer to Tables 10–17 for additional details of SURE analysis.
Coefficients of Out of Pocket Expenditure Variables for States with High and Low Public Health Expenditure

Discussion
The Engel curve analysis is relative share analysis which studies the relative changes in the expenditure of a particular good. The results show that irrespective of economic class and public health expenditure, households tend to protect their consumption of food against medical expenses. First, second and third consumption quintiles face more adverse reduction in non-food expenditure items, such as fuel, clothing and footwear, and education, whereas higher consumption class faced significant reduction in consumption shares of education, entertainment, rent and durables. This reflects the difference in the pattern of consumption modification among poor and non-poor households. According to IHDS 2011–2012, below poverty line households on an average spent around 58 per cent of the consumption bundle for their food. Therefore non-food expenditure which include education, clothing, rent, fuel, etc., have comparatively low share in the bundle. Despite spending highest share of income on food, results of Engel curve analysis reflect the tendency of poor households to protect food expenditure with rise in out of pocket medical expenses. The results of analysis show that with increase in level of out of pocket expenditure the tendency to protect expenses on food also increases. At the same time when share of out of pocket medical expenses goes above 20 per cent of capacity to pay, expenditure on clothing and footwear, fuel, education, intoxicants and entertainment gets negatively affected. With higher share of out of pocket expenditure (above 40%) all the items of non-food expenditure except rent were negatively affected. The relative share of all non-food expenditure were reduced to accommodate the rise in medical expenses. This shows strong coping strategy behaviour in terms of consumption modification of below poverty line households. Since education is also affected in the process of consumption modification, this can result in long-term impacts of the human capital and future living standards of the households.
Difference in the pattern of consumption modification among the states of high and low public expenditure proves the necessity for higher public health expenditure, whereas states with low public health expenditure reduces the consumption of all non-food items to protect their food expenditure. The reduction in education expenses with higher out of pocket expenses among poor households of states with high public spending shows the requirement for more public expenditure for health and education.
Coefficients from Seemingly Unrelated Regression Equation for First Quintile
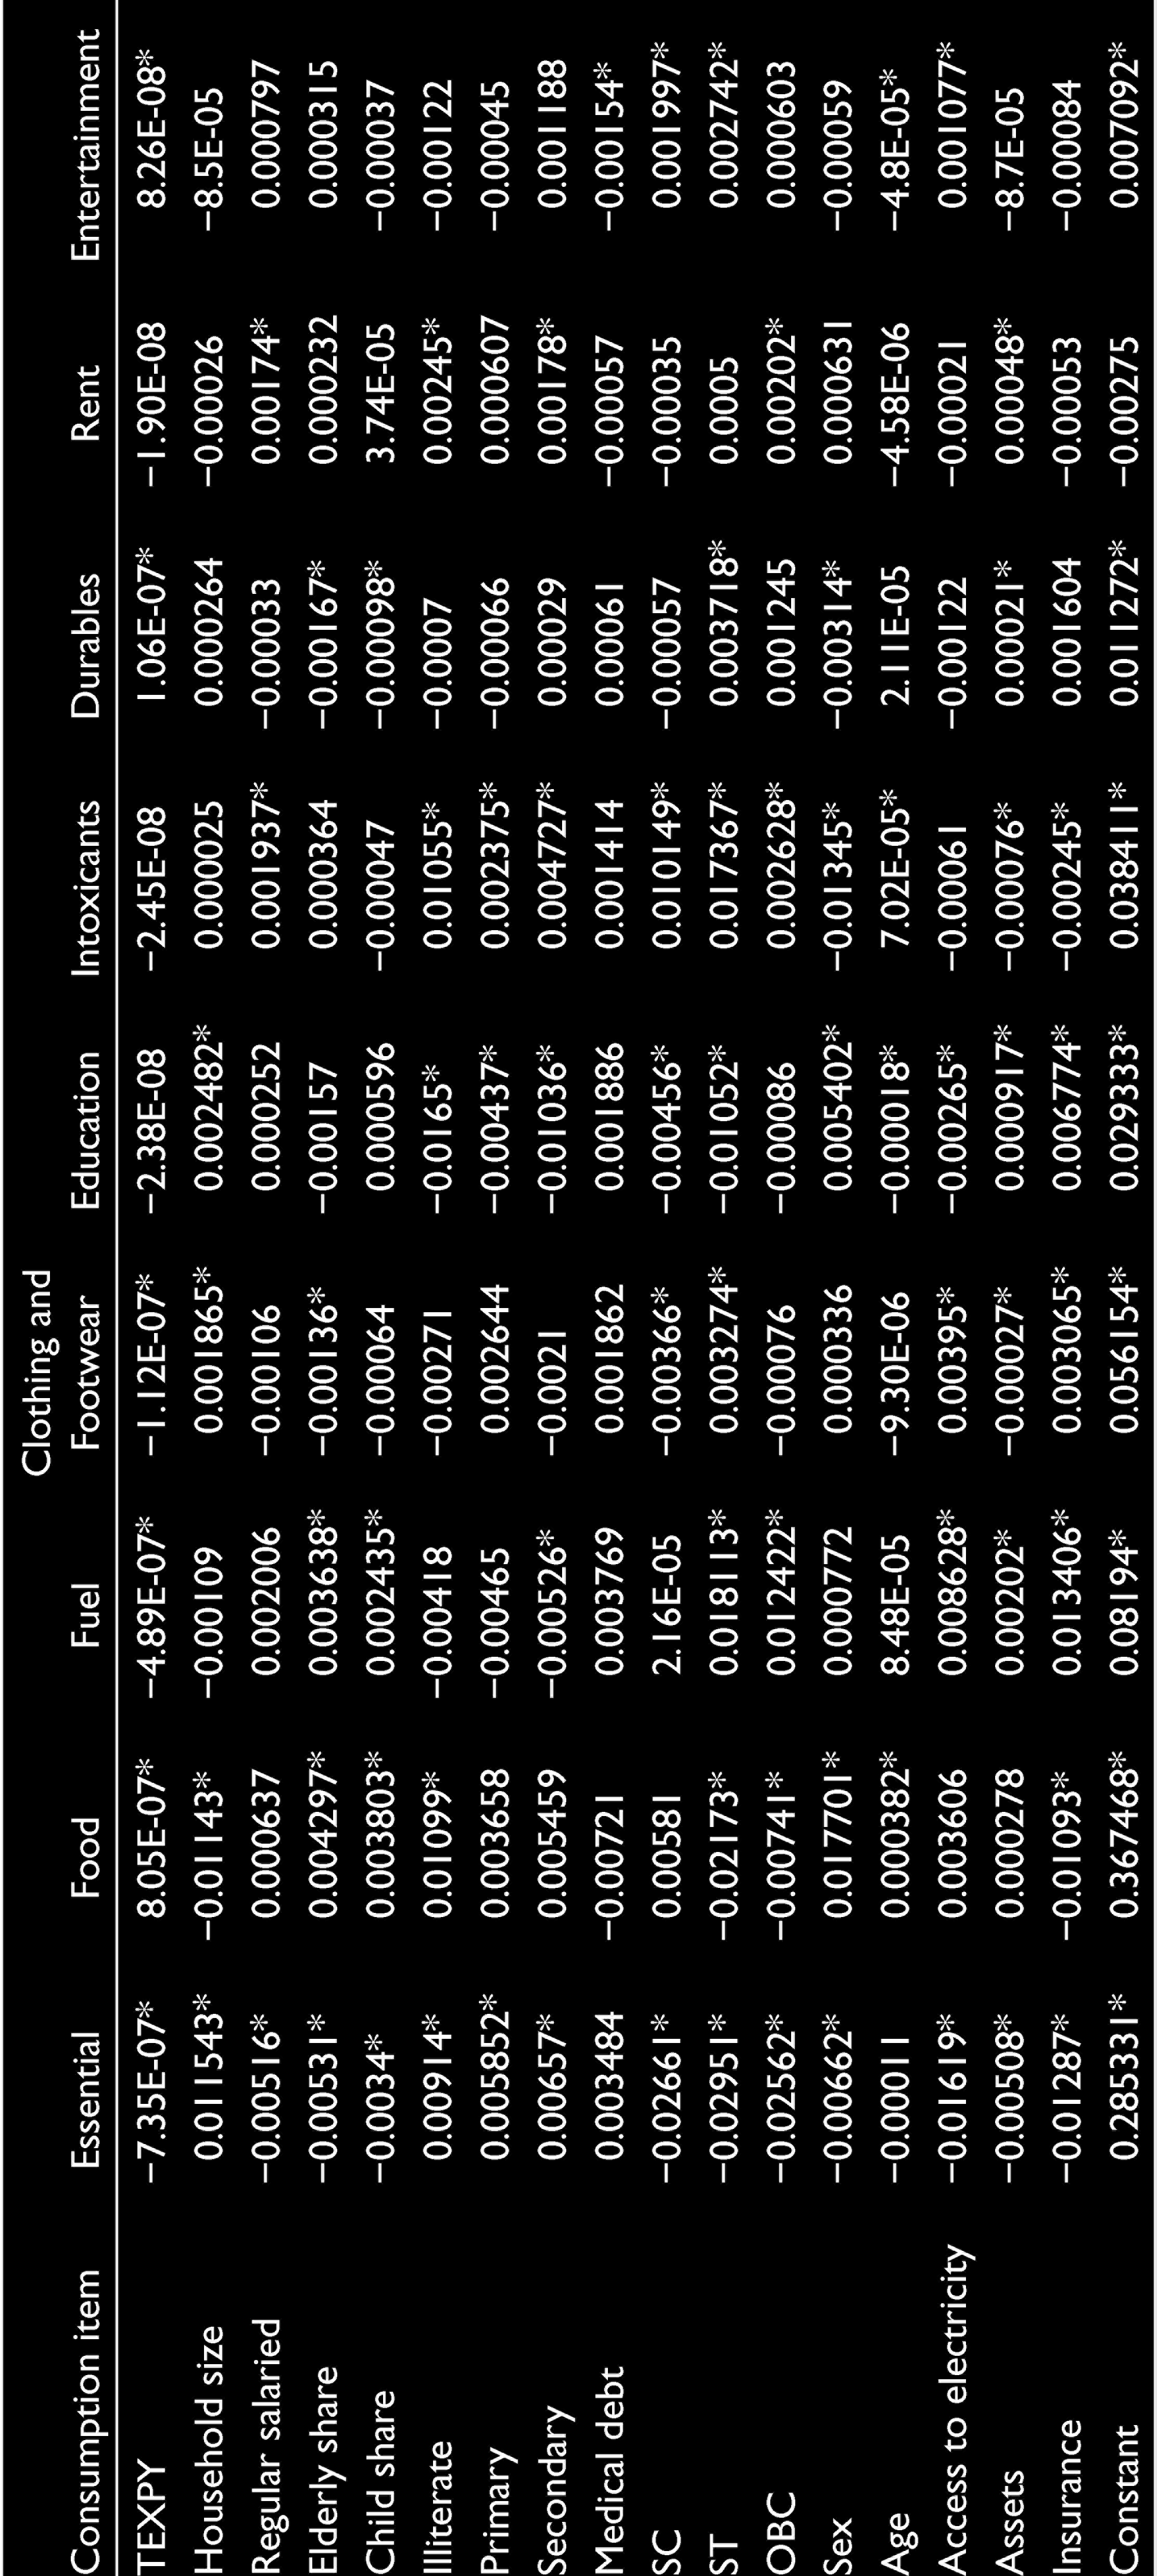
Coefficients from Seemingly Unrelated Regression Equation for Second Quintile
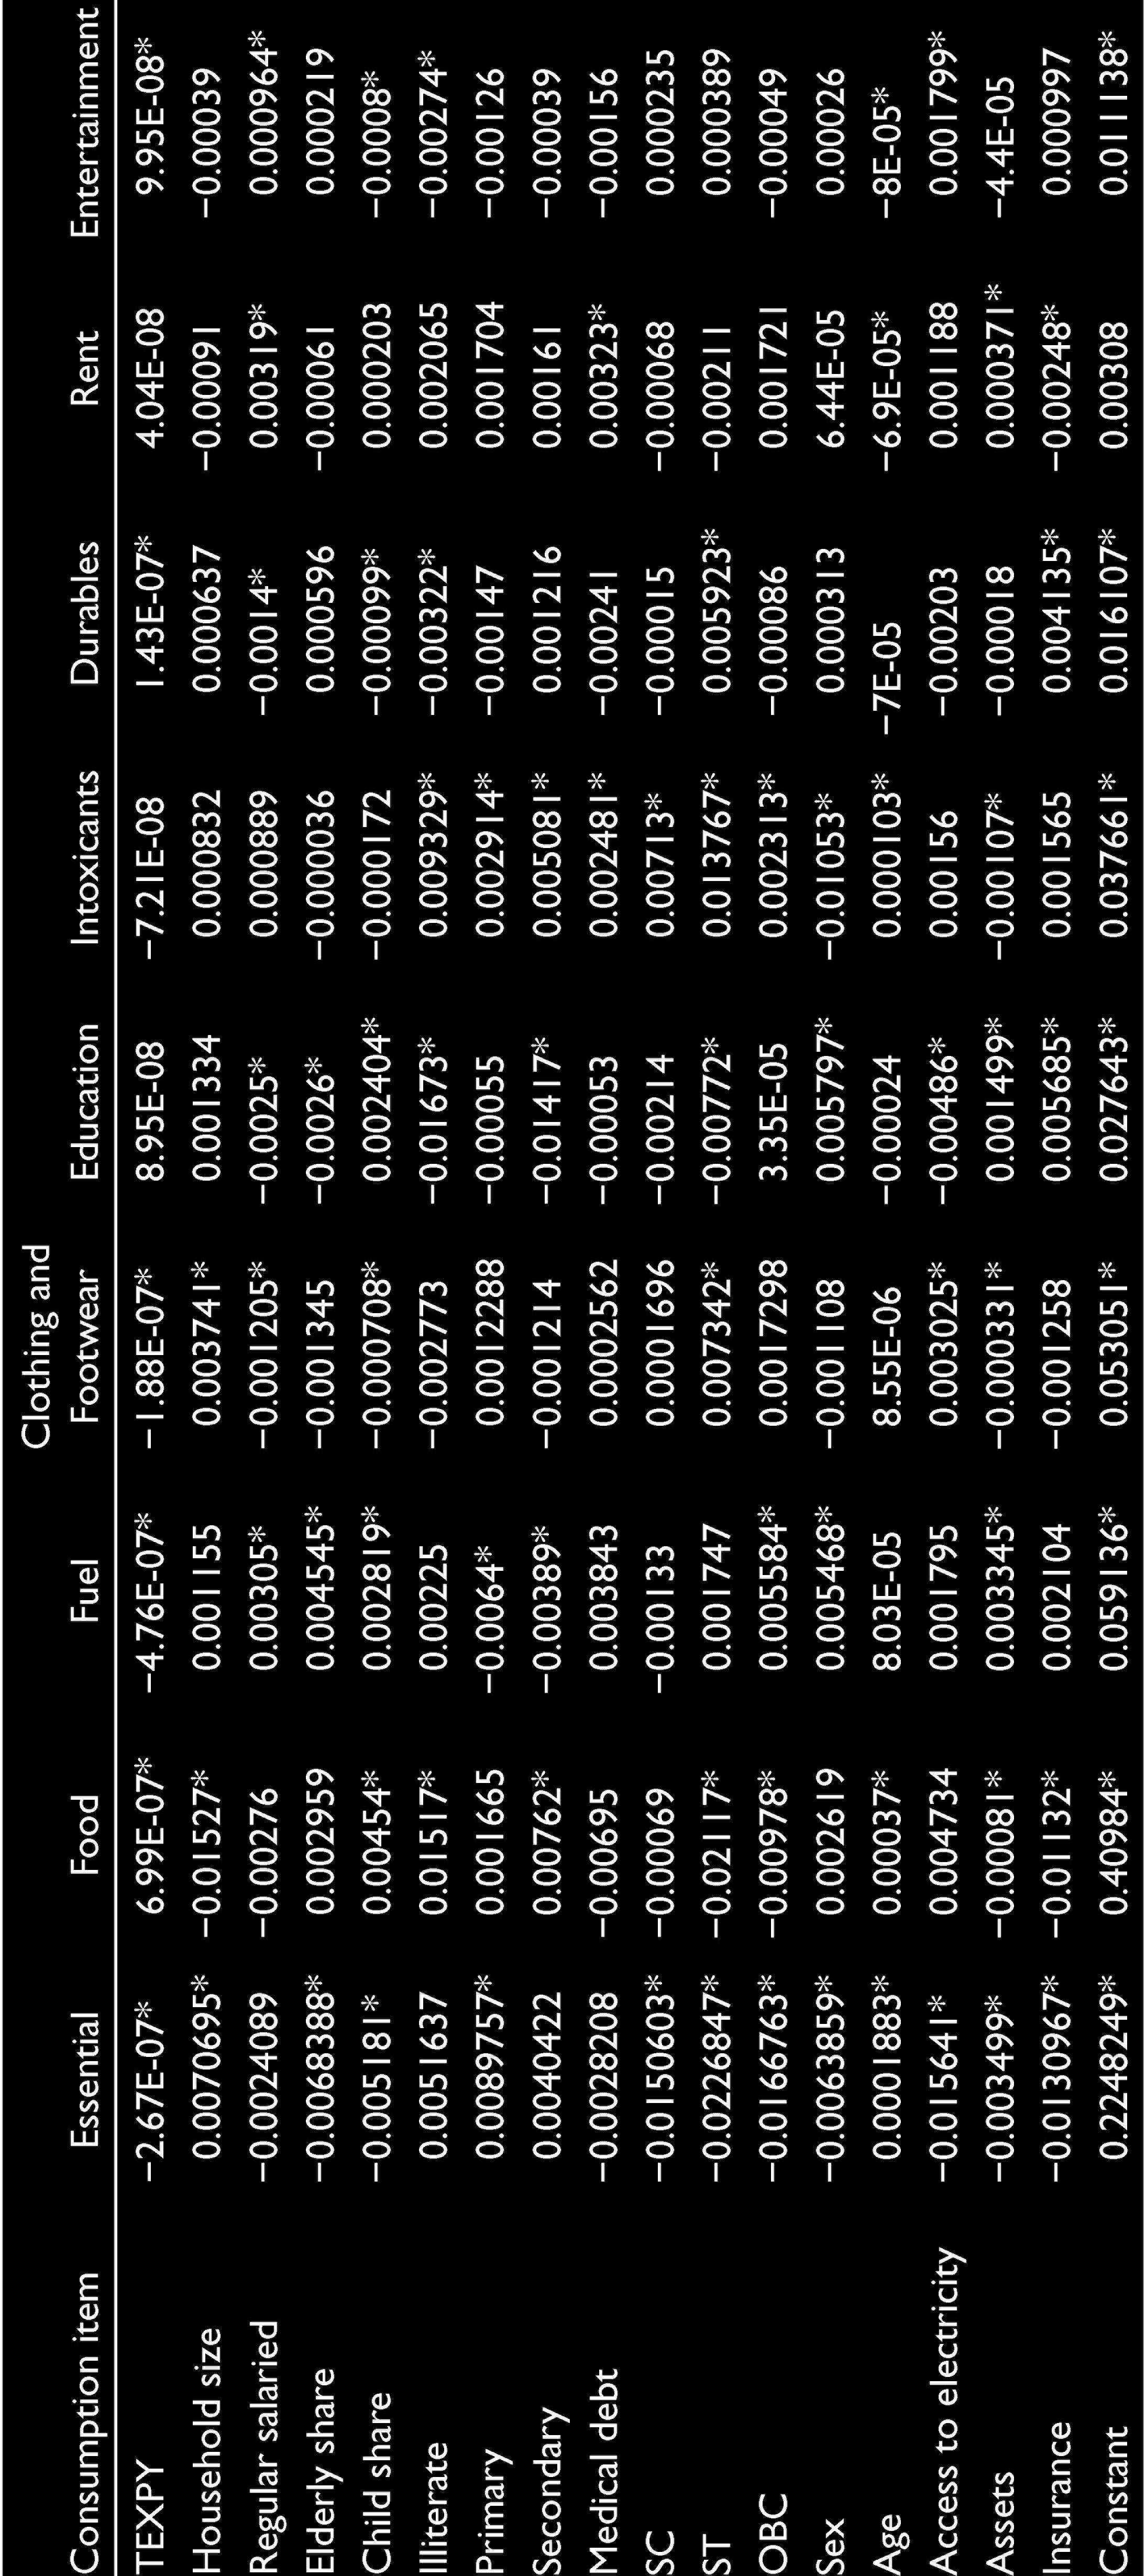
Coefficients from Seemingly Unrelated Regression Equation for Third Quintile

Coefficients from Seemingly Unrelated Regression Equation for Fourth Quintile
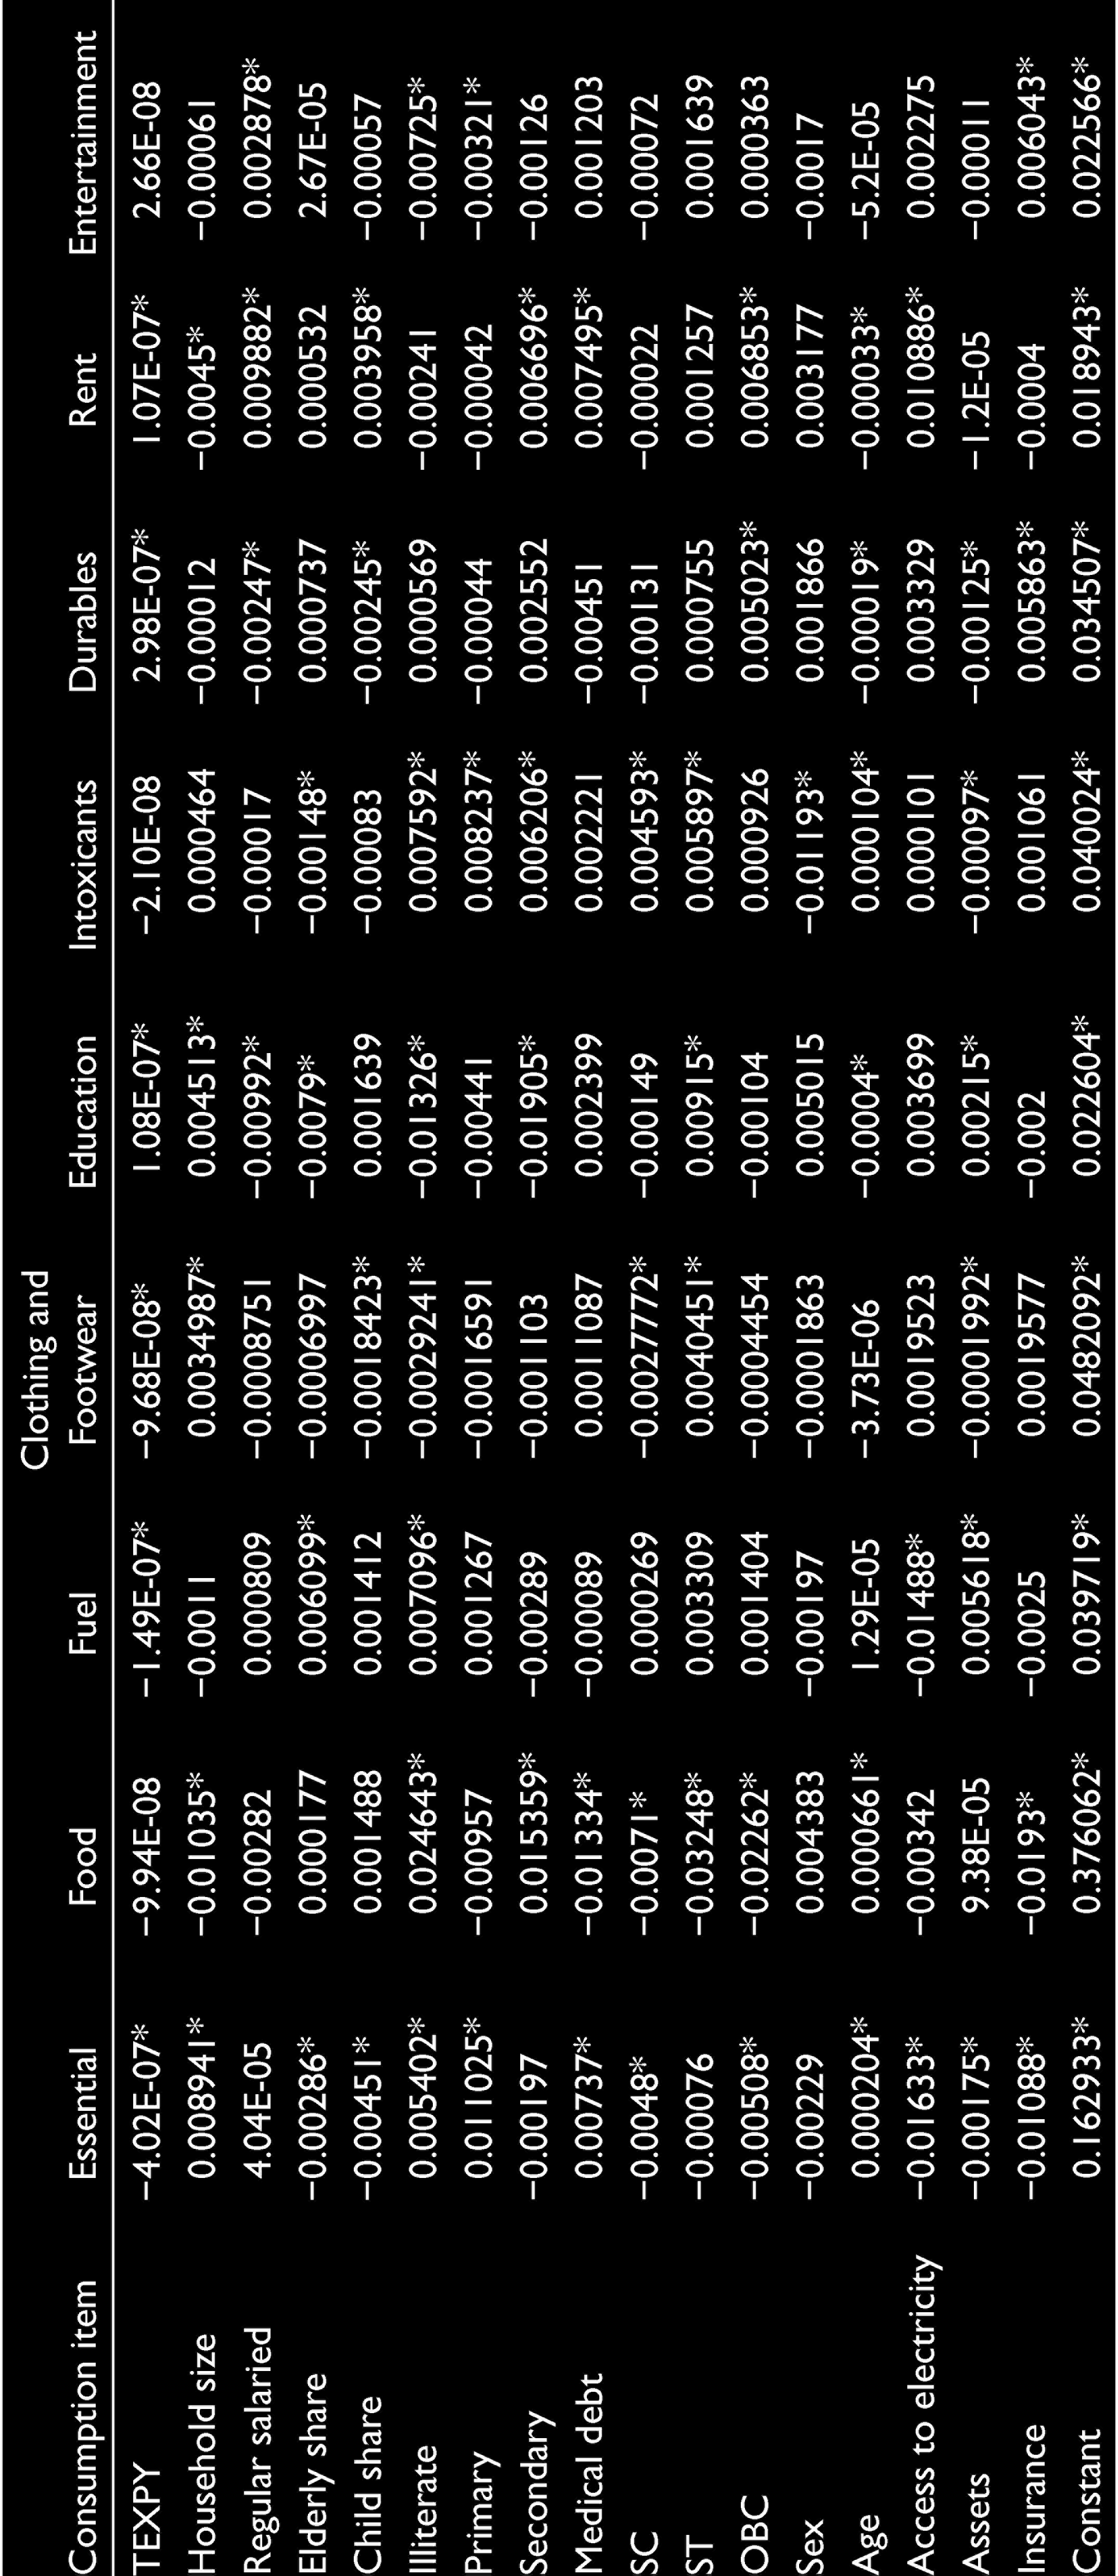
Coefficients from Seemingly Unrelated Regression Equation for Fifth Quintile
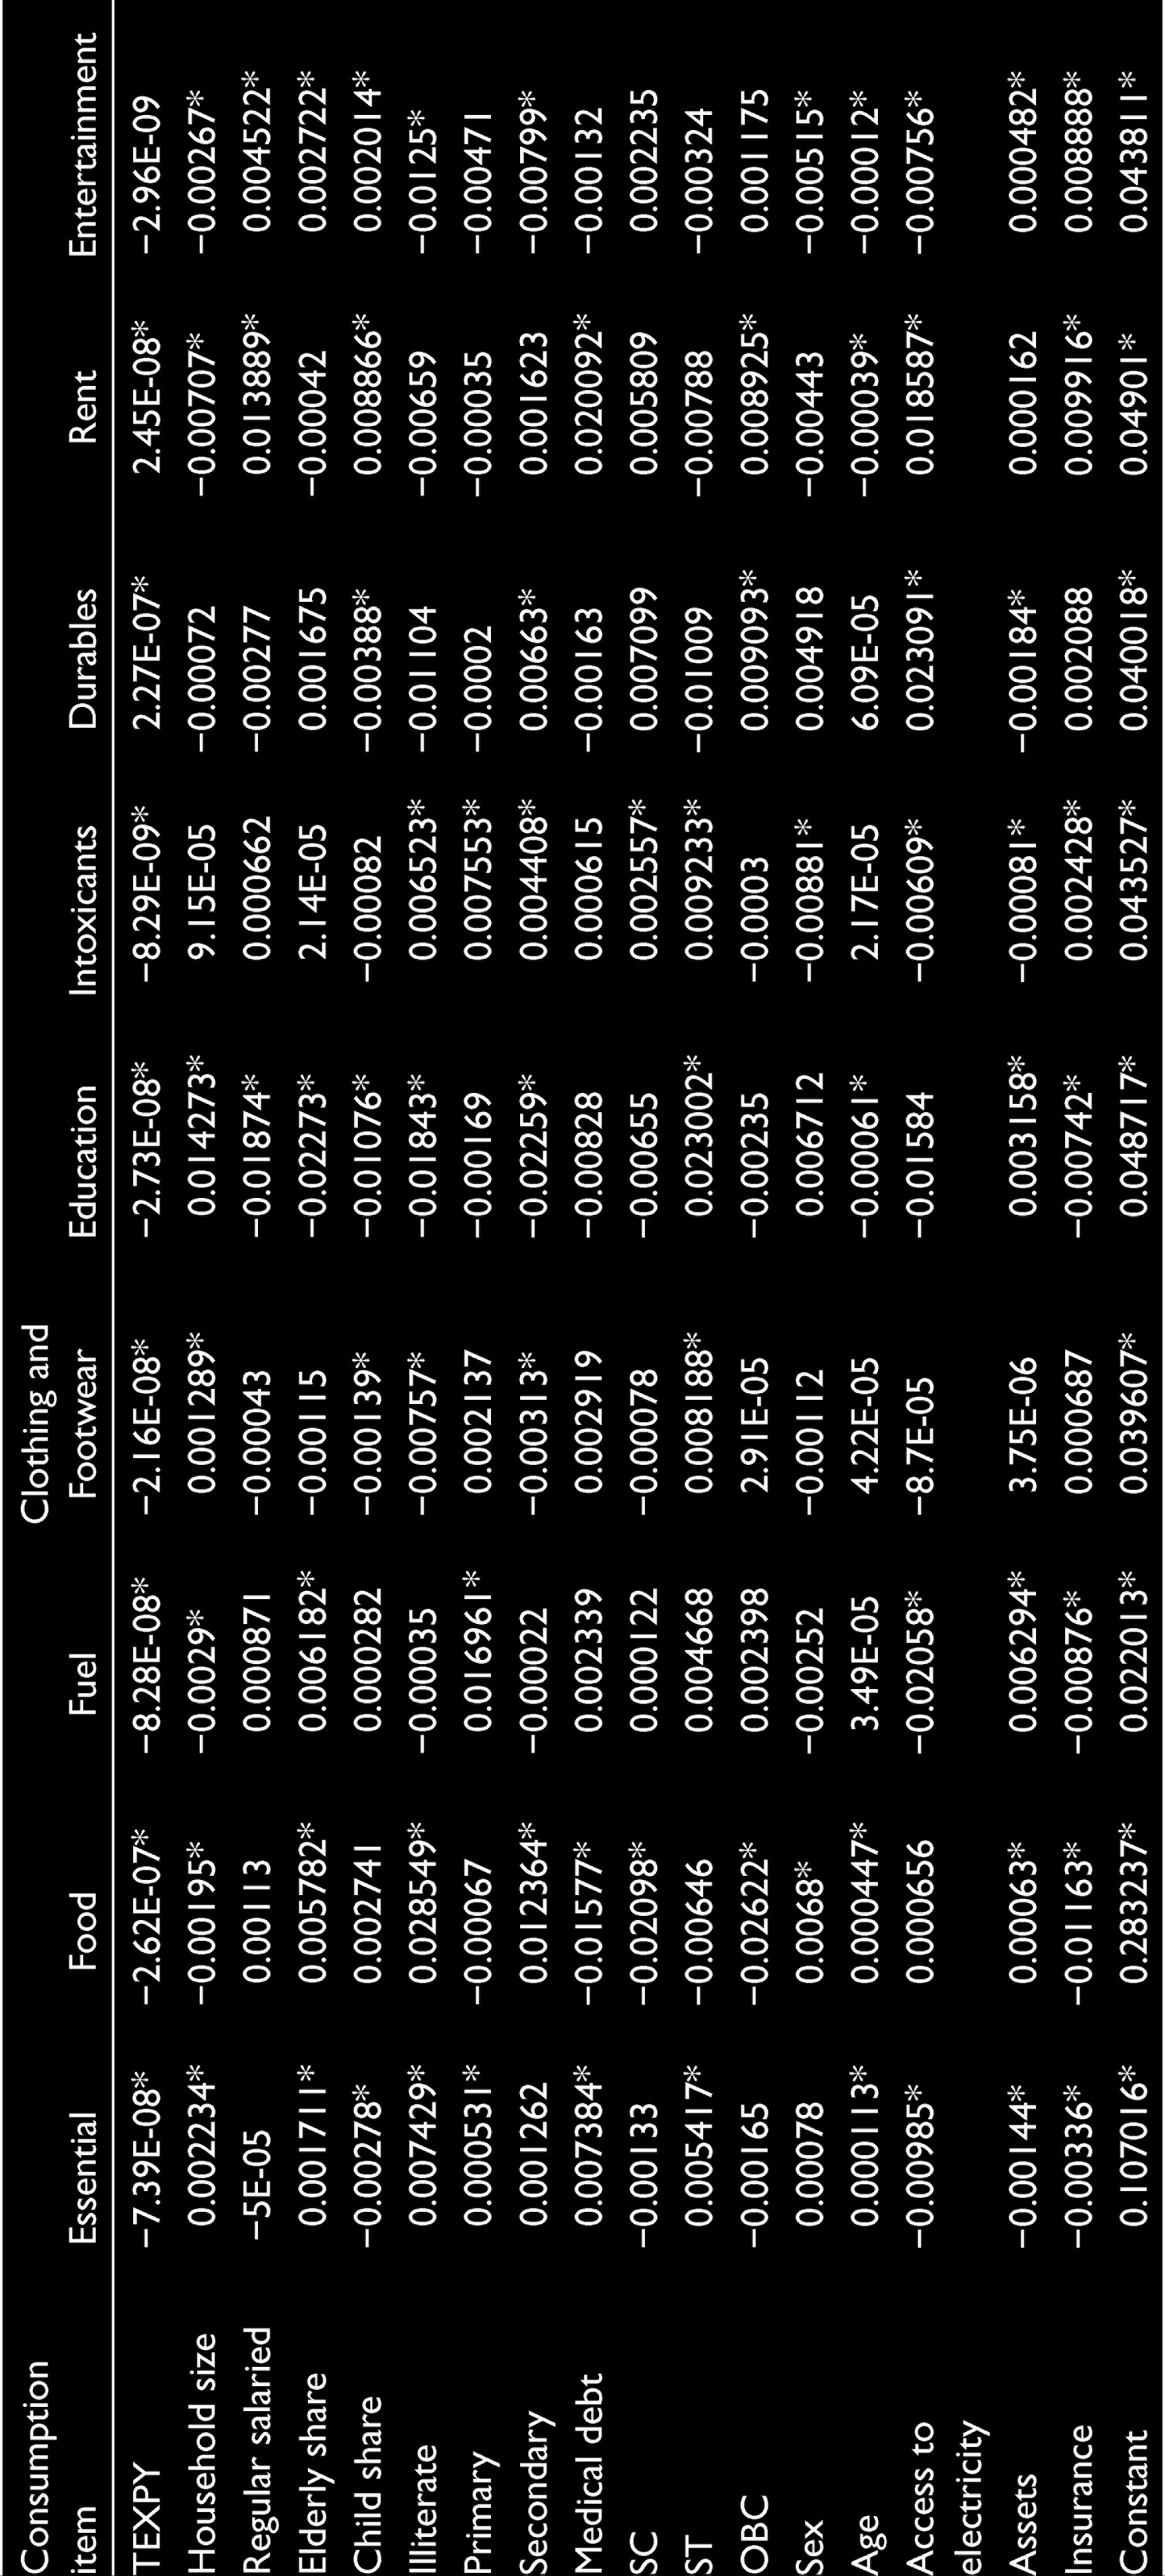
Coefficients from Seemingly Unrelated Regression Equation for Below Poverty Line Households

Coefficients from Seemingly Unrelated Regression Equation for Poor Households with High Public Health Expenditure
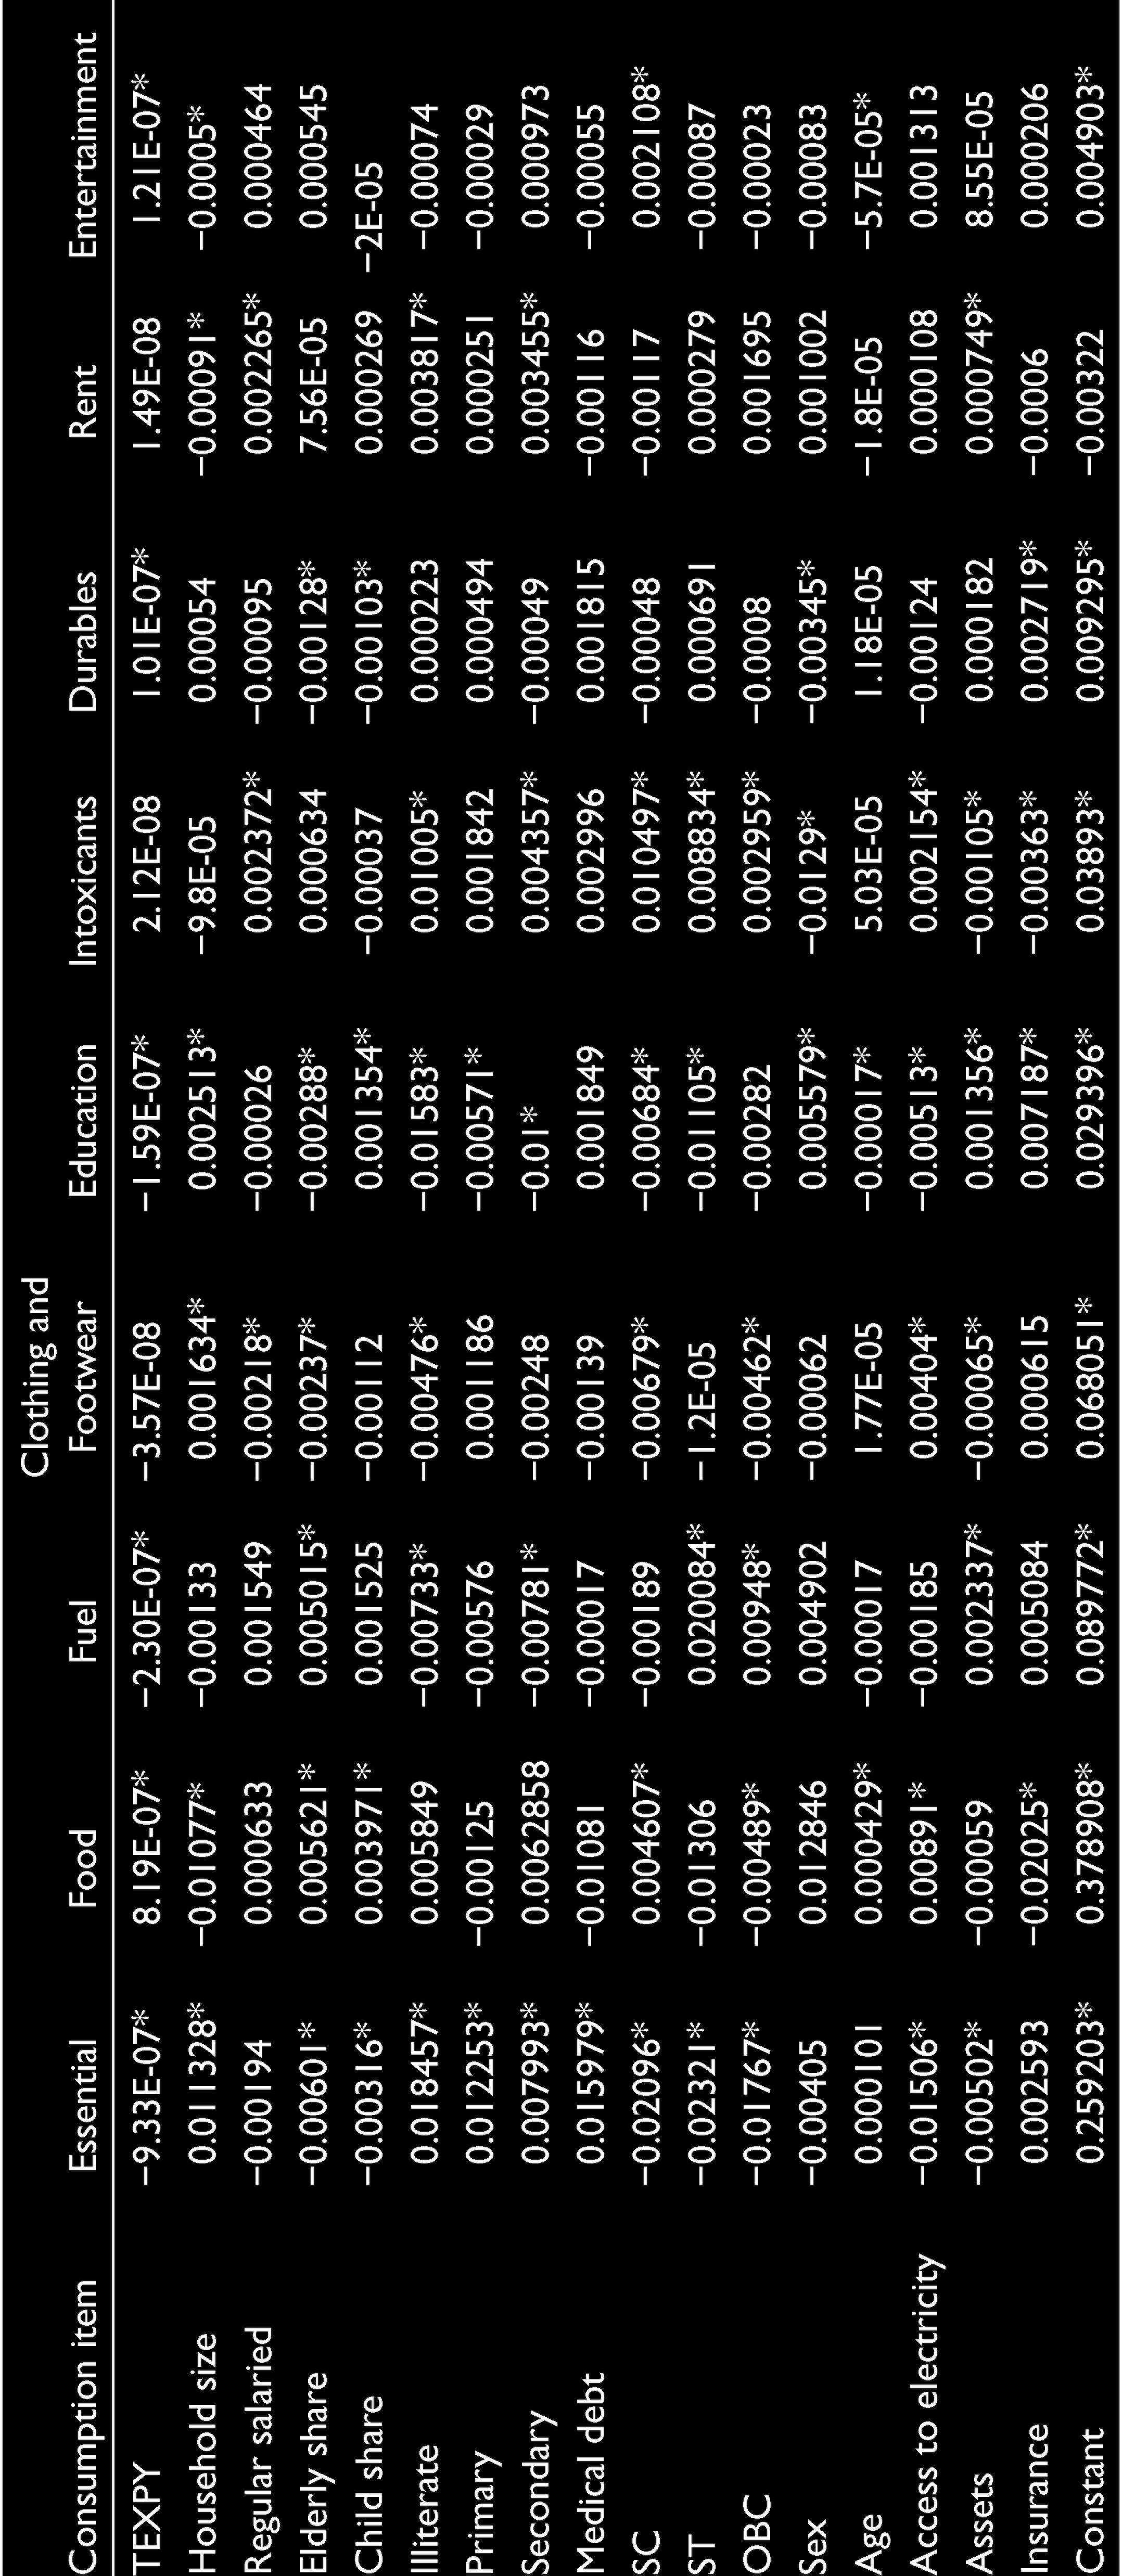
Coefficients from Seemingly Unrelated Regression Equation for Poor Households with Low Public Health Expenditure

Coping strategy by altering consumption also shows the vulnerability of households to the financial shock caused by illness. The lack of proper safety net mechanisms and poor functioning of public health care facilities aggregate their vulnerability. The proper outreach of health insurance programmes like Rashtriya Swasthya Bhima Yojana and proper functioning of public health care facilities can help poor in maintaining the same consumption bundle to a greater extent.
The article tries to understand whether there exists a significant difference in the consumption pattern among households with and without medical expenditure. It also showed that all sections of the households try to protect the consumption of food. It is always non-food expenditure which gets affected due to the out of pocket medical expenses. The analysis gives a comprehensive output on the impact of medical expenditure on the consumption items of a household. The consumption modification varies with different economic profiles. Comparative analysis among high- and low-income states provides evidence for the necessity of public health expenditure. Since education expenditure has adverse impact among all categories due to higher out of pocket expenses, along with higher public spending on health, education should also be given equal importance as it can affect the future economic status of the households. There is also a need to look deep into the impact by studying the absolute changes in consumption pattern to give appropriate policy suggestions.
Footnotes
Acknowledgements
The author is grateful to ICSSR for providing Doctoral Fellowship to pursue PhD. The author thanks the anonymous referees for their valuable comments. The author also thanks research supervisor Dr N Rajagopal for valuable suggestions.
Declaration of Conflicting Interests
The author declared no potential conflict of interest with respect to the research, authorship and/or publication of this article.
Funding
The author received no financial support for the research, authorship and/or publication of this article.