




Abstract
There are limited studies on household expenditure on higher education in India, and understanding the factors determining household investment in engineering education is almost absent. However, with the increasing presence of private sector, it is important to examine the changing pattern and determinants of household expenditure on higher education, which would help to formulate evidence-based policies in India. In this context, this article analyses the variability of household expenditure on engineering education and its relationship with socio-economic and institutional factors, using the data collected through a student survey in Odisha, an eastern state of India. We find that, on average, a household spends around 30 per cent of its annual income per child for an engineering degree. The study confirms the presence of a pro-male bias in household expenditure on engineering education, and interestingly, an additional preference is observed among poor households. Robust ordinary least squares (OLS) results show that students enrolled in private engineering colleges have spent significantly more than those enrolled in public-funded institutions. Contrary to the established literature, students belonging to lower socio-economic groups are shown to have spent more on non-fee items than forward social groups, though they have spent relatively less on fees.
Introduction
Public provisioning of higher education is at a crossroads in India. Its progress has even become a central feature of global competitiveness, particularly with the current focus on innovation, skills and knowledge. Higher education helps in promoting economic growth, improving income distribution and reducing social and economic inequalities, and it is regarded as the primary engine of upward mobility (Tilak, 2018). In the early 1960s, public funding and philanthropic contributions for higher education formed the major part of the resource to this sector in India, and contributions from private sources to cover tuition fees and other payments made by students were negligible. With the implementation of the New Economic Policy of 1991, broadly known as the Structural Adjustment Programme (SAP), the trend shifted towards private funding of higher education (Chakrabarti & Joglekar, 2006; Chattopadhyay, 2007; Indira, 2006; Mathew, 1996; Panchamukhi, 1990; Prakash, 2007; Rani, 2004; Varghese, 2013). For instance, in 1977–1978, the cost recovery rate for higher education through student fees was as low as 1.7 per cent (Rao & Mundle, 1992), which reached 12.6 per cent in the 1990s (Tilak, 1997). This is in line with the recommendations of the World Bank and some development experts for the supplementation of public higher education revenues by non-governmental sources, primarily from the users, that is, students (Johnstone, 1991, 1993; Johnstone et al., 1998; Woodhall, 1992; World Bank, 1994; Ziderman & Albrecht, 1995). Cost-sharing and income-generating activities were considered as important solutions for increasingly underfunded and overcrowded universities in developing countries, and more so in India (Johnstone, 2003; Varghese, 2013).
In the last three decades (since 1990), the Indian higher education system has seen a massive expansion of the private sector. Currently, around two-thirds of the students in India are accessing private universities and colleges, which has led to an increase in family investment in higher education, and more so for students accessing costly professional disciplines, such as engineering, medicine, law, pharmacy, etc. Which are the households that invest significantly for the higher education of their offspring? How much do they spend? What are the factors that influence family investment in higher education? Is there a pattern to it? These critical questions need urgent attention in the spectrum of higher education policy and planning in India. However, there has hardly been any recent attempt to examine the pattern and determinants of household spending on higher education in India, except for the work by Chandrasekhar et al. (2019).
Furthermore, along with its rapid expansion, higher education in India (with 37.4 million students enrolled in more than 900 universities and 40,000 colleges) has experienced an unprecedented boom in the market-driven courses, particularly in the field of engineering and medicine. Higher education institutions in these disciplines, which have mostly come up in the private sector, have emphasized recovering the costs from students and households. Families demanding engineering education for their children need to spend a significant share of their income. The expansion of private sector and the emergence of a new educational economy, particularly in higher and technical education, has resulted in widening the inequalities in educational opportunities. In a socio-culturally diverse country like India, the impact of such inequalities is clearly visible in the emerging educational economy. Often, households’ paying capacity determines the quality of higher and technical education accessed by their children. However, unfortunately, very few studies explore the pattern of household expenditure on engineering education (a costly discipline in higher education) in India and its determinants. It is difficult to ignore the role that households currently play in demanding engineering education in India, specifically in the context of shrinking public funding and philanthropic contributions for professional higher education. Therefore, this article contributes to the literature by examining the heterogeneity in household expenditure on engineering education using data collected from a recent survey in Odisha (an eastern state of India), which has been experiencing greater private sector intervention in recent years.
Using data collected from 588 fourth-year students pursuing a degree-level engineering course (Bachelor of Technology) in 10 institutions (eight private and two government colleges), this article examines the variations in household investment on engineering education and how the socio-economic and institutional factors matter differently in determining it. Interestingly, this study analyses the pattern of household spending separately for fees (tuition fee, exam fee, library fee and other fees) and non-fee items (expenditure on food, accommodation, textbooks, transportation, private tuition, mobile charges, Internet access, etc.) to get a better picture. Using the household expenditure function as the main analytical tool, the study estimates separate regression equations for total household expenditure on engineering education (taking fees and non-fee items together) and for household spending on non-fee items only. Further, these two regression equations are estimated by gender (male and female, separately) and income quintiles (poor and rich households) with the objective to understand the variations in the impact of different factors on household expenditure on engineering education in India. No doubt, understanding these specific results from the study would help the government and other stakeholders involved in the education sector in formulating better policies, particularly in the context of the declining public budget for education and the consideration of households’ contribution as an effective substitute for this.
The rest of the article is structured as follows. Section II discusses the problem by providing an overview of the existing literature both in the Indian and international context. Section III describes the data and analytical framework used for the analysis. Section IV presents the results, and Section V concludes with a few policy implications.
Review of Past Studies
Examination of the pattern and determinants of household expenditure on education has received rather less attention in the literature compared to educational attainment. For India, the situation is even bleaker, with only a handful of studies available on household spending on education. Further, these studies are largely in the domain of school education. (Datta & Kingdon, 2019; Kingdon, 2005; Kothari, 1966; Panchamukhi, 1965; Tilak, 2002). There are relatively fewer studies that have examined potential factors that determine the amount of money spent by households on the higher education of their children. We have not come across any study that has examined the pattern and determinants of household expenditure on engineering education in India, though some have focused on the trends and changing patterns of public financing of technical education. 1 More importantly, there is also less evidence of how factors matter differently in household spending on government and private engineering institutions. That said, in this section, we make a modest attempt to discuss the existing studies on household expenditure on education in the Indian and international context. The limited studies available in India have observed that household expenditure on higher education is sizeable and has been increasing over the years (Chakrabarti & Joglekar, 2006; Chandrasekhar et al., 2019; Kambhampati, 2008; Tilak, 2002). However, it is noticed that the level of household investment in education may vary depending on a complex set of factors comprising socio-economic background and other household indicators, apart from many other supply-side factors like choice of institution and course. Some of the major factors that decide the level of household investment in higher education and are often cited in the literature include gender, family income, family size, parental education, household location and institutional factors (Azam & Kingdon, 2013; Duraisamy & Duraisamy, 2016; Kumar, 2017; Panchamukhi, 1990; Tilak, 2002). The remaining portion of this section discusses these in detail.
The issue of gender bias in household expenditure on education has been a topic of much research, particularly in the context of developing countries. Many studies (Azam & Kingdon, 2013; Datta & Kingdon, 2019; Iddrisu et al., 2018; Kaul, 2018; Kenayathulla, 2016; Kingdon, 2005; Kumar, 2017; Saha, 2013; Tilak, 2002; Wongmonta & Glewwe, 2016) have observed gender to be one of the most critical factors that determine household education expenditure and have established it, in the context of both India and other developing countries. Discrimination against girls in household expenditure on child schooling is broadly highlighted in these studies. However, studies analysing gender differences in intra-household expenditures in higher and technical education are limited. The preference of households to invest in the education of boys rather than girls is widely prevalent in developing countries (including India), and such preference is wider in the case of higher education, particularly in rural areas (Chaudhuri & Roy, 2006; Datta & Kingdon, 2019; Himaz, 2009; Iddrisu et al., 2018; Kaul, 2018; Lancaster et al., 2008). This is apparent given the conservative sociocultural setting of developing nations, and in the particular context of India, where the norm is not to expect future support from daughters. Though this is a countrywide phenomenon, it is more prominent in rural areas and traditionally orthodox families (Chaudhuri & Roy, 2006; Lancaster et al., 2008). Many studies have confirmed that this gender variation in expenditure is due to parents’ preference for better quality education for boys (through investing more) than girls (Aslam & Kingdon, 2008; Azam & Kingdon, 2013; Himaz, 2009; Saha, 2013). In engineering education, this difference is expected to be wider, as it takes a major portion of a household’s income, but there is hardly any study to establish this. Therefore, it is interesting to empirically examine the gender differences in household spending on engineering education in India.
It is widely argued that family income plays an important role in determining household spending on education, specifically for higher and technical education. Several studies have found a positive relationship between the two both in rural and urban areas (Acar et al., 2016; Acevedo & Salinas, 2000; Hashim, 2008; Omori, 2010; Psacharopoulos & Mattson, 2000; Psacharopoulos et al., 1997; Richard, 2009; Shafiq, 2011; Tansel & Bircan, 2006; Tilak, 2002; Urwick, 2002). In a related study, Sengupta et al. (2008) revealed that education expenditure as a percentage of family income among poor households was lower compared to that among their rich counterparts. A similar finding was reported by Kanellopoulos and Psacharopoulos (1997) in the context of Greece, who concluded that households belonging to the bottom 20 per cent of the expenditure distribution spent 6.5 per cent of their annual income on education, whereas it was 55.8 per cent for households belonging to the upper 20 per cent of the expenditure distribution. Likewise, there is a negative relationship between family size and households’ education spending (Psacharopoulos & Mattson, 2000; Tansel & Bircan, 2006; Tilak, 2002), as a bigger family size results in fewer resources for education (Bayar & İlhan, 2016; Huy, 2012; Qian & Smyth, 2011), though there has been less investigation on this aspect in India. With limited financial resources, as children are added to the family, the per-child resource declines, resulting in lower educational attainment for later-born children (Dang & Rogers, 2015; Downey, 1995; Kugler & Kumar, 2017).
Another potential factor that determines family investment in education is the location of the household. Many studies have found that urban households tend to invest more in education as compared to their rural counterparts (Agrawal, 2014; Andreou, 2012; Chandrasekhar et al., 2019; Panchamukhi, 1990; Tansel & Bircan, 2006; Tilak, 2002). Interestingly, Pradhan et al. (2000) found that the per capita annual expenditure on education was ₹101 and ₹455 in rural and urban areas, respectively, reporting a noticeable difference of around 4.5 times in India. Similarly, Duraisamy and Duraisamy (2016) showed that the average annual spending on higher education for an urban student was 1.6 times the expenditure for a student in a rural area. Potential explanations for this variation may be the difference in income between rural and urban households and the higher cost of education in urban areas. However, studies addressing the variations in household spending on education (particularly in higher and technical education) between rural and urban regions are quite limited in India.
Educated parents are more aware of the benefits of education and hence spend more on it, which has been established by many studies, both in India and elsewhere (Dang, 2007; Kanellopoulos & Psacharopoulos, 1997; Masterson, 2012; Minello & Blossfeld, 2017; Omori, 2010; Psacharopoulos & Mattson, 2000; Saha, 2013; Tilak, 2002). Considering the case of urban Bolivia, Psacharopoulos et al. (1997) reported that the higher the education of a household’s head, the greater the education expenditure. In particular, household heads with a university education report more than double the education expenditure of those with any other education level. Some studies have found that the mother’s education level has a larger effect on a household’s spending on education than the father’s level of education (Kambhampati, 2008; Shafiq, 2011; Tansel & Bircan, 2006). Examining the direct private cost of secondary schooling in Tanzania, Tan (1985) reports that, other things being equal, students whose mothers have completed at least primary education spend about 16 per cent more than other students. Using Consumer Expenditure Survey data of the United States in 2007 and 2008, Omori (2010) found that parents with a college education or higher were 2.38 times more likely to spend money on education than parents without a high school degree. In a study in India, Saha (2013) reported that the higher the parents‘/guardians’ educational level, the greater the spending on the education of their offspring. A similar result was also obtained by Tilak (2002) using the household survey data of the National Council of Applied Economic Research (NCAER) in 1994, that is, the education of the head of the household has a positive effect on household expenditure on education. Hence, a positive relationship is established between parental education level (in some cases, the education level of other members of the family) and household expenditure on education.
Apart from various individual and household factors, institutional factors, such as the type of institution and discipline students attend, availability of financial support, such as student loan and scholarship, and several other related factors also determine the level of education expenditure. However, only a limited number of studies in the literature on the pattern of households’ educational expenditure have considered these important aspects of the discussion. Salim (1994) finds that students enrolled in private higher education institutes (HEIs) spend more compared to those enrolled in government HEIs in Kerala, which is apparent, as private HEIs charge comparably much higher tuition fees. Receiving any scholarship may have either a positive or a negative impact on education spending. The average spending on education will increase if the scholarship amount supplements it, and it will decrease if the amount of scholarship substitutes the same. In this context, Kumar (2017) found a negative relationship between the two, whereby scholarships substituted higher education spending. In particular, the students receiving scholarships were found to be spending 10 per cent less per annum when contrasted with those not availing scholarships. In our study, we include several institutional factors (college type, discipline of study, availability of scholarship, whether the student is taking private coaching or not, etc.) in examining the pattern and determinants of household spending on engineering education in India.
The available literature on household spending on higher education and its variation by socio-economic and institutional characteristics of the students reveals the relative paucity of such studies in developing countries, and in India, in particular. Therefore, the current study that attempts to examine the pattern and determinants of household expenditure on engineering education would significantly contribute to the literature in three different ways. First, our analysis on the inequality in household spending on engineering education would reveal the true preferences of households in accessing engineering education, a costly discipline in higher education in India. Second, and perhaps the most important, the study discusses the gender bias in household expenditure, a factor that could possibly explain the persistent gap between males and females in the provision of quality engineering education. Finally, we provide additional evidence on the variability in household expenditure by different components (fees and non-fee items) within engineering education, which is missing in the existing literature.
Data and Empirical Design
Data
The study 2 is based on data collected from a sample survey of 588 final-year students pursuing a Bachelor of Technology (B.Tech.) degree in 10 different undergraduate engineering colleges in Odisha (eight private and two government colleges 3 ). These colleges are located in four different districts (Keonjhar, Bhadrak, Khordha and Balasore) of Odisha. These four districts are located in the coastal belt of the state and are also educationally advanced. Interestingly, Khordha alone has 58 engineering colleges (one government, two government-aided and 55 private) out of the 88 undergraduate engineering colleges in the state. There are five colleges (all private) in Balasore, one private college in Bhadrak and one government college in Keonjhar. Five colleges from Khordha, three from Balasore and one each from Bhadrak and Keonjhar are included in the sample. 4 Out of the total number of students surveyed (588), 22.6 per cent are from government institutions and 77.4 per cent from private institutions (see Table 1). 5 The distribution of engineering students according to their branch of study shows that two-thirds are from traditional departments of study and the remaining one-third are from information technology (IT)–related departments. Traditional courses include mechanical engineering, civil engineering and electrical engineering, which have been the standard departments in engineering institutions for a long period, while IT-related departments, also called modern departments, include computer science and engineering, electronics and communication engineering and IT. Of the total students covered in the study, 31 per cent are female—their share being 40 per cent in government institutions and 29 per cent in private institutions. The representation of students by social groups shows that 15 per cent are from Scheduled Castes and Scheduled Tribes 6 and 30 per cent are from Other Backward Classes (OBC), and the remaining 55 per cent belong to forward castes.
Sample Students by Type of Institution Across Gender, Caste and Location
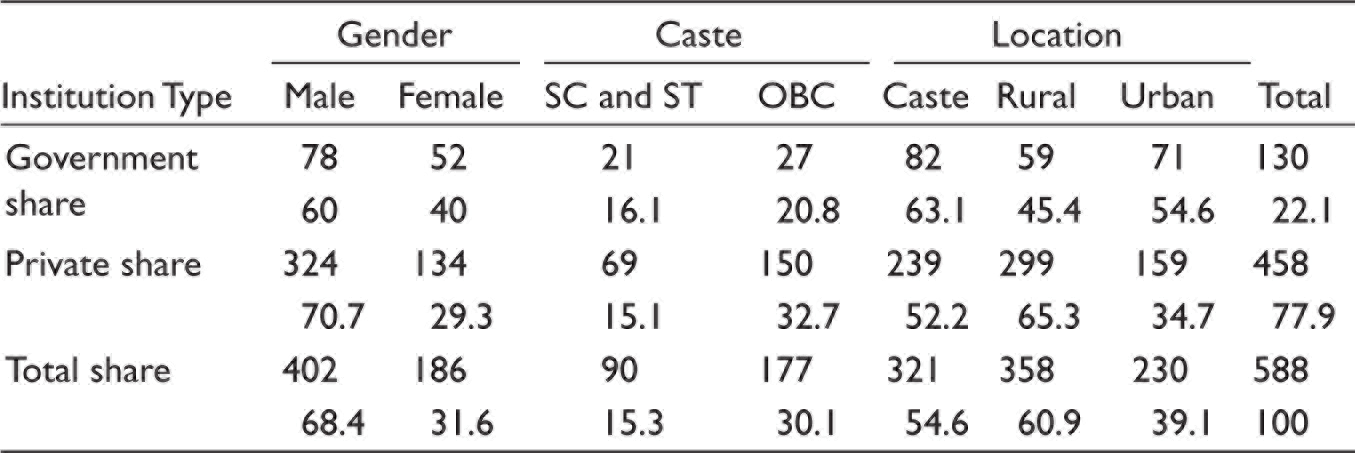
Sample Students by Type of Institution Across Gender, Caste and Location
A student questionnaire is administered to collect information on household expenditure on engineering education, the students’ socio-economic profile, their academic background and their current education details. Total household expenditure on engineering education in Odisha is categorized under two major heads: (a) expenditure on fees—tuition fee, laboratory fee, examination fee, games and sports fee—and (b) non-fee expenditure—accommodation, food, textbooks and other study material, transportation, private coaching, mobile charges, internet access and other necessary living expenses.
Empirical Design
After analysing the pattern of household expenditure based on different socio-economic and institutional characteristics of the students, an attempt is made to analyse factors determining the annual household expenditure on engineering education in Odisha using ordinary least squares (OLS) technique. Two separate household expenditure functions are estimated: first, by taking the total household expenditure on engineering education, consisting of fees and non-fee items, as the dependent variable; and second, by using the household spending on non-fee items only. Further, these two regression equations are estimated by gender (male and female, separately) and income quintiles (poor and rich households) with the objective of understanding the variations in the impact of different factors on household expenditure on engineering education in India.
The two major equations used for the estimation are:


where
LnEducost1 is the natural logarithm of annual total household expenditure on engineering education (expenses on fees and non-fee items), LnEducost2 is the natural logarithm of annual household expenditure on non-fee items of engineering education, that is, household expenditure on engineering education excluding the expenses on fees, α1 and α2 are intercept terms, βi and ɣi are regression coefficients that measure the influence of the explanatory variables on household expenditure on engineering education, Xi are explanatory variables and ε1 and ε2 are error terms.
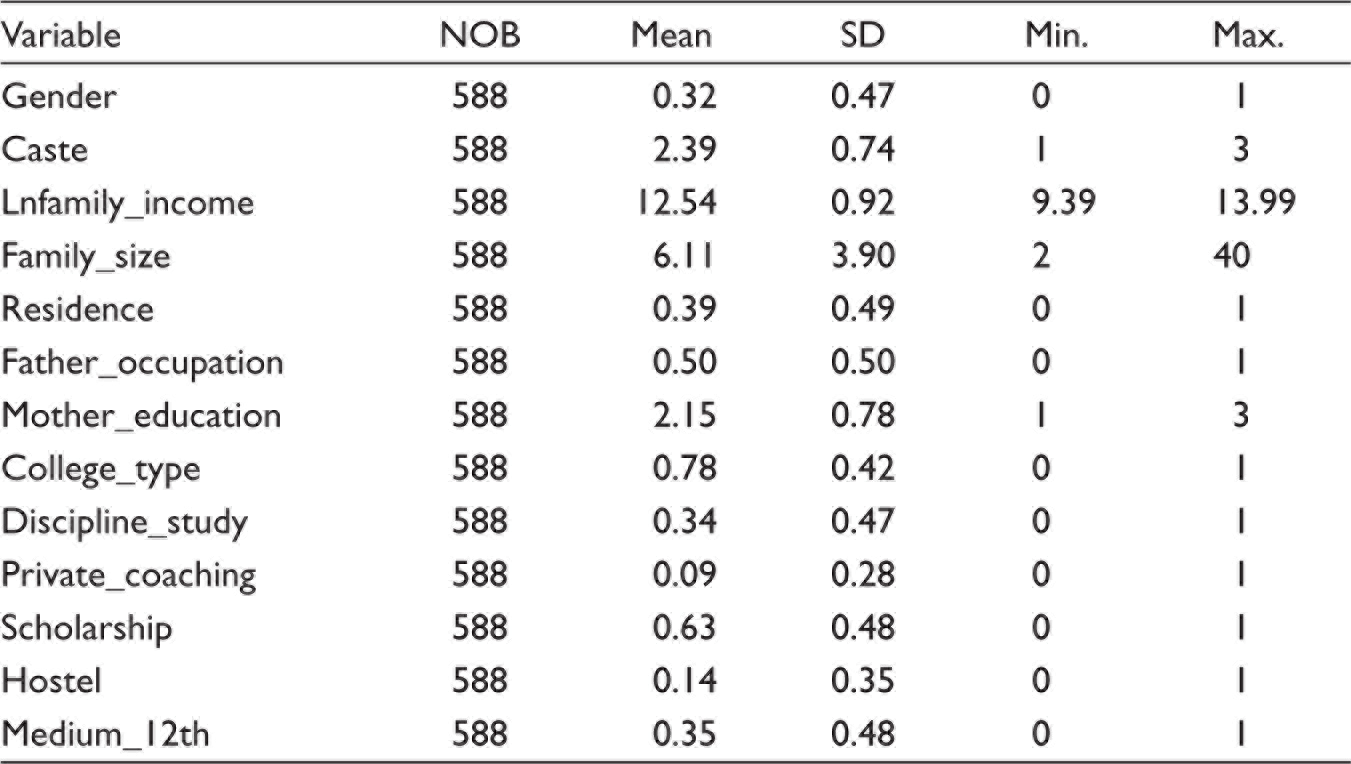
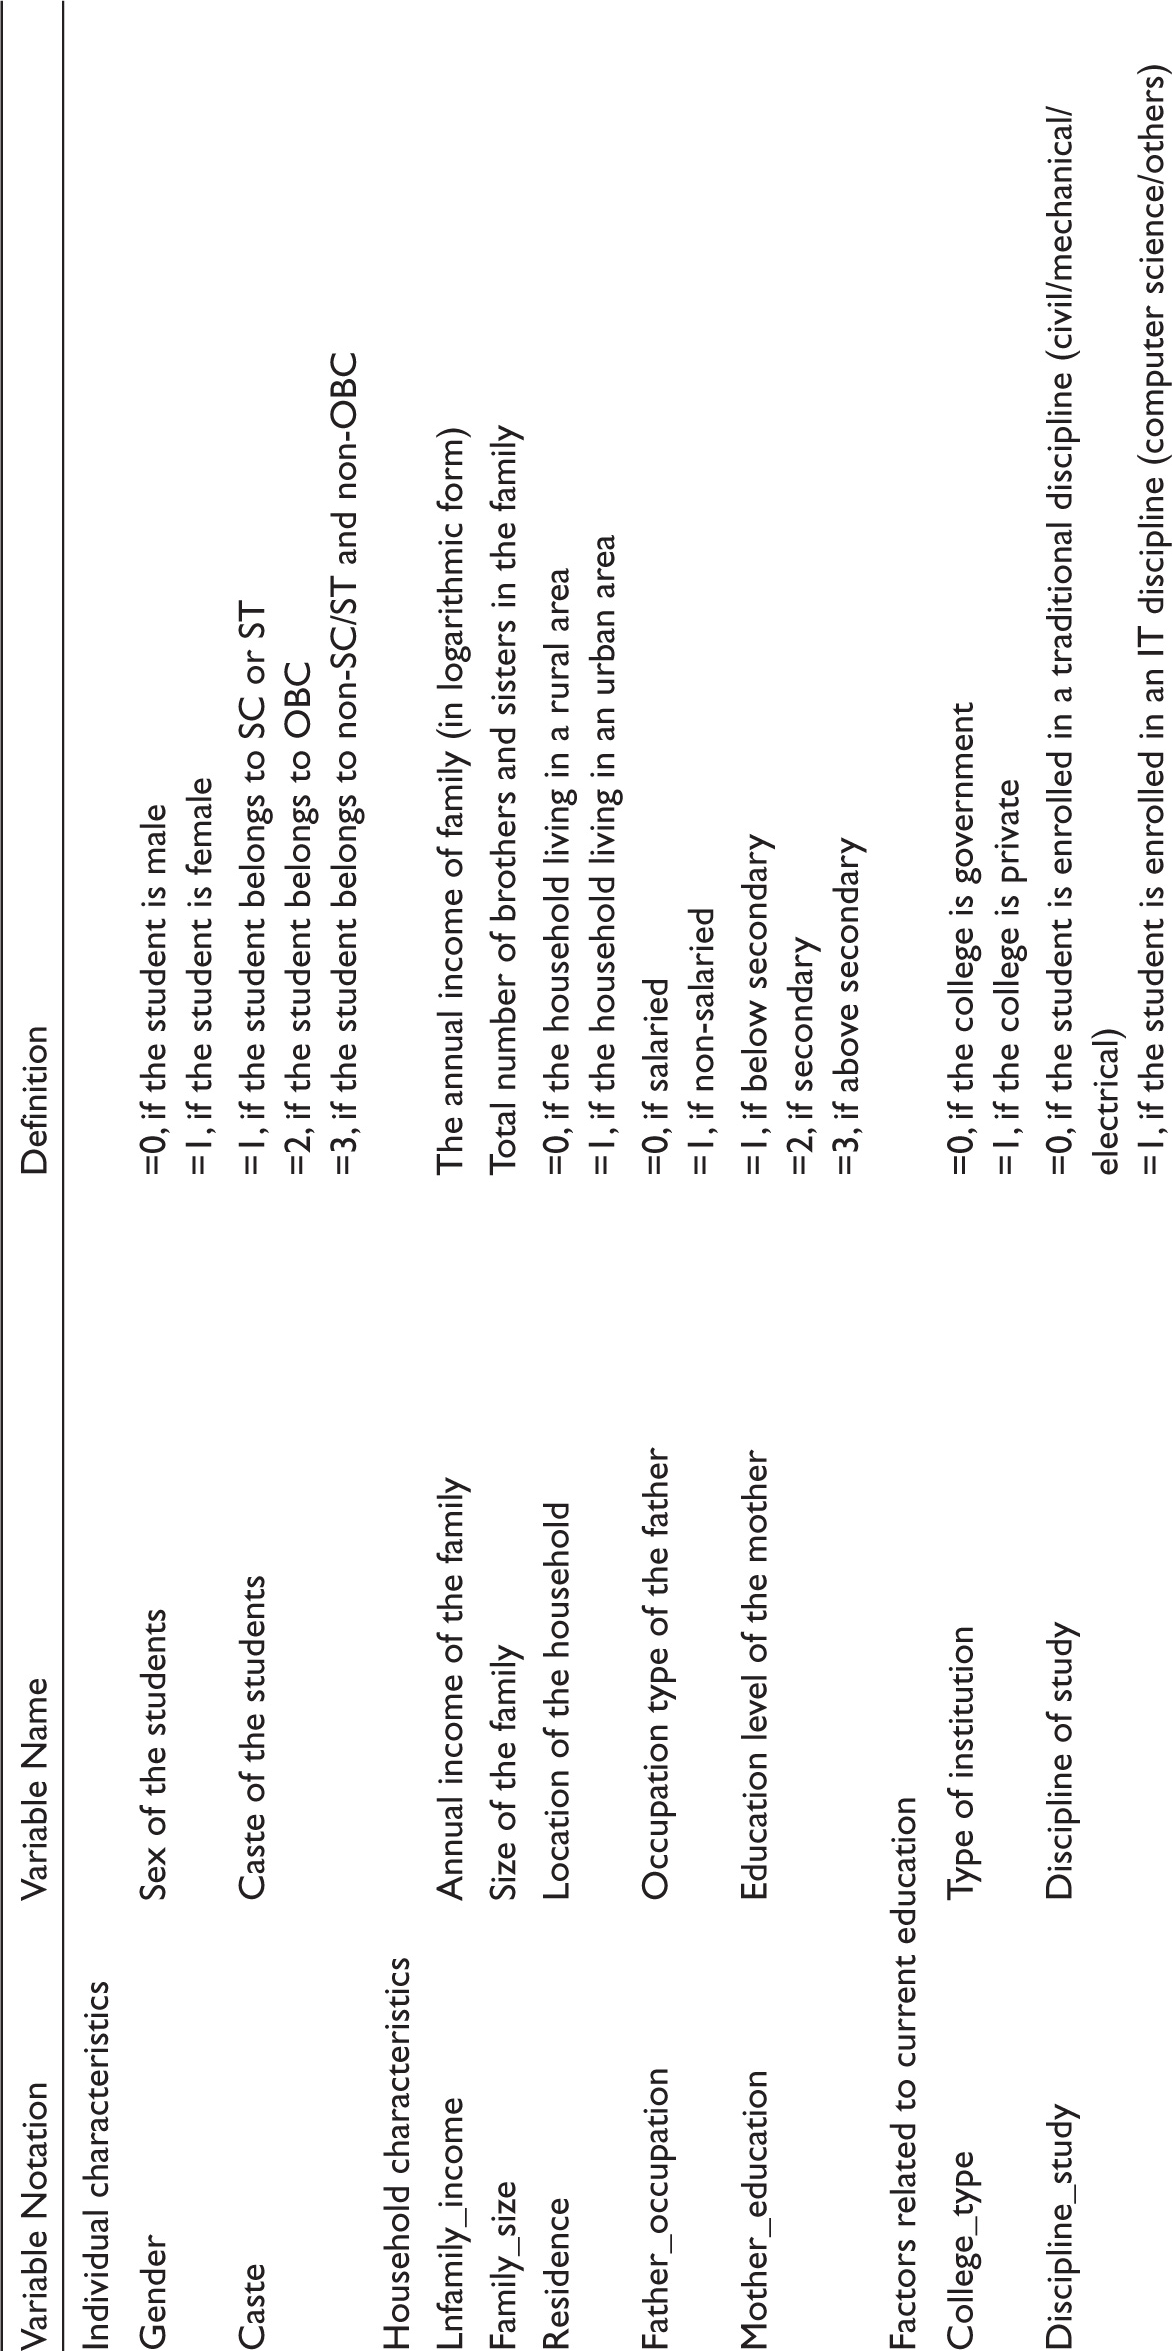
The explanatory variables used in the regression are broadly categorized as individual characteristics, household factors, student’s academic background and student’s current education status (see Table 2 for summary statistics). The notation and definition of these explanatory variables are presented in Table A2. Several other determinants of household expenditure on education, such as household size, household budget for items other than education, opportunity cost of engineering education, etc., are not considered in the analysis because of data limitations. Similarly, we do not include ‘mother’s occupation’ as an explanatory variable (even this information was collected in the survey) in the regression model, as around the mothers of 85 per cent of the sampled students are housewives and therefore may not bring variations in the result. The summary statistics of the explanatory variables used in estimating the functions of household expenditure on engineering education are displayed in Table 2.
Summary Statistics of the Variables Used in the Regression Analysis
The average annual household expenditure on undergraduate engineering education in Odisha is reported to be around ₹118,400, which accounts for 29.6 per cent of the total annual family income. Out of the total household expenditure on engineering education, ₹64,600 is incurred on fees (tuition fee, exam fee, library fee and other fees) and ₹57,800 on non-fee items, such as expenditures on food, accommodation, textbooks, transport, private tuition, mobile charges, Internet access, etc. The share of expenditures on fees to the annual income of a family is 16 per cent, while the share is 14 per cent in the case of non-fee expenditures. The share of expenditures on fee to the total household expenditure on engineering education is 54.5 per cent, while the share of non-fee items is 45.5 per cent (Table 3). Thus, households spend a little higher on fees as compared to non-fee items. This is mainly due to the higher fees charged in engineering courses, particularly in private engineering institutions. However, it is quite interesting to note that households also spend a significant share of their budget on non-fee items, which is 14.4 per cent. Expenditures on food and accommodation, textbooks and other study materials and transportation take a major share (60%) of the household expenditure on non-fee items, and the remaining 40 per cent is spent on private tuition, mobile charges, internet access and other items. The substantial expenditure on students’ food and accommodation may be due to the higher charges of the institutions providing hostel facilities. Also, students staying in rented houses pay a significant amount of money in rent, in addition to spending more than ₹10,000 on transportation, which constitutes about 18 per cent of the total non-fee expenditure and 2.5 per cent of the average annual household expenditure on engineering education. However, the expenditure on fees and non-fee items discussed here may not be collectively exhaustive, as it could have other components, depending upon the type of institute and branch of engineering the students are enrolled in.
Annual Household Expenditure per Student on Engineering Education in Odisha (in ₹)
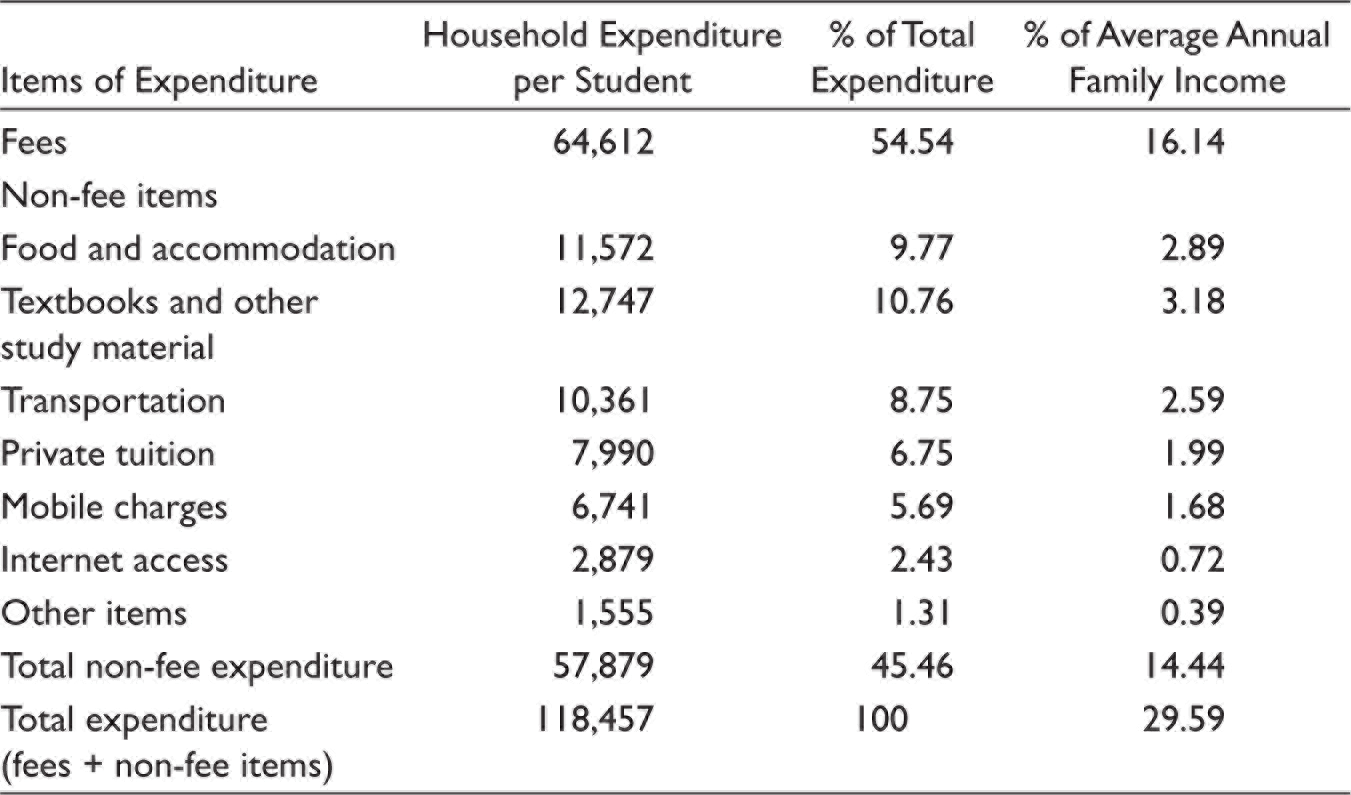
Annual Household Expenditure per Student on Engineering Education in Odisha (in ₹)
With the increasing out-of-pocket spending, policies advocate for funding higher education through student loans. However, the student loan market is quite complex in India (discussed by Chattopadhyay, 2015; Rani, 2017; Tilak, 1992, 2007), which discourages several students from opting for it, even if they face severe financial hardships to fund their education. We find that only around 16.7 per cent of the engineering students in Odisha (of the total of 588 respondents) applied for student loans, and out of them, less than one-third availed loans from commercial banks. A detailed discussion with the students on the loan market reveals that the major problems faced by students in availing loans were high interest rates, lengthy documentation process, early recovery by the banks and demand for collateral.
Individual Characteristics
Gender
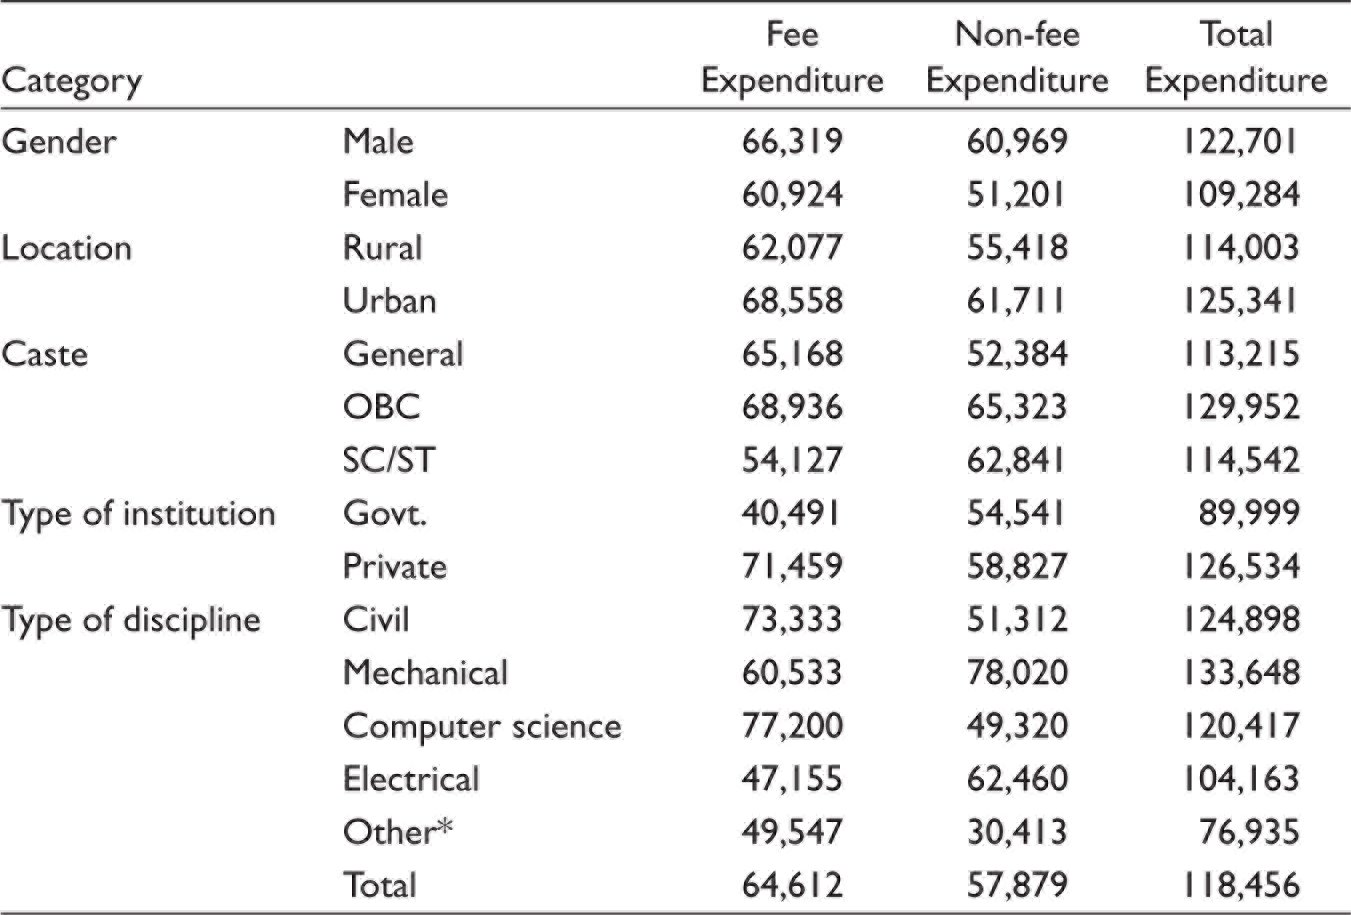
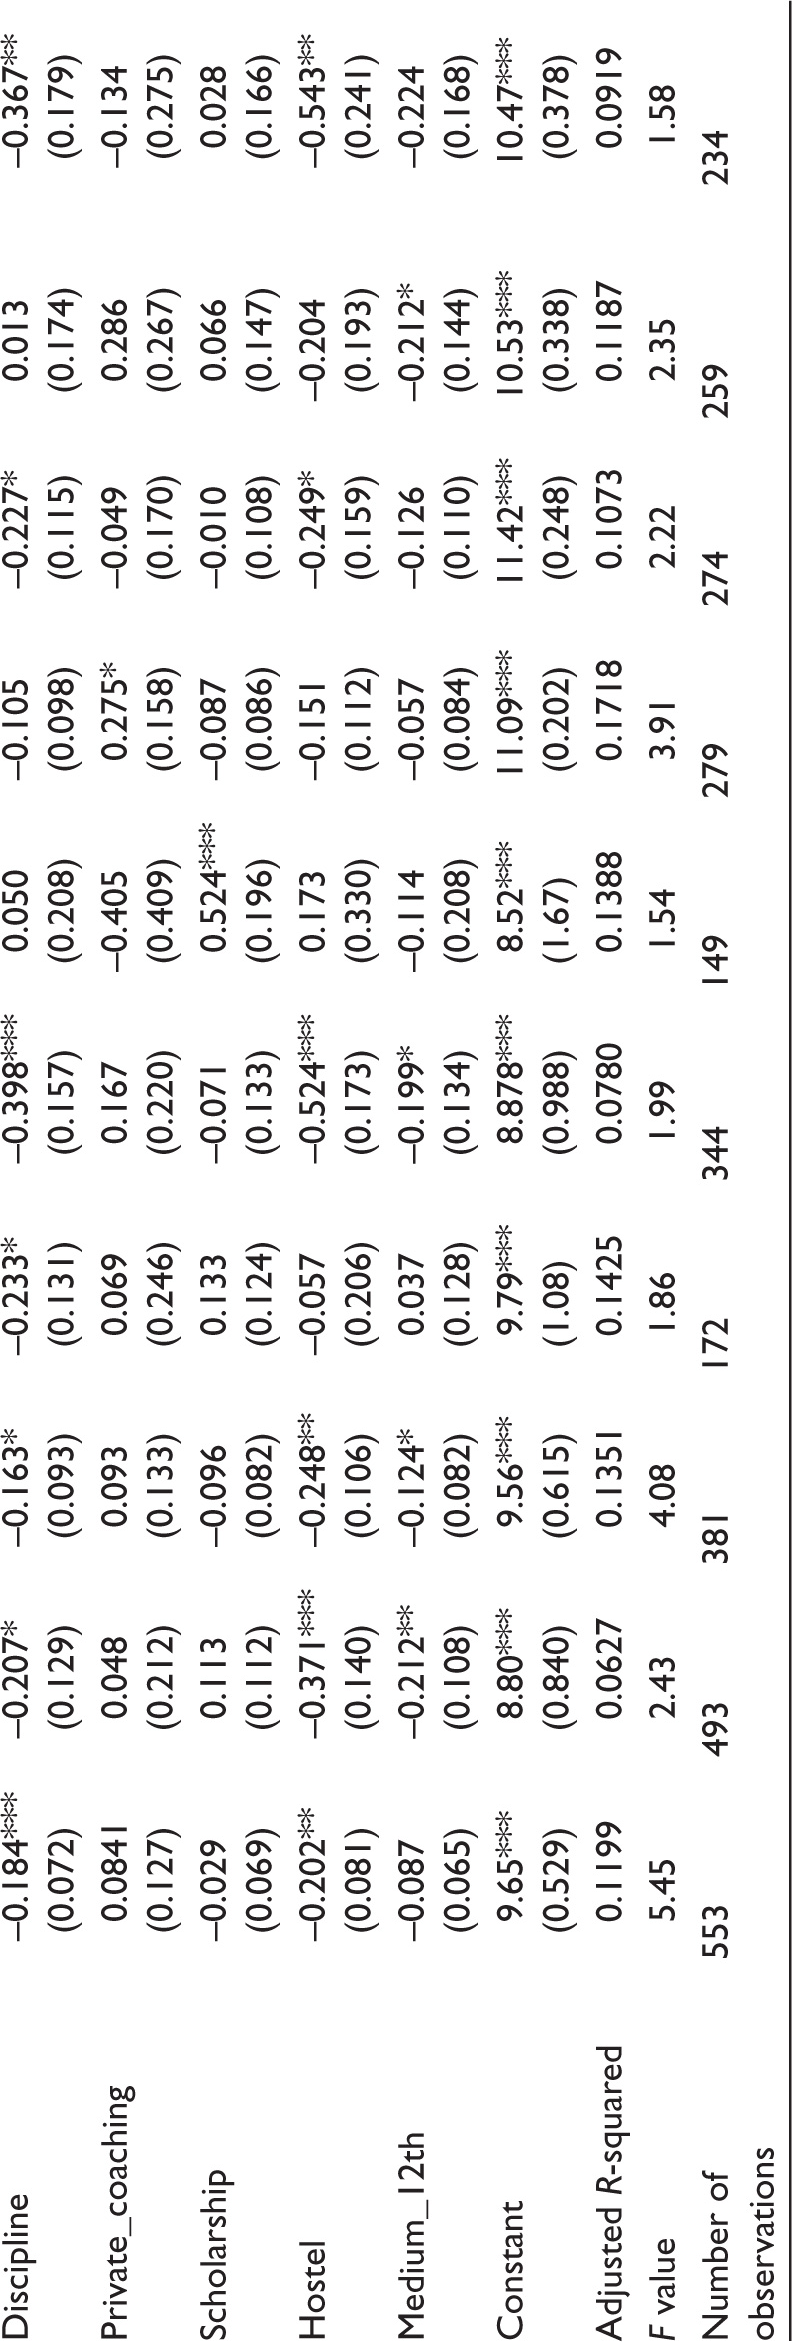
The OLS results confirm the presence of a pro-male bias in household spending on engineering education in Odisha, and interestingly, this gap widens among poor households (Table 5). The average annual household expenditure on male students is around 11 per cent more than that on females, and this gap in spending widens further in the case of non-fee expenditure, which is 31.4 per cent. The per-child household expenditure on engineering education is ₹122,700 for male students, compared to ₹109,200 among female students (Table 4). In a recent study, Kaul (2018) revealed a pro-male bias in the intra-household allocation of educational expenses using data from India Human Development Survey-II (2011–2012). In India, several other studies have also echoed this finding (Azam & Kingdon, 2013; Datta & Kingdon, 2019; Kingdon, 2005; Kumar, 2017; Saha, 2013; Tilak, 2002), in the context of both school and higher education. Though there is a pro-male bias in the non-fee spending throughout all income quintiles, the extent of disparity is found to be greater in poor households when contrasted with rich households. In particular, while poor households spend around 30.5 per cent more on males, this figure is 23.8 per cent for rich households. The gender discrimination in education investment among households may be attributed to parental preference for boys’ education over girls’, as discussed in many studies in India (Azam & Kingdon, 2013; Kambhampati, 2008; Kaul, 2018; Panchamukhi, 1990; Tilak, 2002). In a patriarchal society such as India, parents usually do not expect future financial support from their daughters and therefore invest less in building the human capital of girls as compared to boys, and this is more so at higher levels of education, as the cost goes up. Also, gender discrimination in household spending on engineering education is an interesting case in India, as more than two-thirds of the students in this discipline are male.
Average Annual Household Expenditure on Engineering Education in Odisha by Select Socio-economic and Institutional Factors (in ₹)
Household Characteristics
Household Income
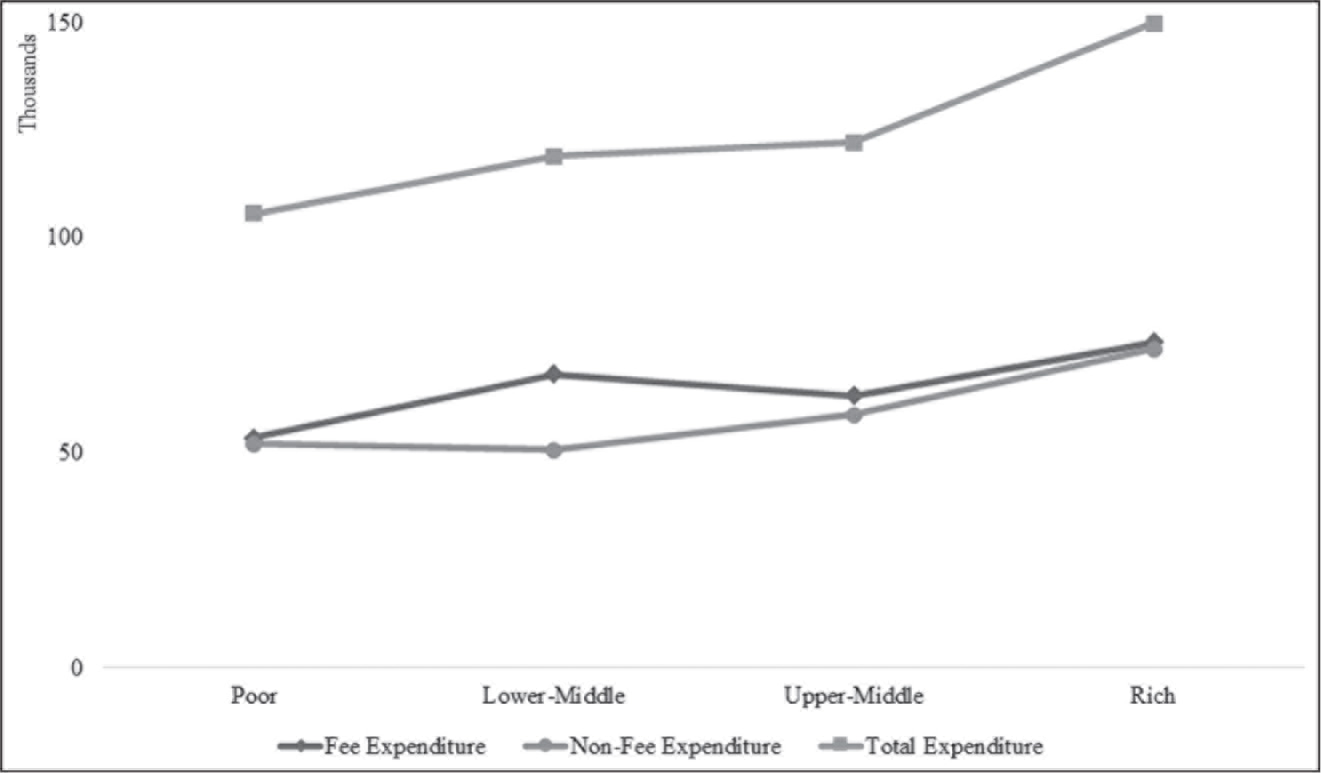
Results show a positive effect of family income on household expenditure on engineering education. A unit increase in income raises the household expenditure on engineering education by 11.8 per cent in Odisha (Table 5). However, there is a marginal difference in the case of expenditure on non-fee items, whereby a unit increase in family income increases the spending on non-fee items by 11.6 per cent. The positive relationship between family income and household spending on education (particularly higher education) has been found in many other studies (Acar et al., 2016; Acevedo & Salinas, 2000; Choudhury, 2012; Gurler & Demiroglari, 2020; Hashim, 2008; King, 1998; Kumar, 2017; Omori, 2010; Psacharopoulos & Mattson, 2000; Richard, 2009; Shafiq, 2011; Tansel & Bircan, 2006; Tilak, 2002; Urwick, 2002). The average annual household expenditure on engineering education in Odisha varies from ₹100,000 for the lowest quintile group 7 to ₹146,500 for the highest quintile group (see Figure 1). Engineering education in India is largely accessed by the higher-income and middle-income groups, as it is a costly discipline mostly provided by the private sector. Further, there is inequality in access to quality engineering education in the country between the rich and poor, which is evident from variations in household spending. A similar expenditure pattern is observed for both fees and non-fee items, whereby households belonging to the highest income quintile spend around 1.42 times more than those belonging to the lowest quintile. In terms of share of engineering education expenditure to the family income, households belonging to the top two quintiles spent around 20 per cent of their annual family income (₹128,388 out of ₹645,031), and the corresponding figure is 67.7 per cent for households belonging to the bottom two quintiles (₹108,726 out of ₹160,502). This indicates that poor households are spending a significant share of their annual income on engineering education of their children.
Determinants of Household Expenditure on Engineering Education in Odisha: OLS Estimates

Family Size
The other related factor that has a negative effect on household expenditure on engineering education is the family size, and the coefficient is significant at the 5 per cent significance level (Table 5). Given the household income, an increase in the family size would result in leaving fewer resources for education (Bayar & İlhan, 2016; Gurler & Demiroglari, 2020; Huy, 2012; Qian & Smyth, 2011). The OLS coefficient indicates that a unit addition to the number of family members results in around a 2 per cent decrease in the per-student household expenditure on engineering education. Though the results hold true irrespective of gender and income quintile, the impact of family size widens in the case of female children and poor households. More specifically, a unit increase in household size decreases the spending on engineering education by 3.2 per cent for females, 1.8 per cent for males, 2.7 per cent for poor households and 1.5 per cent for rich households (see Table 5). The estimates in the case of non-fee expenditure (second model) are observed to be statistically insignificant.
Parents’ Education
Does parental education level have any effect on the level of household expenditure on education? Generally, it is expected that educated parents are more aware of the benefits of education and hence invest more towards the education of their children (Chaudhuri & Roy, 2006; Dang, 2007; Elbadawy, 2014; Gurler & Demiroglari, 2020; Kanellopoulos & Psacharopoulos, 1997; Psacharopoulos et al., 1997; Qian & Smyth, 2011; Rizk & Abou-Ali, 2016; Tan, 1985; Tilak, 2002). Some studies have found that the mother’s education level has a larger effect on the expenditure on a child’s education than the father’s education level (Kambhampati, 2008; Shafiq, 2011; Tansel & Bircan, 2006). Our findings reveal that households in which the mother has completed secondary education spend 21.3 per cent more on engineering education of their children as compared to households wherein the mother’s education level is below secondary education. The extent of variation is found to be more in the case of poor households in terms of both total expenditure and expenditure on non-fee items. More specifically, poor households in which the mother has completed secondary education spend 29.3 per cent more than those wherein the mother’s education level is below secondary education (significant at the 1% significance level), and the corresponding figure is 12.7 per cent for households in which the mother’s education level is above secondary education. A positive relationship between parents’ education and household expenditure on engineering education also reveals the importance given by educated parents to the higher studies of their offspring.
Location
The location of a household also plays an important role in determining the level of its investment in a child’s education. The difference in rural and urban investment in education has been revealed by many studies considering different levels of education (Kanellopoulos & Psacharopoulos, 1997; Panchamukhi, 1990; Tilak, 2000; Urwick, 2002). It is evident that the average annual per-student expenditure on engineering education in urban areas is 6.3 per cent more and that on non-fee items is 6.9 per cent more than that of their rural counterparts (Table 5). Though the inter-regional differences in education spending exist irrespective of gender and income quintile, they widen in the case of female children and poor households. However, the location of the household (residence), taken as a proxy for rural/urban region, is statistically insignificant in both the regression models, except in the case of non-fee expenditure by quintile class. In particular, urban rich households spend 36.9 per cent more on non-fee items as compared to rural rich households. This can be mainly attributed to the rural–urban income variations arising out of differences in earning opportunities, which are comparably more in urban areas. The descriptive statistics show that urban households spent ₹125,300 towards engineering education, comparably more than their rural counterparts, that is, ₹114,000. The expenditures on fees and non-fee items in urban areas are ₹68,500 and ₹61,700, respectively, somewhat higher than the corresponding expenditures in rural areas, that is, ₹62,000 and ₹55,400, respectively (Table 4).
Factors Relating to Current Education
Apart from individual characteristics and household attributes, current education status of the students also determine household investment in education. These include: type of institution; type of discipline; availability of scholarship; access to private coaching; whether the student is residing in a hostel or not; and medium of study. For example, students attending private engineering colleges may need to spend more than those studying in government colleges, as the fees in the latter type of institution are significantly lower.
Type of Institution
The robust OLS results in Table 5 show a positive relationship between the type of institution and per-student annual household expenditure on engineering education, irrespective of the items of spending, gender and income quintile. More specifically, households with students enrolled in private engineering institutions spend 54.3 per cent and 29 per cent more on overall spending and non-fee items, respectively, than those with students studying in government institutions. These findings are similar to that of a study by McMahon (1974) in the context of the United States, which found that income elasticities of real investment expenditure on education are much higher for public institutions than for private institutions. The same has been confirmed at the school level too, whereby household expenditure on primary education in private schools is 2–3 times higher than that in government schools (Tilak, 1996). We find that the average annual household expenditure on engineering education per student is ₹90,000 for government institutions and ₹126,500 for private institutions (Table 4). This difference is higher in fees as compared to non-fee expenditures. The average annual household spending in private engineering institutions is 1.4 times more than that in government institutions, and the corresponding figure is 1.76 times in the case of fees. Within the course fee, not much inter-institutional variations are seen for ‘other fees’, as compared to the huge variations in the ‘tuition fee’. In fact, students in government engineering colleges spend more on ‘other fees’, which include library fee, laboratory fee, sports fee and other fees. Similarly, the caution deposit in government institutions (₹3,632) is found to be higher than that in private institutions (₹1,752). On the other hand, spending on the food and accommodation (a major component of the non-fee expenditure) of students enrolled in private engineering institutions is more than double the amount spent on the food and accommodation of students in government colleges: ₹5,989 and ₹13,157, respectively. This cheap living cost of students in government engineering colleges may be due to the availability of subsidized hostel facilities.
Discipline of Study
The average annual household expenditure per student was 18.4 per cent more for students enrolled in traditional courses 8 as compared to that for those taking IT courses, and the result is significant at the 1 per cent significance level. The expenditure difference increases in case of non-fee items, whereby students enrolled in traditional courses spend 20.7 per cent more as compared to those enrolled in IT courses. While huge variations are seen in ‘tuition fee’ across different disciplines, the gap in spending on ‘other fees’ is not much between disciplines. Similarly, the average caution deposit for students pursuing traditional courses, such as mechanical, civil and electrical engineering (₹2,756) is relatively higher than that for those enrolled in IT courses, such as computer science, information technology and electronics and communication engineering (₹1,010). This variation may explain the requirement for a security deposit in the laboratory works of different courses. Though there are inter-discipline differences in spending (arising out of variations in fees), the extent of disparity widens in the case of male students and rich households. More specifically, non-fee expenditure on male students in traditional courses is 39.8 per cent more than that on male students in IT courses. Similarly, rich households with students in traditional courses are observed to be spending 36.7 per cent more on non-fee items as compared to those with students in IT courses (Table 5).
Scholarship
Theoretically, the availability of scholarships may increase or reduce household expenditure per student. If scholarship money is spent in addition to a student’s costs of living, it will increase the household spending on education. On the other side, if it substitutes the expenditure, it will reduce the total household expenditure on education. Also, if scholarships are awarded to students from economically deprived families, as in the present case, then this will be associated with less household spending. However, if they are given to meritorious students (rewarding them for their performance), then this will add to the household expenditure on education. Hence, the effect of receiving a scholarship may affect household expenditure on education either positively or negatively. The present analysis shows a positive relationship between the two in the case of expenditure on fees and, interestingly, a negative relationship for expenditure on non-fee items. Students who availed scholarships are found to be spending 2.9 per cent more on fees and 11.3 per cent less on non-fee items per annum than students who did not get them. However, the findings are not statistically significant, except in the case of non-fee expenditure for female students (Table 5). Particularly, female students not getting scholarships are found to be spending 52.4 per cent more on non-fee items than those availing scholarship (significant at the 1% significance level). Hence, in the case of fee expenditures, scholarships work as a supplement, and in the case of non-fee expenditures, they work as a substitute for household expenditure on engineering education in Odisha.
Hostel Facility
The overall and non-fee expenditures of students availing hostel facilities are 20.2 per cent and 37.1 per cent, respectively, than those not staying in a hostel, and this further increases in the case of male students and rich households. Specifically, rich male students staying in a hostel spend 52.4 per cent more, overall, and 54.3 per cent more on non-fee items than those not staying in a hostel. This might reflect the additional costs of living in a hostel, which again differs between government and private HEIs.
Using the data collected through a student survey in 2018, this article examines the pattern and determinants of household expenditure on engineering education in Odisha. It analyses the inequality in household spending on fees and non-fee items of engineering education separately for different socio-economic groups and also among students attending government and private engineering colleges. We find that households spend around 30 per cent of their annual income per child for providing engineering education in Odisha, and this share varies significantly between the poor and rich. With the increasing presence of the private sector, students’ economic capacity mostly determines their access to costly engineering and technical education. Access to better quality of engineering education by rich students creates further inequality in the production of specialized human capital. In the era of knowledge economy, graduates from low-income families fail to compete with their rich counterparts, which produces an unequal society.
The regression results reassert the pro-male bias in household expenditure on engineering education, and this gap widens among poor households. Students enrolled in private engineering institutions spend more than those enrolled in public-funded institutions, and interestingly, this difference is not only in fees, as expected, but also in other expenses, such as accommodation, food, transport, textbooks and study material. As engineering education in India is largely captured by the private sector, students are compelled to spend a lot to get a degree in this discipline. Contrary to the established literature, students belonging to lower socio-economic backgrounds spend more on non-fee items than forward social groups, though their expenditure is relatively less on fees. There are also wide inequalities in household spending by parental education and economic characteristics. However, there may be several other important factors that determine the household expenditure on engineering education which the current study could not include. For instance, the household expenditure function could have been estimated better with the inclusion of factors such as quality, institutional leadership and infrastructure etc. in the analysis, information regarding which was not collected as part of the survey. Similarly, it would have been more suitable to estimate the factors determining the net expenditure of households (after adjusting for the amount of financial support received by students), on which, unfortunately, the survey has not collected the required information.
Nevertheless, this study makes a valuable contribution to the existing literature, as there is hardly any study that explores the extent of household investment in engineering education in India, even though engineering is one of the costly disciplines in the higher education sector in the country. This study could help the government and other stakeholders involved in the education sector to formulate better policies, particularly in the context of the declining public budget for education and consideration of households’ contribution as an effective substitute for this. The specific policy implications of the study include the following. First, to minimize inequality in access to engineering education (reflected by the wide variations in household expenditure observed), the government should provide public subsidies to the needy students, specifically the students of socially and economically weaker sections. Second, even in the twenty-first century, engineering education is largely accessed by male students, as revealed by the pro-male bias in household higher education investment. As part of public policy, the state should initiate female-specific programmes that would encourage females to join technical courses. Further studies are needed on engineering education in India for a nuanced understanding of this sector in the changing context of the higher education market. First, it is important to examine the extent of the financial burden on socially and economically weaker sections for accessing engineering education in India, as the current study looks at the issue in an aggregate form. Further inquiry might focus on linking the pattern of household expenditure on engineering education with access to student loans. Is it true that the students availing loans for their studies have a different spending pattern than their counterparts? Finally, in further research, the focus might be expanded to examine the effect of the changing relationship between engineering education and the labour market on the decision to spend. In light of the gloomy labour market situation, households may consider spending less on engineering courses, which might widen the inequality in formation of specialized human capital in India.
Footnotes
Acknowledgements
Data for this article were collected from the survey conducted as part of a research project titled “Student Loan as the Alternative to Costly Higher Education: Evidence from Odisha” and sponsored by the University with Potential for Excellence (UPE) scheme of the University Grants Commission (UGC), Government of India. We are indebted to the UGC for the generous support provided for carrying out the study.
Declaration of Conflicting Interests
The authors declared the following potential conflicts of interest with respect to the research, authorship and/or publication of this article: We wish to confirm that there are no known conflicts of interest.
Funding
The authors disclosed receipt of the following financial support for the research, authorship and/or publication of this article: The first author received funding from the University with Potential for Excellence (UPE) scheme of the University Grants Commission, Government of India, to carry out this study.
Appendix
Notations and Definitions of the Explanatory Variables

| Variable Notation | Variable Name | Definition |
| Individual characteristics | ||
| Gender | Sex of the students | =0, if the student is male =1, if the student is female |
| Caste | Caste of the students | =1, if the student belongs to SC or ST =2, if the student belongs to OBC =3, if the student belongs to non-SC/ST and non-OBC |
| Household characteristics | ||
| Lnfamily_income | Annual income of the family | The annual income of family (in logarithmic form) |
| Family_size | Size of the family | Total number of brothers and sisters in the family |
| Residence | Location of the household | =0, if the household living in a rural area =1, if the household living in an urban area |
| Father_occupation | Occupation type of the father | =0, if salaried =1, if non-salaried |
| Mother_education | Education level of the mother | =1, if below secondary =2, if secondary =3, if above secondary |
| Factors related to current education | ||
| College_type | Type of institution | =0, if the college is government =1, if the college is private |
| Discipline_study | Discipline of study | =0, if the student is enrolled in a traditional discipline (civil/mechanical/electrical) =1, if the student is enrolled in an IT discipline (computer science/others) |
| Private_coaching | Whether taken private coaching before admission into the current course | =0, if the student has taken private coaching =1, otherwise |
| Scholarship | Whether receiving scholarship | =0, if the student is availing any scholarship =1, otherwise |
| Hostel | Whether staying in a hostel | =0, if the student is staying in a hostel =1, otherwise |
| Medium_12th | The medium of study at the senior secondary level | =0, if the medium of study is English =1, if the medium of study is not English |