
Abstract
Bhutan is an important tourist destination in South Asia, and its tourism industry has emerged as the second highest revenue generator next to hydropower. Retaining and enticing first-time tourists to revisit their country is an important policy adopted by many countries of the world. However, the growth trajectory of tourists’ flow to Bhutan changed with a sharp decline in the repeat tourists over the past straight 8 years (2011–2018) with an annual negative growth of 19.1%. Against this backdrop and the non-availability of any meaningful study on tourists’ revisit dynamics, this study investigates the factors associated with the Bhutan revisit intentions of regional and international tourists by using both quantitative and qualitative data. The quantitative data are analysed using multinomial logistic regression and are triangulated with qualitative findings. Factors such as perceived value of money, safety and control variables, viz. gender, age, category of tourists and employment are found significantly affecting tourists’ Bhutan revisit intentions. Eventually, this study also discusses policy implications at the level of the state and tour operators.
Introduction
Tourism industry has emerged as everlastingly competitive sector, placing a great demand on a destination, in terms of service performance, which otherwise becomes vulnerable to various risks, especially the induction of revisit intention. Thomas (2001) has asserted that it is less costly to retain existing customers than to recruit new ones. This requires a concerted effort on the part of business firms to retain old customers. Similarly, to retain the old customers in the form of repeat visitations by the tourists is a cost-effective form of conducting tourism business. To this effect, understanding tourists’ revisit intentions is of paramount importance. Furthermore, to entice tourists to revisit a destination is a common challenge encountered by destinations across the globe. Studies by previous authors (McKercher & Tse, 2012; Reichheld & Sasser, 1990) have reported an amazing fact that a 5% increase in repeat visitation increases profits by a whopping margin of 25%–29%, vis-à-vis enhanced word-of-mouth (WOM) referrals. A plethora of authors (Crompton & Ankomah, 1993; Geissler & Rucks, 2011; Iso-Ahola, 1982; Rice & Khanin, 2019) have proposed that repeat visitation could be an effect of various antecedents, spanning from attribute satisfaction, to demographic factors, to pull and push motivators. Bhutan is an important tourist destination in South Asia. As a small landlocked Himalayan nation with less than one million population, it is bounded by the Tibet Autonomous Region of China to the north and the Indian states of Sikkim, West Bengal, Assam to west and south and the Indian state of Arunachal Pradesh to the east. It heavily banks upon tourism industry as a source of foreign exchange earnings, employment and income generation, and the sector has emerged as the second highest revenue generator next to hydropower. The total gross foreign exchange receipts from tourism in 2019 amounted to US$345.88 million with a growth of 3.8% from 2018 (Bhutan, 2019). The administrative statistics maintained by the Tourism Council of Bhutan (TCB) revealed that from just an onset of 30 tourists in 1974, the year 2019 saw an exorbitant total arrival of 315,599, of which only 5.7% were return tourists. The growth in this industry has skyrocketed over the past four and half decades. However, the growth trajectory changed with a sharp decline in the repeat tourists, over the past straight 8 years (2011–2018), with an annual negative growth of 19.1%. The bug does not stop here. According to the Bhutan Tourism Monitor Report, 2018, there is a steep fall in the growth of return tourists from –63% in 2011 to a little more than half (−51.3%) in 2014 to −29.8% in 2016, followed by a sudden growth of 17.8% in 2017 and again with a steep fall in 2018, with a negative growth of 25.7%. This alarming fact raises the question of whether the tourists visiting Bhutan are simply curious to visit Bhutan and pay their first visitation and never actually intend to return. If it is so, then, what are the reasons for such a state of affairs?
Till date, there is no meaningful empirical study conducted on Bhutan, explaining tourists revisit intention and its various dynamics, including antecedents of revisit intentions. It, thus, merits to investigate whether tourists are simply modest with their expression of revisit intentions or truly they want to revisit Bhutan. This study also attempts to come up with an optimal number of repeat visits by directly adopting the method followed by Park et al. (2019) for clear policy formulation by the destination managers and marketers of Bhutan. Park et al. (2019) have followed the premise of hedonic adaptation whereby the affective arousal, resulting from a new experience, tends to decline after repeated exposure to the same stimulus (Wang et al., 2009).
In this study, the proposed antecedents of revisit intentions are mainly to attribute satisfaction, safety, attractions, guide services and value for money besides socio-demographic factors. Similar factors have been also used by many authors (Assaker & Hallak, 2013; Chelliah et al., 2019; Hasan et al., 2019; Petrick et al., 2001) to explain revisit intentions.
We use the readily available data set of the TCB generated through Visitors’ Exit Survey 2018. A sample of 3,534 tourists has been obtained of which 1,728 were international arrivals and 1,806 regional. The return visitors comprised 5.7% of the total visitors. The TCB has categorized the tourists to two groups—international and regional. The citizens of India, Bangladesh and Maldives haven been termed as regional tourists and the rest of the world as international. We too have used this classification here.
We believe that the findings of this article would certainly enrich the literature on tourism and hospitality industry in the case of Bhutan. It would also contribute to tourism practice in Bhutan by enlightening the Bhutanese destination managers and marketers on the issue of revisit intentions of tourists and ways and means to adopt and promote tourists’ revisits. Similarly, the findings would also enable the TCB, which is an apex tourism regulatory body for formulation of sound tourism policies and programmes.
This article is presented in six sections. Besides the introductory section, Section II makes an informed review of literature on the subject and explains the necessity of the study. Section III describes the data sources and the tools used in subsequent analysis of the data. Section IV presents the results of the analysis, and Section V summarizes the findings, discusses their implications and provides some meaningful concluding remarks.
Review of Related Literature and Hypotheses Formation
Tourist Satisfaction and Revisit Intentions
Satisfaction being a relative term is hard to have a sole definition. Nonetheless, many authors have attempted to define satisfaction to fit into the context of service industry. Oliver (1980) defined satisfaction as the perceived discrepancy between prior expectation and perceived performance after consumption of certain product or service and conversely when performance differs from expectation, it is termed as dissatisfaction. By the same token, Rust and Oliver (1994) and Giese and Cote (2000) have defined satisfaction as the degree to which one believes that an experience evoked positive feelings and contrary to which is defined as dissatisfaction (Linder-Pelz, 1982; Reisinger & Turner, 2003).
Tourist satisfaction in this study is termed as ‘attribute satisfaction’, which is associated with particular features that make up the location, viz. accommodations, services and facilities, transport system and accessibility to services in line with Chi and Qu (2008), unlike overall satisfaction (Alegre & Cladera, 2006; Bigne et al., 2001; Bloemer & De Ruyter, 1998; Fornell, 1992; Ping, 1994; Rajput & Gahfoor, 2020; Spreng & Mackoy, 1996) as a single item measure. In tourism studies, the need and the rationale of distinguishing overall satisfaction from satisfaction concerning individual service attributes is explained in the studies of Seaton and Benett (1996), Bolton and Drew (1991), Mai and Ness (2006) and Eboli and Mazzulla (2009). The attribute-level satisfaction measurement has been always found to be more precise (Ebola & Mazzulla, 2009; Gaffar et al., 2011). Anwar and Sohail (2004) and Chi (2011) have found a positive relationship between attribute satisfaction and repeat visitations. A recent study by Seetanah et al. (2020) on the relationship between quality of airport services and revisit intention has revealed an interesting fact that attributes like airport service, which connotes transport system in this proposed study, have positive and significant effect on revisit intentions of tourists. In a similar vein, a study by Simpson et al. (2020) reinforced the existence of substantial direct influence of satisfaction on revisit intention. Presently, there is dearth of research on this front, in Bhutan, explaining such relationships. Hence, this study is aimed at excavating the relationship between attribute satisfaction of tourists who visited Bhutan in 2018 and their revisit intentions. To this end, the following hypothesis is posited:
Interrelationship Between Repeat Visits and Revisit Intentions and Moderating Effect of Satisfaction Between the Two
Tourists are divided into two categories as first-timers and return visitors (Lau & Mckercher, 2004; McKercher & Wong, 2004). The previous studies have cited various reasons why repeat visitors are more prone to revisit the same destination. A study by Morais and Lin (2010) revealed that destination image was responsible for first-time visitors’ intentions to patronize the destination. Similarly, they found destination attachment as the responsible factor for return visitors’ intentions to patronize the destination. A couple of prior studies have found routine behaviour (Odin et al., 2001; Oppermann, 1999), familiarity (Horng et al., 2012; Mitchell & Greatorex, 1993), risk avoidance or safety (Horvat & Dosen, 2013; Oppermann, 1998; Quintal et al., 2010; Zou & Meng, 2020), and minimum discrepancy between expectations and experience of the visitors (Alegre & Cladera, 2006; Andereck et al., 2012) as some of the prominent reasons that induce return visitation to the same destination.
Against the backdrop of such findings, our study, therefore, investigates the above-mentioned literature using fresh data from Bhutan’s tourism sector. Along with testing these theories, a quadratic relationship is explored in line with the same investigation carried out by Park et al., (2019). Park et al. (2019) have found that after a certain number of visits by tourists, the intention to revisit the same destination dwindle. The cause for this phenomenon has been pointed out as variety-seeking, whereby the consumers possess a tendency to alternate between different makes of the same product (Sevilla et al., 2019). This fact has been substantiated by previous studies (Çelik et al., 2017; Coombs & Avrunin, 1977; Kwun et al., 2013; Liu et al., 2019) that explained variety-seeking tendencies affecting tourists’ behavioural intentions, where tourist tend to switch to other destinations to experience similar products or services elsewhere. Coombs and Avrunin (1977) found this tendency pretty existent among customers who enjoyed a great service experience, deriving high levels of enjoyment, and eventually attaining satiety upon repeating the experience too often. For example, Park et al. (2019) have found that restaurant customers attained satiety after revisiting the same restaurant frequently, leading to an inverted U-shaped relationship between the number of previous visits and the satiety level. Again, this study intends to check the mediating role of satisfaction on frequency of previous visits and revisit intentions in light of the findings on the same line of enquiry by Park et al. (2019). A study by Shahzadi et al. (2018) found partial mediation role of customer satisfaction on restaurant attributes and behavioural intentions. Against these findings, of the mainstream literature, the following hypotheses are, therefore, posited:
Tourists Risk Perception and Revisit Intentions
Safety in a destination is an essential key to sustainable tourism (Prashyanusorn et al., 2010). Travellers from all walks of life perceive risk in a destination before making a final travel decision. Risk perception and safety had been proven as key factors in visitors’ decision-making process to visit a destination (Gut & Jarrell, 2007; Rittichainuwat & Chakraborty, 2009). Jonas and Mansfeld (2017) have differentiated risk perception based on three timings, viz. risk perception judgements before, during and after the visit of a particular destination. The risk perception in this study pertains to post-visit evaluation. According to Aqueveque (2006), tourists view risk issue based on geographical and cultural differences in destinations. Similarly, a study by Kozak et al. (2007) has reported that tourists’ travel experiences affect their revisit intention in different ways, which concurs with the study by Quintal and Polczynski (2010) titled ‘factors influencing tourists’ revisit intentions’. The risk dimension associated in this study is based on three items: safety and comfort of the local transport services; road and trail safety; friendliness of local people; and trustworthiness of the guide. Many previous studies (An et al., 2010; Artuğer, 2015; Çetinsöz & Ege, 2013; Mawby et al., 2021) have revealed that risk perception of tourists have had a significant impact on their revisit intention. Based on these studies, the following hypothesis is derived:
Perceived Value and Revisit Intentions
According to Petrick and Backman (2002), perceived value has been identified as one of the most important constructs for measuring gain in competitive edge in relation to repurchase intentions in marketing literature and as a crucial indicator. Similarly, Zhang and Mao (2012) have found perceived value significantly affecting consumers’ decision-making processes. In tourism, Raza et al. (2012) found positive relationship between perceived value and revisit intentions. A study by Caber et al. (2020) revealed that perceived value positively affects revisit intentions in youth tourism. A similar study undertaken by Yen (2020) established a positive and significant relationship between perceived value and the revisit intentions in a study pertaining to the Wine Cultural Event held at Yibin in the southeastern part of Sichuan province of China. Similar finding has been reported by Zhang et al. (2020) in their study on ‘perceived value of, and experience with, a World Heritage Site in China—the case of Kaiping Diaolou and villages in China’. So, the aforementioned studies have led to the following hypothesis:
Methodology
Quantitative Data
This study uses a radially available data set of the TCB. As a regular activity of the TCB, a cross-sectional survey was conducted between January and December 2018 across four tourist exit points of Bhutan (Paro International Airport, Phuntsholing Immigration Gate, Gelegphu Immigration Gate and SamdrubJongkhar Immigration gate). Eventually, a total of 3,534 responses were obtained, of which 1,728 were international tourists and 1,806 were regional tourists.
Qualitative Data
The qualitative data were extracted from the comments columns and through focused group discussions (FGDs) with the officials of TCB, Guide’s Association of Bhutan (GAB) and travel agents in Bhutan. The officials of the Research and Planning Division of TCB comprising three research officers were included for FGD along with six officials of GAB and five tour operators.
Survey Instrument
A structured questionnaire was administered by the TCB to the eligible respondents (tourists departing Bhutan). The enumerators inducted for the survey clarified the respondents’ doubts in times of difficulty in understanding the questionnaire. ‘What is your main purpose for departing Bhutan?’ was used as a screening question to identify the potential respondents among the mix of both tourists and various other forms of visitors departing Bhutan. The screening question comprised different categories of departure from the exit point, viz. tourist departing, student returning home, immigration, border worker, seasonal worker and diplomatic/military personnel departing. The first category of departure (tourist departing) was invited for participation in the survey.
The survey instrument mainly covered about five major areas from basic demographic characteristics to various other aspects of the study. The first section covered general questions about tour composition. The subsequent sections comprised service attributes. Utilizing the 5-point Likert scales, tourists were asked to evaluate their satisfaction against each destination attribute defined by their corresponding indicators (from 5 = completely satisfied to 1 = not at all satisfied). A mean of satisfaction level with 21 attributes was used for analysis. The third section asked respondents to rate those service dimensions according to their order of importance (from 5 = very important to 1 = not at all important). Similarly, the section four of the questionnaire required respondents to rate their post-travel risk perception of Bhutan again on a 5-point Likert scale (from 5 = completely satisfied to 1 = not at all satisfied). In a similar vein, the mean of all those indicators describing post-travel risk perception under the latent construct of ‘safety’ had been used for analysis. The final section of the survey consisted of socio-demographic characteristics of the respondents. In addition, the respondents were asked to rate two questions that pertained to destination loyalty on a 5-point scale: ‘would you recommend Bhutan to friends, relatives or colleagues at home?’ (5 = yes, definitely, 4 = yes, probably, 3 = possibly, 2 = no, probably not and 1 = no, definitely not) and ‘how likely are you to return to Bhutan in the future?’ (5 = very likely, 4 = likely, 3 = undecided, 2 = unlikely and 1 = very unlikely). The latter was used as a dependent variable for running ordinal logistic regression.
Method of Data Analysis
The study follows a mixed method as a mode of analysis. The empirical findings are triangulated with the qualitative findings. The dominant objective of this study is to examine the factors responsible for revisit intentions to Bhutan. To identify the relationship between revisit intention and factors associated with it, a logit regression is performed using STATA 13.0. The ordinary logistic regression (OLR) model is found to be suitable, especially for a study related to customer satisfaction that usually involves ordinal verbal scales of measurement. By the same token, OLR is suitable in the context of the present study since tourists are analogous to customers. According to Cainarca and Sgnobbi (2005), the OLR model estimates the effects of explanatory variables, whether numerical or categorical, on the logarithm of the probability that the response variable assumes low values instead of high values. For the ordinal response variable assuming j distinct values, the relationship with the X explanatory variables can be posited through the following formula:
The probability that observation i will select alternative j is:

where F is the logistic cumulative distribution function,
Initially, the above-mentioned model has been employed. The proportional odds model assumes that there is a common set of slope parameters β (log odds change corresponding to a unitary increase of the X) for the predictors, whereby the ordinal outcomes are distinguished by the j – 1 intercepts αj with j as a benchmark level. To testify this, a test of parallel line is carried out using Brant (1990) test. The violation of the Brant test has led to the switch of model to the following multinomial logistic regression. In accordance with Liao (1994), a multinomial logistic model with j categories must have j − 1 logistic regressions. In a multinomial logistic regression model, dependent variable’s probability of being in category πj = P(Y = j) is depicted in Equation (2) (Liao, 1994).
The marginal effect of an increase in a regressor Xr on the probability of selecting alternative j is given by the following formula:
Let πij = P(Yi = j) denote the probability that the ith observation follows on the jth category, which is given by
This study comprises two interaction terms (attribute satisfaction × repeat visitation and international tourists × repeat visitation). The interaction is between one dummy variable and the continuous. By carrying out the cross-derivative (Norton et al., 2004) of Equation (2) or partial derivative of Equation (3), the magnitude of interaction effect for the jth response is obtained as follows:
Socio-demographic Characteristics of Respondents
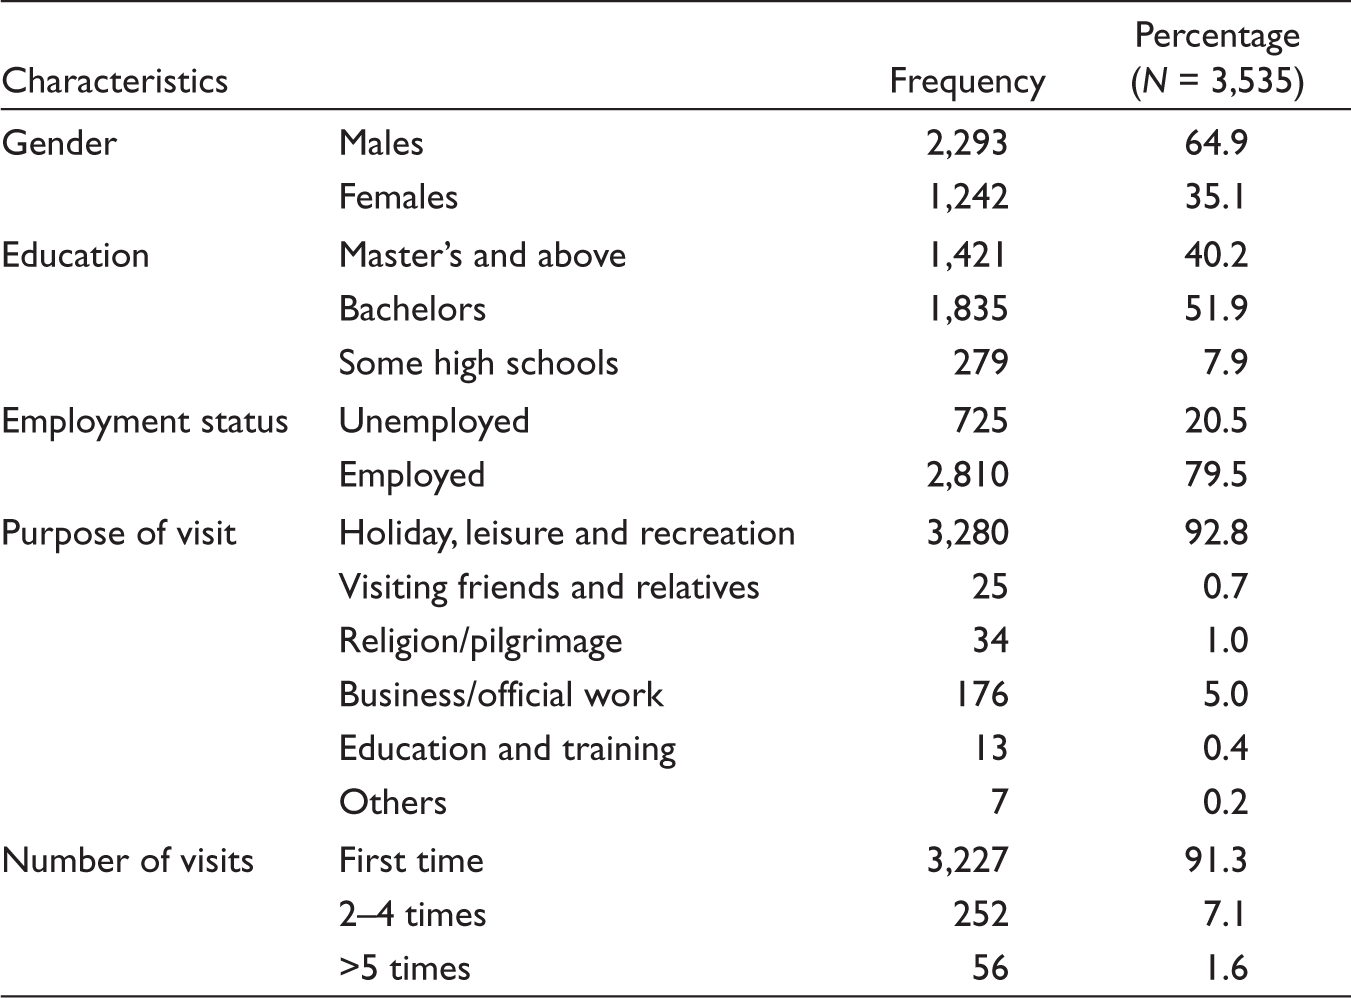
Table 1 shows the socio-demographic characteristics of respondents of this study. Among the 3,535 survey participants, close to two-thirds (64.9%) are male tourists and 35.1% are female tourists. The median age of the participants is 43. Majority of the respondents (92.1%) have bachelor’s degree and above, and more than three-quarters (79.5%) of them are employed. A little more than 9 out of every 10 tourists (92.8%) visited Bhutan for holiday, leisure and recreation. Overall, about 91.3% of the tourists are visiting Bhutan for the first time as against 8.7% who visited more than once.
Socio-Demographic Characteristics of Respondents
Socio-Demographic Characteristics of Respondents
Bhutan Revisit Intention by Category of Tourists
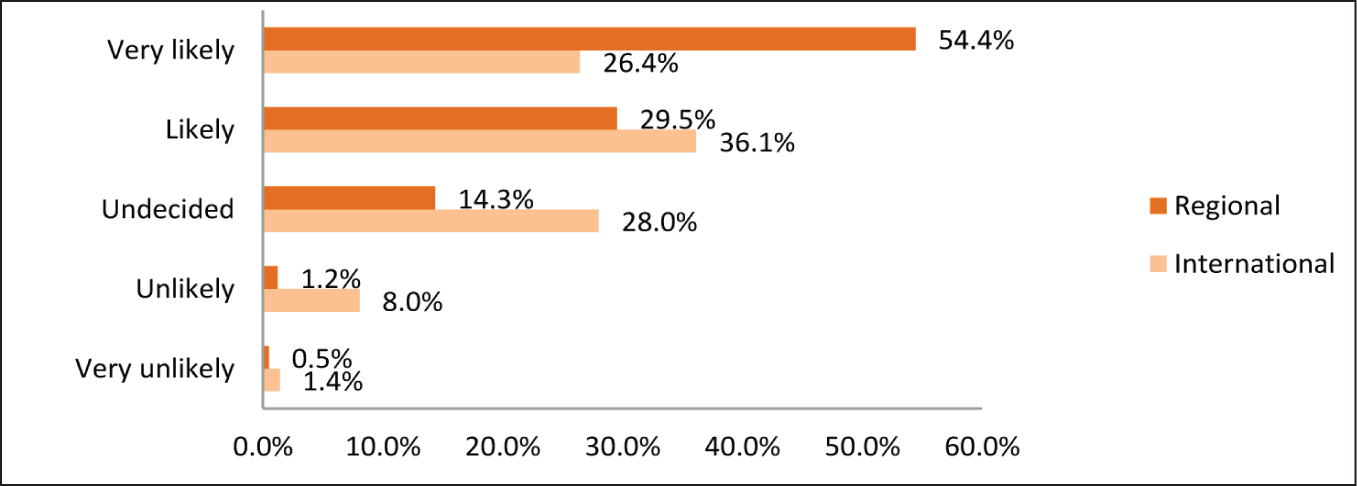
Upon being asked to both the international and regional tourists on their revisit intentions, more than three-quarters (83.9%) of the regional tourists expressed that they would revisit Bhutan in the future as compared to 62.5% of the international tourists as depicted in Figure 1. On the flip side, about 9.1% of the international tourists did not want to revisit Bhutan as opposed to regional tourists (1.7%).
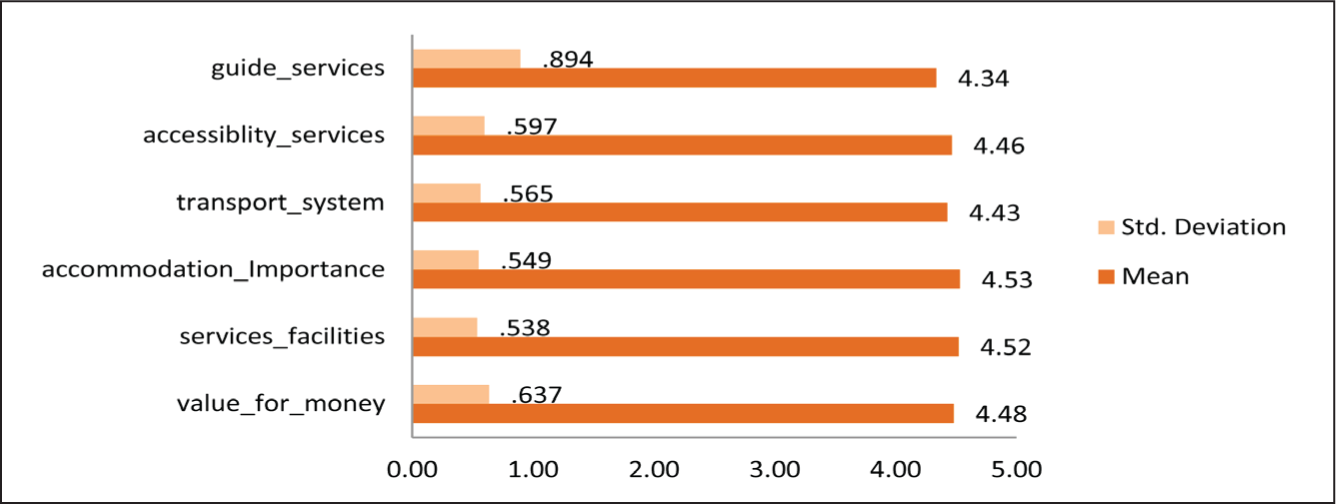
Similarly, Figure 2 depicts the mean importance score of services attributes. Tourists were made to rate about six services attributes in their order of importance. Tourists have rated top three service attributes as the most important attributes for them, namely accommodation (
Overall, Tourist Arrivals and Source Markets
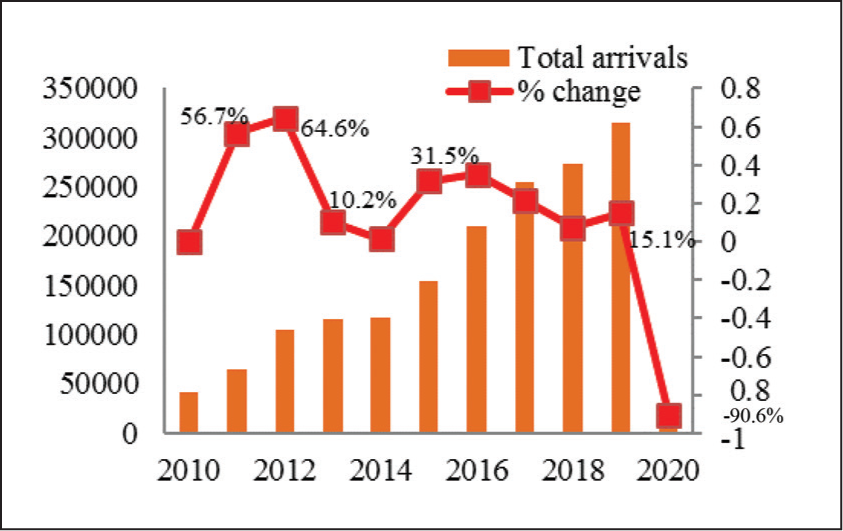
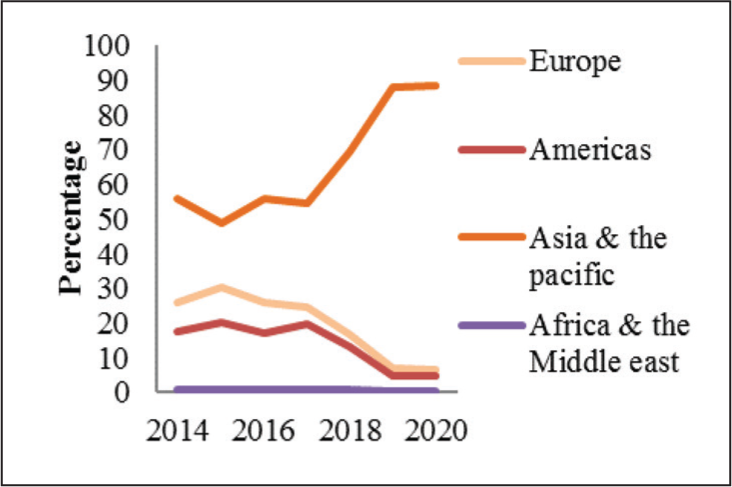
Figure 3 shows the total tourist arrivals and the growth over the years. The tourism industry in Bhutan enjoyed record high flow of tourists at 64.6% in 2012 with a sharp drop in 2014, and a sudden change in trajectory in 2015 with an annual growth of 31.5%. Since then, the growth remained steady until such time as the COVID-19 situation surfaced in 2019, which has had devastating effects on the economy, institutions and society of Asian countries (Singh & Singh, 2020). The following year—2020—saw a drastic decline in the tourist arrivals (−90.6%). Figure 4 depicts the source markets for Bhutan. Asia and the Pacific remained the highest source markets over the years, followed by Europe and Americas. The lowest source markets are Africa and the Middle East.
Test of Parallel Regression Assumption
Table 2 presents the Brant test of parallel regression assumption conducted after running ordinal logistic regression in line with Equation (1). In an ordinal logistic regression model, there is an important assumption that parameters do not change for different categories of dependent variable. In other words, response variable’s categories are parallel to each other, and the reverse of the same indicates lack of parallelity between categories (Erkan & Yildiz, 2014). Table 2 precisely illustrates the test of whether any variable violates the parallel-lines assumption in tandem with tests of the assumption for each variable separately. The approximate likelihood-ratio test of proportionality of odds across response categories from the ordinal logistic regression analysis are found significant (p > χ2 = 0.000), indicating that the parallelity assumption is violated. To confirm this, the Brant (1990) test has been conducted, which vividly shows that the assumptions of the parallel-lines model are violated since a test statistic is significant (p > χ2 = 0.000). Conversely, there is a huge difference in the χ2-statistics of the ordinal logistic regression model approximation of likelihood ratio of proportionality of odds across response categories (χ2(16) = 54.39) and the Brant test of parallel regression assumption (χ2(16) = 47.52). All these signal the inappropriateness of the ordinal logistic regression model under consideration. To this effect, to counter the limitations of the ordinal logistic model at hand, model (1) is switched to model (2)—multinomial logistic regression model as a corrective measure (Liao, 1994).
Brant Test of Parallel Regression Assumption

Results of the Multinomial Logistic Regression
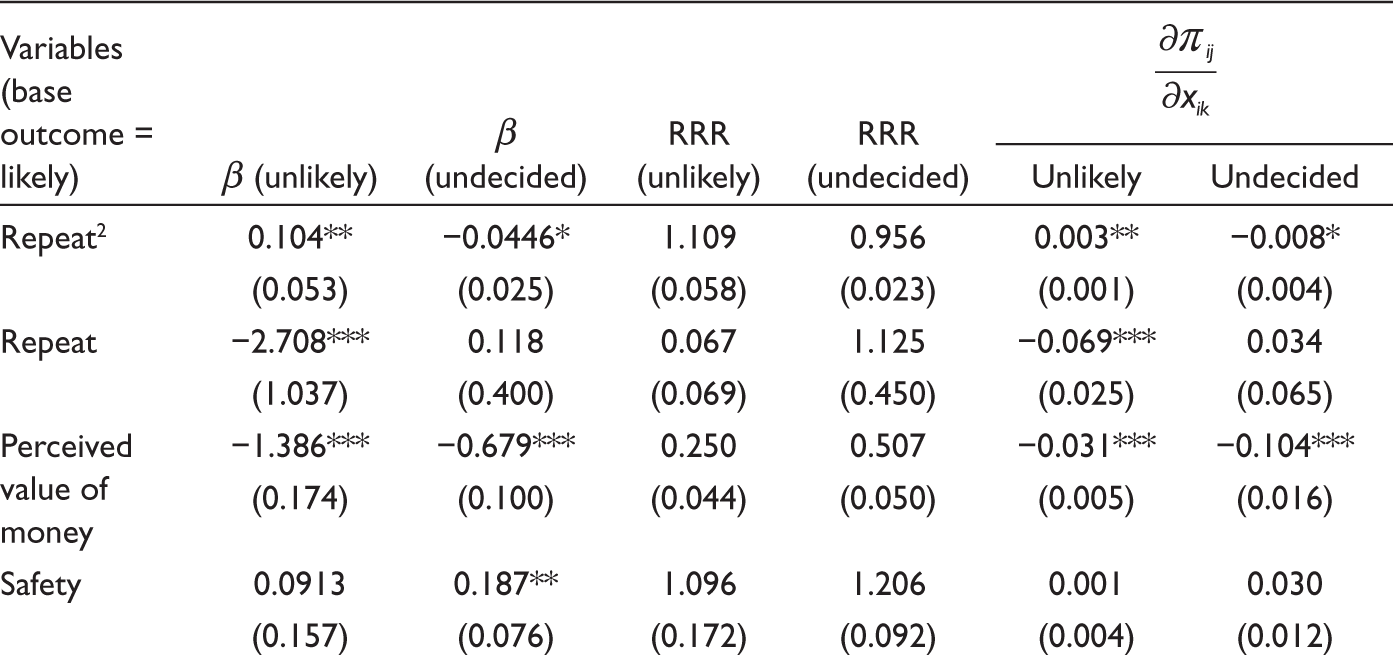
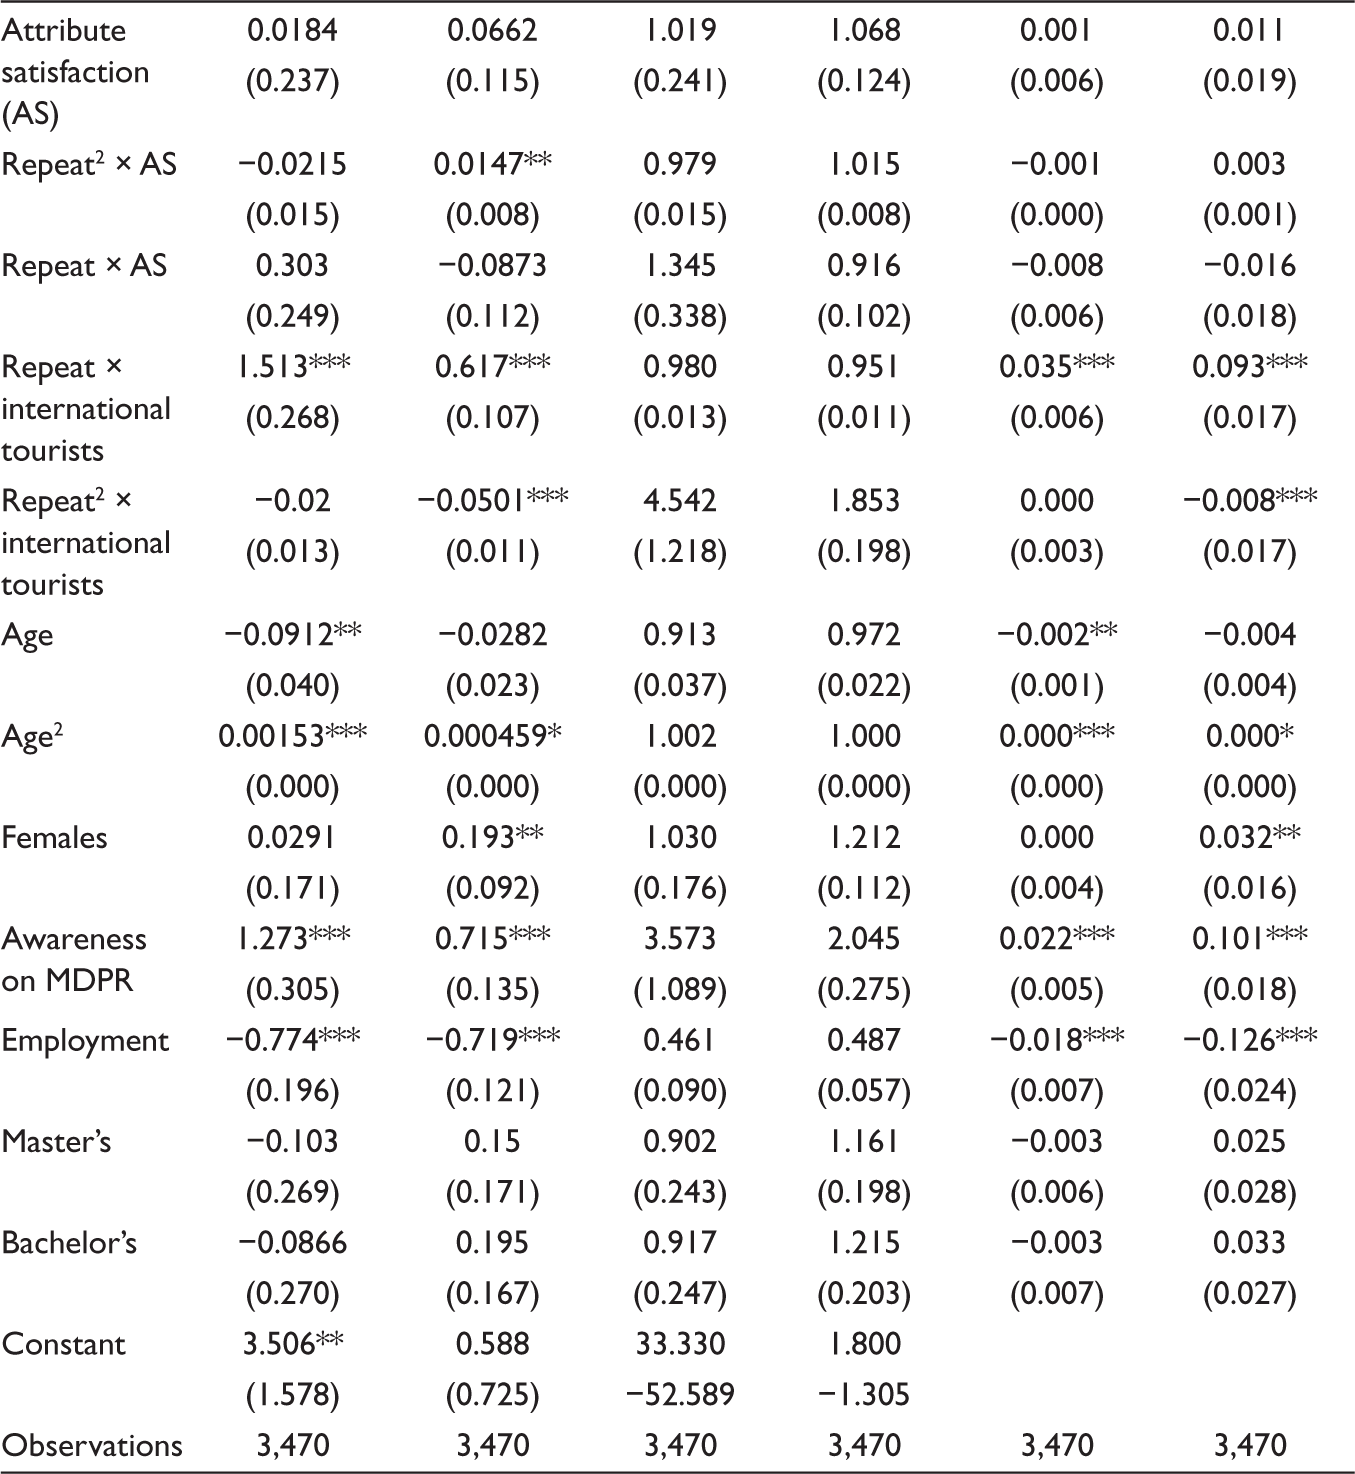
Table 3 presents the multinomial logistic regression analyses results. The likelihood ratio chi-square test, LR (16) = 494.61 (prob. > χ2 = 0.0000) indicates that at least one of the predictors’ regression coefficient is not equal to 0 in the model propounded. The McFadden’s pseudo-R2 revealed that the proposed model containing predictors represented about 9.88% improvement in fit relative to the null model. The response variable, ‘revisit intention’ was grouped into an order of three (unlikely, undecided, and likely) using top box method. The answers of ‘very likely’ and ‘likely’ were grouped as ‘likely’ and coded as 3; the responses of ‘very unlikely’ and ‘unlikely’ were clubbed as ‘unlikely’ and coded as 1. In a similar vein, the response of ‘undecided’ was coded as 2. The baseline category or the referent group state automatically got identified as ‘likely’ category of the dependent variable.
Multinomial Logistic Regression Analyses
Quadratic Relationship Between Repeat Visits and Revisit Intentions
First, the predictor repeat visitation is positive and significant (βRepeat = −0.069, p < 0.01) in the category (comparison group), ‘unlikely’ indicating that for each one unit increase on this variable, the log-odds of a tourist falling into this category relative to the referent category (base outcome) and ‘likely’ is predicted to decrease by 0.069 units. This entails that return tourists are less likely or are at lower risk of falling into the category ‘unlikely’ and at greater risk of falling into the referent category ‘likely’. Conversely, the relative risk ratio (RRR = 0.067) indicates that for each one unit increase on this variable, the risk of falling into the ‘unlikely’ category relative to the risk of belonging to the ‘likely’ category is predicted to change by a factor of 0.067. On the other hand, the same predictor in the comparison group ‘undecided’ is insignificant.
One of the objectives of this study is to check for the optimal number of previous visits that maximizes tourists’ revisit intention. This study, therefore, is aimed at identifying the relationship between the numbers of repeat visitations to Bhutan and revisit intentions. To this end, a quadratic—repeat2—and linear term—repeat—had been included in the model. The results of the model revealed that both quadratic and the linear terms were significant (βRepeat2 = 0.003, p < 0.05; βRepeat = −0.069, p < 0.01) under the comparison group ‘Unlikely.’ This, in other words, implies that the revisit intentions of those tourists who visited Bhutan before increases as the number of their return visitation increases to a certain level and then starts to decline. This lucidly shows that there exists an optimal point, which, in this case, is the number of previous visits that maximizes tourists’ revisit intentions. To this effect, the hypothesis H2 is supported by the results. The optimum number that maximizes the tourists’ revisit intention (RI) to Bhutan can be computed as shown in the following equation. The quadratic equation can be derived from the model as follows:
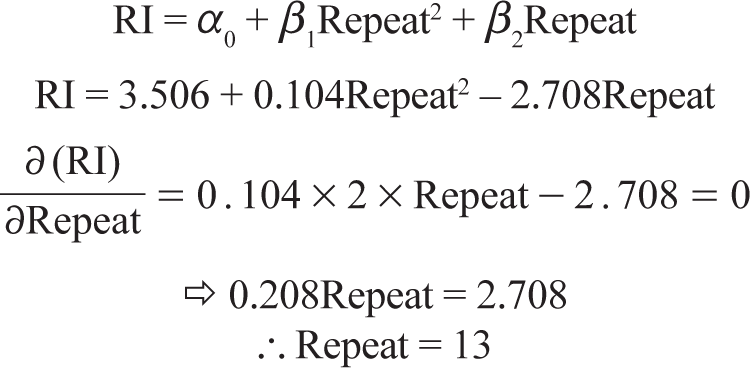
From the aforementioned calculation, when the number of repeat visits was taken into consideration, it was revealed that 13 visits to Bhutan maximized tourists’ revisit intentions.
The Direct and Moderating Effect of Attribute Satisfaction on Revisit Intentions
This study seeks to establish a positive influence of attribute satisfaction on revisit intentions. The attribute satisfaction is computed taking the mean value of 20 indicators that describe 5 service attributes. viz. services and facilities, accommodation, transport system, accessibility to services and guide services. Results of the multinomial logistic regression analyses presented in Table 3 suggest that an attribute satisfaction had no significant influence on the tourists’ revisit intentions, thus leading to rejection of the hypothesis H1. However, similar to the recent study on the moderating effect of satisfaction on repeat visitations (Park et al., 2019), this study also confirmed the significant moderating role of attribute satisfaction on repeat visits and revisit intentions as hypothesized (H3) under the comparison group ‘Undecided.’ Prior to proceeding with the analysis, the interaction terms (repeat2 × attribute satisfaction and repeat × attribute satisfaction) were included as explanatory variables. Result reveals that only an interaction term (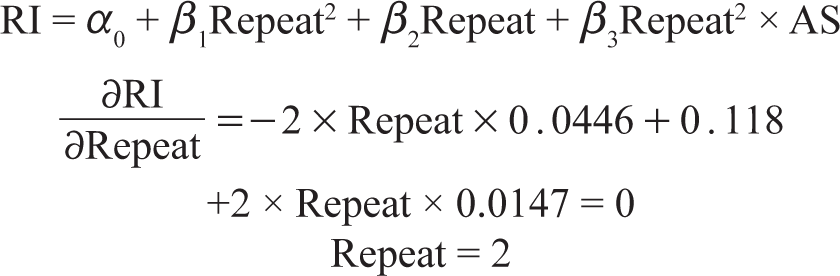
The above-mentioned results indicate that the optimal number of repeat visitations for satisfied tourists is 2 visits.
Safety and Perceived Value of Money as Influential Factors on Revisit Intentions
This study premises on factors such as number of repeat visits, attribute satisfaction, perceived value of money and safety as influential factors for revisit intentions to Bhutan along with other control variables (age, category of tourist, employment and education). The multinomial logistic regression results comprise RRR and the marginal effects of each explanatory variable. The predictor—‘Perceived Value of Money’—is negative and significant (βPerceived value of money = −0.031, p < 0.01). Hence, for each one unit increase on this variable, the log-odds of an enticement of revisit intentions falling into the ‘unlikely’ category relative to the referent group is predicted to decrease by 0.031 units, suggesting that those tourists for whom perceived value of money commensurate with the tour experiences are at a lower risk of not revisiting the destination and at greater risk of falling into the category ‘likely’. Similarly, for each unit increase on this same predictor, the RRR indicates that the risk of falling into the ‘undecided’ category relative to the referent group is predicted to change by a factor of 0.507. On the contrary, the predictor ‘safety’ is found to be insignificant. The interaction terms, Repeat × International tourists and Repeat2 × International tourists were significant (βRepeat × International tourists = −0.093, p < 0.01;
The control variable, ‘age’ was negative and significant (βAge = −0.002, p < 0.05;
Qualitative Findings
The qualitative results are compiled from the FGDs. The combination of single focus group (Morgan, 1996) and mini focus group (Kamberelis & Dimitiadis, 2013) are followed, whereby about six participants (tourism stakeholders) are involved. The moderation is carried out by the author. The qualitative results in this section are further augmented with the information from the highlight column, whereby tourists are made to highlight some of their memorable experiences.
The subsequent subsection provides findings from FGD with the officials of TCB and Guide Association of Bhutan.
Concern Over Unprofessional Conduct of the Tourism Business
The focus group members unanimously raised the serious concern on the undercutting tourist package rate, which reduces the inflow of overall revenue, causing skewed distribution of tourists among travel agents. The group members suggest to the TCB, which is an apex tourism regulatory body, to come up with a mechanism to make payments directly to those service providers hired by the tour agents:
I think it is high time that Tourism Council of Bhutan needs to curve under-cutting rates maneuvered by Bhutanese travel agents with their counterpart agents outside Bhutan. I would suggest TCB to make payments directly to guides, hoteliers, transport service providers, local business people involved in tours and treks upon submission of bills for payment by the concerned travel agent. This will curve the under-cutting rates, which as of now is concealed through full payment arrangements made by both the counterpart agents and at times by the tourists themselves in conjunction with agents. (Travel agent owner, 48 years, male; travel agent owner, 38 years, female; official of GAB, 36 year, male; TCB official, 42 years, male)
Compromised Tourist Services
Some focus group members raised the concern regarding the offer of poor and compromised tourist services that might cause Bhutan’s image as tourist destination, which, in turn, will have detrimental effects on revisit intentions:
The travel agents prearrange their tour operations with their relatives who own sub-standard hotels, lodges, and transport services and do not avail the professional services from other sources. Even the simple case of shopping souvenirs, Bhutanese products and so forth are dictated to the tourists, usually directing them to the tour agents’ friends and relatives. This will compromise the quality of services. So, tour guides and travel agents’ managers need to be trained by the concerned authority on the professionalism of conducting travel businesses. (Travel agent owner, 36 years, male; GAB member, 38 years, female; TCB official, 35 years, female)
Future of Tourism Industry
Similarly, the following illustrative quotation from the focus group pertains to the long-term issues raised, concerning the future of Bhutanese tourism industry. A few members indicated to the TCB to come up with relevant policy to curb the conduct of unprofessional businesses by many travel agents in Bhutan. Some focus group members suggested for the TCB to provide relevant trainings to the travel managers and marketers to enable help in overcoming limitations on conducting professional travel business. This, some members believed, would not taint the country’s image, leading to enticement of revisit intentions:
The travel agents of Bhutan today are solely thinking of their revenues and not at all concerned about the image of the country, jeopardizing the future of tourism industry. The TCB should pin down some of them leading to cancellation of the tour license if found conducting unprofessional tourism business deemed not in accordance with the tourism policies. As an antidote to this, there has to be constant refreshers’ course for the travel agent owners. Guides are too young and unprofessional. To live up to the TCB’s slogan of tour guides as the forefront ambassador of Bhutan to the outside world’s people, the qualification of tour guides need to be updated. (GAB official, 35 years, male; travel agent owner 38, male)
In a similar vein, statements ad verbum from the comment column is presented in this section.
Destination Image
Majority of the tourists highlighted Bhutan as a destination of their choice and pigeonholed their experiences with particular tourist hotspots, viz. ‘Tiger’s Nest’, ‘Punakha Fortress’, ‘Crane Valley’, ‘Dochula Pass’, ‘festivals and people’, ‘trekking routes’ and ‘Meeting with King during Festivals’. Following are some of the verbatim accounts of the tourists extracted from the comment column:
Impressive with richness of the culture and learning about Gross National Happiness. People and place are safe in Bhutan. (International tourist, 66 years, female) Will like to visit again but the package rate was quite expensive. Also there are narrow roads and lot of stray dogs around. (International tourist, 50 years, male) Provide more accessible for information regarding Bhutan like brochures, notice board and sign board. (Regional tourist, 46 years, male) Need toilet on highway. (Regional tourist, 45 years, female) Improve public restroom.” (International tourist, 45 years, female)
Theoretical Implications
Sustainability of tourist destination is affected by tourists’ revisit intentions (Kusumawati et al., 2020), and it has been found less costly to retain the old customers than enticing the new ones (Thomas, 2001). Conversely, retention of the same tourists through inducement of exalted revisit intentions could be a lucrative approach for Bhutanese tourism industry in terms of both sustainability and revenue earnings. This study, therefore, exposits a new case of tourism industry in Bhutan, using a new set of data, employing an appropriate method in exploring the nexus between revisit intentions and the factors associated with it, as well as the optimum number of visits that would maximize repeat visitations.
At the outset, this study reinforces the quadratic relationship between repeat visitation and revisit intentions, thereby extending the tourism destination literature vis-à-vis extending the previous studies (Park & Jang, 2014; Park et al., 2019) on the optimum number of repeat visitations that maximized the revisit intentions. The results of this study have shown beyond doubt that the revisit intentions keep increasing to its optimum and reaches the point of no change and then starts to decline. Precisely, about 13 visits to Bhutan maximized the repeat visitations. Subsequently, the moderation effect of satisfaction on revisit intentions has been least explored by previous authors (Park et al., 2019), which this study has corroborated in line with the arguments of Park et al. (2019). The results confirm most of the posited hypotheses. Contradicting many previous studies (Chi, 2011; Chi & Qu, 2008; Simpson et al., 2020), this study reveals that tourist satisfaction derived through different service attributes at the destination does not significantly influence the revisit intentions. Similarly, this study reveals that the tourists’ post-travel risk perception was positively related to revisit intention. The coefficient of the same was highly significant. This finding is in line with the previous findings of An et al. (2010), Artuğer (2015) and Mawby et al. (2021). Bhutan is known for reasonable hospitality in the region and is viewed as a country whose development philosophy is vested upon ‘gross national happiness’. Towards this end, the place is conjectured safe by many visitors till date. This good image of Bhutan as a tourist destination can entice revisit intention. This is also in line with the qualitative finding from the highlight column, ‘Impressive with richness of the culture and learning about Gross National Happiness. People and place are safe in Bhutan’ (international tourist, 66 years, female). In terms of ‘perceived value of money’, the results have shown that the perception of revisit intention would decline significantly. This is an interesting finding that goes well with the persistent complaints that tourists had on the tariff levied by the TCB. The council has fixed a daily minimum tariff called MDPR for the international tourists. During the peak season, international tourists are mandated to pay US$250 per day and US$200 during the lean season. This fixation of MDPR is in line with Bhutan’s tourism policy of ‘High Value, Low Volume’ (Bhutan, 2019). In addition, this study has revealed negative effect of MDPR levied on the revisit intentions. This finding is corroborated by the qualitative finding, ‘Will like to visit again but the package rate was quite expensive’ (international tourist, 50 years, male). This again brings into the realm of discussion and public policy on tourism regarding the efficacy of the high-value and low-volume model meant to promote sustainable tourism based on the premise of protection of culture and environment of Bhutan. This is all the more important in the context of rising unemployment rate in Bhutan. The Labour Force Survey conducted in November–December 2020 showed that unemployment rate increased drastically to 5%.
Eventually, the findings of this study in the context of Bhutan are a first of its kind and can be used as a baseline for checking the current model with fresh data, especially for comparative studies in the future.
Managerial Implications
The findings of this study comprises number of pragmatic implications that certainly demand action. The players in the Bhutanese tourism industry, especially the destination managers and marketers, need to pay attention to the optimal point of repeat visitations and the change of trajectory thereafter. This could herald the future arrivals of tourists, and the destination could embark on new tourism blueprints, based on the emerging demands. Tourist destinations across the globe are fiercely competitive, and restructuring and redesigning of tourism infrastructure to meet with everlastingly emerging new demands are of paramount importance to Bhutan.
Another conspicuous finding of this study is the perceived value of money having positive and significant relationship with revisit intentions. Bhutan has been stringently following the tourism mantra of ‘High Value, Low Volume’ ever since the country has opened its doors to the outside world in 1974—tourism as the context. Tourism industry in Bhutan is expected to generate employment and be the doorway of foreign exchange earnings. However, compromising with volume may jeopardize the industry’s envisioned positive force in attaining these aforementioned objectives. The qualitative findings also reveal that tour guides are the bad forefront ambassadors of Bhutan. Therefore, the TCB should come up with revision of this policy to suit the emerging tourism marketing scenarios. On the other hand, tourists’ post-travel perception of risks is positively related to their revisit intentions, which certainly needs attention. Risk perception and safety in a destination are proven to be the visitors’ push factor and pull factor, respectively, for the destinations. The findings from this study concur with the previous findings (An et al., 2010; Mawby et al., 2021; Prashyanusorn et al., 2010). Hence, destination managers in Bhutan must ensure to maintain the existing safe atmosphere and plan measures to overcome the changing environment.
Finally, the control variables such as gender, age, category of tourists, employment status and MDPR, except education, were found to have significant effects on revisit intentions. As compared to males, this study found that female tourists perceived fewer revisit intentions. This may be attributed to the level of safety environment existing in Bhutan for females. This study also revealed that international tourists perceived higher revisit intentions than regional tourists. The international tourists who visit Bhutan are usually high-end tourists who could afford repeat visitation. This empirical finding opposed the descriptive finding, indicating that regional tourists were simply modest in expressing their revisit intentions. In a nutshell, the destination managers and marketers of Bhutan need to keep abreast of the ever-changing world, which could be termed precisely as volatility, uncertainty, complexity and ambiguity (VUCA) world.
Limitations and Future Areas of Research
This study is not devoid of limitations. There could be other lurking variables as well that may have better moderating effects on revisit intentions than the one chosen for this study. For instance, the ease of travel attributed to air and land transports could be other factors influencing revisit intentions. Therefore, for generalization of the findings of this study, it would be interesting if future researchers could collect fresh data and run this same model augmenting it with new variables. In addition, for comparability, future research could use the same survey instrument.
Footnotes
Acknowledgements
The authors express their deep gratitude to the Tourism Council of Bhutan for sharing the primary data set without which this study would not have been possible.
Declaration of Conflicting Interests
The authors declared no potential conflicts of interest with respect to the research, authorship and/or publication of this article.
Funding
The authors received no financial support for the research, authorship and/or publication of this article.