



Abstract
The study examines the evolution of the stock market efficiency of Indian banks during the period from 1 January 2007 to 30 June 2022. The study also seeks to investigate the degree of the impact of the different crises on the stock market efficiency in response to three major events: the global financial crisis, the local banking crisis and the pandemic crisis. For this, the wild bootstrap automatic variance ratio (WBAVR) test is applied using the rolling window method to account for the implications of the adaptive market hypothesis (AMH). For the robustness of the analysis, the study applies the automatic portmanteau (AQ) test, which is also based on a data-driven procedure. The findings show that the market efficiency of Indian banks is not an all-or-nothing phenomenon; rather, both efficiency and inefficiency co-exist simultaneously, with the Central Bank of India noted to be the most ‘inefficient’ bank. The findings demonstrate that market efficiency is ‘context-dependent’, that is, the stock market efficiency significantly alters in response to black-swan events happening in the economy. The study sheds light on the degree of the impact of different events on market efficiency, and it is shown that the internal crisis of the industry of high NPAs has a far greater impact on market efficiency compared to the global financial and pandemic crises. This research may assist policymakers in developing a comprehensive strategy to enhance the stock market efficiency of Indian banks in the face of such local and global crises.
Keywords
I. Introduction and Conceptual Framework
The dynamics of stock market efficiency explain the existence or absence of arbitrage opportunities (Rodriguez et al., 2014; Urquhart and McGroarty, 2016; Shahzad et al., 2018). Market efficiency indicates the speed at which stock markets reflect all available information. In this regard, Fama (1970) provided three concepts of efficient market hypothesis: weak, semi-strong and strong hypothesis. The weak form of the efficient market hypothesis (EMH) suggests that the current prices of the stocks embed the historical prices and information so that there is no scope for forecasting future prices (Fama, 1970). Therefore, stock markets are assumed to be normally and sequentially distributed, whereby no market participant can make abnormal profits (Hull & McGroarty, 2014). A number of studies have attempted to examine the integrity of this weak form of EMH in the context of financial markets across the world (see, for instance, Lim et al., 2008; Lagoarde-Segot & Lucey, 2008; Borges, 2010; Rejichi & Aloui, 2012; Mobarek & Fiorante, 2014; Abakah et al., 2018). However, this empirical estimation of the weak form of EMH suffers from two major drawbacks: first, this method examines if the market is efficient over the whole sample period based on the assumption that market efficiency is an all- or-nothing situation (Campbell et al., 1997), and second, the method does not allow to examine the evolution of the market efficiency, that is, it posits a steady degree of market efficiency over time.
In order to convey that market efficiency and inefficiencies co-exist in a logically consistent manner, Lo (2004, 2005) introduced the concept of the Adaptive Market Hypothesis (hence, referred to as the ‘AMH’). The AMH permits gradual market efficiency development as opposed to an all-or-nothing situation. This approach reinforces the perspective that return predictability evolves over time with the changing market conditions and profit opportunities (Lo, 2004, 2005). Consequently, AMH has two implications for the financial markets’ efficiency: first, market condition is not an all-or-none condition but is a characteristic that continuously varies over time; and second, market efficiency is highly context-dependent (Lo, 2004), that is, the degree of market efficiency is affected by the market condition. In the context of financial and commodity markets, literature abounds with evidence for the time-varying return predictability of stock returns, showing that various black swan events, such as wars, economic and political crises, financial crises and pandemics cause deviations in the fundamental prices of the stocks and thus alter their predictability (Khediri & Charfeddine, 2015; Kim et al., 2011; Rahman et al., 2017). But little is known about how the stock market efficiency of banks has evolved over time and how different market conditions and crises affect it. In fact, to the best of the author’s knowledge, no such study exists exploring the evolution of the stock market efficiency of the banking sector in response to various endogenous and exogenous events occurring in the local and global economy.
The present study makes the first attempt to test AMH and its implications in the context of the stock performance of the banking industry. Specifically, the study tests the two implications by examining how the stock market efficiency of Indian banks has evolved over time from 2007 to 2022 and how it has been affected by endogenous and exogenous events happening in the local and global economy. Specifically, during the study period, the banking industry of India has gone through three major events: the global financial crisis (2008–2010), the local banking crisis of high NPAs (2013–2017) and the global pandemic crisis of coronavirus (2020–2022). Hence, the Indian banking industry provides a good example for analyzing the evolution of market efficiency and the implications of the AMH in light of different events. To achieve these research objectives, the study individually ascertains the stock market efficiency of the individual banks during the period from 1 January 2007 to 30 June 2022. The study employs the wild bootstrap automatic variance ratio (WBAVR) test of Kim (2009). The test yields reliable estimates in the presence of autoregressive conditional heteroscedasticity (ARCH), non-normal distribution and small sample size (Charles et al., 2011). Specifically, the WBAVR test is applied using the rolling window method, which posits numerous advantages over the traditional method of applying the WBAVR test. First, it allows for analysis of the dynamic variations in the return predictability or efficiency of the market. Second, it helps in accounting for the structural changes in the time series, and therefore, there is no need for distinctly examining the structural changes in the series (Lazăr et al., 2012). Third, this method mitigates the issues of data snooping bias (Rahman et al., 2017). And finally, the findings of the test are not sensitive to the length of the window (Charles et al., 2017; Khuntia & Pattanayak, 2018; Kim et al., 2011). For the robustness of the analysis, the study applies the automatic portmanteau (AQ) test of Escanciano and Lobato (2009), which is also based on a data-driven procedure to compute the test statistics.
This way, the study significantly contributes to the literature on stock market efficiency in a number of novel ways. First, the present study considerably differs from the previous studies that made attempts to investigate the impact of the pandemic on the stock markets in India. For instance, Mishra and Mishra (2020), Dhall and Singh (2020) and Loang and Ahmad (2022) have assessed the herding behaviour of stock markets in response to the pandemic in Asian countries and Bhatia (2022) evaluated the implication of AMH in the Indian stock market during the pandemic period. Using Quantile regression, Mishra and Mishra (2021) demonstrated return volatility in the stock markets of public banks in India over the pandemic period from August 2019 to July 2020. In fact, to the best of our knowledge, this is the first study to conduct an empirical investigation of the stock market efficiency and the implications of the AMH in the Indian banking industry using a longitudinal data from 1 January 2007 to 30 June 2022. For this, the study employs a robust and contemporary technique of the rolling window method of WBAVR and AQ. Moreover, the industry has experienced both local and global financial crises and pandemic crisis during our sample period; therefore, it necessitates distinguishing how the stock market efficiency of banks responds to these events.
Second, a number of studies have provided evidence that the occurrence of events, such as wars, crises, depression, shocks, pandemics and exchange rate regimes cause disruptions in the efficient market hypothesis (see, for instance, Kim et al., 2011; Bhatia, 2022). Therefore, the study significantly complements this group of studies by specifying information on the degree of the impact of three different events. This study specifically identifies the events that have the greatest and least significant influence on the predictability of return on the stocks of banks.
Third, the study has useful implications for the policy-makers and investors to understand how the stock market efficiency of individual banks reacts to the different events happening in the local and world economy. The study also provides a ranking of the banks based on the number of times the stock markets of banks have experienced inefficiency. No previous attempt exists in the literature to rank the Indian banks based on their return predictability efficiency. Therefore, the study significantly adds to the stock of literature examining the stock market efficiency in financial, commodity and foreign exchange markets by providing the first-ever evidence from a banking sector. Additionally, it expands our knowledge of how high NPAs negatively affect stock market efficiency in addition to their impact on financial performance and the efficiency of banks.
The rest of the article proceeds as follows. Section II provides a review of related literature. Section III explains the data and the methodology. Section IV presents and discusses the empirical findings of the study, and Section V provides the conclusion and policy implications.
II. Review of Related Literature
A number of research studies have attempted to test the implications of AMH for stock markets across the world. For instance, Lim and Brooks (2006) examine the stock market efficiency of both developed and emerging economies. Using the Portmanteau bi-correlation test statistic and rolling sample approach, the study shows that market efficiency changes cyclically over time. Likewise, Ito and Sugiyama (2009) find considerable variations in the market efficiency of the S&P 500 returns. Kim et al. (2011) also provide evidence for oscillations in the market efficiency of daily and weekly DJIA by employing sub-sample windows. Additionally, they show that return predictability is more severely affected during economic and political crises but not during market crashes.
Smith (2012) also provides evidence for AMH for the emerging stock markets of European nations. Lim et al. (2013) and Ito et al. (2016) show oscillating return predictability of the US indices using the rolling window WBAVR and time-varying autoregressive tests, respectively. Noda (2016) also tested the implications of AMH using a time-varying autoregressive approach for two Japanese stock markets. Dyakova and Smith (2013) provided evidence of AMH for Bulgarian stock markets using the rolling window method. For African markets, Smith and Dyakova (2014) tested the stock markets’ predictability using variance ratio tests.
Thus, the following are the primary observations from the literature review. First, a few attempts have been made to explore the implication of AMH for the foreign exchange market (Aslam et al., 2020; Ning et al., 2018; Shahzad et al., 2018) and commodity market (Charles & Darne, 2009; Charles et al., 2015; Ghazani & Ebrahili, 2019). Second, the literature provides ample evidence for the significant impact of various black swan events, such as wars, economic and political crises, financial crises, depressions, shocks and pandemics on the fundamental prices of the stocks and therefore alter their predictability. For instance, Kim et al. (2011) showed that US stock markets have become highly predictable during an economic and political crisis. Likewise, Ito et al. (2016) exhibited the inefficiency of US stock markets during recession periods. Zhou and Lee (2013) also showed that the market efficiency of Real Estate Investment Trusts (RIETs) displays significant improvements with the regulatory changes and market development.
Khediri and Charfeddine (2015) also found a significant role in prevailing economic and political conditions in determining the efficiency of the energy markets. Rahman et al. (2017) showed that the efficiency of the equity market of India, Sri Lanka, Bangladesh and Pakistan is significantly altered by the level of market development, crisis, volatility and trading mechanism. More recent studies have attempted to assess the impact of the pandemic crisis on the herding behaviour of stock markets (Dhall & Singh, 2020; Loang & Ahmad, 2022; Mishra & Mishra, 2020; 2021) and on stock return predictability (Bhatia, 2022; Bhuyan et al., 2020; Ozkan, 2021; Topcu & Gulal, 2020).
And finally, in the context of India, few recent studies have attempted to explore the changes in stock market behaviour following the pandemic crisis. For instance, Mishra and Mishra (2020) assessed the behaviour of selected Asian stock markets (including India) and showed the stock market volatility during the pandemic. Dhall and Singh (2020) investigated the herding behaviour of Indian stock markets from 2015 to 2020 and demonstrated the formation of herding behaviour during the post-covid period. Bharti and Kumar (2021) showed the herding tendency of the Indian stock market during the covid period, but their findings simultaneously revealed that the government’s control measures have been successful in curtailing the herding behaviour. Bora and Basistha (2021) exhibited that during the pre-covid period, stock returns of Indian markets were larger than during the pandemic period. Okorie and Lin (2021) showed that the Indian stock market had become more information inefficient after COVID-19. Sahoo (2021) also investigated the impact of the pandemic on the stock market of India and showed negative returns during the period. Bhatia (2022) investigated the impact of the pandemic on the stock market efficiency of India during the multiple break periods and showed that the stock market deviates from efficiency, specifically during the nationwide lockdown and peak periods of coronavirus cases in India.
Mishra and Mishra (2021) examined the herding behaviour of banks using quantile regression and demonstrated return volatility in the stock markets of public banks in India over the pandemic period from August 2019 to July 2020. Furthermore, research has been done to explore the implications of endogenous and exogenous crises on the efficiency of Indian banks. The studies have shown the significant adverse impact of high NPAs and financial crises on the efficiency of Indian banks (for instance, Gulati, 2022; Gulati & Kumar, 2016; Kumar et al., 2016). Nevertheless, despite the importance of the Indian banking sector and the recent crises it has experienced, the literature has never looked into the development of market efficiency in the Indian banking stock market over time and how different market conditions and crises affect it. Therefore, this article attempts to fill these research gaps and significantly contribute to the literature on stock market efficiency by examining how the stock market efficiency of Indian banks has evolved over time from 1 January 2007 to 30 June 2022. Table 1 lists the selected prior studies on the Indian stock markets and illustrates how the present study complements the existing literature on the subject.
Selected Studies on Assessing the Stock Markets in India.

Accordingly, to achieve the above-mentioned research objectives, the following hypotheses are set for this study following the literature and given the recent episodes of crises:
III. Data, Preliminary Analysis and Methodology
Data and Preliminary Analysis
This section describes the data and provides some preliminary information about the returns of Indian banks. The analysis covers 34 domestic Indian banks (20 public sector banks and 14 private banks) during the period from 1 January 2007 to 30 June 2022. However, a few public sector banks were merged in 2019 and 2020; therefore, the total number of observations differs for the banks. Daily data on the closing prices of the stock markets of the banks are collected from the website of the National Stock Exchange (NSE). The returns for each bank are computed using the following formula:

where ln() indicates the natural logarithm and closing price it and closing pricei, t–1 are the closing prices of ith bank in tth and (t – 1) th time, respectively.
The descriptive statistics of these series are reported in Table 2. It is noted that the average stock returns of most banks are negative, specifically those of public sector banks. Only a few banks, such as Indian bank, Axis bank, DCB, IndusInd bank and Kotak Mahindra bank have reported positive average returns during the study period. From the values of standard deviation, Yes bank is noted to be the highest volatile bank, and Punjab & Sind bank is the least volatile. Additionally, all the series are not normally distributed with non-zero skewness and excess kurtosis, which is also confirmed by the statistically significant value of the Jarque Bera test. Further, the estimates of the Augmented Dicky Fuller test of Unit Root depict the stationarity of all the bank series during the sample period as the null hypothesis of the presence of unit root is rejected at a 1% level of significance. It confirms the direct application of these series in the analysis without any further transformations.
Descriptive Statistics.


Methodology
A WBAVR test by Kim (2009) and an AQ test by Escanciano and Lobato (2009) are employed in this study to investigate the evolution of the stock market efficiency of Indian banks. Both these tests overcome the major problems of conditional heteroscedasticity and arbitrary decision of the lag length in the Variance ratio test of Lo and MacKinlay (1988), the Qk test of Box and Pierce (1970), and Chow and Denning (1993) test. Specifically, the estimates of each of these tests outperform other tests in terms of power and size and are robust in the presence of ARCH, small sample sizes and non-normal distribution (Charles et al., 2011). Though the wild bootstrap method computes the test statistics in the same manner as in Chow and Denning’s (1993) test but former uses a data-dependent method to calculate optimum lag length and therefore is robust in the presence of both linear and nonlinear dependence (Charles et al., 2011). A detailed discussion on these tests is provided in the subsequent paragraphs.
Specifically, to examine the efficiency of stock returns, the following statistical version of the variance ratio (VR) test is utilized:
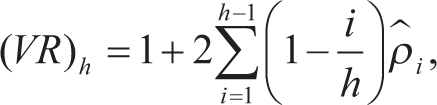
whereby h and
Thus, following Kim (2009), the following steps are adopted to apply the wild bootstrap AVR test:
Step 1: A bootstrap sample using T observations is formed as: returns*
t
= μt (returnst) for t = 1, 2 …T and μt is a random variable with E(μt) = 0 and Var (μt) = 1 Step 2: Next, the automatic variance ratio test statistic is computed from returns*
t
as: Step 3: Finally, the first two steps are repeated B (= 500) times so as to form a bootstrapped distribution of form:
The WBAVR test is applied using the rolling window method. This method has various advantages over the traditional method of applying the WBAVR test. First, it allows for analysis of the dynamic variations in the return predictability or efficiency of the market. Second, it helps in accounting for the structural changes in the time series, and therefore, there is no need for distinctly examining the structural changes in the series (Lazăr et al., 2012). Third, this method mitigates the issues of data snooping bias (Rahman et al., 2017). And finally, the findings of the test are not sensitive to the length of the window (Charles et al., 2017; Khuntia & Pattanayak, 2018; Kim et al., 2011).
The study adopts the following procedure for the rolling window. First, the WBAVR is applied in the first sub-sample window of 300 observations using the procedure discussed in the above section. Second, the window is moved one daily observation forward, and the same procedure is applied for applying the WBAVR test. The procedure is followed until the end of the sample period and, in this manner, the probability values (p-value) for each sub-window are obtained.
The computed
For the robustness of the analysis, the study also applies an alternative test of the Automatic Portmanteau (AQ) test of Escanciano and Lobato (2009) which also uses the data-based procedure to compute the optimum holding period. Specifically, the lag length is chosen using Akaike and Bayesian information criteria (AIC and BIC). Given its asymptotic property of chi-square distribution, the approach of AQ statistic does not require further bootstrapping to compute critical values. The computed AQ statistic is compared with its corresponding critical values to reject/or not reject the null hypothesis of market efficiency. Notably, to reject the null hypothesis of no-return predictability, the calculated probability value must be greater than the level of statistical significance.
IV. Empirical Findings
Table 3 reports the estimates of the WBAVR test for 34 Indian banks for the full sample period from 1 January 2007 to 30 June 2022. The WBAVR test strongly rejects the null hypothesis of no predictability for 24 Indian banks, thereby providing evidence for the ‘inefficiency’ of the stock markets. While 10 other banks are revealed to be weak form efficient as the null hypothesis of no returns predictability is not rejected for the full sample period (see probability values in Column 2 of Table 3). However, to test for the implications of the Adaptive Market Hypothesis, the study employs the rolling sub-sample window analysis. Here, the WBAVR test is applied using the rolling fixed-length sub-sample window method. A fixed rolling length of 300 observations is used, that is, first, the WBAVR test is applied to the first sub-sample window, then one daily observation is added to the window, and the WBAVR test is reapplied to the data to obtain the corresponding probability values (p-values) of each window. The procedure is repeated until the end of the sample period. The literature has shown that the findings are not sensitive to the length of the rolling window (Charles et al., 2017; Khuntia & Pattanayak. 2018; Kim et al., 2011).
The Proportion of Times the Efficient Market Hypothesis is Rejected.


Using the derived probability values from this rolling window procedure, the information on the number of times rejection of the null hypothesis is provided in Column 3 of Table 3. It shows the proportion of times the stock market of a bank has become inefficient or predictable, that is, the null hypothesis of no return predictability is rejected at a 10% level of significance for each rolling window. It is found that for the Central Bank of India, the WBAVR test rejects the null hypothesis in 51% of the total rolling windows, which is reported to be the highest in the study. Thus, the bank is noted to be the most inefficient bank in terms of return predictability during the study period. It might be because of the bank’s plunging financial ratios including minimum regulatory capital and increasing net non-performing assets (Reserve Bank of India, 2017). Indeed, the bank is among the list of banks on which RBI had imposed Prompt Corrective Action (PCA) in 2017 in lieu of high net NPAs and negative return on assets (ROA). The ranking is then followed by the United Bank of India (46%), HDFC Bank (46%), Punjab & Sind Bank (39%) and Allahabad Bank (37%). Among the top ten inefficient banks, seven belong to the public sector bank group, and only three belong to the private bank group. On the other hand, private banks lead the list of least ‘inefficient’ banks, with seven private banks ranking in the bottom ten and only three public sector banks. Notably, the least inefficient bank is found to be IDFC Bank, which experiences the rejection of the null hypothesis of no-return predictability in only 4% of the total rolling windows during the study period. Though IDFC bank has a poor track of ROA, but it has a good coverage ratio, capital adequacy ratio and price-to-book value ratio, which are even higher than the average of private sector banks. The list is then followed by the Bank of Baroda (9.4%), ICICI Bank and Lakshmi Vilas Bank (10% each).
In all, the Table shows that all the banks have shown some instances of market inefficiency, thereby producing evidence for the first implication of the AMH. Additionally, the banks, which are found to be inefficient for the full sample are also ‘efficient’ in some of the periods. Thus, it suggests that neither a series is always predictable nor always unpredictable, which is inconsistent with the Efficient Market Hypothesis. These estimates of WBAVR are further strengthened by the AQ test of Escanciano and Lobato (2009), which is also applied using the fixed rolling window of 300 observations.
The evolving nature of market efficiency is also evident in the rolling WBAVR test statistics in Figure 1. The derived p-values from the rolling window procedure for each bank are plotted in Figure 1. A horizontal line is plotted at a 10% significance level, and any p-value that is below this horizontal line reveals the rejection of the null hypothesis of no-return predictability at a 10% significance level, thereby signifying the inefficiency of the market. It is found that all banks deviate from the market efficiency during some periods of the analysis. The market efficiency of Indian banks follows a time-varying pattern, which can be explained by the notion of AMH of Lo (2004) that market efficiency continuously evolves over time and across markets. It indicates that a weak form of market efficiency and an adaptive market hypothesis co-exist simultaneously, favouring our first hypothesis (H1) of evolving efficiency in the stock markets. Therefore, consistent with Bhatia (2022), Ito and Sugiyama (2009) and Lim and Brooks (2006), these findings highlight that market efficiency is not an all-or-nothing phenomenon; rather both efficiency and inefficiency co-exist simultaneously. Therefore, the study next attempts to investigate the second implication of the AMH, that is, market efficiency is ‘context-dependent’. Nevertheless, our finding contradicts those of Mobarek and Fiorante (2014), Rejichi and Alouli (2012), Lim et al. (2008) and Poshakwale (1996), producing evidence for weak-form efficiency. However, it is to be noted that this dissimilarity in the findings could be because of the different methods of analysis. Unlike the current study, these studies primarily employed Lo and MacKinlay’s traditional variance ratio tests (1988), which do not account for conditional heteroscedasticity, dynamic variations in the return predictability, and structural changes in the time series.
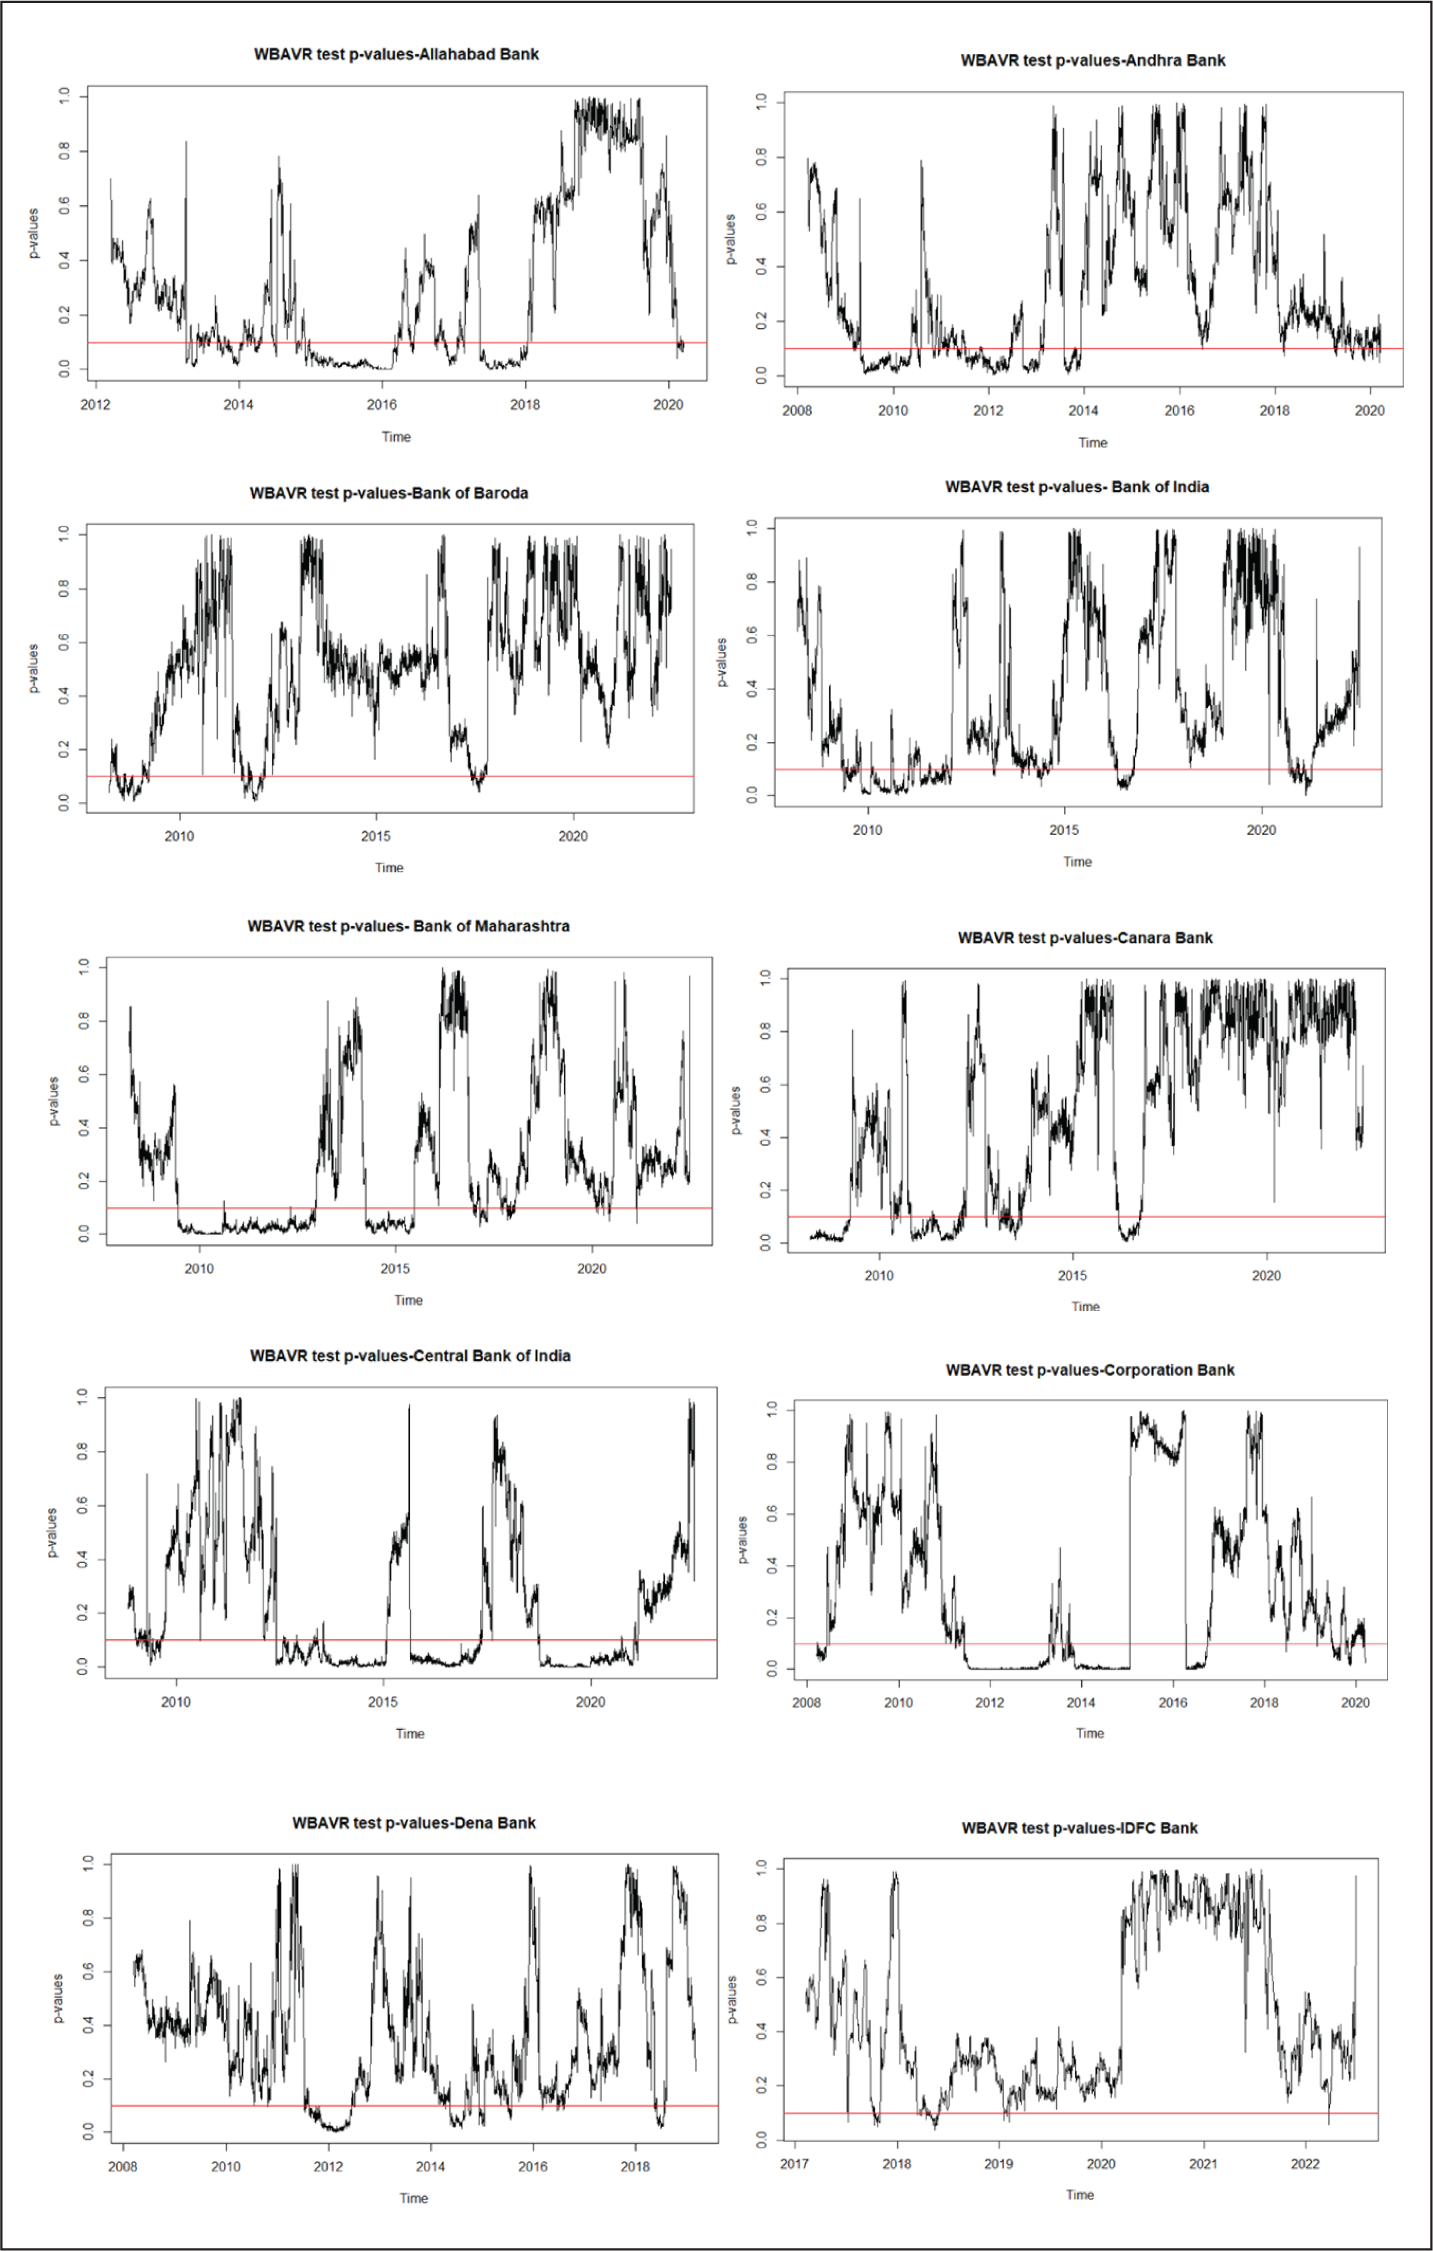


A deeper glance at the figures provides us with information about the time periods when the stock markets are becoming predictable. During our study period, three major events occurred: the global financial crisis, the local banking crisis and the global pandemic crisis. In line with the contemporary literature on the Indian banking industry in response to the global financial crisis (Eichengreen & Gupta, 2013; Gulati & Kumar, 2016; Kumar et al., 2016), the current analysis demonstrates that the stock market efficiency of Indian banks is not significantly affected by the financial crisis. It is indicated by the fact that fewer banks have p-values that are less than the 10% horizontal line. However, in the immediate post-GFC period (2009–2011), Indian banks’ stock markets have shown evidence of being inefficient. It could be a result of the pre-GFC years’ excessive lending to industries, the suspension of regulations on corporate loans, and deposit flight during and after the GFC (Eichengreen & Gupta, 2013). The episode of stock market inefficiency coincides with the period of sluggish lending growth and declining profitability in the years immediately following the crisis, owing to the excessive risk-taking behaviour of the Indian banks.
The next episode of return predictability is also closely related to the prevailing market and economic conditions. The stock markets became predictable and inefficient between 2013 and 2017 as seen by the respective p-values of most of the banks rejecting the null hypothesis of no-return predictability. During this period, the Indian banks were experiencing deteriorating asset quality and declining levels of profitability. This endogenous storm of high NPAs as a result of banks’ aggressive credit lending to stressed industries, particularly larger infrastructure projects with a protracted gestation period and more provisioning on past- due loans further deteriorated banks’ asset quality between 2013 and 2017 (Reserve Bank of India, 2017). And therefore, this adversely impacted the stock market efficiency of the Indian banks.
Finally, the WBAVR test rejects the null hypothesis of no return predictability during the global pandemic period, that is, from 2020 to 2022, for some of the banks, including Bank of India, Punjab & Sind Bank, Panjab National Bank, Syndicate Bank, UCO Bank, Union Bank of India, DCB Bank, IndusInd Bank, Jammu & Kashmir Bank, Karur Vysya Bank, South Indian Bank and Yes Bank. However, compared to the internal crisis of substandard lending and the global financial crisis, this global pandemic crisis has a smaller impact, as lesser instances of rejection of the null hypothesis are evident. It might be because of the various restructuring policies being adopted before and during the pandemic period, including mega-mergers of the banks to strengthen capital positioning, dividend reinvestment, COVID-19 provision, regulatory tightening, write-offs, loan moratorium, deferment of interest payments, among others that significantly aided in averting a big spike in the market efficiency of the banks. Additionally, with numerous governance provisions by the regulatory authorities, the governance structure of the banks significantly improved in the later years of the study (see Bhatia & Gulati, 2020). Therefore, the enhanced governance structure of the banks considerably aids in providing adequate oversight and scrutiny over banks’ risk and crisis management.
We cannot, however, categorically deny that the pandemic has had no impact on the efficiency of Indian banks’ stock returns. This might be the consequence of the rise in the bank frauds of PSBs in 2020 and of PBs in 2021 and a delay in the detection of the frauds owing to weak implementation of Early Warning Signals (EWS) (Reserve Bank of India, 2020, 2021). Therefore, the study’s findings contribute to the confirmation that various economic and non-economic crises have a major, negative impact on the efficiency of the stock market. Additionally, in line with those of Rahman et al. (2017) and Machmuddah et al. (2020), the study supports the claim that the intensity of the impact varies from crisis to crisis and supports the second research hypothesis (H2). According to this research, the internal industry crisis is the main factor that negatively affects market predictability, which is then followed by the global financial crisis and the global pandemic crisis.
V. Conclusion and Policy Implications
The notion of market efficiency has gained significant momentum, specifically with the advent of the pandemic crisis to ascertain its impact on the evolution of stock market efficiency. The contemporary literature provides ample evidence from financial, commodity and foreign exchange markets, but there is a dearth of any study exploring the evolution of market efficiency of the banking industry. Therefore, the present study provides the first attempt to investigate the evolution of the market efficiency of the stock markets of the Indian banking Industry, in response to different endogenous and exogenous events, during the period between 1 January 2007 and 30 June 2022. To examine the time-varying and context-dependent nature of the stock market, the study employs a rolling window method of the conditional heteroscedasticity robust test of WBAVR. The robustness of the analyses is performed using an alternative test of AQ. The findings from these tests suggest that the stock markets of the Indian banks are consistent with the implications of the Adaptive Market Hypothesis. Specifically, it is found that the market efficiency of Indian banks is not an all-or-nothing phenomenon; rather both efficiency and inefficiency co-exist simultaneously, with the Central Bank of India noted to be the most ‘inefficient’ bank. The findings further demonstrate that market efficiency is ‘context-dependent’, that is, the stock market efficiency or return predictability significantly alters in response to various black-swan events happening in the economy.
The study sheds light on the degree of the impact of different events on the market efficiency of the Indian banks’ stocks, and it is shown that the internal crisis of the industry of high NPAs has a far greater impact on the market efficiency, which can be explained by the direct effects of the banks’ aggressive credit lending to stressed industries, higher provisioning on past-due loans, lowering levels of profitability and declining asset quality on the banks’ stock performance. While the pandemic crisis imposes the least impact on the stock market efficiency of the Indian banks. It might be because of the various restructuring policies being adopted before and during the pandemic period, including mega-mergers of the banks to strengthen capital positioning, dividend reinvestment, COVID-19 provision, regulatory tightening, write-offs, loan moratorium, deferment of interest payments, among others that significantly aided in averting a big spike in the market efficiency of the banks. Therefore, the findings of this study considerably complement the existing literature by providing evidence that the stock market efficiency of banks is also not an all-or-nothing phenomenon; rather both efficiency and inefficiency co-exist simultaneously, and their predictability is significantly impacted by the different crises.
Therefore, this evolving and context-dependent nature of market efficiency has substantial implications. First, the study provides implications for the market participants that in accordance with the changing predictability, the investment plans should be revised to adjust future investment strategies. Thus, investors and other participants should adopt flexible investment plans so as to respond quickly to changing market conditions. Furthermore, by ranking the Indian banks’ stock market efficiency from the most inefficient to the least inefficient, the study provides information to the investors on where they can adopt some technical strategies apart from buy-and-hold positions to make profitable returns.
Second, the study provides implications for the policy-makers and regulators by providing information that various black-swan events occurring in the local and global economy exert adverse impacts on the stock market efficiency of the banking firms. Therefore, policymakers need to be proactive during such crisis periods to avoid the speculative and opportunistic behaviour of investors. For instance, they might create some recommendations requiring the disclosure of all pertinent information to confiscate asymmetric information among investors. Also, policymakers should ensure financial market stability to increase investors’ confidence and foster optimism in the market.
Third, the study provides implications for banking firms. Specifically, based on the findings that the local banking crisis of high NPAs has the most significant repercussions on the market efficiency, the study suggests that banks should strengthen their loan granting screening and oversight mechanisms of granting loans to reduce the risk of defaults. Additionally, there is a need to improvise the diligence of early detection of stressed assets so that they can be reviewed by the policymakers at an early stage before it impacts the stock market efficiency of the banks. Therefore, the present study significantly complements the existing literature on stock market efficiency. Additionally, it expands our knowledge of how high NPAs negatively affect stock market efficiency in addition to their impact on financial performance and the efficiency of banks.
This study has some limitations, which serve as the foundation for potential future directions. First, this article focuses only on the Indian banking industry. Future work could extend this to the banking sectors of other developed and developing economies. This would aid in making a comparison of how the stock market efficiency of banks responds to different endogenous and exogenous events. Second, this study explores the evolution of stock market efficiency, future research can considerably enhance the current study by offering some insights into the potential determinants of stock market efficiency. Finally, even though this study shows how ‘context-dependent’ Indian bank stocks are, more work needs to be done to investigate their cross-correlation with the commodities and foreign exchange markets.
Footnotes
Declaration of Conflicting Interests
The author declared no potential conflicts of interest with respect to the research, authorship and/or publication of this article.
Funding
The author received no financial support for the research, authorship and/or publication of this article.