
Abstract
Public sector banks have been merged by the government in the last few years. This is the rationale behind conducting this study. The purpose of this article is to determine the factors affecting the performance of public sector banks in India and the interrelationship between bank-specific determinants and performance of public sector banks. In this article, we shall analyse the financial data of all the public sector commercial banks for a period spread across 11 years (2009–2019); Capital adequacy, Assets quality, Management efficiency, Earning, and Liquidity (CAMEL) has been used as a performance determinant; system generalised method of moments (GMM) analysis has been used to find the effect of determinants on the performance measurement of public sector banks; and CCA (canonical correlation analysis) has been used to find the interrelationship between the bank-specific determinants and the performance of public sector banks. The finding has important implications in terms of performance in the banking sector. Certain limitations of this study are: It is based on secondary data. The study only covers the financial aspects and not the non-financial aspects. It is found that the asset quality is negatively related with performance of public sector banks. Liquidity and inflation are inversely related to performance of public sector banks in India. Capital adequacy is positively related with banks’ performance, but inversely related with banks’ interest margin. GDP growth has a significant positive impact on banks’ performance, but inversely related with banks’ interest income. Inflation rate is inversely related with banks’ performance. Banking sector reforms are insignificantly related with banks’ performance.
Keywords
Introduction
The banking system is an important part for any economy (Gupta, 2014; Jain & Gupta, 2004; Koundal, 2012). (Bansal & Mohanty, 2013) Economists have expressed a mixture of opinions on the effectiveness of the banking systems in promoting or facilitating economic development. As an economic institution, the banks are being more directly and more positively related to the performance of the economy than several non-economic institutions. Banks are considered to be at the apex of the world. They are the nerve centre of the economy and showcase financial structure of a nation. It is also a barometer of a nation’s economic perspective. The horizon of commercial banking in India (Koundal, 2012) that enlarged with nationalisation has further widened with the implementation of the banking sector reforms in the year 1922–1993. An evaluation of the financial performance of banks is necessary to analyse the weaknesses and efficiencies of the banking sector.
In the Indian financial system, commercial banks are the major mobilisers and disbursers of financial resources. They have an extensive role in the growth of a developing country like India. The role of banks in accelerating the economic development of a country like India has been increasingly recognised following the nationalisation of 14 major commercial banks in July 1969 and 6 more banks in April 1980. With nationalisation, the concept of banking has undergone significant changes. Globalisation was another positive step that brought changes in the ancient banking system. Until the early 1990s, the regulation of commercial banks by the RBI in India mainly focused on licenses, minimum capital requirements, pricing of services including administration of credits, interest rates on deposits, reserve requirements, and liquid assets. Under these regulatory regimes, the main focus of banking supervision was solvency issues (RBI, 2012).
Public sector banks are those banks in which more than 50 per cent stake is held by the government. The shares of these banks are listed on the stock exchanges. Public sector banks are the backbone of Indian financial structure since nationalisation of the State Bank of India (SBI) in 1955, followed by more banks in 1969 and 1980 (Kumbhakar & Sarkar, 2003; Singh, 2016). Despite critical global conditions and turbulence in the Indian economy, public sector banks have been successful in meeting their mandate with due support from the government and the RBI. In 2017–2018, there were a total of 21 public sector banks in India, 19 nationalised banks + SBIs (SBI + 5 recently merged associates) + IDBI bank (another public sector bank [in research period] recently disinvested by the Government of India [GoI]). The GoI has consolidated 10 public sector banks into 4 banks. The announcement of this mega-merger was made by union finance minister in 2019. Hence, our focus in this study will be on the determinants influencing the public sector banks’ performance.
In 1995, the supervision working group recommended orientation supervision for the enforcement of correction of deviations in banks. It was decided that the periodic statutory examinations with full scope should focus on the major areas of evaluation. The internationally adopted CAMEL or Capital adequacy, Assets quality, Management efficiency, Earning, and Liquidity (RBI, 2012) includes financial performance and position, operating and management conditions, Compliance and Summary assessment as prescribed by RBI for Indian banks and a CACS model (capital adequacy, asset quality, compliance, systems and controls) for the foreign banks. The uniform financial institution rating system was created in 1979 by bank regulatory agencies (Dash & Das, 2009; Mousa, 2016; Rostami, 2015). The CAMEL rating system was introduced in the USA in 1980. It was introduced by the supervisory authorities as a rating system for on-site examination of the banking institutions (Mousa, 2016; Shaddady & Moore, 2018). In the CAMEL rating system, six factors are included for bank operations—capital adequacy, assets quality, management, efficiency, earning and liquidity (Aweke & Alemu, 2017; Mousa, 2016; RBI, 2012; Rostami, 2015; Srinivasan & Britto, 2017).
Some other CAMEL-based studies other than rank-based studies (Bastan et al., 2016) were conducted. Study on dynamics of banking soundness based on CAMEL’S rating system was used in this study. They also used the qualitative system dynamics approach and found that asset quality, capital adequacy and quality management are the most important issues of Iranian banks in banking soundness management and development. Ayadurai and Eskandari (2018) carried out a study on bank soundness by employing the PLS-SEM approach to explain the bank soundness in the G7 countries during the period 2003–2013 and found CAMELS constructs explain 32.5 per cent of the variation in bank soundness. Keffala (2020) made a study to how derivative instruments are used by Islamic Bank in some way to influence the performance, evidence from CAMELS approach and used dynamic panel data econometrics with GMM system, during the period from 2007 to 2017, conducted on 32 Islamic banks. In this study, we have used CAMEL model, which emphasises on all the aspects of financial performance. ‘C’ denotes capital adequacy and shows the quality, and level of a bank’s capital determines the survival of the bank. If there is an enhancement in a bank’s capital buffer, it absorbs mismatch at both macro and micro levels. However, higher buffers mean proportionately less capital available for investment purposes. Thus, equity holders get lower returns on investment income, and it also adversely affects the performance of the banks. ‘A’ denotes assets quality. Those banks that provide loans to creditworthy customers with sound collateral security or assets show lesser non-performing loans (NPLs) and lower exposure to extreme risk levels. If banks have generated bad debts and high NPLs and do not have strong collateral assets or securities on these loans, it is less likely that they survive and thus, it adversely affects their performance. ‘M’ denotes management efficiency. The working efficiency of a bank lies in the ability of management and its decisions, which contribute to its soundness. Management efficiency is usually reflected in the returns generated on assets and equity. ‘L’ denotes liquidity. Banks’ funding sources such as liquid assets (cash and cash equivalents) and deposits determine a bank’s ability to meet unexpected deposit outflows. These banks are not able to meet their daily liquidity requirements. Major consequences in such banks are bank runs leading to insolvency. Liquidity is adversely, positively and directly related to bank’s performance (Ayadurai & Eskandari, 2018).
Literature Review
Measurement of Financial Performance
Literature on bank performance has focused on the key indicators of measurement of financial performance of banks, that is, return on equity (ROE), return on assets (ROA) and Net Interest Margin (NIM). Financial performance analysis of commercial banks has been of great interest to academic research since the great depression occurred in the 1940s. Ongore and Kusa (2013) conducted a study on determinants of the financial performance of commercial banks in Kenya; they used ROA, ROE and NIM as bank performance indicators; capital adequacy, asset quality, management efficiency and liquidity management as bank-specific variables; inflation rate and GDP growth rate as macroeconomic variables; and foreign versus domestic ownership as moderating variable and found that bank-specific factors significantly affect the performance of banks, except liquidity variable, but macroeconomic variables were insignificant at 5 per cent level. The ownership-related moderating variable was insignificant on the banks’ financial performance. Sebe-Yeboah and Mensah (2014) conducted a study on critical analysis of the financial performance of agricultural development bank (ADB, GHANA). They employed PELARI (profitability, efficiency, liquidity, asset quality, risk measures, and investor analyses) in this study, and they used ROE, NIM, ROA, ROD (return on deposit), profit margin and ROI for profitability. In his study, Adam (2014) evaluated the financial performance of Erbil Bank for investment and finance, used financial ratios and measured the performance of a commercial bank by using NPM, ROA, ROD, and ROE as profitability indicators. Klaassen and van Eeghen (2015) conducted a study on analysing bank performance and used RoE, RoA and RAROC (risk-adjusted return on capital) for performance measurement. They conducted a research on US commercial banks during 1992–2014. In this study, they used ROA, ROE and NIM as indicators to measure the performance of public sector banks. Demirguc-Kunt and Huizinga (1999) conducted a study on determinants of commercial bank interest margins and profitability. They found that non-interest earning assets reduce net interest income and higher real interest rates are related with higher interest margins and profitability more in wealthy countries than in poor countries.
Determinants of Bank Performance
Many empirical studies examine the determinants of bank performance (Adam, 2014; Antoun et al., 2018; Ayadurai & Eskandari, 2018; Ijaz et al., 2015; Petria et al., 2015). Determinants may be internal and external. Internal determinants are related to bank—capital adequacy, assets quality, employee efficiency and liquidity. External determinants are industry-related like macroeconomic indicators—GDP, inflation rate, exchange rate, etc.
Capital Adequacy
Capital adequacy for banking organisations is an important issue that has received considerable attention in finance literature. Thoa et al. (2020) conducted a study on determinant of capital adequacy ratio. On the basis of empirical evidence from Vietnamese banks, they found negative result in ROE ratio with low levels of capital ratios in these banks. Olarewaju and Akande (2016) conducted a study on an empirical analysis of capital adequacy determinants in Nigerian banking sector and found that ROE exerts negative influence on capital adequacy, and ROA is statistically significant in determining the capital adequacy of the deposit money banks in Nigeria. Ezike and Oke (2013) conducted a study on capital adequacy standards, Basle accord and bank performance on selected banks in Nigeria. Results showed that capital adequacy standards have a major influence on bank performance. Mathuva (2009) in his study on capital adequacy, cost income ratio and the performance of commercial banks conducted on Kenyan scenario found that the risk-adjusted capital adequacy measure is positively related with ROA and ROE. Ijaz et al. (2015) conducted a study on determinants of the Pakistan Islamic banking industry’s profitability; they used panel data and found that there is no statistical relation between capital adequacy ratio and ROE. Nguyen (2020) conducted a study on the impact of bank’s capital adequacy on bank’s profitability under Basel II accord in Vietnam and found that ROA and ROE are insignificantly correlated with the Basel II implementation in large-sized banks but significantly correlated in small-sized banks. Negative capital adequacy and profitability relationship (DAO & Nguyen, 2020) are reinforced by Modigliani and Miller’s capital structure irrelevance theory (1958). Büyükşalvarci and Abdioğlu (2011) conducted a study on determinants of capital adequacy ratio in Turkish banks. Researchers used panel data 2006–2010 and found that both ROE and ROA are negatively related with CAR.
Asset Quality
A positive relation exists between bank’s asset quality and operating performance, so if a bank’s asset quality is inadequate then increases its bad debt losses as well as leads it to spend more resources on the collection of NPLs (Abata, 2014). According to Achou and Tenguh (2008), non-NPLs have an inverse relationship with banks’ profitability. They suggested that it is essential that banks practise credit risk management so that protection of the assets of the banks protects the investors’ interests. Cheruiyot (2016) examined the effect of asset quality on profitability of commercial banks in Kenya and concluded that higher the asset quality higher is the positive trade-off between asset quality and financial performance. Ezeoha (2011) conducted a study on banking consolidation, credit crisis and asset quality in a fragile banking system and found the relationship between the level of non-performing credits and bank profitability is negative and very significant. Salike and Ao (2018) conducted a study on determinants of bank’s profitability and role of poor asset quality in Asia. They found that the impact of poor asset quality on bank’s profitability is still negative and highly significant. Hence, asset quality is a strong determinant of financial performance because it influences the interest incomes.
Liquidity
Salike and Ao (2018) conducted a study on determinants of bank’s profitability and role of poor asset quality in Asia. They found both liquidity and income diversification have a positive association with banks’ profitability. Chen et al. (2018b) examined the bank liquidity risk and performance. They concluded that liquidity risk is regarded as a discount for bank profitability. Also, liquidity risk shows a premium on bank performance. They also found liquidity risk has an inverse effect on bank’s performance in a market-based financial system. Ferrouhi (2014) conducted a study on bank’s liquidity and financial performance considering Moroccan banking industry as the study sample. He found bank performance and liquidity ratios are significantly related and said that liquid banks are more efficient than non-liquid banks. Cheruiyot (2016) examined the effect of asset quality on profitability of commercial banks in Kenya. They concluded there is a positive relation between liquidity and banks’ profitability. Liquidity management is a decision for commercial bank managers in most cases where financial strengths are related to high liquidity.
External Determinants
External variables: these are not in the control of the bank’s management, but they influence the bank performance. Kaushal and Ghosh (2018) reported that banks do contribute to the overall economic growth in India. Arrawatia et al. (2019) found that any improvement in the GDP growth rate during crisis period has impacted NPLs positively. Kosmidou (2008) found that GDP growth plays a significantly positive role in determining banks’ performance. Jiang et al. (2003) conducted a study on the profitability of the banking sector in Hong Kong and found a positive relationship between real GDP growth and banks’ profitability. Nguyen (2020) conducted a study on impact of banks’ capital adequacy on banks’ profitability under Basel II accord in Vietnam. He found that large-sized banks’ ROE is positively associated with economic growth rate. Hence, higher growth rates of real GDP would result in more loans and thereby higher profitability.
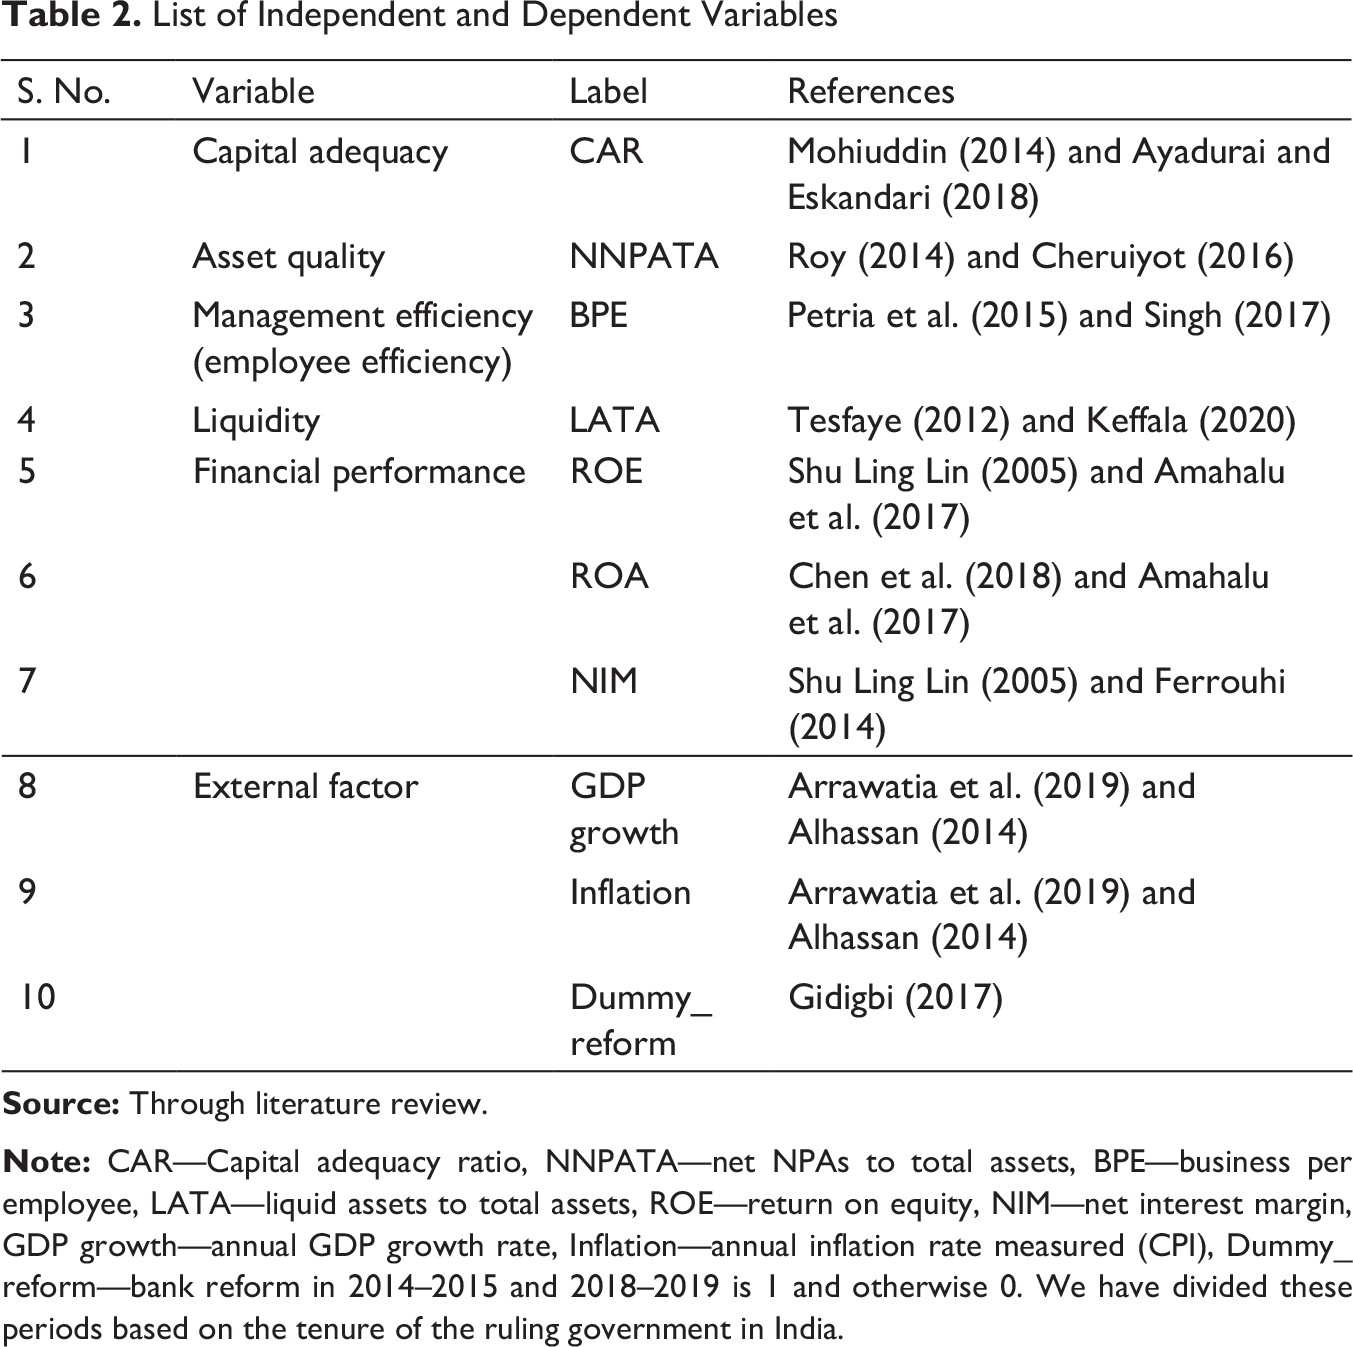
Nguyen (2020) found that inflation is significantly and positively correlated with Vietnamese banks’ profitability (ROA and ROE). Sufian and Chong (2008) concluded that inflation has a negative impact on banks’ profitability based on the sample from the Philippines from 1990 to 2005. Buckley (2011) argued that the net effect of inflation on bank’s profitability seems to be more complicated and ambiguous. Hence, high inflation exhibits very high margins and cost ratios (Sastrosuwito, 2012; Vittas, 1991). Gidigbi (2017) conducted a study on assessment of the impact of banking reforms on economic growth and bank performance in Nigeria over the period of 1981–2015. They treated bank performance as a dependent variable and banking reforms as a dummy variable (independent variable), used four dummy variables 1986 and beyond for banking reform, 1993 and beyond for banking reform, 1999 and beyond for banking reform and 2004 and beyond for banking reform. They concluded that banking reforms increase a bank’s performance in enhancing resources to the private sectors, which are major movers of economic growth in any capitalist economy. In our study, we also used bank reform as a dummy variable divided in two sections—for 2014–2015 and 2018–2019, it is 1 and otherwise 0. We have divided these periods based on the tenure of the ruling government in India.
Canonical Correlation Analysis
Canonical correlation analysis (CCA) (Hotelling, 1936) is a sophisticated technique (Thompson, 1984). CCA is a statistical method employed to investigate relationships among two or more variable sets, each consisting of at least two variables (Thompson, 2005). Some researchers continue to use univariate statistical analyses (i.e., one dependent variable), such as multiple regression and ANOVA, to analyse data that might better be analysed using a multivariate technique (i.e., more than one dependent variable) such as CCA (Sherry & Henson, 2005). Hence, we also employed the same technique to examine multivariate relationships between financial performances of banks with four explanatory variables (capital adequacy, liquidity, asset quality, management efficiency).
Surprisingly, CCA has been employed for determining the connection between the performance of banks and the structure of banking markets, demand for bank services, costs and other factors (Fraser et al., 1974); in the study, researcher used canonical analysis for bank performance. Canonical correlation has been applied for investigating the interrelationships among 8 performance and 19 explanatory variables for the innovative Ghanaian rural banks (Obben, 1992). CCA has been applied for interdependencies between the two sides of a balance sheet (Jang & Ryu, 2006; DeYoung, & Yom, 2008; Simonson et al., 1983; Stowe et al., 1980). Based on Stowe et al.’s (1980) technique applied to non-financial firm’s balance sheet relationships, relationships across the balance sheet include (a) hedging, (b) the use of collateral for loans, (c) inventories associated with accounts payable and (d) managing risk with simultaneous use of lower leverage and greater liquidity balances. Simonson (1983) applied CCA for the interrelationships of commercial bank asset/liability structures, but they limited the analysis to large banks. Jain (2004), Ranjan and Nallari (2005) and Dash and Pathak (2016) used canonical analysis to examine asset–liability management in Indian banks. Robert and Chiwon (2008) employed CCA to examine how the relationships between asset and liability accounts at US commercial banks changed between 1990 and 2005 and found that asset–liability linkages are stronger at large banks than at small banks.
In another study, Sherry and Henson (2005) made a study on “conducting and interpreting canonical correlation analysis in personality research: a user-friendly primer”, in this they demonstrates CCA with basic language, using technical terminology only when necessary for understanding and use of the method with personality data. Duru and Iyengar (2001) conducted a study on the relevance of firm’s accounting and market performance for CEO compensation and found that CEO bonuses are closely associated with accounting measures of performance, whereas CEO’s long-term compensation is directly linked to the firm’s market performance. Yeh et al. (2020) conducted a study for analysing the relationships between the spatial characteristics of Urban Green Spaces (UGSs) and morbidity of diseases, which were considered variables of human health in the Taipei Metro, and found a strong canonical correlation between the spatial characteristics of UGSs and human health.
While most of the CAMEL model-based studies adopted ranking-based method, this study used CCA and panel data analysis. CAMEL rating has been used as a performance determinant (independent and dependent variable); system GMM analysis has been used to find the effect of determinants on performance measurement of public sector banks; and CCA has been used to find the interrelationship between the bank-specific determinants and the performance of public sector banks.
Objective
To investigate the interrelationship among the performance of public sector banks and capital adequacy, liquidity, assets quality and management efficiency.
To examine the effect of determinant on the performance of public sector banks.
To show the link between CCA and system GMM results.
Research Methodology
Sampling Technique
Convenient and random sampling techniques have been used in the study. It includes quantitative and qualitative techniques.
Sample Size
Sample in Research Period.
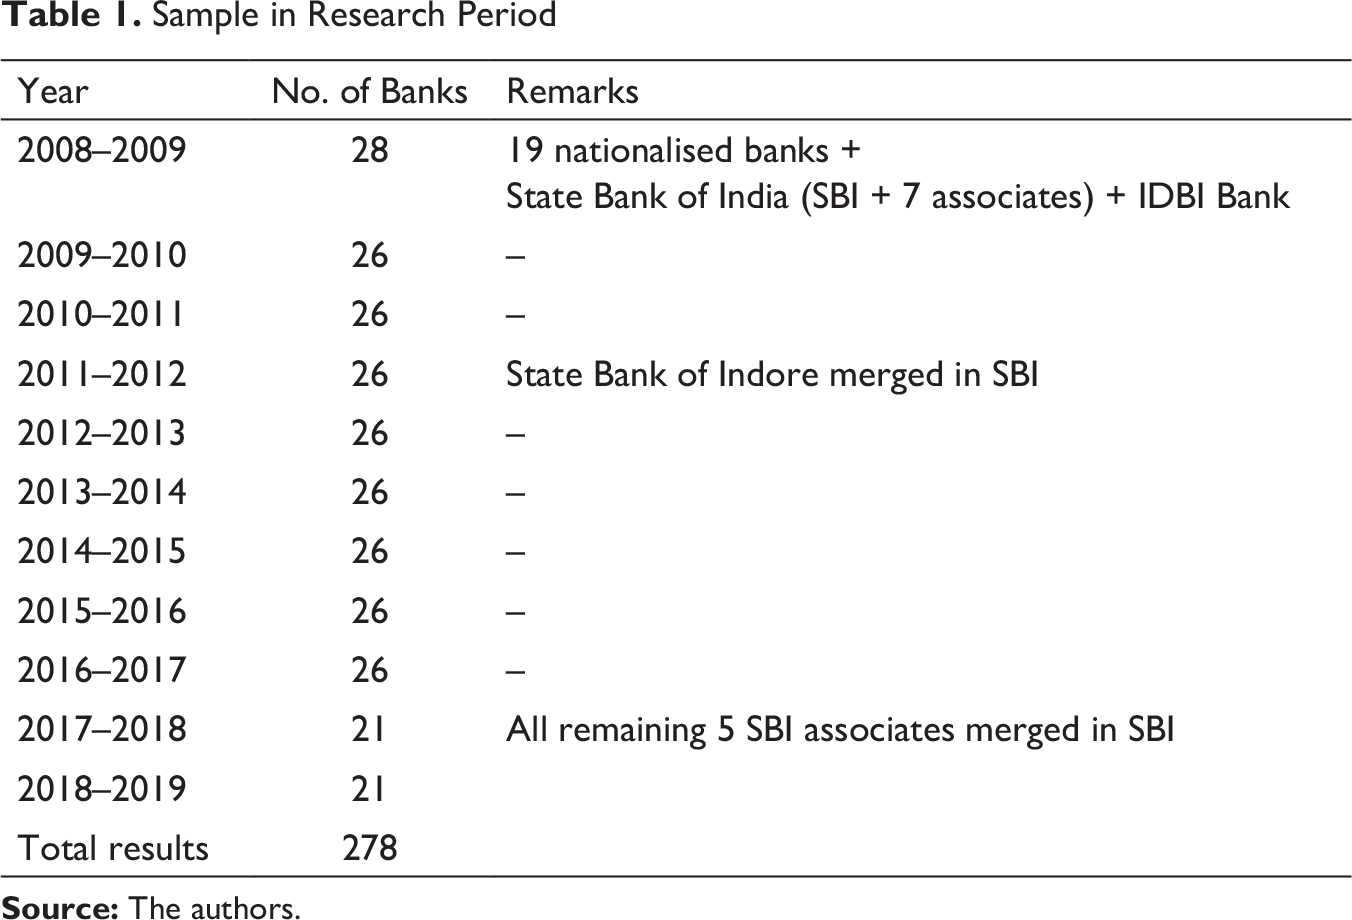
Sample in Research Period.
Data Collection
Secondary sources of data have been used for this study. Data were collected from various published annual reports and various bulletins of banks. 1 GDP growth data have been collected from World Bank database, and inflation data are collected from OECD database.
Period of Study
The present study is carried out for the financial year from 2008–2009 to 2018–2019.
List of Independent and Dependent Variables.
Techniques Used for Data Analysis
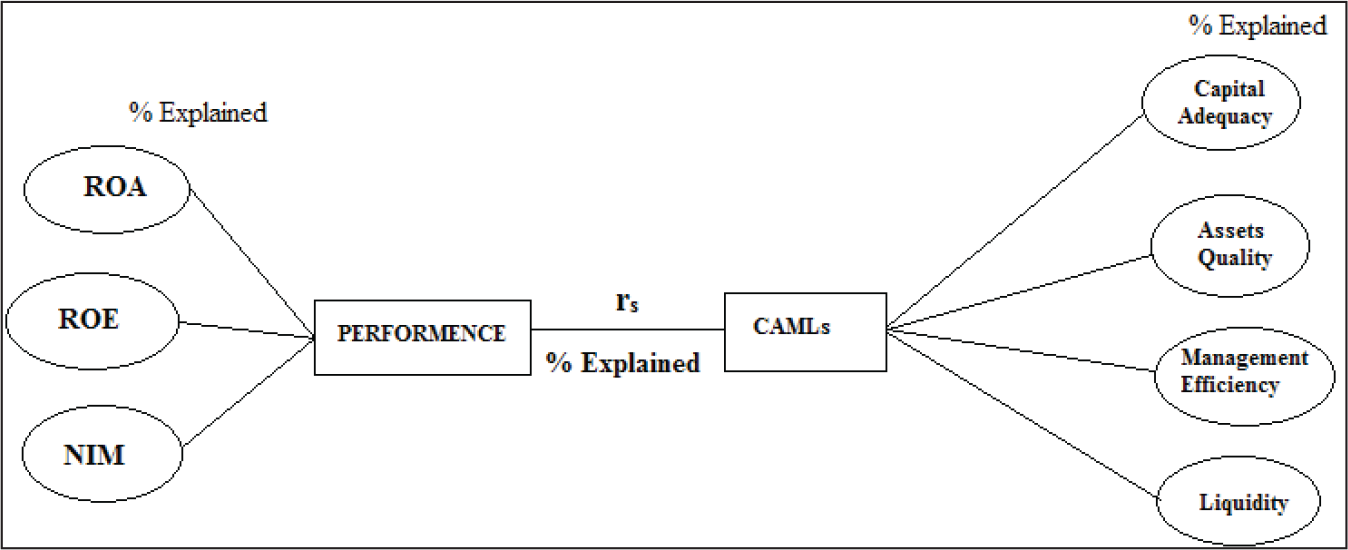
Canonical correlation analysis (Anderson, 2003; Borga, 2001; Ho, 2014; Hotelling, 1936; Thompson, 2005; Johnsan, 2007) is a way of making sense of cross-covariance matrix if we have two vectors ‘a’ and ‘b’ of random variables, and if there are correlations among the variables, then CCA will find linear combinations of the ai and bj, which have maximum correlation with each other (Andrew et al., 2013; Das & Sen, 1994). Let us look at financial performance Predictor (independent) variables be denoted X = [X1, X2, X3, X4] and the criterion (dependent) variables be Y = [Y1, Y2, Y3]. Consider the linear combinations of X and Y: A = α′X = α1X1 + α2X2 + α3X3 + α4X4 and B = β′Y = β1Y1 + β2Y2 + β3Y3. The goal of CCA is to determine the coefficients, or canonical weights (α′ and β′), that maximise the correlation between canonical variates A and B. This study applied CCA to examine the multivariate relationship between financial performance indicators of banks (Predictor variables) and influencers (criterion variables). The proposed canonical correlation model is shown in Figure 1.
From the empirical literature reviewed, dynamic panel model formulations were employed in examining the determinants of bank performance.
ROAi,t = βi + β1ROAi,t−1 + β2CARi,t + β3NNPATAi,t + β4lnBPEi,t + β5LATAi,t + β6GDP growtht + β7Inflationt + β8Dummy_reformt + εi,t
ROEi,t = βi + β1ROEi,t−1 + β2CARi,t + β3NNPATAi,t + β4lnBPEi,t + β5LATAi,t +β6GDP growtht + β7Inflationt + β8Dummy_reformt + εi,t
NIMi,t = βi +β1NIMi,t−1 + β1NIMi,t−2 + β2CARi,t + β3NNPATAi,t + β4lnBPEi,t + β5LATAi,t + β6GDP growtht + β7Inflationt + β8Dummy_reformt + εi,t
ROAi,t denotes the ratio of ROA for bank i at time t; NIMi,t denotes the ratio of net interest margin for bank i at time t; ROEi,t denotes the ratio of ROE for bank i at time t; ROAi,t, ROEi,t and NIMi,t are the lags of ROA, ROE and net interest margin ratio, respectively, for bank i at time t − 1. CARi,t denotes the ratio of capital adequacy for bank i at time t; NNPATAi,t denotes the net NPA’s to total assets ratio for bank i at time t; lnBPEi,t denotes the log of business per employee ratio for bank i at time t; LATAi,t denotes the ratio of liquid assets to total assets for bank i at time t; GDP growtht denotes the annual GDP growth rate in time t, Inflationt denotes the annual inflation rate at time t. The error term εi,t is made up of µt, time-specific fixed effect and ei,t, the bank-specific time variant effect.
Descriptive Statistics.
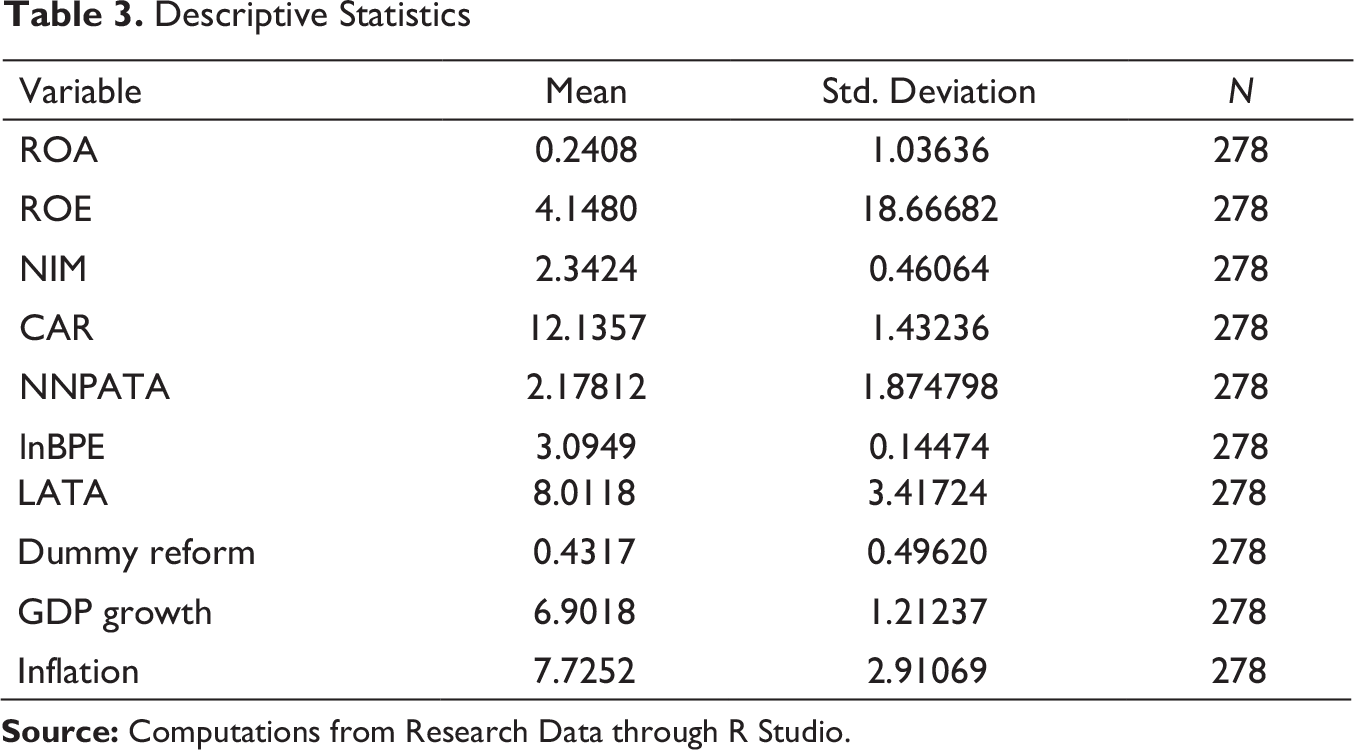
Descriptive Statistics.
lnBPE average of public banks is 3.0949 and standard deviation is 0.49620, which show low difference in BPE of public sector banks. In criterion variable ROE, average of public banks is 4.2563 which shows low ROE and standard deviation is 18.65, which shows very high difference in ROE of public sector banks. Average GDP growth rate of India is 6.9 and standard deviation is 1.212, which show low fluctuation in GDP growth rate. Average inflation rate of India is 7.73, which shows very high inflation during the research period.
The format of Table 4 is based on Stowe et al. (1980) and Jang and Ryu (2006). Table 4 shows that all the correlations (r) <0.7789 (in absolute value). The general rule of thumb (Ho, 2014) is that if the correlation (r) >0.8, then severe multicollinearity may be present. Therefore, it is not necessary to remove the redundant variables (Yeh et al., 2020). CAR and financial performances are positively related, but LATA and NNPATA are significantly negatively related with ROA, ROE and NIM. BPE is also negatively related with financial performance. Reform is also negatively related with financial performance of public sector banks. But inflation is positively related with banks’ performance, and GDP growth rate is negatively related with NIM.
Pearson’s Correlations Between Predictor and Criterion Variable.

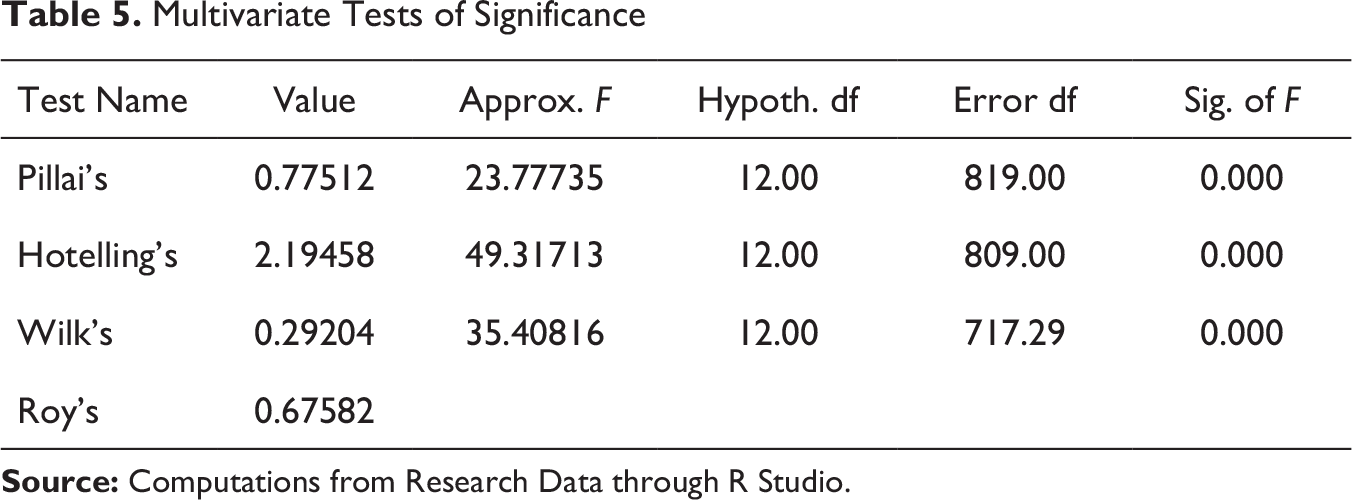
Table 5, shows all multivariate tests of CCA (i.e., Pillai’s, Hotelling’s, Wilk’s and Roy’s multivariate criteria) these tests show the general fit of the model (Jang & Ryu, 2006). All four multivariate tests returned statistically significant results at the 0.001 level; the most common test used is Wilks’ Lambo la (λ), as it tends to the have the most general applicability (Ho, 2014; Institute for Digital Research & Education [IDRE], n.d.). For the full model, Wilks’ (λ) is 0.29204, F (12, 717.29) = 35.40816, p ≤ 0.01. Therefore, by taking 1 – λ, we found an overall effect of 1 – 0.29204 = 0.70796 = for the full model. Thus, there is a significant relationship between bank performance and bank specific performance determinant.
Multivariate Tests of Significance.
Eigenvalues and Canonical Correlations.

It can be seen that the full model (Functions 1 to 3) is statistically significant (Table 7). Wilks’ λ = 0.29204, F (12, 717.29) = 35.40816, p < 0.01. The cumulative effects of Functions 2 and 3 are also statistically significant. Wilks’ λ = 0.90087, F (6, 544) = 4.85831 and p < 0.01. Similarly, the cumulative effects of Functions 3 to 3 are not statistically significant because the calculated p-value is 0.794, which is greater than 0.01, then the effect sizes of Functions 3 and 4 become slightly less impressive. Because the final functions in a CCA are often weak and uninterpretable, the statistical significance test of the final function is often uninformative.
Dimension Reduction Analysis.

Canonical Correlation Solution.

For analysis of determinants’ effect on banks’ performance, we used fixed effects model and random effects model to estimate the regression equation. F test is used to find out the appropriate pooled model or fixed effects model (Kar & Dutta, 2018; Mendiratta & Gupt, 2013). Hausman test is used to find out the appropriate fixed effects model and random effects model (Croissant & Millo, 2019; Hausman, 1978)). Breusch–Pagan test was used to test for heteroscedasticity, while Durbin–Watson test was also employed to test for autocorrelation. However, we found the problems of heteroscedasticity and autocorrelation from the FEM model. Hence, generalised method of moments model (GMM) (Arellano & Bond, 1991; Liu et al., 2018) is used significantly at the level of 5 per cent. System GMM (Arellano & Bond, 1991) is used for dynamic panel models to carry out empirical analysis. Sargan test and Arellano–Bond test are applied to test the reliability of GMM model results.
Table 9 reports the results in which bank profitability proxied by ROA is impacted by variables including bank-specific indicators and external indicators. Due to the unbalanced panel nature of the data, in system GMM, the total observations dropped to 18 for 26 banks from the 27 banks data analysed. Within R2 show, 74.57 per cent variation is explain by all determinants. Durbin–Watson value shows no autocorrelation problem in data, and Breusch–Pagan test value finds no heteroscedasticity problems in data. Hence, we use dynamic panel for handling the endogeneity. Test for AR (2) errors z shows endogeneity problem is solved at AR (2) level. According to Sargan test statistics, the null hypothesis is that the over-indentifying restrictions are valid. The test results for the models do not reject the null hypothesis of valid instruments (because prob χ2 are greater than 0.05). Wald (joint) test chi-square statistics (Bekana, 2020) show that the overall model of system GMM is fit.
ROA Model Analysis Result.
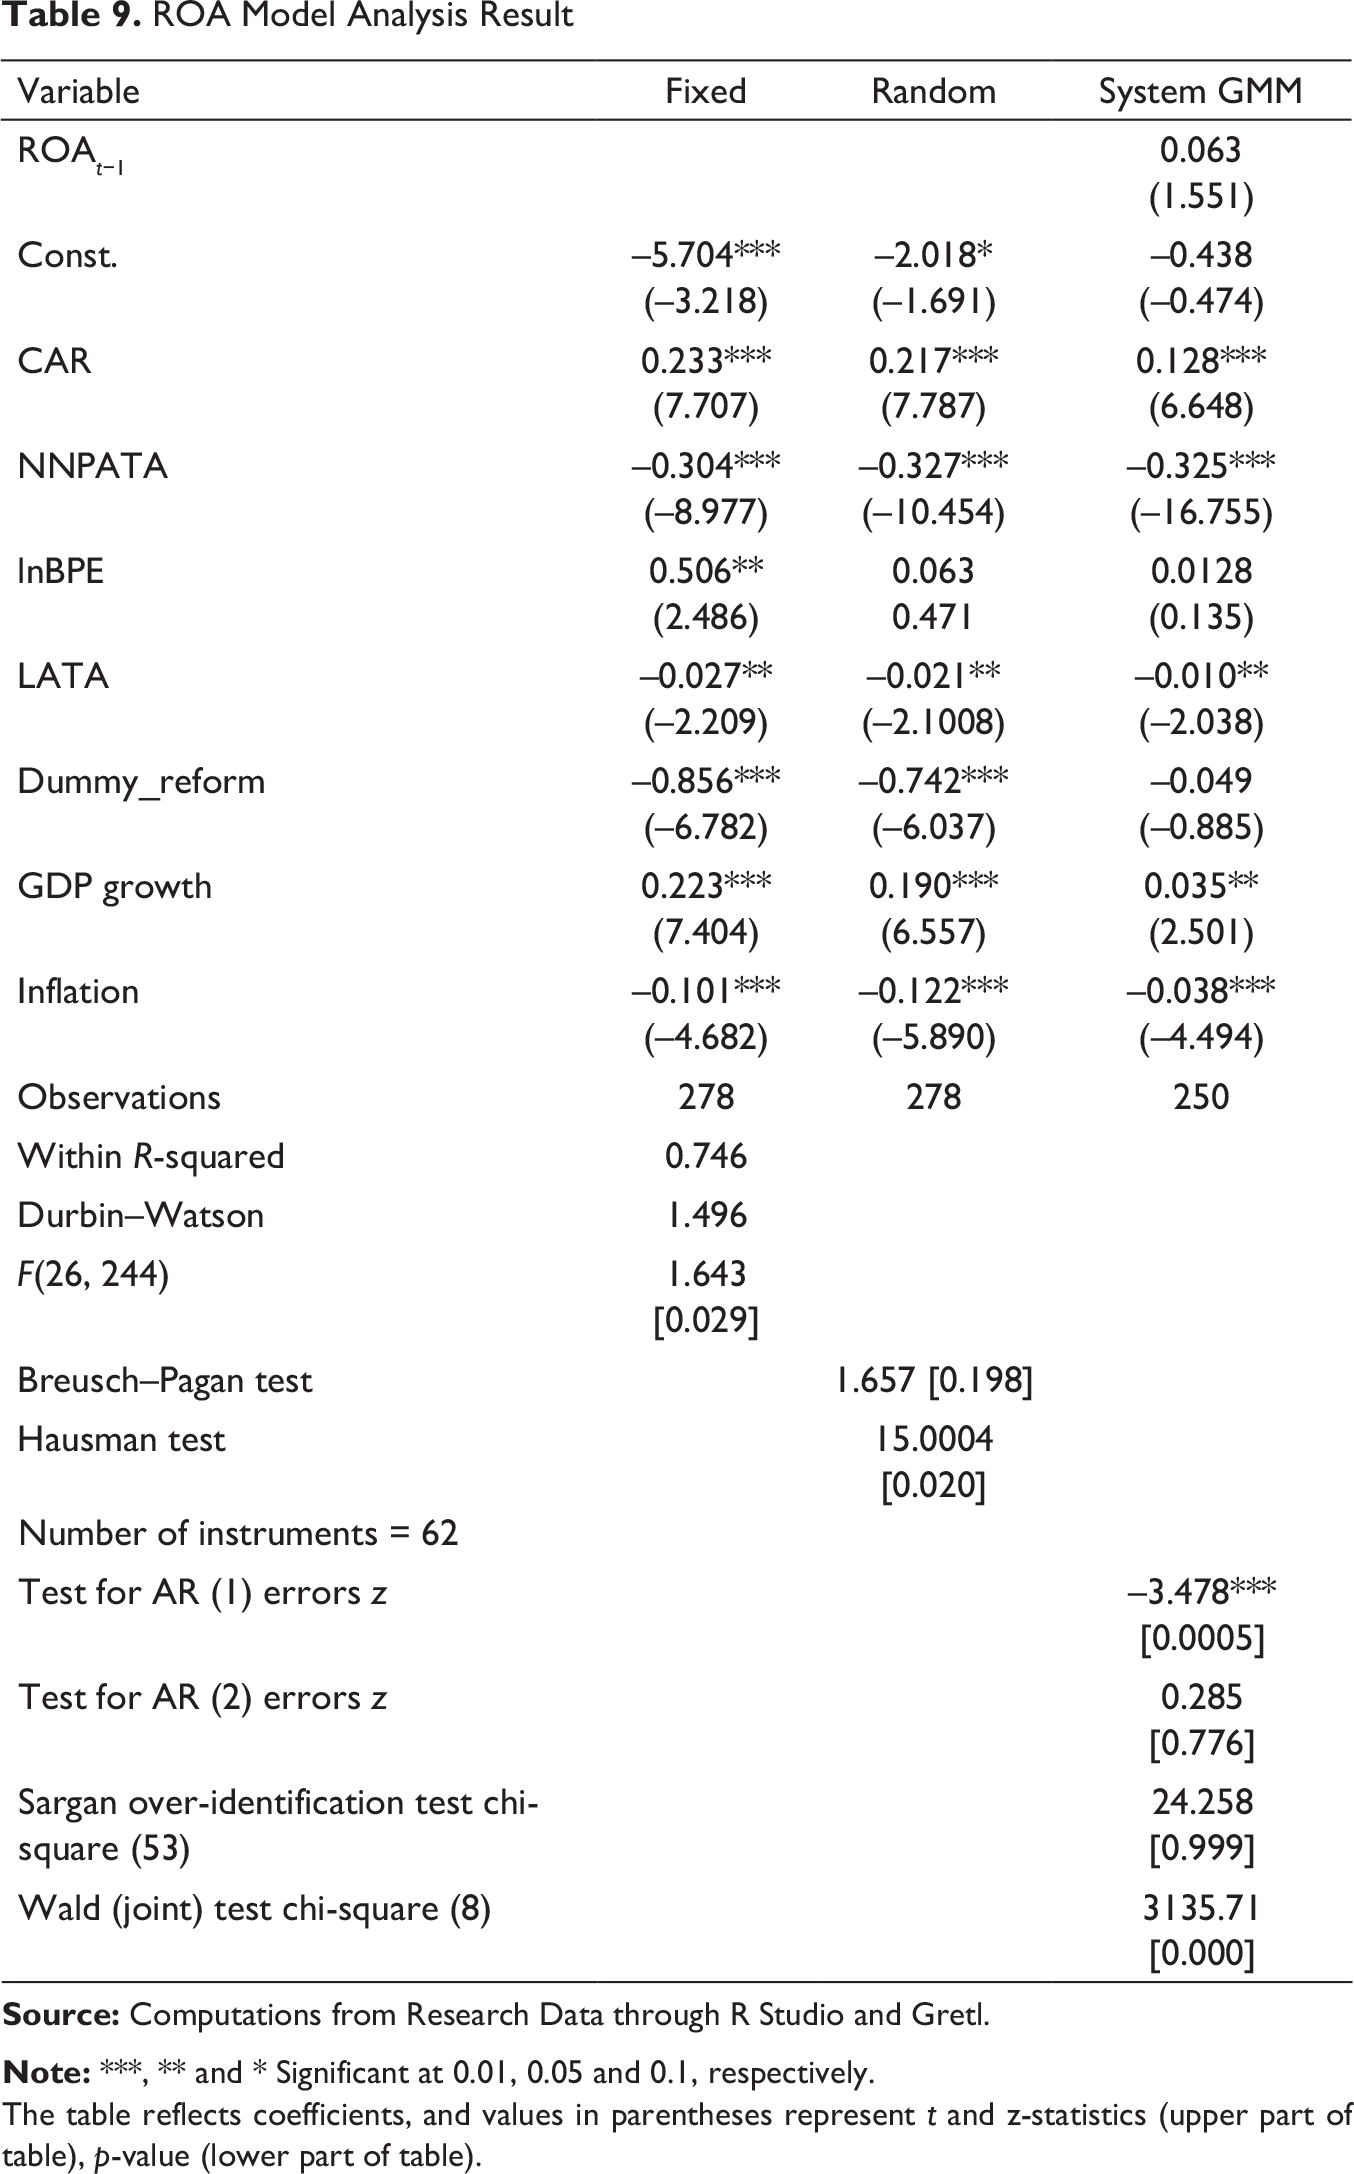
The table reflects coefficients, and values in parentheses represent t and z-statistics (upper part of table), p-value (lower part of table).
This model shows ROA lag is insignificant, and lnBPE is also insignificant to the ROA. CAR is positively significant at 1 per cent level to the ROA. Analysis report supports Mathuva (2009) results and criticises Büyükşalvarci (2011) results for Indian public sector banks. NNATA (–0.325) is inversely related with ROA and supports the results of Salike and Ao (2018). LATA is inversely related with ROA at 5 per cent significant level. Banks reform is insignificant with ROA of Indian public sector banks. GDP growth (0.035) is positively significant at 5 per cent level; this result supports Jiang et al. (2003) and Kosmidou (2008). Inflation is inversely related with ROA at 1 per cent level. The results show that CAR and NNPATA have a high impact on ROA.
ROE Model Analysis Result.

The table reflects coefficients, and values in parentheses represent t and z-statistics (upper part of table), p-value (lower part of table).
This model shows ROE lag is insignificant; lnBPE is also insignificant to the ROE. CAR is positively significant at 1 per cent level to the ROE. Analysis report supports Mathuva (2009) results and criticises Büyükşalvarci and Abdioğlu (2011) results for Indian public sector banks. NNATA (–6.110) is inversely related with ROE and supports the results of Salike and Ao (2018). LATA is inversely related with ROE at 5 per cent significant level. Banks reform is insignificant with ROE of Indian public sector banks. GDP growth (0.658) is positively significant with ROE at 5 per cent level; this result supports Jiang et al. (2003) and Kosmidou (2008). Inflation is inversely related with ROE at 1 per cent level. Result shows CAR and NNPATA have a high impact on ROE.
Table 11 reports the results in which bank profitability proxied by net interest margin is impacted by variables including bank-specific indicators and external indicators. Due to the unbalanced panel nature of the data, in system GMM, the total observations dropped to 54 for 26 banks from the 27 banks data analysed. Within R2 show, 74.57 per cent variation is explain by all determinants. Durbin–Watson value shows there is no autocorrelation problem in data, and Breusch–Pagan test value finds heteroscedasticity problems in data. We use dynamic panel for handling the heteroscedasticity and endogeneity. For handling the endogeneity problem in model, we used two lag variables. Test for AR (2) errors z shows endogeneity problem is solved at AR (2) level. According to Sargan test statistics, the null hypothesis is that the over-identifying restrictions are valid. The test results for the models do not reject the null hypothesis of valid instruments (because prob χ2 are greater than 0.05). Wald (joint) test chi-square statistics shows that over all model of system GMM is fit.
NIM Model Analysis Result.

The table reflects coefficients, and values in parentheses represent t and z-statistics (upper part of table), p-value (lower part of table).
This model shows NIM lag (0.633 & –0.395) is significant, which means NIM is significantly affected by self at 1 per cent level. CAR is insignificant to the NIM. lnBPE is inversely significant at 1 per cent level to the NIM. NNATA is also inversely related with NIM. LATA is inversely related with NIM at 1 per cent significant level. Bank reform is insignificant with NIM of Indian public sector banks. GDP growth (–0.116) is also inversely significant on NIM at the 1 per cent level. Inflation is inversely related with NIM at 1 per cent significant level. It is evident from the results that NIM has a high influence on lnBPE and self-previous value.
This article explores the major factors that affect the performance of banks on an average of 26 banks by collecting data over the period from 2009 to 2019. This study differs from earlier studies and is expected to contribute significantly to the banking/financial sector. In the present study, we have used both traditional and advanced methods to analyse the performance of banks. Traditional CAMEL methodology is used to analyse the financial performance of public sector banks. ‘CAMEL’ stands for capital adequacy, asset quality, management efficiency, earning capacity, and liquidity. The capital adequacy ratio is used, and a net non-performing asset to net advance ratio is adopted to analyse the asset quality of various banks. Similarly, log of business per employee (BPE) is used for evaluating management efficiency. Earning capacity is measured with the help of return on total assets, ROE and net interest margin. Liquid assets-to-total assets ratio is used to evaluate liquidity. In advanced approach, canonical correlation and dynamic panel modelling are used to measure the relationship among the capital adequacy, asset quality, management efficiency, liquidity with bank performance (measure by earning). Our CCA results show bank-specific variables and explain that there is only 44.6 per cent variation in bank performance. Panel data show that all the selected variables explain an approximate value of 70 per cent variation in bank performance. Both the results show asset quality is highly negatively related with public sector banks’ performance (Ezeoha, 2011). Liquidity and inflation are also inversely related with public sector banks’ performance in India. Liquidity has very low contribution in banks’ performance. Capital adequacy is positively related with bank’s performance, but inversely related with bank’s interest margin income. Management efficiency is insignificantly related with banks’ performance but inversely related with interest margin. There is an inverse relationship between BPE and the bank performance. BPE shows the management efficiency. The working efficiency of the bank lies in the ability of management and its decisions. BPE is measured through the deposits and advances generated by per employee. Advances in public sector banks are increasing faster than their deposits. Public sector bank’s management is unable to control or reduce advances; thus, it continues to adversely affect the performance of banks in terms of net interest margin. GDP growth has a significant positive impact on banks’ performance (Jiang et al., 2003; Kosmidou, 2008), but it is inversely related with banks’ interest margin income. Inflation rate is inversely related with banks’ performance. When inflation rises, interest rates also increase. This gives banks more opportunities to generate profit. At that time, the cost of their funds also increases, which reduces profits. Therefore, the performance of banks decline. Banking reforms are insignificant with banks’ performance. Proposed mergers will improve financial performance if focus is on control and better management for assets quality improvement. Control on inflation and big push banking reforms are also required for banks for an increase in the bank’s asset base and bank’s deposits. Further scope of study shall be on the impact of mergers on public sector banks’ performance and also on the impact of mergers on bank’s returns on stocks.
Footnotes
Acknowledgements
The authors are grateful to the anonymous reviewers of the journal for their constructive comments on the earlier draft of the article. However, all remaining errors and imperfections are our own responsibility.
Declaration of Conflicting Interests
The authors declared no potential conflicts of interest with respect to the research, authorship and/or publication of this article.
Funding
The authors received no financial support for the research, authorship and/or publication of this article.