
Abstract
It is a consensus in academic discourse that regional disparity in India is not converging. Nonetheless, some studies argue that conclusions regarding regional convergence are sensitive to the measures employed to define regional disparities. In this study, we use night-time light radiance data from 2012 to 2021 to illustrate the converging pattern of regional disparity in India, specifically employing state-level VIIRS night-time light data for this purpose. Our analysis concludes that there is no regional convergence among all sample states in India. However, the club convergence hypothesis is relevant here, as 12 states form two clubs and exhibit convergence properties. In contrast, 13 major states in India show no signs of convergence. Furthermore, we identify three states that are diverging. Thus, based on night-time light data, we conclude that Indian states have not shown a convergence pattern recently, and regional disparity remains a significant issue in the Indian economy. This finding supports the existing literature in the Indian context, where regional convergence is absent among Indian states.
Introduction
Regional disparity has been one of the most severe issues in the Indian economy since independence. Some regions in India are performing impressive economic development; on the other hand, some areas are miserably poor (Das et al., 2022). This causes the presence of asymmetry in the regional development in India. Empirical studies disproportionately support the view that regional disparity is widening in India (Nayyar, 2008). According to Kar and Sakthivel (2007), regional disparity was unchanged in the 1980s; however, in the post-reform period in India, regional disparity considerably rose. Singh et al. (2003) provided important insights regarding the widening regional disparity in India. According to them, the conclusion regarding the trend of regional disparity is sensitive towards which measure is used to define regional disparity. Suppose we consider human development indices or consumption and creditor indicators to measure regional disparity. In that case, the conclusion about widening regional disparity is weakened compared to when we measure regional disparity in per capita income. Hence, this article uses a new indicator to measure regional disparity: night-time light data (NTL). Generally, regional disparity reduces when the inter-region asymmetry in economic activity falls. A rise in economic activity causes a rise in luminosity radiance at night. Additionally, when more families escape poverty, their houses light up (Basher et al., 2022). Thus, differences in NTL work as a good proxy for regional disparity (Chen et al., 2023; Ivan et al., 2019). Moreover, regional disparity proxies may suffer from estimation or methodological biases arising from challenges in calculation or political considerations. However, NTL data, captured through remote sensing, does not encounter such problems. The strong correlation of NTL with economic and demographic variables is further confirmed by Zhou et al. (2015).
Theoretically, we have strong reasons to believe that inter-regional disparity narrows down, and we achieve convergence of the region as the economy grows (Solow, 1956). The higher marginal productivity of capital of poor countries, compared to more affluent countries, will cause the poorer countries to grow faster; thus, regional disparity should be narrowed down. Moreover, if a region is well integrated, there is a tendency for regional disparity to be narrowed down in the future (Kalra & Thakur, 2014). Although Solow provided this convergence hypothesis on economic growth, in later times, this convergence hypothesis was applied and proved in many other areas. Regional disparity is one of such areas (Beenstock & Felsenstien, 2008; Lessmann & Seidel, 2017). However, alternative theories predict the regional divergence due to economic growth (Kaldor, 1970). These theories indicate that economic activities are biased towards specific geographical locations, which causes the concentration of economic activities in those locations. Thus, regions with the natural advantage will enjoy higher returns to scale, and regions lagging will not be able to catch up with the more prospering regions. As a result, regional disparity will continue to increase (Fujita & Theisse, 1996).
Empirically, there is evidence of both convergence and divergence in regional disparity. For instance, in their seminal work, Barro and Sala-i-Martin (1992) found evidence of regional convergence among states in the USA. Schlitte and Paas (2008) found that poorer regions in Europe tend to grow faster than the more prosperous regions, so there is a tendency for regional disparity convergence in the European region. In contrast, the evidence of regional divergence is also widespread. Pedroni and Yao (2006) found the regional income divergence in China. The evidence of regional divergence is also found in other influential works, including Fagerberg and Verspagen (1996), Kar and Sakthivel (2006) and Lau (2010). However, in recent years, in contrast with the traditional β and σ convergence hypothesis, attention of the convergence hypothesis has shifted towards club convergence. The neoclassical model predicted that all regions would have a common steady state. However, this prediction was proved false when we found divergence or non-convergence among regions in the real world. In this scenario, the term club convergence became popular. Because, empirically, researchers notice regions are forming clubs within themselves, and there is a convergence of the regions within the club, but these clubs are diverging or not converging among themselves. For instance, it is possible that all states in India are not converging, but suppose some states are converging among themselves; that is, they are forming clubs. There is plenty of literature that proves the club convergence hypothesis. For example, Tian et al. (2016) found that Chinese provinces are not converging at a common steady state, but two clubs are formed among the states. Provinces within these clubs show convergence patterns, but these clubs are not converging with each other. In the European Union, various studies also confirm the club convergence hypothesis on regional disparity (Fischer & Stirböck, 2006; Von Lyncker & Thoennessen, 2017). Other influential studies that show club convergence in regional disparity in various parts of the world include studies of Arif (2022) based in the USA, Mendoza-Velázquez et al. (2020) in Mexico and Mendez and Katoka (2021) in Indonesia.
In the Indian context, several pieces of literature empirically validate the regional disparity pattern in India. Most of them found a divergence in regional disparity among Indian states. Ghosh (2008) applied the convergence hypothesis in 15 states in India and found evidence of regional divergence, especially in the post-reform era. The author concluded that the source of divergence is mainly in states’ production structure, human capital and infrastructure differences. Evidence of divergence among Indian states is also found in pre-reform India (Ghosh et al., 1998). Rao et al. (1999) provided the determinants of such regional divergence in India. According to them, the allocation of private investment, influenced by India’s inequitable infrastructure, is the main reason behind the regional divergence among states. The differences in public expenditure in different states are also a significant determinant behind such divergence. Nonetheless, some studies found evidence of convergence in the Indian economy too. Dholakia (1994) analysed data from three decades from 1960 to 1990 for 20 Indian states. He found a tendency of regional convergence in India. Cherodian and Thirlwall (2015) found weak evidence of conditional convergence in India, although there is no evidence of unconditional convergence. However, in the pre-reform period, Cashin and Sahay (1996) found evidence of absolute convergence among Indian states as well. Tiwari et al. (2020) concluded that in post-2005, the states tend to converge towards a common equilibrium level. The club convergence study on regional disparity in India is also not rare. Bandyopadhyay (2011) found evidence of club convergence among Indian states from 1965 to 1997. The author also concluded that capital expenditure, fiscal deficit and education expenditure are associated with forming higher steady-state clubs. Hembram et al. (2019) found evidence of club convergence among Indian states using the data set from 1982 to 2014. These studies conclude that although all the states are not progressing towards a common steady-state equilibrium, there is a tendency for states to converge towards different steady-state equilibria through the formation of the clubs.
Our study provides novelty in India’s existing regional disparity convergence literature by applying NTL data. NTL has been used to show regional disparity and NTL convergence is a matter of interest in prior research. However, this study is predominantly based on other countries (Basher et al., 2022; Lessmann & Seidel, 2017; Xiao et al., 2021). The study by Chanda and Kabiraj (2020) is an important milestone in the research on NTL convergence in India. However, Chanda and Kabiraj’s (2020) study focuses on district-level convergence. Based on their work, Kar et al. (2023) demonstrate state-level convergence using NTL data. Kar et al. (2023) utilise the same data set as Chanda and Kabiraj (2020), that is, the DMSP-OLS data. Thus, the study of state-level club convergence is available only up to 2010. The DMSP-OLS data are available until 2013, and from 2012, a more advanced NTL data set, obtained from the VIIRS system, became available. VIIRS is considered superior to DMSP-OLS because it offers higher spatial and radiometric resolution, allowing for more detailed and accurate NTL data. It also reduces data saturation issues in urban areas, providing better differentiation between bright and dim regions. In this study, we use this advanced VIIRS NTL data, which has been available since 2012, to show recent trends in regional disparity convergence. Additionally, our study applies the same methodology of convergence, namely the Phillips–Sul (PS) method of club convergence, which was used by Kar et al. (2023). This method checks for convergence through a non-linear factor dynamic model and accounts for non-linear convergence or multiple convergence equilibria, which is club convergence. Initially, the overall convergence of all states is tested using a log(t) test. If the overall convergence is not detected, it then checks for club convergence. In the presence of cross-sectional heterogeneity in the transition of NTL growth, non-linear convergence is a more probable outcome. Club convergence allows regions to endogenously converge into different groups (Bhattacharya et al., 2018). In this respect, the PS club convergence method is superior to traditional β and σ convergence tests. The β convergence test examines whether regions with initially lower levels of NTL radiance are growing faster than regions with initially higher levels of NTL radiance. However, this does not necessarily imply that regional disparities in the concerned variable (NTL radiance in our case) are narrowing. As our study focuses on whether regional differences in NTL radiance are diminishing over time, the σ convergence test becomes more relevant. The σ convergence test assesses whether the standard deviation of NTL radiance across regions is decreasing over time, thereby indicating whether regions are becoming more similar in terms of NTL radiance. The PS club convergence test incorporates this σ convergence test to assess convergence. However, the PS method is considered superior to the traditional σ convergence test. In the first step, the PS method tests whether regions are converging in the σ sense. If convergence is found, it indicates that regions are converging. If overall convergence is not detected, the PS method clusters regions into clubs and checks whether regions within each club are converging in the σ sense.
In several ways, our study adds significant value to the existing literature. First, it applies NTL data to the issue of regional disparity and examines the recent convergence pattern of regional disparity. Second, it reveals the convergence pattern of NTL using recent data, thereby identifying current trends in NTL convergence. Prior to the time frame of our study, the work of Kar et al. (2023) showed that Indian states are club converging. Hence, in this study, we examine whether club convergence is still relevant in the recent time frame. Third, beyond the traditional β and σ convergence techniques, we explore the more practical outcome of club convergence.
The rest of the article is structured as follows: Section II discusses the data and methodology used in our study. Section III presents the results, and Section IV concludes the article by summarising the findings and highlighting the limitations and future scope of research.
Data and Methodology
Night-time light radiance data has been used as NTL data. More specifically, cumulative radiance, which is reflected by radiance divided by area, is used for this study. This data set is collected from NRSC’s official website. NRSC is one of the arms of the Indian Space Research Organisation (ISRO) and is responsible for dealing with satellite sources data. The NRSC uses VIIRS data to provide NTL radiance data. VIIRS is considered an advancement over its predecessor, the DMSP-OLS data. The DMSP-OLS system suffers from several issues, such as coarse spatial resolution, saturation in brightly lit areas, over-glow and blooming effects, and limited sensitivity. To address these problems, the more advanced VIIRS system was developed, which resolves the aforementioned limitations of the DMSP-OLS. The VIIRS system has been providing data since 2012. Therefore, we use data from 2012 onwards, with the time frame selected for this study being from 2012 to 2021. Furthermore, Kar et al. (2023) demonstrated both state-level and district-level club convergence using DMSP-OLS NTL data prior to 2012. Consequently, this study uses the more recent NTL data available from 2012 onwards. All 28 states have been considered for this study. Previous research on regional convergence among states predominately considered major Indian states only. Thus, newly formed states or Northeastern states received no place in their studies. We use the time frame of recent years, from 2012 to 2021, which paves the way to include all the states for this analysis. The 10 years of the study period is small. However, we use Phillips and Sul’s (2007) technique to analyse the convergence pattern. The PS technique is robust to smaller time frames, giving unbiased and efficient results even at smaller times. The map of sample states is reflected in Figure 1. The light blue colour areas are the states under consideration.
Map of Sample States.

Map of Sample States.
We use Phillips and Sul’s (2007, 2009) technique to check the convergence pattern in NTL among Indian states. The traditional convergence techniques are based on neoclassical growth models, where it is assumed that there is a single steady-state equilibrium level, and poorer areas eventually converge with richer regions. However, when this single steady-state assumption is tested empirically, there are multiple steady-state equilibrium points rather than a single equilibrium point (Baumol, 1986). Thus, the idea of a convergence club arose. In the growth trajectory, the cross-country heterogeneous transition behaviour often leads to more than one steady-state equilibria. The PS technique gives room to capture the heterogeneity and non-linear behaviour of cross-sections and provides a methodology for club convergence analysis.
Suppose, we have a panel data set of variable

Next, a Hodrick–Prescott (HP) filtering technique removes the trend component from the time series data. A smoothing parameter equal to 400 is used to filter the annual data. Equation (1) can be transformed into equation (2) since
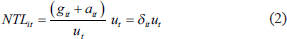
In Equation (3),
For the club convergence algorithm, the following assumption is needed to be made regarding

In Equation (4),
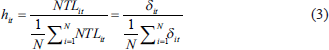
To check the convergence of all cross-sections or determine the existence of common steady-state equilibrium, the null hypothesis (H0) is:


Equation (5) represents H0 of panel convergence towards a single-steady state equilibrium. In contrast, Equation (6) represents the alternative hypothesis indicating the non-existence of panel convergence. The H0 is tested in the PS framework through the
In Equation (7),
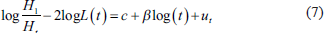
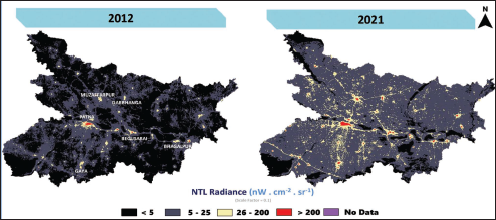
The trend in NTL of Indian states is depicted in Figure 2. In 2012–2021, the NTL increased by 43% in India. Such change in NTL can also be seen in Figure 3, where the NTL of 2012 and 2021 are compared. In Figure 3, a significant increase in luminosity is seen on the Indian map. However, at the state level, there are wide variations in luminosity. Figure 4 reflects the regional variation in the growth of NTL. Bihar and Manipur show the most impressive performance in NTL growth among the states. In Bihar, the NTL has increased by 473% within 10 years. Meanwhile, in Manipur, there is a 440% rise in NTL. The higher growth of NTL in Bihar and Manipur has been highlighted by previous studies as well (Rehman et al., 2021). Schemes such as the Deen Dayal Upadhyaya Gram Jyoti Yojana for rural electrification, the Prime Minister’s Saubhagya scheme (providing electricity access to all), and the Power for All programme (aiming to facilitate 24/7 power for all by 2019) have been pivotal in driving this significant growth in NTL data. In Bihar, not only did the radiance of major cities like Patna, Muzaffarpur, Gaya and Begusarai increase, but from 2012 to 2022, the NTL radiance of the entire state also saw an overall rise (see Appendix 1). Additionally, transit areas between large cities, such as those between Patna and Gaya and Patna and Muzaffarpur, also witnessed a sharp increase in NTL radiance. Regions like Jhanabad, Vaishali, Siwan and Patna are among the areas where NTL radiance growth has been particularly high.

NTL Radiance Growth.
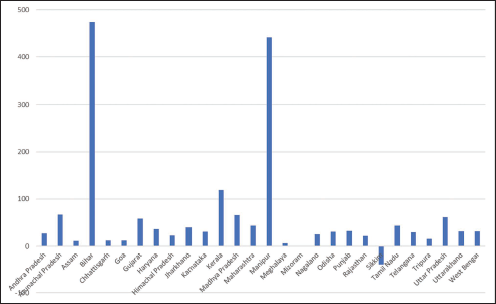
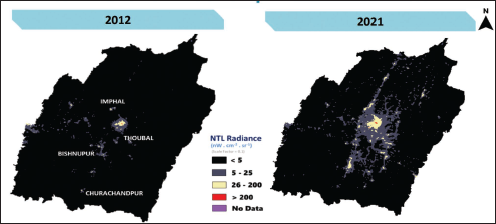
The substantial growth in NTL radiance in Manipur has primarily been driven by growth in the valley regions of the state. Imphal East, Imphal West, Thoubal and Kakching are among the areas that have seen significant increases in NTL radiance. This high growth rate can be attributed to the base effect, as the initial NTL radiance in Manipur in 2012 was much lower compared to other states. Although Manipur’s NTL radiance growth is among the highest, there remains significant untapped potential, especially in the hill areas (see Appendix 2).
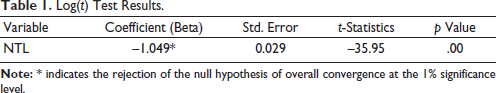
Kerala ranks third, where the NTL radiance has more than doubled within these 10 years. However, in some states, the NTL growth rate is negligible. Mizoram has no change in NTL in this time frame, whereas the NTL growth in Sikkim is negative. Sikkim was less luminous in 2021 compared to 2012. Figure 2 shows that there is no common convergence equilibrium point. This visual examination supports the widely available literature that Indian states do not tend to converge towards a single steady-state equilibrium. However, this intuition can be further confirmed by the log(t) tests in Table 1. In Table 1, the t-statistics is lower than the critical value at a 5% significance level, which makes rejection of the null hypothesis of convergence among all states. Thus, we conclude that states are not converged towards a common equilibrium point. However, rejecting the convergence hypothesis in the whole sample paves the way to test for club convergence.
Log(t) Test Results.
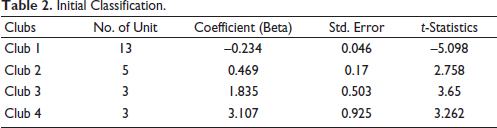
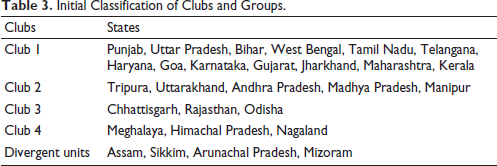
In the next step through the PS algorithm, we cluster the samples into the clubs and verify whether there is evidence of club convergence. We find four clubs and one group of four divergent states in the initial classifications (Table 3). In Table 2, the t-statistics show that three out of four clubs follow a convergence trend. The value of t-statistics in club 1 is lower than the critical value (–1.65) at a 5% significance level. Thus, we can conclude that states in club 1 are neither converging nor diverging (NCND). However, the t-statistics of club 2, club 3 and club 4 are more than the critical value at a 5% significance level. Thus, states in these clubs are converging among themselves.
Initial Classification.
Initial Classification of Clubs and Groups.
In the next step, we use the PS algorithm to check whether merging these clubs and groups is possible to get our final classification. This step reduces the number of clubs and also reduces the number of divergent states. Table 4 shows the results of the final clubs. Club 1 remains the same as the initial classification. Where 13 major states do not tend to converge. Club 2 is formed by merging club 2 and club 3 of the initial classification. These states are converging among themselves. In the final classification, club 4 of the initial classification forms club 3. The states within these clubs are converging. The value of the coefficient reflects the speed of convergence. Interestingly, the final club 3 exhibits a much faster convergence rate than final club 2. Moreover, the number of divergent states in the final classification also falls—Assam, a divergent state in the initial classification, joins final club 2. In final club 1, we have states with relatively higher NTL. Thus, these areas’ economic activity is considerably larger than other regions. These states are the 13 major states in India. Due to its massive 473% growth in NTL recently, Bihar also joined this club. As these states do not show a convergence pattern, the regional disparity in India is worrisome. Neither these states are converging among themselves, nor do the states with low NTL tend to converge with these states. Thus, the final club’s result shows an alarming picture, where we can conclude that in recent years, the regional disparities in India have shown no tendency to decline. The overarching findings contradict with the neoclassical growth framework of convergence.
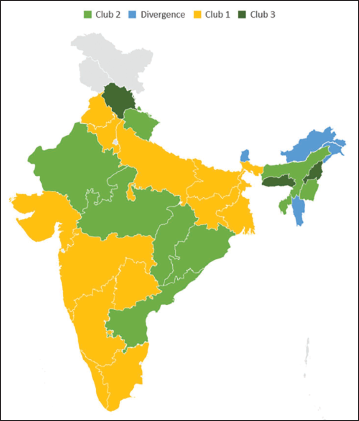
In final club 1, the states are either those with some of the highest population densities in India, such as Bihar, West Bengal, Uttar Pradesh and Kerala, or some of the richest states, such as Maharashtra, Gujarat or Tamil Nadu. In final club 2, the states tend to have either relatively lower population densities or lower per capita incomes than those in final club 1. In final club 3, we have states like Meghalaya, Himachal Pradesh and Nagaland. These states are either Himalayan or northeastern, characterised by lower development and remote geographical terrain. These three states are converging towards a lower relative NTL radiance point, with their relative NTL radiance growth significantly lower than those states showing high NTL radiance growth. All the divergent states are also from northeast India, which has a lower population density and is geographically remote. Among the three divergent states, two exhibit either negligible or negative growth in NTL radiance. Therefore, while NTL radiance is generally increasing across India, two divergent states, Mizoram and Sikkim, show a pattern of divergence. Another northeastern state, Arunachal Pradesh, also displays divergence, although its NTL radiance has increased over time. The spatial distribution of the final clubs is represented in Table 5 and Figure 5.
Final Classification.

States in Final Clubs and Groups.

Spatial Distribution of the Clubs.
Next, we check the robustness of the club merging technique of PS through a method provided by Von Lyncker and Thoennessen (2017) (vLT). The vLT methodology of club merging is considered an advancement over the PS technique. The vLT results are similar to the PS technique results in our case. This technique also finds three final clubs and three divergent states (see Table 4). While club 2 and club 3 show the property of convergence, states in club 1 are not converging. Thus, we have robust results of club clustering.
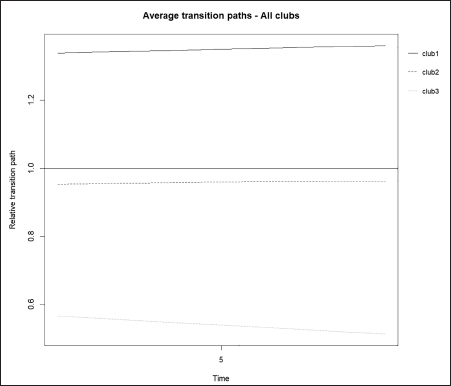
Finally, Figure 6 shows the final clubs’ average transition path, which reflects each final club’s relative growth path in NTL. Club 1 lies over the relative value of 1 and exhibits a higher level of NTL than other clubs. The lack of convergence in this high NTL club raises concerns in terms of regional disparity in India. The average transition paths of clubs 2 and 3 show that the equilibrium paths of these two clubs are below the relative cross-sectional value 1. In the transition path, the relative value of club 2 remains more or less unchanged, which signifies that although the states converge within club 2, it does not have a relatively higher NTL. Club 3 shows a pattern of NTL growth decline. Club 3 is attaining a lower equilibrium position than its initial position. The regional disparity picture, provided by the average transition path, clearly shows that regional disparity in India shows no sign of converging. These findings have a crucial political angle as well. The time frame we used is from 2012 to 2021. Within these 10 years, 8 years have been governed by the BJP-led National Democratic Alliance (NDA) in the centre. Thus, in their governance, regional disparity has increased. Interestingly, a study by Tiwari et al. (2020) reveals that regions in India from 2005 to 2011 showed convergence in regional disparities. Thus, we have evidence to believe the prior NDA government regional disparity was on its way to decline; however, from NTL data, we find that such disparity has shown no sign of falling in recent times. A similar result is observed when we compare the findings of our study with those of Kar et al. (2023). Kar et al. (2023) used NTL radiance data from 2000 to 2010 and demonstrated that major Indian states (excluding Bihar) were converging into two clubs. However, in our findings, the 13 major Indian states in club 1 are not converging. Thus, we can conclude that a pattern of convergence, although not absolute but in the form of club convergence, was evident in the early 2000s. In recent times, however, this convergence appears to be weakening.
Average Transition Path.
The existing empirical literature on regional convergence has been extended in this study. Our study is valuable in two approaches. First, we contribute to the limited literature in the Indian context by using NTL data to test regional convergence. While similar attempts have been made in other countries, such studies are rare in India. Second, we use a very recent time frame to show the trend of regional disparity. A vast body of literature exists to show the trend in regional disparity in India in both pre- and post-reform periods. Thus, we have chosen the most recent time frame, where the most advanced data sets are available. Our findings reveal that regional disparity in India shows no signs of convergence. States with higher regional economic activity or population density form groups without indications of convergence, while states with lower regional economic activity or population density tend to converge among themselves. However, these two converging clubs are nowhere near catching the NTL of club 1. This finding has some important policy conclusions. Prior studies found that differences in human capital, infrastructure and logistics are the central reasons for such regional disparities. Investment in such areas is appreciated to reduce regional disparity. The concentration of industries in certain areas contributes to such regional disparity in India. A decentralised industrial policy is recommended in this context. The central government is already working in this way. The ‘Make in India’ and ‘One district, one product’ approaches aim to decentralise the industry. However, the effectiveness of these policies is still the subject of argument.
Finally, we would like to highlight the limitations and suggest future directions for research. We use NTL as a measure of regional disparity. Numerous prior studies have found a strong correlation between NTL and regional disparity, and NTL has been commonly used in previous convergence studies to measure regional disparity. However, whether NTL is a perfect measure of regional disparity remains a matter of debate. For instance, rugged terrain may result in lower NTL radiance compared to flat, more densely populated areas. Rajasthan, a large state with a significant desert area, will naturally exhibit lower NTL radiance. In contrast, although not economically prosperous, a state like Bihar, with high population density, shows higher NTL radiance. Moreover, our study focuses on a relatively short time period. While the PS technique of club convergence testing is efficient and robust even with shorter time frames, future studies should consider including a longer time horizon to capture more comprehensive trends. Although the VIIRS does not provide data for a longer period, other reliable sources offer extended data sets for sub-regional areas in India. Additionally, while we identified clubs in this study, future research could investigate the determinants of club formation. In such studies, club membership could serve as the dependent variable, and relevant independent variables could be drawn from the existing literature. Using ordered logit regression, the determinants of club formation could be explored in future research.
Appendix 1: Figure of Decadal Change of NTL Radiance of Bihar
Appendix 2: Figure of Decadal Change of NTL Radiance of Manipur
Footnotes
Acknowledgement
The authors are thankful to the Editor of the journal and two anonymous peer reviewers for their suggestions and feedback on the earlier version of the manuscript.
Data Availability Statement
Data is freely available on the NRSC website. However, data will made available by the corresponding author on request.
Declaration of Conflicting Interests
The authors declared no potential conflicts of interest with respect to the research, authorship and/or publication of this article.
Funding
The authors received no financial support for the research, authorship and/or publication of this article.