
Abstract
Translating the concept of a living wage into a cash figure presents a number of challenges. A recent review of the approaches used in the UK explored these, with the aim of creating a unified and improved calculation. Designing a living wage relies on some technical decisions, such as which data sources are most appropriate. But many of the building blocks underlying a living wage require judgements on societal values, expectations and norms. The living wage rates in the UK are voluntary and promoted by campaign groups; this means any methodology needs to be empirically sound but also recognise the realities facing employers. No perfect approach can exist. But through analysis, consultation with stakeholders and a clear governance structure, the method used in London and the rest of the UK offers a robust, respected and up-to-date way to calculate the income needed to meet a decent standard of living.
Introduction
The concept of a living wage is not a new one. Calls for ‘just’ prices could be heard in medieval Europe (Hirsch and Valadez-Martinez, 2017). Unions have made the case for ‘a fair day’s pay for a fair day’s work’ since the 19th century, with religious groups and economists often echoing these demands. Translating a living wage from a slogan to a cash figure, however, has a shorter history. Seebohm Rowntree’s study of poverty and living standards in York, as well as being a landmark in research of life on a low income, led to his calculation that in 1914 a father and mother with a family of three children would need a weekly wage of 35 shillings and three pence (Wills and Linneker, 2012).
This article does not seek to provide a comprehensive history of such living wage calculations. Instead, it focuses on the recent past in the UK, and the development of a living wage campaign and calculation. First, we briefly discuss the history and politics of the living wage in the UK in the 21st century, how the London and UK rates emerged and the creation of an aligned method. Second, we outline the two original methods highlighting the shift from deriving the cost of living element of the living wage calculation from a model based primarily on expert opinion to one based on public consensus. Third, we discuss the trade-offs and tensions that are unavoidable in any living wage, particularly the role of state support in its calculation and how the review to create an aligned method chose a path. Finally, we reflect on the contributing factors that have helped the London and UK rates succeed and what the UK experience suggests for attempts to spread a living wage across Europe.
The living wage campaign and history of the calculation
In 2001, the London Living Wage (LLW) arose out of a campaign by a collection of trade unions, faith groups and charities called TELCO (Wills, 2001). Rather than simply calling for higher pay, TELCO supported the calculation of an hourly wage that would provide a basic standard of living for a full-time worker. This figure was calculated from research carried out by the Family Budget Unit (FBU) at the University of York. The FBU research followed in the spirit of Seebohm Rowntree’s work 1 and aimed to describe a ‘low cost but acceptable’ lifestyle with the basket of goods and services required to do so largely decided by expert opinion (Bradshaw, 1993). The Living Wage rate reflected both the budgetary need of certain family types and the level of support government offered through the tax and benefit system for such families. Both factors are key to the calculation of the rate at a given point in time and changes to both are closely tied into the evolution of the rate and campaign.
A landmark came in 2004 when the Mayor of London endorsed the concept of the Living Wage. Following this, the Greater London Authority (GLA) – the regional government for London – took control of the annual update of the LLW with the first rate for 2003/2004 set at £6.40, when the minimum wage was £4.20.
TELCO eventually became one part of a larger national group of charities called Citizens UK, which had – as the name suggested – a UK-wide focus. Local chapters of this broader organisation began their own campaigns for a living wage outside of London ultimately leading to a push for a living wage for the rest of the UK, acknowledging: that a rate for London already existed and was likely to be higher than the one for the rest of the UK; that the National Minimum Wage was insufficient to meet a decent standard of living for many family types; and that the variation in the cost of living across the rest of the UK was narrow enough to make a single outside-of-London rate a coherent proposal.
The research approach used by the FBU was initially developed further, jointly with researchers at the Centre for Research in Social Policy (CRSP) at Loughborough University, funded by the Joseph Rowntree Foundation (Bradshaw et al., 2008). Through this process, far greater weight was given to public consensus on what constitutes an adequate standard of living. Subsequent reports were produced solely by CRSP and remain funded by the Joseph Rowntree Foundation.
This work on Minimum Income Standards (MIS) underpinned the first UK Living Wage (UKLW), which was set at £7.20 in 2011/2012, compared to a then £8.30 LLW and £5.93 minimum wage (Hirsch, 2011). CRSP oversaw the update of the rate each year. A new charity, the Living Wage Foundation, was established by Citizens UK to encourage the UKLW’s uptake among employers and promote it as a recognised standard, with a key role of accrediting employers as Living Wage Employers if they demonstrate that they pay at least the Living Wage.
Over a similar period of time, after its implementation in 1999, the National Minimum Wage – the legal wage floor – moved through a number of phases. Following initial caution surrounding its introduction, a lack of evidence of a disemployment effect encouraged the Low Pay Commission 2 – the body tasked with recommending its level – to raise it more quickly. This ‘expansion’ came to an end with the financial crisis of 2008. In the post-crisis years the adult minimum wage did not lose ground relative to median wages, but did fall in real terms. By 2015, it began to outpace prices again but increases remained gentle, with its real value well below its historic peak. Over the same period, wage growth further up the distribution was disappointing, with the UK’s pay performance among the worst of advanced economies.
Against this backdrop of poor pay performance, the government announced a new ‘National Living Wage’ (NLW) for people aged 25 and over. Despite its title, there was no connection to the LLW and UKLW, or indeed to the cost of living or the requirements for a decent lifestyle. Instead, it was effectively a supplement to the NMW for all but the youngest workers. The government set a target for the NLW to reach 60 per cent of the median hourly earnings of those aged 25 and over by 2020. As Figure 1 illustrates, this represented a major upward shift in the trajectory of the minimum wage but as of April 2016 when the first increase came into place at £7.20, it remained some distance behind the UKLW (£8.25) and the LLW (£9.40).
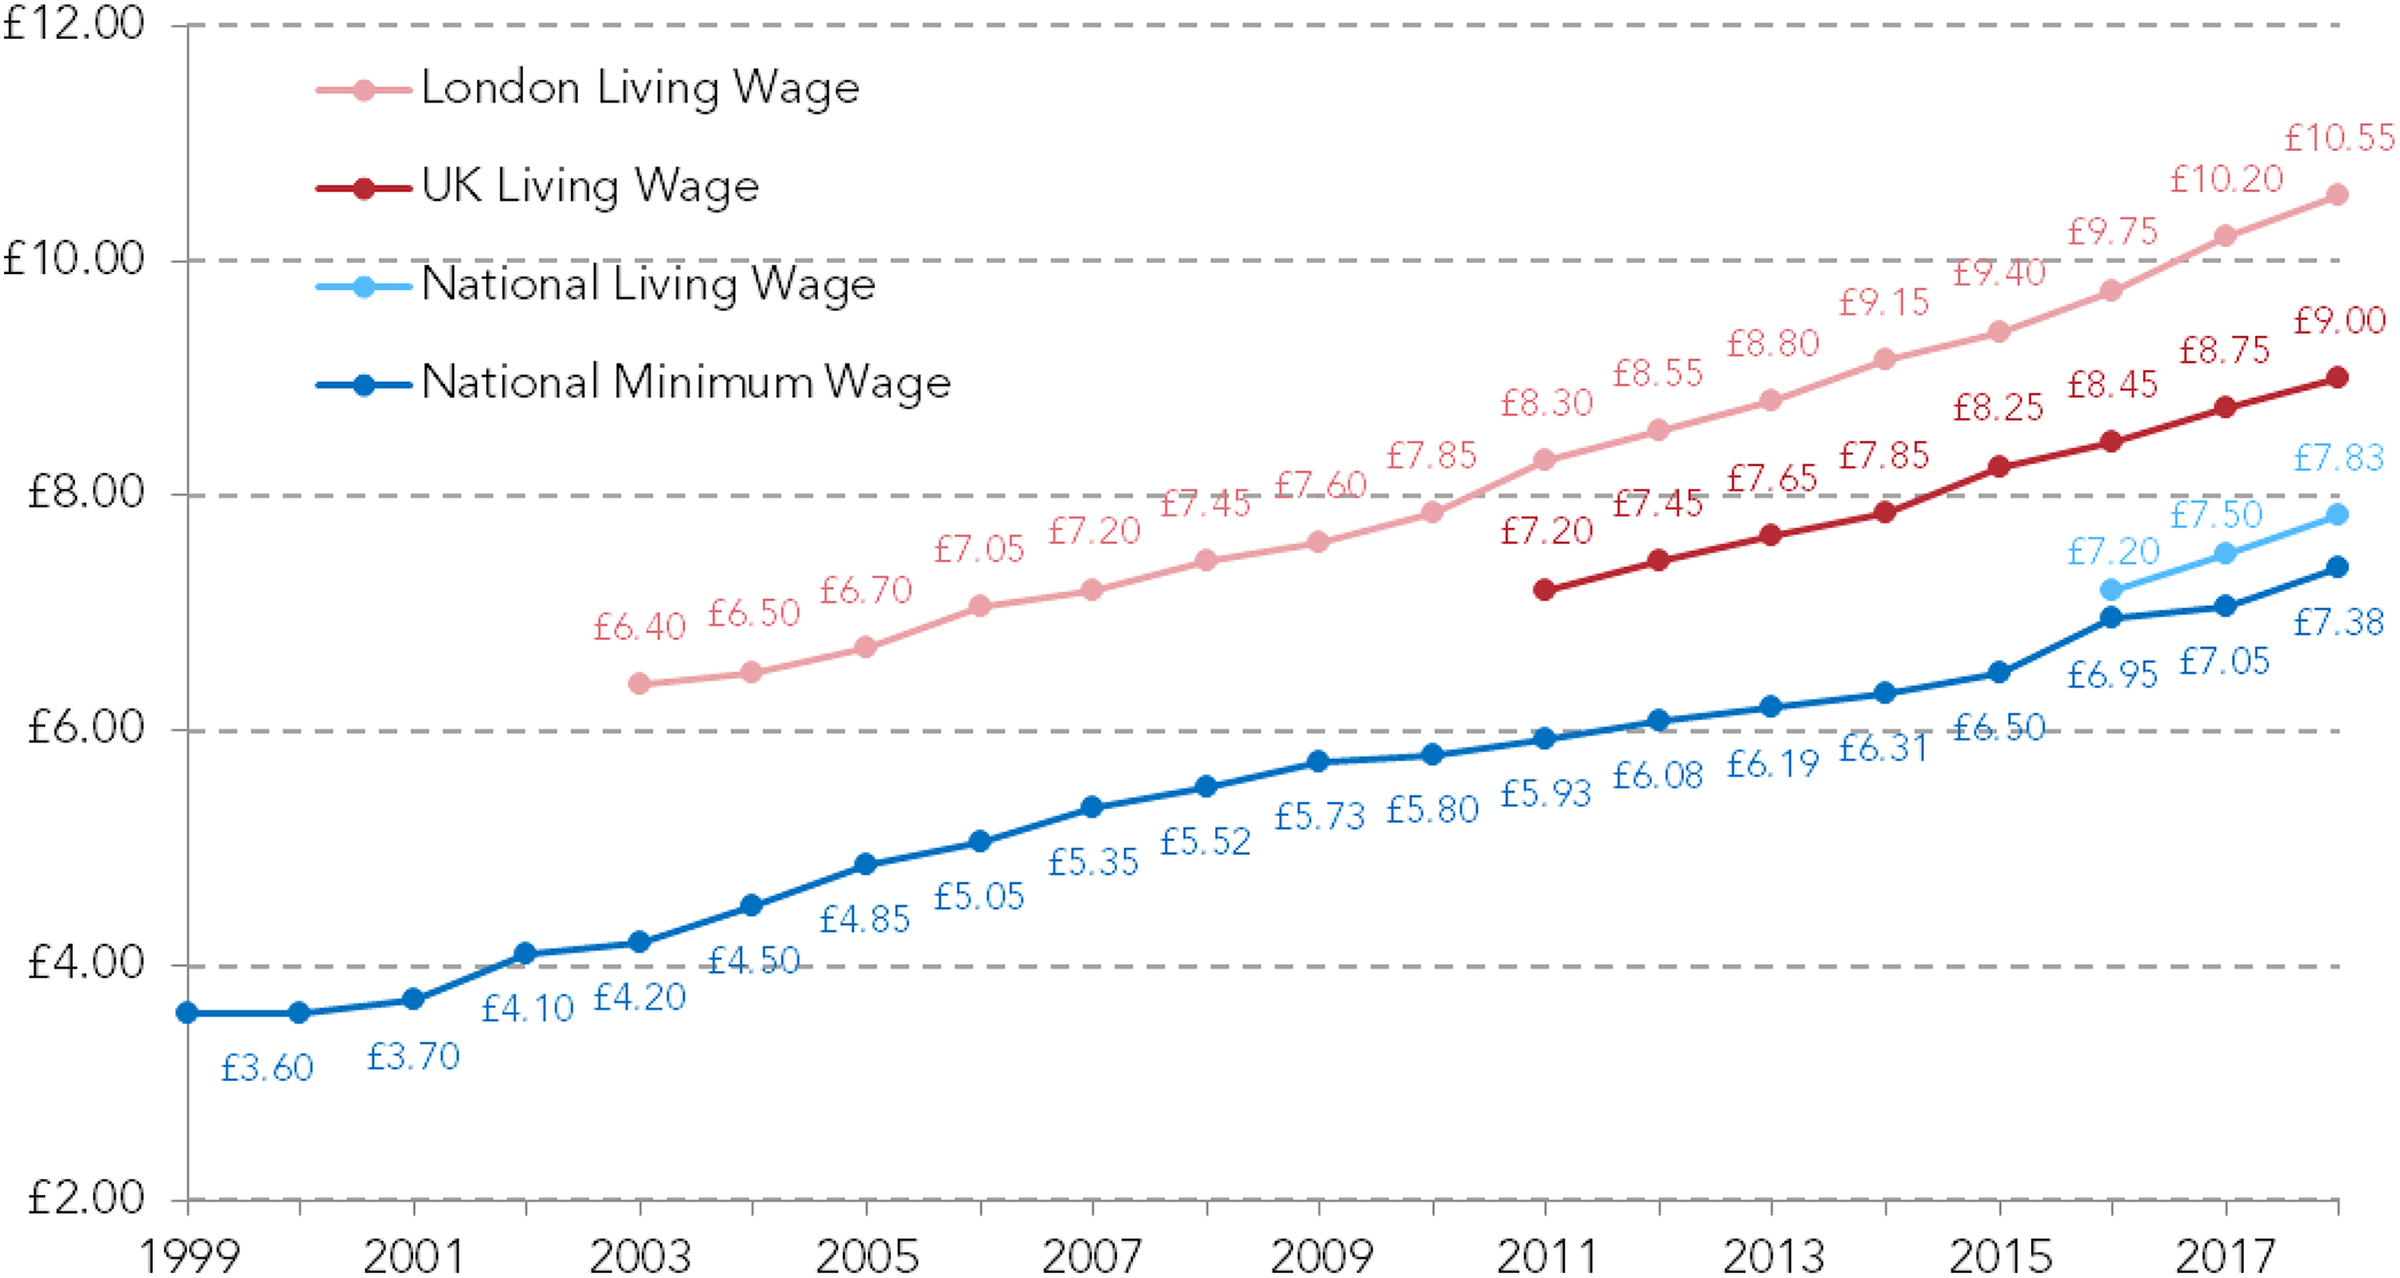
Levels of minimum wages and living wages in the UK.
The decision to co-opt the terminology of a living wage into the minimum wage framework was a double-edged sword. On the one hand, it was a substantial raising of the wage floor and provided an endorsement of the power of the concept and the need for higher wages. On the other hand, it significantly muddied the waters, with a lack of clarity over the difference between the new higher minimum wage and the ‘real’ living wage. As the future head of the Living Wage Commission wrote in 2015, ‘[j]ust because I call my cat Rover, it doesn’t make it a dog’ (Kelly, 2015).
This was just one challenge the Living Wage Foundation was dealing with at the time. Two others are worth dwelling on. First, there was the issue of methodology. Neither method was deemed to be perfect – no method can be – but employers questioned why two meaningfully different approaches were used within the same country and with similar names. Identical price pressures could be applying to both the UKLW and LLW but the rates could theoretically behave in very different ways.
Key to these methodological differences were the timing of when each approach was developed and the available evidence on what would constitute an adequate standard of living. The FBU basket – based more on expert opinion – initially utilised in the LLW developed into the MIS basket – based more on public opinion – utilised in the UKLW. That the MIS basket is estimated based on public consensus as to what constitutes an adequate standard of living and that it is regularly updated were important factors in the subsequent review discussed in what follows.
The second recurring issue was governance, particularly regarding how change was managed within the calculation. Previously a primarily technical point, this became more relevant both practically and politically following a series of significant changes to the generosity of working-age benefits starting in 2011 which coincided with the planned introduction of a new benefit called Universal Credit. 3
Both the UKLW and LLW were calculated on a post-tax-and-transfers basis. With Universal Credit restructuring support for working families, resulting in some being worse off and others gaining, and a timetable for introduction that was uncertain to say the least, a decision on how and when to bring this new benefit into the calculation would be required. While papers were published separately each year by the Greater London Authority and the CRSP explaining the underlying calculations and, in some years, changes made and the logic behind them, the decision-making process was opaque and with little obvious sense of a shared response to the same developments.
These concerns led the Living Wage Foundation to establish a Living Wage Commission. Based roughly on the model behind the Low Pay Commission, it brought together high-profile representatives from the trade union movement, business, academia and civil society. Its first task was to review the existing methods and explore the scope for moving to a single aligned approach, while maintaining a differential between the UKLW and LLW. The Living Wage Commission commissioned a think tank, the Resolution Foundation, to evaluate the methods, the data and assumptions used, and the scope for improvements. The authors of this article led that review, which was published in July 2016 (D’Arcy and Finch, 2016). The following section provides an overview of the approach of that review but begins by painting a picture of the two ‘original’ methods (summarised in Table 1).
Calculation of Living Wage (LW) in the UK.
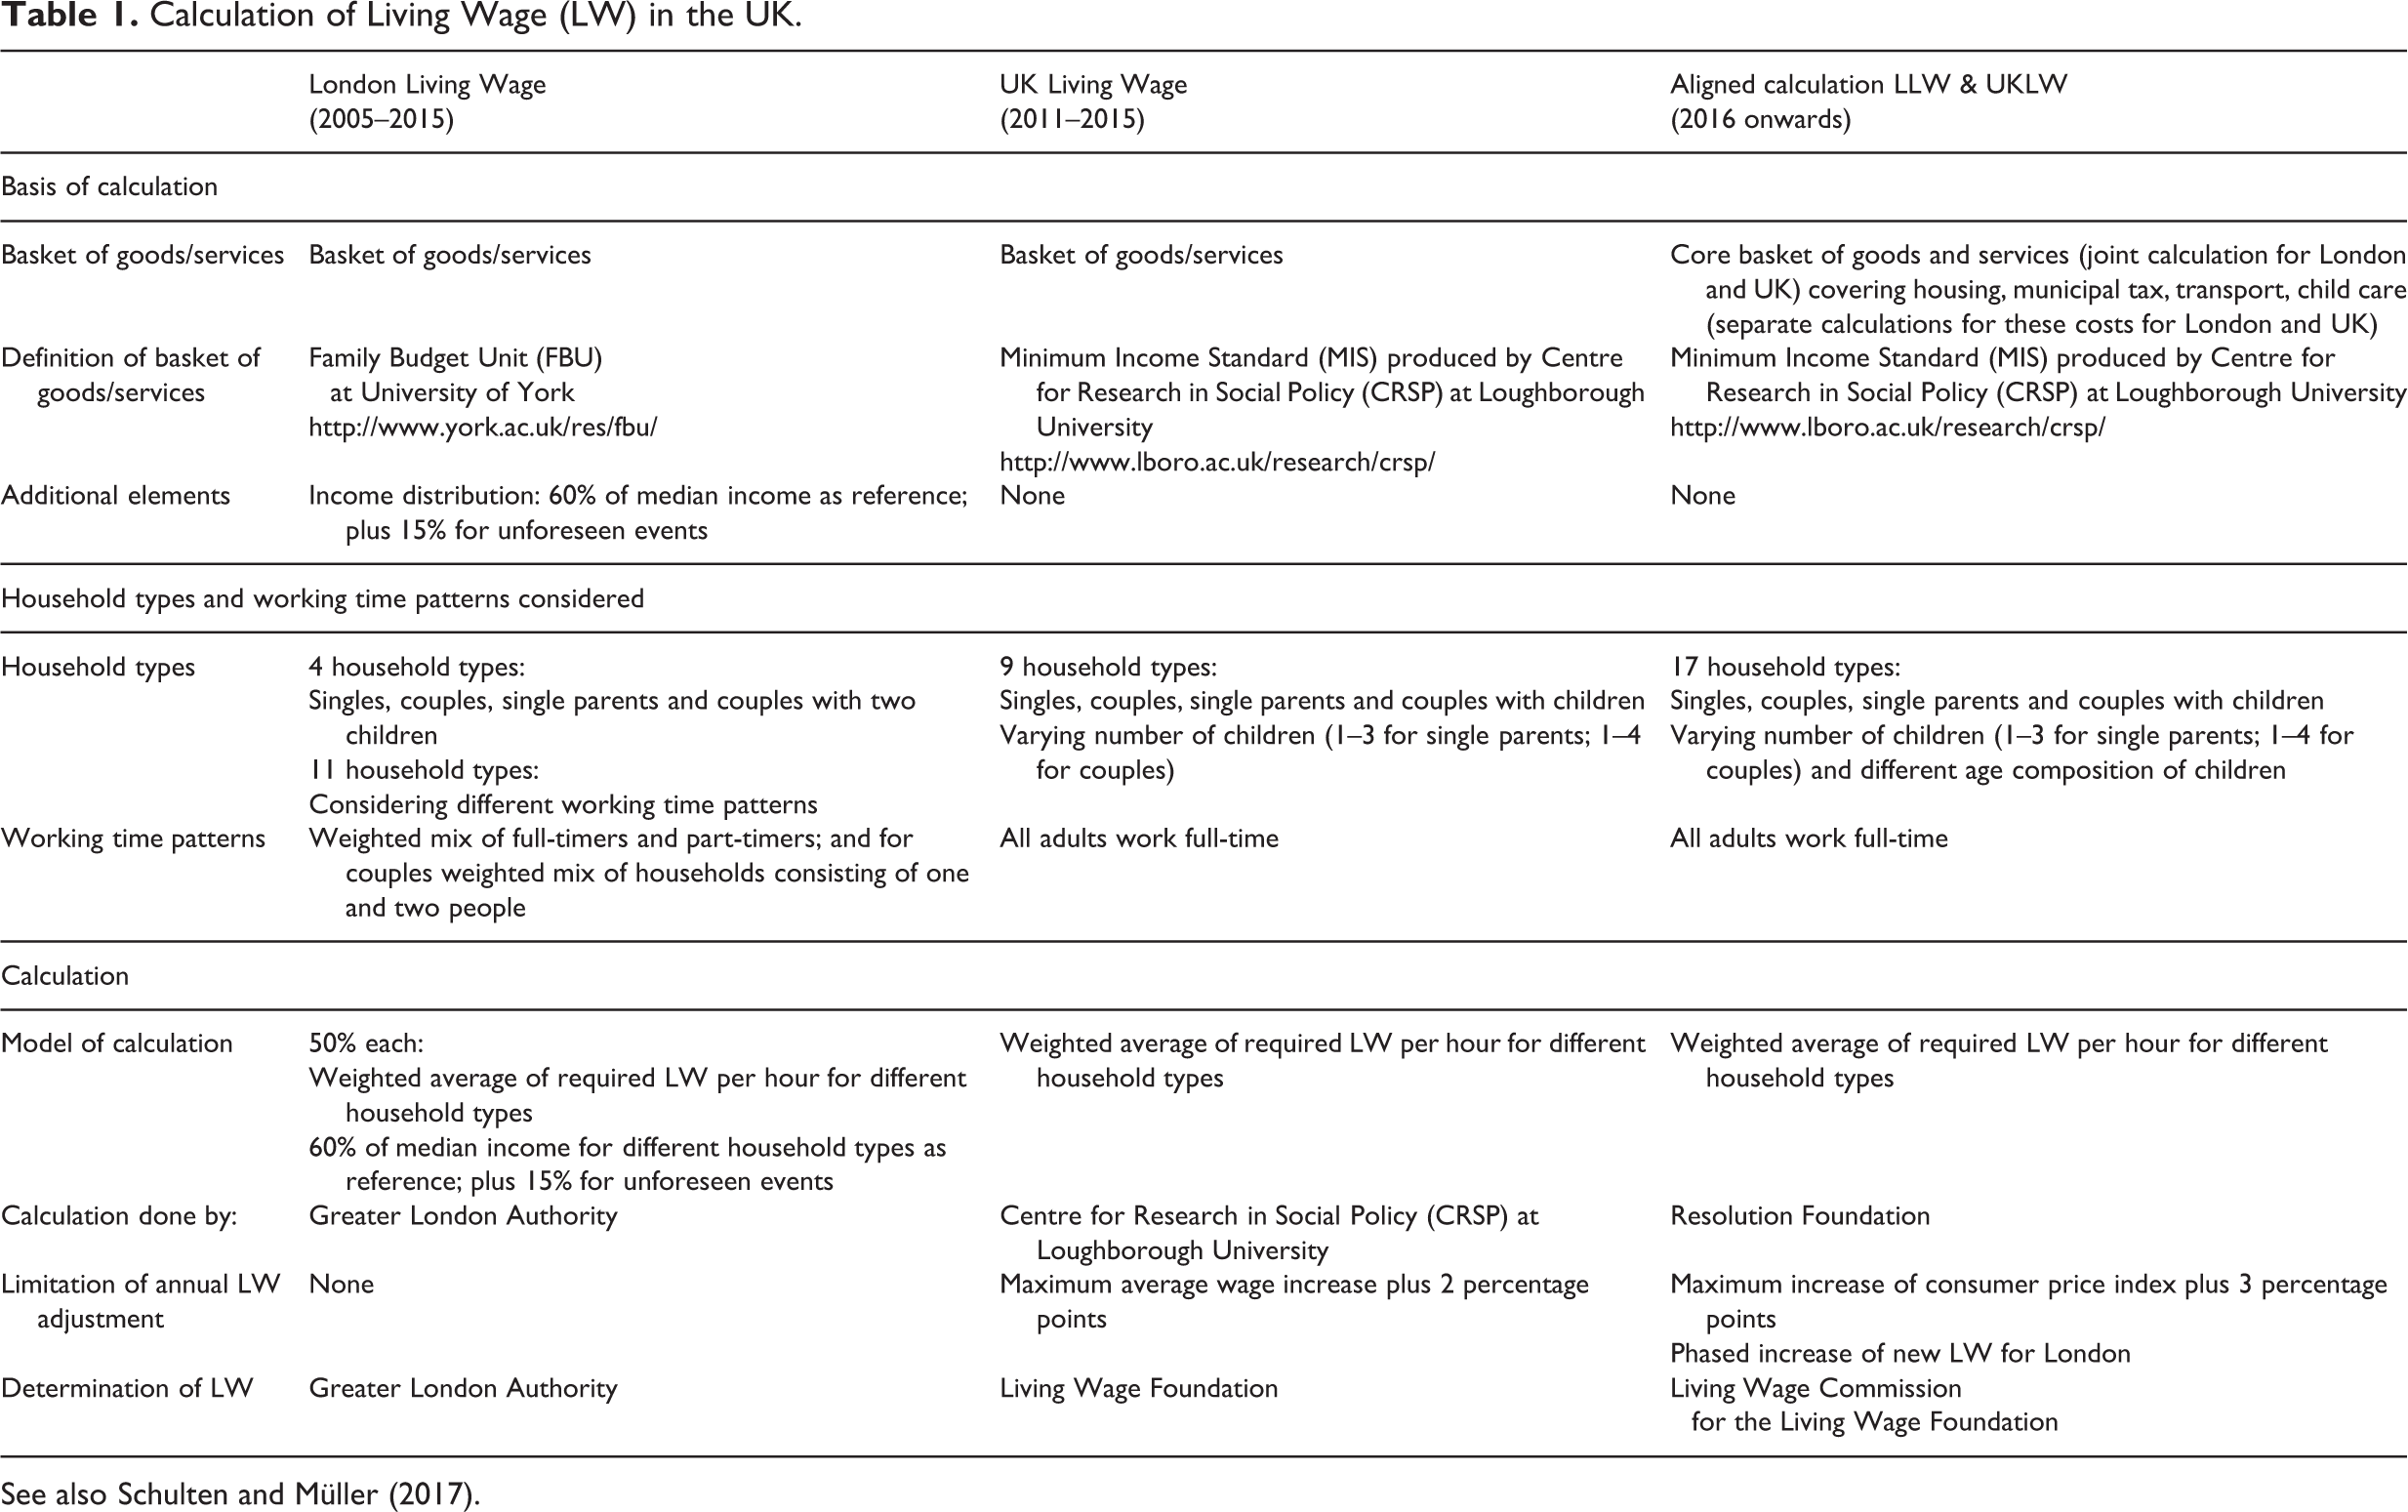
See also Schulten and Müller (2017).
The previous methods and the scope of the 2016 review
The London Living Wage
The LLW was composed of two halves: a ‘basic living costs’ component and an ‘income distribution’ component. The two halves made an equal contribution to the final rate. The research discussed above by the FBU served as the basis for the living costs component. The FBU research primarily used statistical data and expert opinion, supplemented in some instances by focus groups to set out what families needed to meet a ‘low cost but acceptable’ standard of living. This culminated in a detailed ‘basket’ of goods and services, setting out in detail the sorts of food, clothes and household items different kinds of families would need (primarily varying by age and number of children) and the prices they could expect to pay for them.
The research was originally carried out with families in York, with families in the east end of London asked whether the contents of the ‘basket’ needed to be altered to reflect different lifestyles or needs there. The FBU carried out this research over several years, but the basket which underpinned the LLW initially calculated in 2001 was formulated in 1998. Each year, the GLA adjusted the cost of the different elements of the basket in line with published inflation figures (the Consumer Price Index). Larger costs which were also more likely to vary from place to place and by quality – including housing, travel, child care and council tax – were treated separately and updated using government data or other relevant sources.
The other half of the calculation, the ‘income’ component, took a very different approach. It effectively set an income target for each family to meet. This was set at the relative poverty threshold of 60 per cent of median income.
The LLW approach made a number of assumptions on the families that were to be included in the calculation. First, it was decided to use a mix of 14 different family types, some with children (two children aged four and 10 years old in all families with children) and some without. The second decision was that their working patterns should vary. This meant that in all households, a variety of working patterns were used. For instance, in a couple with two children, two full-time workers; one full-time and one part-time; one full-time; and one part-time were used.
Using both approaches, a final required weekly income needed by each family type was calculated. The wage required to meet that level was then produced, taking into account tax and benefits 4 , for instance deducting income tax from gross wages and adding on any in-work support that a family may be entitled to based on their circumstances. Any families in which the wage fell below the legal minimum wage were brought up to that level with the median wage used as a ceiling for those with very high wage requirements. A weighted average of those wages based on the prevalence of the different family types in the London population was then produced, one for each half of the method. This meant that though a single parent with three children would need a higher hourly wage to meet the Living Wage standard of living than a couple without children, the single parent’s contribution to the overall rate would be relatively small, given this family type is relatively rare. The average of these figures was referred to as the ‘poverty threshold wage’. A premium of 15 per cent was finally added to ‘protect against unforeseen events’ (GLA Economics, 2015).
The UK Living Wage
The UK method adhered much more closely to the ‘basic living costs’ approach outlined above. Nine working-age households were used as the underlying basis, once again with a mix of number of parents and children as in the LLW. The UKLW, however, featured more variation in terms of the number of children and their ages, with between one and four children in households and ages ranging from an infant to secondary school pupils. There was no variation when it came to working patterns, with all adults assumed to work full-time (37.5 hours per week).
As with the LLW, the primary basis for the amount of money needed each week for these UKLW families is budget standards research, with housing, child care and travel costs adjusted to reflect an average in the UK outside of London. Unlike the LLW, the contents and prices of the UKLW ‘basket’ were repeatedly updated with a rolling cycle of research carried out for families with and without children.
A final point of difference between the two methods was the UKLW’s ‘earnings cap’. This rule was introduced into the calculation based on the rationale that ‘[i]f the income needed to sustain a minimum acceptable standard of living rises much faster than average earnings, there will be limits to how far it is acceptable for employers to increase wages for the lowest earners to meet their increased needs’ (CRSP, 2015). To prevent annual increases from being very high relative to general wage rises this cap was set at the percentage increase in average earnings in the most recent period, plus 2 percentage points.
To use a simple hypothetical example, imagine the UKLW was £10 in a given year. The new figure produced by the calculation for the subsequent year is £11, a 10 per cent increase. However, if average earnings had only risen by 3 per cent in that year, this would mean the increase in the year was restricted to this 3 per cent, plus 2 percentage points, leading to a 5 per cent increase in the rate (to £10.50).
In the terminology used by the UKLW calculation papers, this £10.50 figure was known as the ‘applied rate’ while the figure produced by the calculation, £11, was the ‘reference rate’. In following years, the UKLW would then aim to narrow the gap between the applied and reference rates by increasing at the maximum rate allowed by the cap. This cap was in use in most of the years of the UKLW’s existence because of a significant change to working-age benefit entitlement in 2011 which was implemented shortly after the UKLW was first calculated and wage growth over the period was weak relative to inflation.
The review of the Living Wage
The Living Wage Commission tasked the Resolution Foundation with assessing these two existing methods and designing a new, aligned method. As noted above, there is no such thing as a ‘perfect’ or ‘correct’ method. Trade-offs will inevitably have to be faced, with an underlying tension across many elements between practicality and representativeness. That does not mean, however, that all approaches or methodological choices are equally valid. To this end, it was agreed that the review would have a number of priorities when evaluating the existing methods and designing an aligned approach. A new method should be driven by changes in living costs, be simple, transparent, with a widely supported methodology and be adoptable by employers.
In what follows, we discuss some of the key components the review considered. We focus on those where the decisions made were more fundamental to the conception of what a living wage should be. Though this means we do not dwell on questions regarding, for example, which data sources are used, these can be of huge consequence to the level of the living wage. The conclusions reached were not solely formed by the desk research of the authors or discussion with the Living Wage Commission.
Stakeholders were consulted in a number of roundtables held across the UK to discuss priorities for the calculation and to raise concerns about existing elements or potential changes. Given that these stakeholders were from diverse backgrounds – Living Wage employers, local and national governments, trade unions and academia – it was unsurprising that views varied on what should be maintained and what should be changed. Overall, however, the priorities outlined above were broadly shared.
Trade-offs, tensions and the aligned method
Establishing a standard of living
The first question the review addressed was what the standard of living the wage sought to provide should be based on. Different approaches are possible and have been used at different times in a number of countries (see, for example, Anker, 2011). As discussed in Section 2, the two original methods were similar in some respects though differed on others. Fundamentally, the biggest divide was the UK method’s sole reliance on a basket of goods and services while the London method featured a link to the poverty line (the ‘income’ component).
Given one of the review’s stated priorities was for the rate and its changes to be driven directly by changes in living costs, defending the inclusion of a poverty line element was difficult. Although it provides a link to broader debates about the sufficiency of contemporary income, it nonetheless appears a far more arbitrary standard than the ‘basic living costs’ approach.
A next question was what standard of living should be sought. The research done by the FBU and the CRSP have used different definitions in their research into budget standards, while poverty has also been defined in numerous ways in different countries. It is clear from the stakeholder view outlined above that only delivering ‘poverty plus £X’ to families would be unsatisfactory. The original FBU research discussed ‘moderate’ living standards as well as ‘low cost but acceptable’ – the former being slightly more generous in terms of the goods and services included – with the latter becoming the definition which underpinned the LLW and was seen to fit more closely to the concept of a ‘poverty threshold wage’. The CRSP MIS work uses a different description: A minimum standard of living in the UK today includes, but is more than just, food, clothes and shelter. It is about having what you need in order to have the opportunities and choices necessary to participate in society. (Davis et al., 2018)
Once this had been accepted as a useful target, the next question was how exactly this definition should be operationalised into a basket of goods and services. One approach, based on what households actually spend their money on, is to use survey data on expenditure. In the UK, the Living Costs and Food Survey provides average household spend on a wide variety of items and, helpfully, includes a question on income allowing lower-income families to be identified.
However, while a helpful reference point, this ‘data’ approach quickly runs into the issue of either drawing an arbitrary line at, say, 75 per cent of average expenditure, or assumes that what lower-income households spend is enough to provide them with the above description, rather than acknowledging they may be in poverty. (Of course, how ‘lower-income’ is defined would also be arbitrary.) Therefore, while data could act as a helpful reference point, the idea that they could provide the entirety of the basket seems to fall short.
Another option is the ‘expert’ approach. In this model, researchers, practitioners or other individuals with specialised knowledge list the goods and services that would be needed. To take one example, this might entail consulting a nutritionist about a healthy diet, as well as time-use or expenditure data on how often families eat out at restaurants. Together, this might provide a list of foods and restaurant prices that would cover both the practicalities of how much food is needed and how much it costs, but also recognises the social value of eating out.
While more practical than the ‘data’ approach, the ‘expert’ model was objected to by many of the stakeholders, particularly employers. While in theory this could reflect a fear that an expert-based approach would result in a higher rate, the sense that it would be ‘out of touch’ was not exclusive to the employers consulted. The social participation element would, in any case, remain difficult to pin down. For instance, though child development experts could be asked about the kinds of activities children of different ages engage in, determining how frequently these should be engaged in, how much they cost and how they might vary from place to place is a much wider challenge.
Another option, and the one used in the MIS research, is a ‘consensus’ approach. In this model, research is conducted with members of the public. Detailed lists of food, clothing and household goods, among other items and services, are agreed, with the groups differentiating between those that are needed to meet the standard and those which are simply ‘nice to have’.
This approach is not without its shortcomings. In practice, much depends on the role of the facilitator of the discussion, with the composition of the groups and the guidance provided potentially shaping the conclusions reached. Similarly, while the groups discuss in depth what is needed – how big, for instance, does a television need to be? – the team conducting the research are still required to identify the exact goods and services in stores in order to price them. Without a very different approach, it is hard to imagine these concerns being completely surmounted.
But while these points were acknowledged, stakeholders were particularly positive about this approach. Employers, union representatives and academics alike were advocates of the method, with emphasis placed on the use of the opinions of ‘ordinary people’ boosting the credibility of the calculation.
Changes in living standards
Another point of difference between the original methods is how often the underlying basket is updated. In London, this was not frequently done, and indeed the FBU research was never updated for London after 1998. In the short term such an approach can make sense given minimally acceptable living standards are unlikely to alter drastically from year to year. While certain pieces of technology may become obsolete, it is likely that other similar items will replace them at a similar price.
Though this substitution point is sensible, it does overlook the extent to which living standards do change especially over a longer period of time. For instance, when the initial FBU baskets were being put together in the late 1990s, spending was set aside in the basket to buy VHS cassettes. While it is possible that spending on DVDs exactly matched spending on VHS, it would be much more dubious to assume that the same amount of money has seamlessly been transferred by families onto online streaming sites. And while prospective Living Wage employers are perhaps unlikely to interrogate every single item in the basket, never updating it increases the risk that it loses some of the credibility gained from public consultation.
A regularly shifting basket, however, does allow the possibility that what families require could change dramatically, and therefore affect the rate. One example of this was visible in the UKLW. While in the original MIS research, families with children had accepted public transport with occasional taxis was enough to meet their needs, after a number of years over which public transport’s reliability was deemed to have worsened, a second-hand car was added to the basket. While this did result in a saving on public transport, it nonetheless was a sizeable additional outgoing.
Given the emphasis placed on tracking the cost of living and what is needed to have an acceptable standard of living, the review argued updates should be included and such changes to the basket should affect the rate. But, taking advantage of the new governance structure the Living Wage Commission provided, it made the case that when changes in the basket were large and in response to gradual societal changes, like year-on-year worsening of public transport rather than an overnight cancellation of many services, it was reasonable to introduce the effect into the rate over time. While this has not yet occurred, it is envisaged that the Commission would set out a plan over two or more years to introduce the cost, ensuring the Living Wage kept pace with society but without adding an artificial single-year spike in living costs.
Geography
Though not a central element of the review, it did consider whether a single rate for the rest of the UK was sensible. Although the cost of living clearly varies from place to place, previous evidence had shown that in some major cities, there was little meaningful difference, and that the gap within cities was often as wide as that between cities. For instance, research conducted for Greater Manchester concluded that a living wage for the city region would be set at a very similar level to the UK figure (Holden and Raikes, 2012).
Moreover, because the MIS research assumes that the majority of shopping is done in national chain stores or online, where prices vary little if at all, this meant that a large element of the basket did not differ from place to place. From a campaign perspective, as had been evident with the National Minimum Wage, simplicity is valuable in helping to promote public recognition of the rate but also compliance. There is, of course, nothing preventing employers from paying their employees more than the UK rate should they deem the cost of living in their area to be well above the UK average.
Another geographical consideration was whether a different basket of goods was required for London. Though not as longstanding, the CRSP team have also conducted research into minimum acceptable living standards in London. This has primarily taken the form of ‘checkbacks’, where the basket assembled with groups in other parts of the UK is discussed with Londoners. In these sessions, the question asked to the groups is whether the reality of life is different enough in London to require a meaningful change from the basket for the rest of the UK.
This is presumed to be the case for housing (flats rather than houses) and travel (primarily public transport for families with children rather than a car). When it comes to more quotidian items – food or household goods – as would be expected, little differs. However, there have been instances in which the London MIS groups have made the case for additional money to be set aside for trips around the country or social activities. This is sometimes related back to the assumed accommodation in the capital being smaller necessitating that more time be spent outside of the home.
The review took the position that this research was certainly useful, particularly with regard to housing, travel and child care. But while arguments could be made that what constitutes social participation is different in London, the need for additional spending on social activities was not deemed meaningful enough to opt for a separate London basket. Using a single basket of goods, with differences only on the three categories noted above, would also help with creating an aligned basket, with similar cost pressures affecting it. Housing, transport and child-care costs are calculated separately for London and the rest of the UK given they vary the most significantly. However, the review did not rule out revisiting this issue should trends show greater divergence between London and the rest of the UK.
Family types
The review considered two questions on family types. First, what kind of families should be included in the calculation, and should the Living Wage seek to provide a minimum acceptable standard of living to all of them? Second, how representative should those families be of the broader population?
As noted, the two original methods differed on specific family types, but shared the principle that a mix of singles and couples with and without children should be taken into account. A number of arguments can be made for basing a Living Wage on one family type. In Ireland, for instance, the Living Wage is intended to provide a minimum standard of living to a single person without children (Living Wage Technical Group, 2018). This also has consequences for the assumed role of the state in supporting living standards, discussed in more detail in what follows.
Perhaps the fundamental strength of such an approach is that it, in theory, actually delivers the promised standard of living to the recipient, assuming they are of the specified family type. 5 This quickly runs into the difficulty of the Living Wage being more than an academic calculation. Those using it to advocate for generally higher wages are unlikely to dwell on the fact it may be insufficient for families with children. Those who believe it is too high may instead point to the fact that a couple without children would not need as much. Some of the difficulties it potentially avoids appear quickly to re-emerge.
The weighted average approach taken by both the original UK and London methods also suffers from some of this weakness. For a given wage, a couple without children is likely to find it much easier to achieve a decent standard of living than a single parent with three children. Taking a weighted average therefore means that the couple without children will receive a higher wage than is required to meet that standard while the single parent does not meet the standard.
An alternative approach would be to set the Living Wage at the highest level required by any family type. This would make the second question posed here – which specific family types should be considered – the most important issue for the rate. Deciding how large a family should be included would become much more material. And from a practical campaign point of view, convincing employers of the need to pay young single people a wage high enough to provide a large family with a decent standard of living may be difficult.
The review therefore concluded that the weighted average approach was the best compromise. But this does not resolve what those families should look like. The London method was simpler, with children aged four and 10 reflecting a range of costs that parents may face, e.g. pre-school child care for the younger child and after-school clubs for the older one.
But, of course, not all children are that age, and the child age can lead to significant variation in costs between families and be particularly sensitive to policies affecting specific age groups. For instance, the introduction of 15 hours of free child care for three- and four-year-old children of working parents would have drastically reduced the costs facing those families, but ignored the unchanged circumstances of those with two-year-olds. Similarly, it may miss the impact of cuts on families, for instance the recent reduction in benefits paid to families with three or more children. The review therefore recommended using a broader and more representative mix of family types, with more variation of the age of children but nonetheless limiting it to 17 different types (including singles and couples without children).
The role of the state vis-à-vis employers
The role of the state in the calculation is, after living costs, the other key determining factor of the Living Wage rates (Hirsch, 2017). Both the original methods opted to include income from government benefits. The review argued that this was pragmatic, once again reflecting that in-work benefits exist precisely to recognise that wages do not always guarantee an acceptable standard of living. But changes in policy raise an important question about the balance of responsibility between employers and social security and have played an important role in the path of both the UKLW and the LLW.
Take, for example, a year in which all the items in the basket rise by 2 per cent. All else being equal, this should mean the Living Wage rises by 2 per cent. However, if over that year the government decides to reduce the in-work benefit it pays to working parents, and this leaves families’ incomes below the Living Wage, this will mean a faster increase in the rate is required. In this instance, anything above a 2 per cent increase means employers are filling the gap vacated by the state. Alternatively a more generous benefit system could, in theory, imply that families with children require no more than the NMW to achieve an acceptable standard of living.
Such concerns are particularly pertinent in the UK since relatively large reductions in support to working-age families were announced in the 2015 Summer Budget that can be expected to put upward pressure on the Living Wage rates. These included a freeze in uprating of most benefits – which are normally increased in line with inflation – and limiting support paid for children to cover up to two children. On the other hand, some changes to support place downward pressure on the Living Wage rate, such as additional hours of free child care for three- and four-year-olds with working parents. (HM Treasury, 2015)
During the stakeholder consultations, opposing views were raised. For some, the inclusion of government benefits was a necessary evil with the ultimate aim being a world in which state support to working families would be unnecessary when both parents were in full-time work. For them, a reduction in state support should therefore clearly lead to employers paying more. But for others, the idea that government cuts should automatically and always lead to employers paying more to compensate workers for decisions entirely outside their control felt unfair.
Embodied in these discussions was often an acceptance of the status quo, in terms of the balance between employers and the state. In 2016–2017 the typical family with children saw around a quarter of their income come from the state (Department for Work and Pensions, 2018). As such, with most understanding that both had their role to play, the review did not include specific provisions for employers to be effectively protected from government policy changes. But it was clear that, should the scale of state provision alter drastically, with a much reduced or enhanced contribution to families’ living standards, then this balance should be re-evaluated by the Living Wage Commission.
Working patterns and child care
Underlying much of the above discussion is the number of hours the earners are presumed to work. As noted, in the original LLW calculation a spectrum of working practices were used, from one part-time worker up to two full-time (albeit with a floor preventing the required wage from falling below the minimum wage and a ceiling preventing it from going above the median wage). In the original UK calculation, all adults are assumed to work full-time.
The London approach appeals on two primary grounds. First, it more closely reflects the working patterns of actual families, with one in four workers in the UK being part-timers. Second, it has an important knock-on effect for child care. If parents are not working full-time this means they can provide more child care themselves rather requiring external child care, and thereby reduce how much they need to earn.
But the UK approach also has strengths. First, it brings simplicity to the calculation as well as to the conversation with employers considering paying the rate. Second, it further embeds the principle that a full-time working week should provide an acceptable standard of living and helps to underline the importance of reliable, full-time hours being offered to staff where desired. Making the case for why a couple with children in which only one person works part-time should be able to meet a minimum acceptable standard of living, primarily funded from employment (and taking into account the acknowledged caveats around disability and additional costs) is a challenge. On that basis, the review opted to adhere to the UK approach, in which every adult is assumed to work full-time (37.5 hours, the average for full-timers in the UK).
But returning to the question of child care, this does mean that all families are assumed to use full-time child care in order to allow them to work full-time. This, clearly, does not perfectly align with reality: children are frequently cared for by grandparents, other family members and neighbours. But the groups involved in the MIS research have consistently agreed that this could not be taken for granted, and setting a standard based on this assumption would undermine the claim to provide an acceptable standard of living. Therefore, the basket needs to enable such families who are unable to draw reliably upon informal child care to be able to afford it in order to work full-time.
Year to year stability
The final premise we consider here is perhaps the one in which the academic goal of creating a wage that allows a decent standard of living is most clearly in conflict with the practical side of the Living Wage as a campaign tool. As discussed, the pre-existing London method did not include a cap but did apply a ‘floor’ and ‘ceiling’ to the wages that different family types could require earlier on in the calculation. In the UK, a limit of average earnings plus 2 percentage points was applied.
The UK rate was somewhat unlucky in that, in the first year after its inception, a unique cocktail of price pressures and benefit entitlement changes meant the calculated rate was significantly higher than the previous year’s figure. This included standard consumer price inflation, a change in the composition of the basket (the aforementioned inclusion of a car for families with children in the rest of the UK) and cuts to benefits that directly affected the family types included in the calculation.
The cap had an immediate impact in limiting the increase. From the point of view of employers, this meant smoother increases rather than one large increase followed by a number of slower rises. But in this case the longest legacy was the action to close the gap between the ‘reference rate’ produced by the calculation and the ‘applied rate’ that Living Wage employers paid. The cap specified that the rate would rise by the per cent figure produced by the formula – average earnings growth plus 2 percentage points – until the gap had fully closed. This meant in practice that employers faced increases that were sometimes well above the change in the cost of living as measured by consumer price inflation. At the time the review began, it did not appear as if the gap was set to close in the near future.
Seeing evidence of how a cap can have long-lasting consequences was taken into serious consideration by the review. But the potential for very large changes in the rate in a single year – either upwards or downwards – appeared to present a more serious risk to the credibility of the rate and its uptake by employers. As such, the review recommended that a limit be placed on the increase in any one year. Importantly, the reference increase was switched from average earnings to inflation, with an additional 3 percentage points. This would ensure that the Living Wage is primarily driven by living costs, and recognises that the costs facing lower-income households can rise more quickly than the much more diverse basket that underpins consumer price inflation. The same catch-up idea is applied. Another way in which this situation can be avoided is the aforementioned judgement of the Living Wage Commission on how to deal with large changes to the basket that reflect gradual rather than immediate changes in living standards.
Reflections and future outlook
The success of the living wage movement in the UK can be attributed to a number of factors. Its emergence out of a passionate grass-roots campaign, driven by people for whom higher wages could make a meaningful impact on their lives, has been first among these. Without this, and the subsequent structure of the Living Wage Foundation as an accrediting body and a promoter of the rate, interest in the living wage would most likely have been minimal.
Timing has arguably helped. The unusual economic conditions of recent years are also likely to have played a major role. Historically dreadful real-terms wage growth meant that arguments for swifter pay rises took on an importance beyond those that may have been felt when earnings were growing more strongly. The relative weakness of unions, and their limited role in collective bargaining, in the UK is also likely to have meant the need for a campaign to fill that gap was more acute.
Although it should not be overstated, the independence and robustness of the calculation has also helped. Employers that signed up reported feeling reassured by the work that went into the calculation and the transparency around it, rather than a completely arbitrary number being chosen. As this article has discussed, though no calculation of a living wage can be perfect, using quality research and data, with defensible decisions and a governance structure in place to deal with inevitable change all help bolster the living wage’s existence as more than simply a campaign tool.
Looking to the future and as noted in Section 3, there remain a number of tensions and trade-offs that could present difficulties in the years to come. Assuming that the calculation is final and will never need to be adjusted to adapt to new economic or policy realities would therefore be hubristic. The governance structure and the review’s call for a regular re-evaluation of the method to ensure it remains fit for purpose and utilises the most appropriate data should help to safeguard the Living Wage’s future. Importantly, this structure recognises and allows for the gradual inclusion of what may otherwise appear to be large, one-off, and unstable, changes to the rate.
The approach taken in the UK may not transfer perfectly to other countries. In places with much more geographical variation in the cost of living, a different, more fractured approach – to the calculation at least – may be required. However, this would need to be considered against the cohesiveness of the campaign and the difficulty of collecting relevant data to perform the Living Wage calculation. A larger number of differing wage rates may reduce the effectiveness of the campaign and be harder to implement by employers.
An advantage to the method is that it can be easily adapted to fit a particular country’s circumstances. The family types used could be changed to better represent a different demographic, for instance taking a single adult without children as the basis of the calculation. Locally conducted focus groups would allow for a unique basket of goods and services to represent the minimum adequate standard of living in those countries, although taking a more data or expert opinion driven approach could also be possible if a public consensus approach is not viable.
In countries with a larger union presence, considering how a living wage calculation fits into collective bargaining and other campaigns would be an important factor. It may be that in a country with collective wage bargaining structures a calculation similar to that used for the Living Wage in the UK becomes more a check of the adequacy of proposed wage rates as part of a more complex negotiation process.
In places with greater or less state support to working families, for instance, the balance of responsibility between the state and employers would have to be explored. The Living Wage calculation sheds light on both the contribution of employers to minimum living standards and also the contribution of the state. The mechanism can equally place pressure on the state, rather than employers, to boost incomes of working families. Key to gauging this is the consensus-based approach to estimate the minimum required standard of living with members of the public, allowing them to decide whether prevailing wage rates and state support provide the necessary resources.
Questions on the calculation become all the more pressing and important if the living wage approach becomes part of a compulsory minimum wage framework. One luxury of the Living Wage review in the UK and London was that it did not have to concern itself explicitly with the potential effect on employment (although its feasibility as a campaign tool was a repeated point of discussion). But if it were to become the basis for a legal minimum wage, the trade-off between achieving that description of a minimum acceptable standard of living would have to be weighed against the potential impact on the number of people in work and the hours they work.
Though much recent evidence, including in the UK and the US, has suggested that minimum wages up to a reasonable level do not result in lower employment or higher unemployment 6 , heavily affected firms are likely to use some adaptation methods if a large increase in the minimum wage is mandated. This could result in higher prices or reduced profits (and potentially higher rates of business failure). This remains hugely uncertain and again is likely to be highly context-dependent, with the nature of taxes and regulation on employees and employers, as well as the strength of enforcement, all likely to contribute. The UK’s experience can therefore offer some helpful signposts to those in other countries considering a similar approach. But it is clear that adaptations will need to be made to fit local contexts, particularly if it is to become legally enforced.
Footnotes
Funding
The Resolution Foundation received funding from the Living Wage Foundation to conduct the 2016 review on which this article is based.