



Abstract
This article reveals the processes of financialization in the South African economy by tracing the sources and destinations of non-financial corporations’ liquidity. The paper argues that rather than the volume of non-financial corporations’ financial investment, the composition of financial assets is crucial to assess corporate financialization in the country. Non-financial businesses in South Africa fundamentally transformed their investment behaviour during the 1990s, shifting from more productive uses such as trade credit towards highly liquid and potentially innovative (and therefore risky) financial investment. Following the direction of financial flows the article shows that companies’ financial operations – fuelled by foreign capital inflows – are linked to the price inflation in South African property markets.
Introduction
Financialization reflected by the increasing influence of finance (Epstein, 2005), has been identified as problematic in rich countries and increasingly so in emerging economies (Becker et al., 2010; Demir, 2007, 2009; Karwowski and Stockhammer, 2017; Powell, 2013). The phenomenon has been linked to subdued investment rates, speculation and heightened financial instability, as well as rising inequality. However, the processes by which financialization brings about these socio-economic malaises often remain in the dark. When the concept is used as a catch-all for the failings of contemporary capitalism it becomes analytically vacuous (Christophers, 2015). Therefore, it is vital to reveal the processes behind financialization phenomena. Accordingly, this article identifies the link between financialization of non-financial companies (NFCs) and residential house price inflation in South Africa. It argues that the heightened liquidity preference of South African NFCs has contributed to the rapid growth of house prices in the country by facilitating commercial banks’ credit extension. The present analysis is able to reveal, for the first time, the link between corporate financialization and house price inflation, and by extension the dynamics that increase financial fragility in the country more broadly. Addressing a certain complacency amongst mainstream economists and policymakers in South Africa, the paper argues that it is not the size of NFCs’ financial investment that accounts for corporate financialization in the country. The volume of financial investment has always been high among South African NFCs. Rather financialized South African corporations have altered the way they invest into financial assets as well as the composition of their asset portfolios since the 1990s.
The article uses flow of funds analysis, which is particularly useful for financialization studies because it demonstrates the inherent interconnectedness between real and financial transactions. Tracing flow of funds data back to 1970 reveals that South African NFCs have significantly modified their financial operations since the 1980s. 1 Historically, NFCs have financed almost the entirety of their capital investment internally. This changed somewhat during the boom of the early 2000s. More importantly, since the 1990s NFCs have shifted away from providing large volumes of trade credit to holding liquid assets, such as cash and cash equivalents and short-term deposits, on their balance sheets. This is a sign of financialization since NFCs shy away from providing trade credit to support productive operations and instead engage in investment in financial instruments.
The majority of NFCs’ growing liquid assets is held with commercial banks in South Africa. In consequence, deposits of NFCs have become by far the largest liability on banks’ balance sheets, while loans remain the largest asset. Thus, South African banks still hold on to a more traditional banking model, not following their rich-country counterparts where actual loans account for a declining share of banks’ income while fees from innovative financial services are on the rise (dos Santos, 2009). Given the country’s status as emerging economy, policymakers perceive tight monetary policy as necessary and prudent. In fact, comparatively high interest rates are typical in the global South (McKinley and Karwowski, 2015). Tight monetary policy can fuel financialization in emerging countries (see, e.g. Gabor, 2010a, 2010b, 2012). This paper argues that NFCs’ liquidity plays an important role in this process. Commercial banks offer relatively high interest rates, attracting NFCs’ deposits, which abstain from investment. While these balances do not remain ‘idle’ but circulate through the economy (Keeton, 2018), they in fact might encourage credit that supports further financialization.
The remainder of the article is structured as follows. The next section sketches the scope of the financialization debate in South Africa. Two aspects of the phenomenon are particularly highlighted: the large and politically increasingly contentious cash holdings of NFCs, and the inflation of house prices. To illustrate the close link between these two socio-economic problems the paper proceeds to introduce a detailed flow of funds analysis, followed by an analysis of the loan books held by the big four South African banks. The final section concludes by discussing the distinct nature of financialization in emerging economies.
Financialization in South Africa
Financialization research developed in the context of the US (Krippner, 2005; Lazonick and O’Sullivan, 2000) and until today mainly focuses on rich countries (Brown et al., 2015; Karwowski et al., 2016; Lapavitsas and Powell, 2013). There are various literature reviews of the phenomenon in the context of the global North (Aalbers, 2017; Van Der Zwan, 2014; Van Treeck, 2009). However, a body of literature on financialization in the global South is only emerging (Becker et al., 2010; see Bonizzi, 2013, for a survey) and there are few empirical accounts, shedding light onto the processes behind financialization in developing regions. As detrimental financialization dynamics are likely to harm poorer societies more than rich ones, this dearth of in-depth empirical analysis (Pike and Pollard, 2010) constitutes an important gap in the literature.
South Africa is an ideal case study to address this analytical gap since the country appears to ‘exemplify’ the financialized emerging economy in many respects. This section summarizes South Africa’s financialization experience, using a sectoral account. Since financialization is a broad concept, stretching across a multitude of disciplines, adopting a sectoral account – which focuses on the five main macroeconomic aggregates, i.e. NFCs, the financial sector, households, government and the foreign sector – systematizes the concept from an economic perspective.
It has been argued that financialized NFCs increasingly shift their productive operations and investment, which is long term by nature, to short-term financial activity (Crotty, 2005; Krippner, 2005; Orhangazi, 2008). At the same time, they are also ever more affected by financial markets which limit their ability to reinvest profits (Stockhammer, 2004) and expose NFCs to rising financial volatility (Toporowski, 2000). In South Africa, the activity of large company groups – the so-called mining-finance houses that historically focused on resource extraction and banking – has been seen as major driver of financialization. During the international shunning of the apartheid regime, especially since the late 1970s, these mining-finance houses gained an ever-growing dominance over the South African economy as the country fell deeper into isolation (Chabane et al., 2006; Rossouw et al., 2002). With the reintegration of the country’s economy into the global financial system since 1994, these company groups, and South African corporations in general, have increasingly become involved in financial investment at the expense of production (Ashman et al., 2011a).
Since corporate investment spending has slowed down, financial investment accounts for a rising share of capital stock (Ashman et al., 2013). There is evidence that the composition of NFCs’ financial assets has been transformed towards more short-term instruments (Newman, 2015). The suspicion is that much of this financial investment has been speculative. Thus, according to Ashman and Fine (2013: 156) financialization is characterized by the expansion of financial assets relative to real activity, crucially, ‘the absolute and relative expansion of speculative as opposed to or at the expense of real investment’. But few contributions have discussed corporate cash holdings in the light of financialization (see Karwowski, 2015). In fact, mainstream economists appear to be determined to prove that corporate cash holdings in South Africa are not a problem (Keeton, 2018; Nyamgero, 2015) or merely the outcome of recent political uncertainty (Donnelley, 2017). Thus, this contribution tackles the misconception that large volumes of corporate liquidity are a very recent phenomenon while showing what role cash holdings play in corporate financialization and the financial fragility of the South African economy more broadly.
In rich countries the rapid growth of the financial sector (Philippon, 2007) and aggressive financial innovation have been identified as elements of financialization (Lagna, 2015; Lapavitsas, 2013). These developments result in short-term growth at the cost of heightened levels of financial fragility (Boyer, 2000) or dampened investment and consequently subdued growth (Stockhammer, 2004). Some authors (Aglietta and Breton, 2001; Lapavitsas, 2009, 2013) also argue that financialization is accompanied by a shift from bank- to market-based financial structures. Banks lose importance as credit providers for NFCs, which increasingly turn towards capital markets as source of external finance. In South Africa the financial sector is perceived to be at the core of the country’s ailing economy. Since the end of apartheid the sector’s share in South African gross domestic product (GDP) has grown rapidly, trebling between 1994 and the 2007–8 financial crisis (Marais, 2011). Today finance generates more than one-fifth of South African output (SARB, 2017), which makes it the single largest contributor to GDP. 2 However, there seems to be little evidence for a significant shift towards a more market-based system in South Africa (Karwowski and Stockhammer, 2017; Teles, 2012).
Since the financial crisis household financialization has attracted more attention from academic researchers (Langley, 2008). 3 Rising household debt burdens are a symptom of financialization if growth becomes credit driven in the face of stagnant wage growth and a shrinking total wage bill. The volume of household debt in South Africa is nowhere near US and UK levels, but nevertheless high in comparison to other emerging economies (Karwowski and Stockhammer, 2017). Households’ saving and borrowing behaviour seems to have changed very much in line with Anglo-Saxon patterns since the 1970s. The share of saving to disposal income has gradually declined. By 2005, households in aggregate became net lenders rather than savers, running down their stocks of savings (Ashman et al., 2013). Most of the loans taken out by South African households are mortgages, ballooning since the mid-1990s in line with the enormous price inflation in residential housing (Griffith-Jones and Karwowski, 2015). Unsecured consumer loans have also been strongly on the rise, raising questions about their sustainability (Bond, 2013).
The socio-economic impact of financialization of state institutions and policies is a nascent research area, which needs more attention (Aalbers, 2017; Karwowski and Centurion-Vicencio, 2018). The experience of countries in the global South is distinct since monetary and fiscal policies are constrained by those countries’ (subordinate) position in global financial structures (Becker et al., 2010; Kaltenbrunner and Painceira, 2017). Moreover, there is some evidence showing that financialization dynamics are introduced (or at least exaggerated) by public policies in emerging countries, for instance through central banks’ sterilization operations (Gabor, 2010a, 2010b, 2012). In the context of South Africa, Isaacs (2014) argues that domestic macroeconomic policies have been shaped by and have importantly contributed to financialization in the country. Particularly problematic are inflation targeting and fiscal restraint. Their combined effect is subdued domestic investment because public sector capital expenditure is cut while private sector companies willing to invest face prohibitively high interest rates. But high interest rates are necessary to attract short-term foreign capital to balance the country’s persistent trade deficit (Isaacs, 2014). South Africa shares this plight with other emerging economies that shy away from introducing capital account controls for short-term foreign inflows (McKenzie and Pons-Vignon, 2012). Illegal capital flight, arising from transfer pricing and other illicit practices among transnational NFCs, exacerbates the trade deficit, increasing the country’s dependence on foreign capital (Ashman et al., 2011b).
There is a strong international dimension to financialization, most visible in cross-border capital flows (Stockhammer, 2013). In the course of the 1980s and 1990s, poor countries became increasingly integrated into global financial structures, opening up their capital accounts to foreign financial inflows (Abiad et al., 2008). Efforts by the World Bank and International Monetary Fund (IMF) to promote the Washington Consensus, a policy mix of fiscal restraint, deregulation, privatization and liberalization of trade and finance (Williamson, 1990), were instrumental in this development. Therefore, some argue that financialization in developing and emerging regions is mainly driven externally through financial liberalization (Lapavitsas, 2009). Financial flows from rich to poor countries increased markedly during the 1990s, surging in the 2000s (Aizenman et al., 2011; Nier et al., 2014; Schmuckler, 2004). It has been argued that intensifying financialization dynamics in rich countries drove the financial flows into poor countries during the boom years of the early 2000s (Tyson and McKinley, 2014). Loose monetary policy introduced in response to the global financial crisis of 2007–8 in rich economies has pushed financial investment flows towards emerging markets as interest rate differentials between poor and rich countries have further increased (Akyüz, 2014).
As South Africa reintegrated into the global economy the country went from being a net lender to becoming a net borrower from the rest of the world (Newman, 2015). Thus, capital inflows into South Africa increased in line with the general trend observed for emerging economies. These inflows were largely short term and therefore volatile. Thus, they arguably drove financialization in South Africa (Newman, 2015). 4 However, external pressures (e.g. financial inflows or suggested macroeconomic reforms) are mediated by domestic dynamics, resulting in country-specific permutations of financialization (Becker et al., 2010; see Rethel, 2010 for Malaysia’s example). Thus, the South African experience does not exemplify a ‘standard’ financialization story in the global South since in fact that standard story does not exist. However, in comparison to other emerging economies South Africa has been affected relatively strongly by financialization across the different macroeconomic sectors (Karwowski and Stockhammer, 2017). More importantly maybe, like many countries in the global South the economy is strongly dependent on resource extraction while running a persistent trade deficit, financed through financial inflows. Hence, the South African case provides important policy lessons for other emerging economies.
To shed light onto these lessons the article traces the way in which financialization dynamics introduced through capital inflows play out domestically. It links NFCs’ cash and liquidity holdings, i.e. the current investment strike controversy, to the build-up of financial fragility through asset price inflation in the housing market. Housing bubbles and the realization that homes and homeowners are financially exploitable are a major aspect of financialization (Aalbers, 2008). Between the mid-1990s and the mid-2000s, South Africa experienced some of the strongest inflationary pressures in global housing markets. The country’s house price inflation was comparable to that seen in Ireland, where real prices for residential property almost tripled in that period (André, 2010). During South Africa’s strong growth period (2003–2007), real price gains were well above price increases in the UK and the US – two economies known for their buoyant housing markets (see Figure 1).
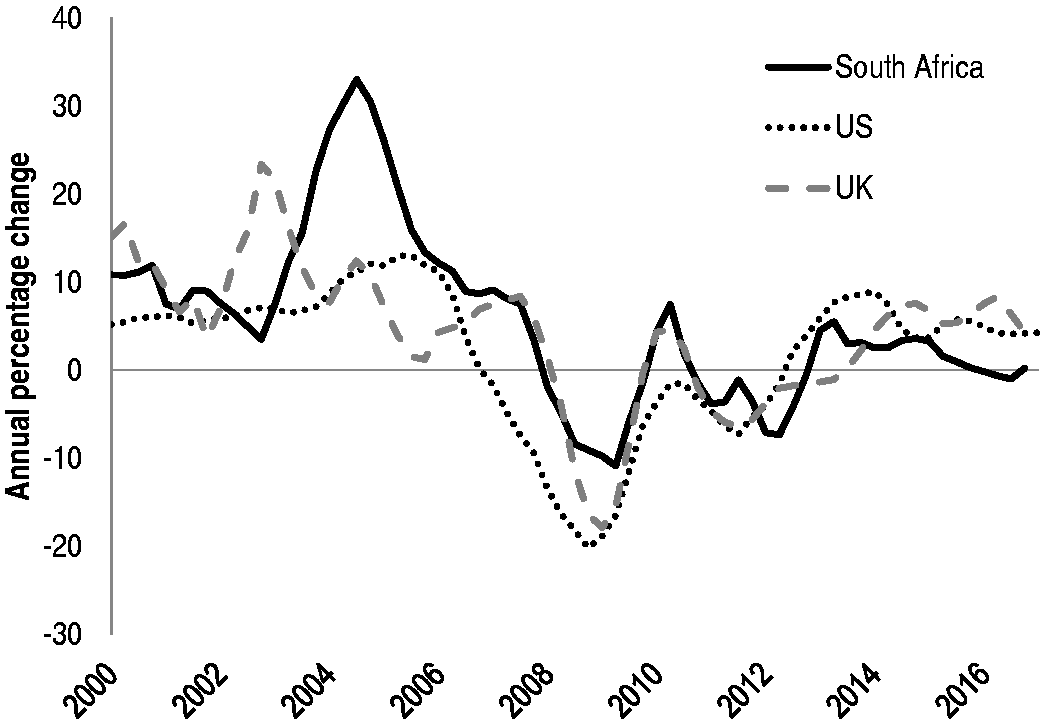
Real house price inflation in US, UK and South Africa, 2000–2017. Source: Absa House Price Index, Halifax Standardised Average House Price, S&P/Case-Schiller 20 City Index, data sourced from BIS (2017).
At its peak, in September 2004, annual house price growth in South Africa was 33% in real terms. This housing bubble collapsed with the spread of the US subprime mortgage crisis to the rest of the world in 2008. Price deflation intensified during the ensuing economic recession of 2009, only stabilizing in 2010. Real house prices have since been volatile. This is a serious socio-economic problem since the high and rising cost of residential real estate contributes to rising household indebtedness, while exacerbating wealth inequality.
Financialization is also at the root of another major socio-economic ill, currently stirring up anger in South Africa: the investment strike. With the end of apartheid a restructuring of domestic conglomerates began. Together with financial deregulation and liberalization this was promised to deliver growth and employment. But private sector investment rates hardly moved, only just reaching 1970s levels during the fast growth years of 2004–2008, while the unemployment rate remained stubbornly above 20% (World Bank, 2017). 5 Instead, many South African companies have held increasingly large sums of cash and liquid assets (Karwowski, 2015; Mbindwane, 2015), choosing not to invest. Consequently, domestic NFCs have been accused of ‘non-patriotic behaviour’ and of taking part in an investment strike (COSATU, 2017). To be clear the term does not refer to a slump in investment. It captures the frustration of the South African population who observe low levels of corporate investment activity not because NFCs are squeezed for funds but out of choice. The analysis presented here neither aims at explaining why businesses in South Africa hold on to liquid assets (for a firm-level analysis of this phenomenon see Karwowski and Mendes Loureiro, 2016) nor at exploring why private sector investment has been low and growth subdued (Eyraud, 2009). Instead, the article is interested in the macroeconomic impact of large cash deposits.
As of February 2017, South African NFCs were accused of holding cash deposits worth R719 billion (Donnelley, 2017). This amounts to almost a fifth (17%) of the country’s GDP. Crucially, this figure only accounts for the short-term cash deposits of NFCs. The true extent of the investment strike is larger still since corporations do not merely hold on to short-term deposits if they want to remain liquid. For one, they can also entrust domestics banks with time deposits, i.e. receiving higher interest rates while pledging to keep the funds with the bank for a specified and longer time period. The total amount of corporate deposits has been therefore far larger (R1.8 trillion in 2016, see Figure 2). However, corporations have many more options for liquidity management beyond bank deposits. It is more lucrative to invest into financial assets such as safe but low-yielding government bonds or more innovative – that is more risky – and high-yielding instruments such as foreign exchange derivatives, for example. These instruments can be a source of income beyond (and instead of) those companies’ productive operations and in a highly inflationary environment like the South African one a way to avoid losses when holding on to liquid assets.
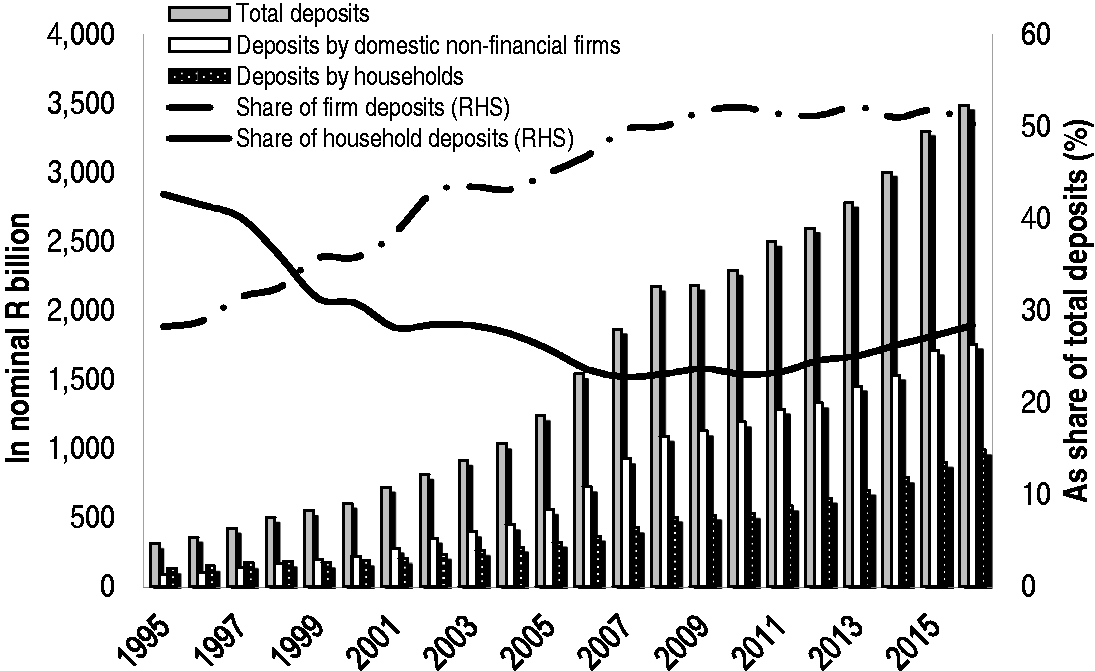
Deposits held with South African banks, 1995–2016. Source: SARB (1996a–2017a, 1996b–2017b). RHS: right-hand scale.
It has been argued that the volume of NFCs’ cash holdings is not excessive in historical perspective (Nyamgero, 2015); and that NFCs’ liquidity is not ‘idle’ cash since banks lend them out to other market participants (Keeton, 2018). However, it is not only the size of cash holdings that is relevant – abstracting from the fact that NFCs’ liquidity exceeds cash deposits with banks – but also how they circulate through the South African economy. The following analysis shows that corporate deposits might encourage mortgage extension and credit to real estate companies, further fuelling the housing bubble. Thus, this paper reveals the link between the financialization of NFCs’ operations and house price inflation. In fact, the investment strike is a result of NFCs’ changing, i.e. increasingly financialized, behaviour. It is destabilizing in two ways: First, it leads to subdued corporate investment, exacerbating domestic unemployment. Second, it contributes towards the build-up of financial fragility in the economy more broadly because it fuels house price inflation.
Flow of funds analysis for South African NFCs
To understand how money flows circulate in an economy the flow of funds are the best starting point. In fact, they are more suitable when assessing the effect of financialization on the economy than GDP or value-added measures that are typically used, for instance, to show the size and growth of the financial sector (see Philippon, 2007). The flow of funds data can provide insights into the interaction between real and financial transactions in an economy. Therefore, flow of funds analysis is increasingly used to study the extent and impact of financialization (for South Africa, see Ashman et al., 2013; Newman, 2015). The ties between real and financial transactions are exposed through the treatment of macroeconomic aggregates as balance sheets that consist of interlinked assets and liabilities. This link becomes visible because individual sectors, NFCs in aggregate for example, are hardly ever able to balance their saving and investment activity for a given period. According to conventional economics assumptions, NFCs run deficits on their financial balances, investing more than they collectively save. This means that they run up liabilities by borrowing, for instance, from banks. NFCs’ liabilities, i.e. loans, are then banks’ assets. 6
Overall, gross sources and uses of funds for each macroeconomic aggregate, say NFCs, have to match up. If internal funds are insufficient to back companies’ planned new capital formation and desired liquidity levels (held in cash, equities, bonds, etc.), NFCs will have to take up bank loans, issue bonds and equity or obtain trade credit from another sector to satisfy their funding needs (see Figure 3). If they are unable to meet these needs through sources other than retained earnings companies will be forced to reduce their physical and/or financial investments. Once these transactions are considered in historical time, flows (e.g. NFC borrowing) turn into stocks (e.g. NFC debt). Selling off stocks of financial investment amassed in the past can boost internal funds while large debt burdens can drain these funds, requiring interest payments and ultimately principle repayment.
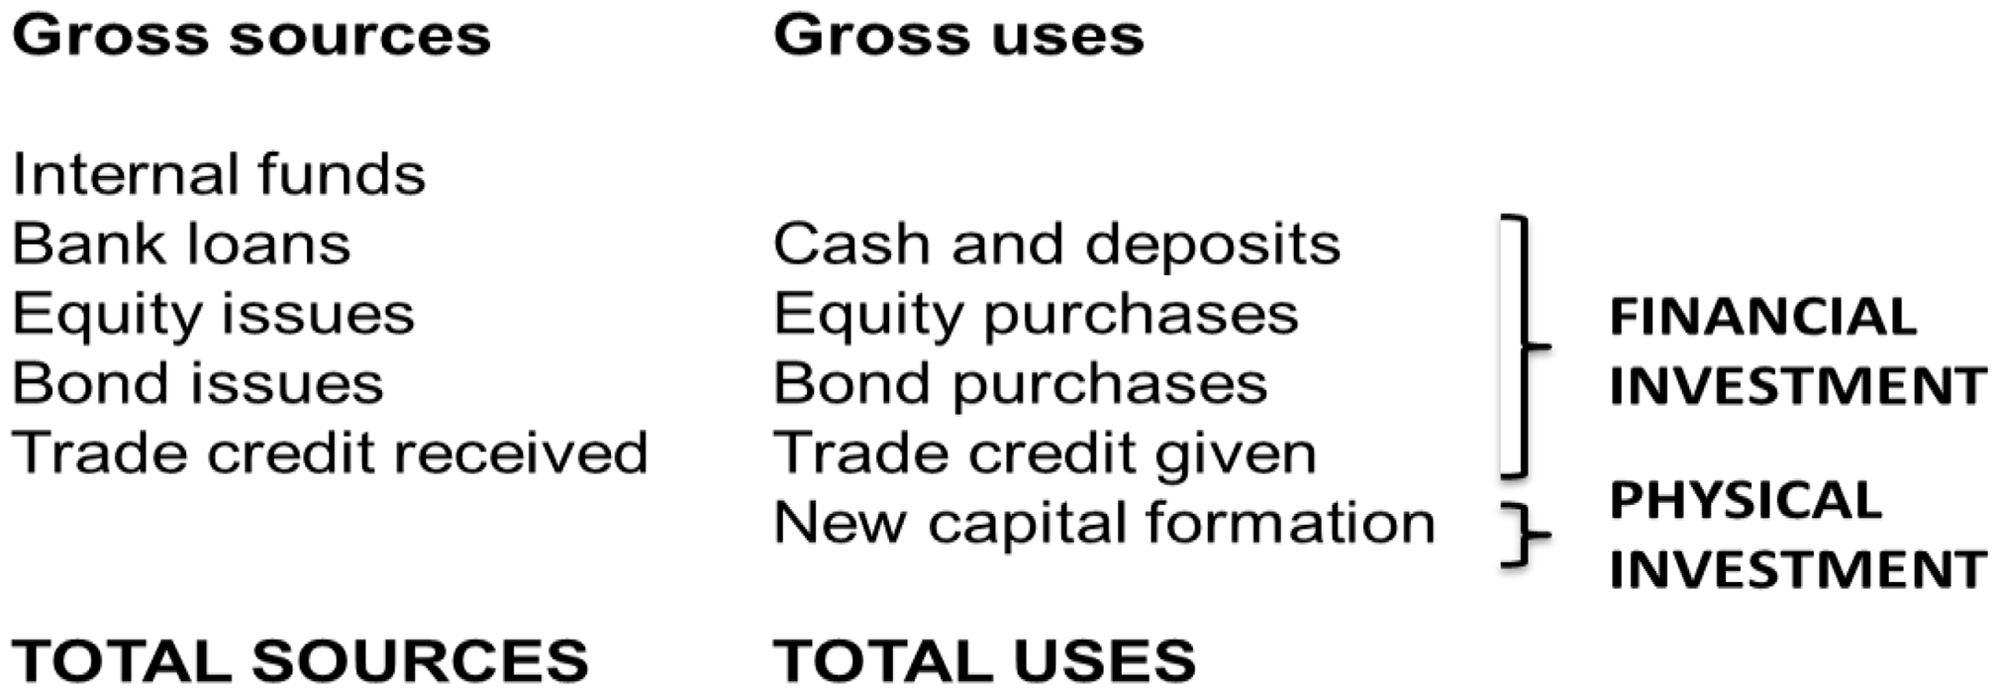
Relationship between gross sources and gross uses of NFC funds.
Economic arguments about firms’ sources of funds traditionally focused on net positions (Corbett and Jenkinson, 1996, 1997). However, when sources and uses are netted out important information is lost. For instance, if NFCs acquired bank loans approximately equal to their cash and bank deposits their net position with banks would be close to zero. Whether both cash and bank deposits, on the one hand, and bank borrowing, on the other hand, were large or small would remain concealed from this analysis. Hence, this article analyses gross flows of funds between NFCs and the other four macroeconomic aggregates in the South African economy, i.e. general government, households and others, financial intermediaries and the foreign sector (SARB, 2011). 7
Two definitional details should be noted. First, ‘households and others’ refer to households in aggregate, but also picks up all remaining unclassified entities such as non-incorporated businesses or not-for-profit organizations (SARB, 2011). Second, NFCs refer to private sector non-financial companies. Flow of funds data also provide figures for state-owned enterprises. However, talking about an investment strike only makes sense with reference to private sector corporations whose investment decisions are not under public control.
South African enterprises have historically had a global orientation, rather than a primarily domestic one (see, for instance Innes, 1984). This is reflected in the sectoral balances of private enterprises and the foreign sector (see Figure 4). Whenever South African NFCs recorded a net financial deficit, i.e. their investment exceeded internal funds forcing them to borrow; the rest of the world was in surplus, becoming a lender to the South African economy as a whole. Between 1970 and the mid-1990s these two sectors moved reliably in tandem, with foreign inflows increasing when NFC balances deteriorated, and vice versa. Towards the end of the 1990s this close link appeared to be lost. But it re-emerged with greater strength around 2003. Thus, it seems that foreign inflows into the South African economy chiefly end up with private NFCs.
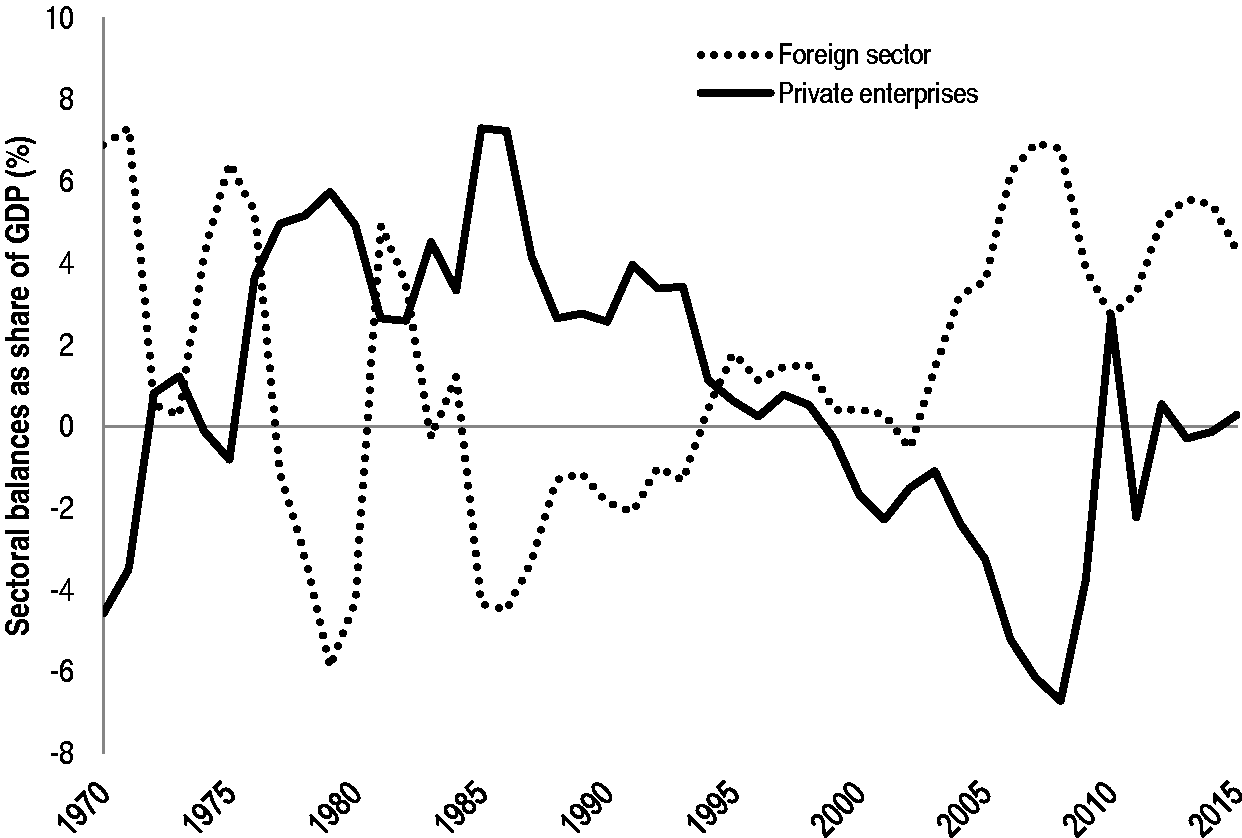
Financial balances of NFCs and the foreign sector, 1970–2015. Source: SARB (1994, 1995a–2016a). GDP: gross domestic product.
Analysing how NFCs fund their investment activity, i.e. the gross sources of funds, confirms this perception. Figure 5 shows the sources of funds that South African companies have used to finance their activity for the period 1970–2015. Non-financial businesses in aggregate are able to finance the vast majority of their gross capital investment internally. The external finance they acquire goes far beyond their productive investment needs, resulting in large volumes of financial investment. The top dashed line in Figure 5 below, i.e. total gross sources, illustrates this. A ratio of available funds to capital investment exceeding 200% suggests that NFCs invested more into financial instruments than in productive equipment. Internal funds were particularly large in the mid-1980s, when South African NFCs could have financed 2.5 times as much investment as they chose to undertake. This, of course, was a symptom of the social and economic crisis under the apartheid regime, which coincided with the country’s debt crisis (Padayachee, 1991). NFCs abstained from investing, while also facing capital controls, which impeded outright capital flight. Amongst the external sources of funds, issuance of corporate paper (i.e. bonds and equities), followed by bank lending, have historically been the most prominent (see Table 1). 8 Bond and equity issuance was especially strong in the 1980s and 1990s. Importantly, when these two types of issuance are disaggregated it becomes clear that NFCs mostly use equities rather than bonds when turning to capital markets for funds.
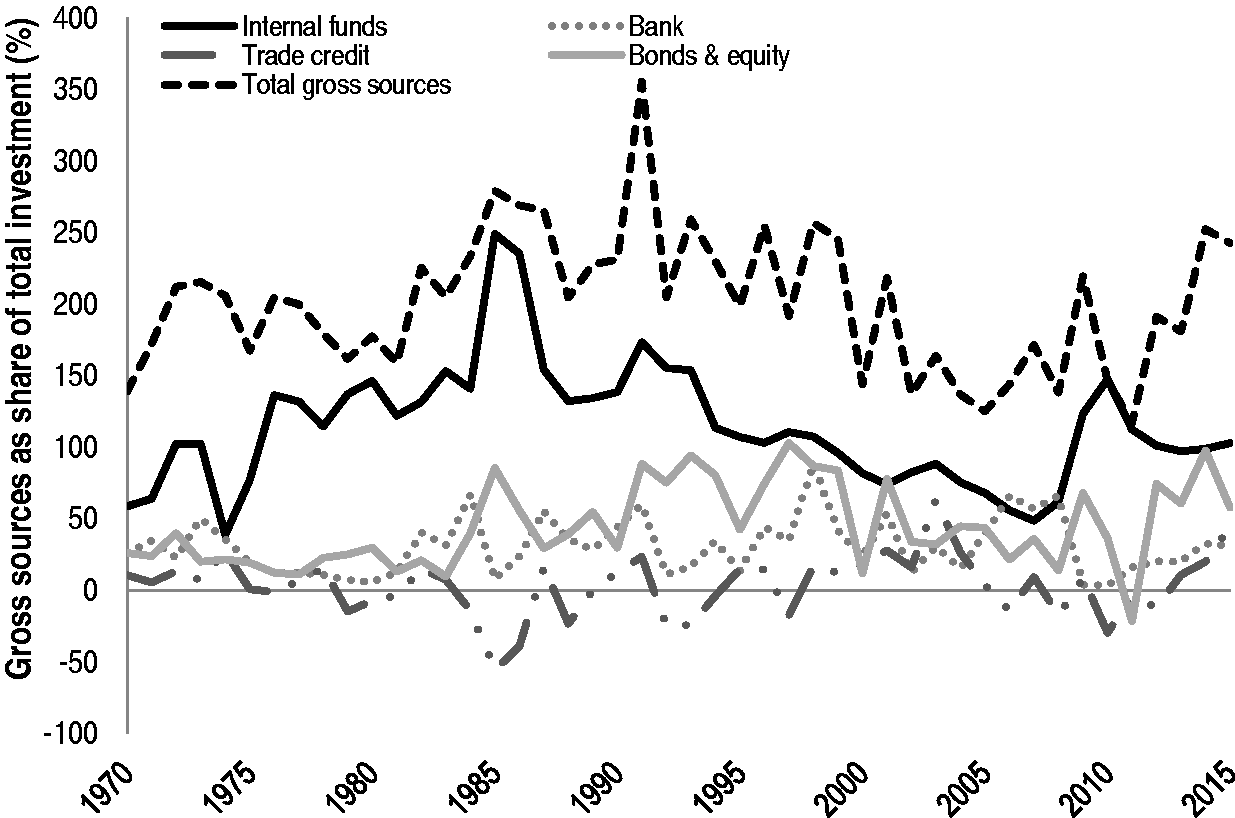
NFCs’ gross sources of funds as share of total investment, 1970–2015. Source: Author’s calculations based on SARB (1994, 1996a–2017a).
NFCs’ gross sources and gross uses of funds as share of capital formation.
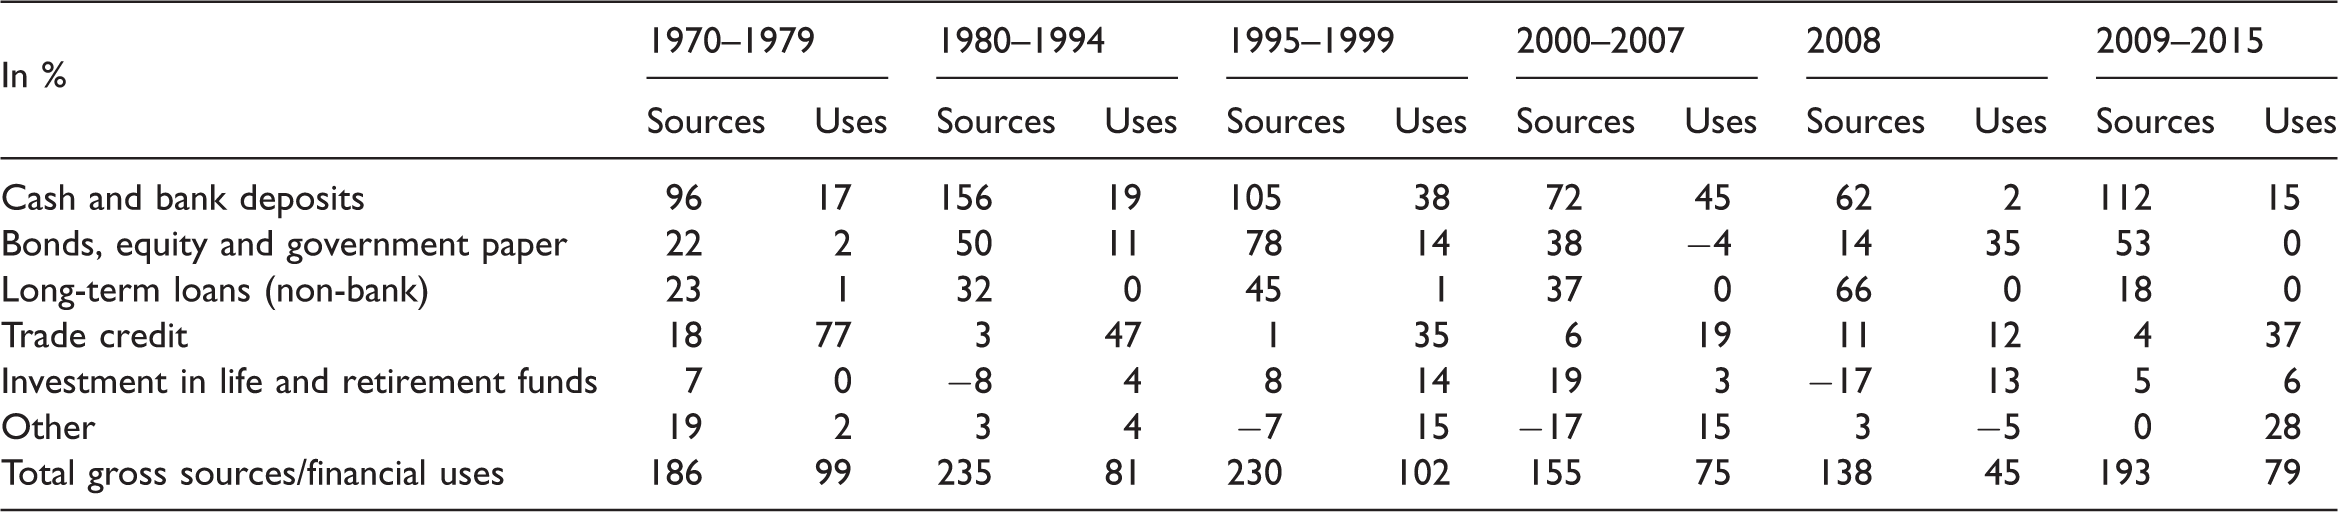
NFC: non-financial company.
Source: Author’s calculations based on SARB (1994, 1996a–2017a).
This tendency is so distinct that resources generated through issued bonds never exceeded more than 20% of total investment expenditure since the 1970s, while new equity rose up to 120% of total investment spending, going well beyond financing needs for productive investment. This is in line with Toporowski’s (2000) concept of overcapitalization. Overcapitalized NFCs use capital markets during boom time to obtain ‘cheap’ funds since listed companies are not obliged to repurchase equity and capital gains on shares are materialized in secondary markets. During the boom years of the early 2000s, investment rates picked up because of the crowding in of private sector capital spending generated by public infrastructure expenditure in preparation of the football World Cup in 2010. During this period banks gained in importance vis-à-vis capital markets as sources of funds for NFCs. Thus, the claim that South Africa shifted towards a more market-based financial system as result of its financialization is difficult to maintain.
With the recession of 2008 capital markets dried up and companies had to turn to domestic banks for external finance. This is not surprising since foreign investors are the main buyers of equity in South Africa. Since 1995 foreigners have bought on average 40% of all issued shares and are the group of buyers with the single largest volume of purchased equity followed by other financial institutions (30% of all shares), the latter including collective investment schemes (unit trusts and participation bond schemes), trust companies, finance companies and public financial enterprises that invest funds on behalf of their clients. Therefore, in 2008 the large outflows of foreign investment from South Africa contributed to the squeeze of local capital markets (McKenzie and Pons-Vignon, 2012).
Considering the current investment strike, it is notable that large volumes of financial investment by NFCs are not a recent development, but a historical trend. This explains why some authors argue that current levels of cash holdings are not unusually high (Nyamgero, 2015). The flow of funds analysis reveals that money flows circulate in the following way: While capital expenditure is to a vast majority financed internally, equities purchased mainly by foreign investors are the dominant source of external funds. Of course, private non-financial firms are not the only entities issuing ordinary shares through the JSE. Financial enterprises and public sector corporations are the two other major issuers. Nevertheless, private sector non-financial firms issued the majority of all ordinary shares, accounting for more than 50% of the total stock in ordinary shares since 1995. The crucial question now is what South African NFCs do with the funds they generate. What type of financial investment do they undertake?
An answer must begin with the observation that there has been a substantial change in NFCs financial operations over the past two decades. During the 1970s and 1980s, trade credit (provided by NFCs to other sectors) was the chief financial asset held by NFCs (Table 1). A high proportion of their non-invested profits were directly channelled towards households and small non-incorporated, most likely informal, businesses. For South African households credit obtained directly from NFCs most likely took the form of instalment sale and lease agreements or open accounts, which include all outstanding (and mostly short term) debt to dealers (Prinsloo, 2002).
Because of the systematic discrimination of non-whites, a particularly large share of black-owned businesses remained informal and non-licenced. This benefitted formal (mostly white-owned) businesses, which often subcontracted light manufacturing such as the production of clothing, furniture and metal goods to informal manufacturers, who were able to operate without adhering to minimum wage and work place regulations. One example documented in a survey on small-scale industry in Katlehong (situated east of Johannesburg) during the mid-1980s is that of a small packaging firm, supplying the US-based multinational firm 3M. The owner of the small business, a previous 3M employee, was encouraged by 3M to set up his own business. Surveys undertaken in other townships (e.g. Orlando West in Johannesburg) suggest similar ties between informal and formal businesses (Rogerson, 1987). The interlocking of informal, often black-owned, small firms and established formal sector, typically white-owned, NFCs seems especially strong in the brewing and distilling sector in that period. South African Breweries used shebeens, informal bars mostly run by black South Africans, as distributional channels for their alcohol. Informal distributional links were important and lucrative, since informal vendors accounted for 40% of liquor sales in South Africa during the 1980s (Rogerson, 1987). Similarly, formal sector retailers and wholesalers enlisted informal hawkers to sell their produce (especially clothing and newspapers) (Rogerson, 1989).
Thus, much of NFCs financial funds supported informal businesses and their productive activity as well as household consumption through trade credit. Over the course of the 1990s the role of trade credit diminished markedly with NFCs shifting towards highly liquid financial investment. Financial assets have since to a large extent been held in cash, short- and medium-term bank deposits, while other financial instruments also became a net outlet for NFCs’ funds. 9 Total other financial assets were negligible in the 1970s. Subsequently, they grew somewhat during the 1980s and early 1990s. But they only started to make up a substantial figure, measured as share of total gross capital formation of non-financial firms, by the late 1990s, when total other financial investment amounted to more than a quarter of NFCs’ productive investment. According to the South African Reserve Bank (SARB) the position ‘other’ captures financially innovative, and therefore most likely highly liquid, operations (Monyela, 2012). This trend only halted during and in the aftermath of the global financial crisis and is likely to re-emerge. In 2014 and 2015, a sum equal to a quarter of NFCs’ total investment spending was channelled into cash and bank deposits, implying that these extremely liquid assets are on the rise again.
Why would NFCs favour liquid financial assets since the 1990s? Since similar trends have been observed in the US (Bates et al., 2009) and other countries (Iskandar-Datta and Jia, 2012) there is a large body of empirical literature, that mostly focuses on rich economies, dealing with firms’ liquidity preference motivated by precaution, the transaction motive, tax rebates or agency problems (see Karwowski, 2015 for a critical discussion). Amongst some financialization scholars the idea prevails that NFCs ‘switch’ to financial activity because their traditional core operations become less lucrative as profit rates decline (Brenner, 1998; Krippner, 2005). Profit rates in South Africa differ strongly across sectors, averaging around 10% in manufacturing, 20% in service industries and more than 30% in agriculture and mining during the 2000s. 10 There is little evidence to suggest that profit rates have fallen dramatically across sectors since the 1980s (Quantec, 2010). In comparison, deposit interest rates in South African banks amounted to almost 15% in the second half of the 1990s and around 9% in the 2000s. Taking inflation into account real returns on bank deposits were more moderate, i.e. around 7% followed by a mere 3% for these two periods, respectively (World Bank, 2017). In fact, it has been argued elsewhere that high profit rates in oligopolistic industries are compatible with large volumes of liquid assets and that there is some evidence along these lines for South Africa (Karwowski, 2013). Thus, the question about the motivation of corporations holding large volumes of liquidity is difficult to answer and the response will vary by sector and company (see Karwowski and Mendes Loureiro, 2016).
In an emerging market like South Africa it is important to note that foreign investors are some of the main buyers of NFCs’ shares. Thus, foreign financial inflows play a crucial role because they can make the issuance of equity attractive for listed NFCs in a rising market. The possibility that dynamics in domestic capital markets reverse unexpectedly, i.e. that foreign capital departs, make it necessary for these companies to hold on to large volumes of liquidity. Liquidity provides them with the flexibility to shrink their balance sheet – through debt pay-offs and share buybacks at any given time – and to acquire other companies and subsidiaries.
Sources of external funds for South African NFCs are volatile (see McKenzie and Pons-Vignon, 2012). This is not surprising, as equity, for example, will mostly be issued when market conditions are advantageous to preserve the share price. Hence, what is needed to provide a more comprehensive picture of NFCs’ aggregate financial operations and their macroeconomic importance is an examination of stocks of financial assets, not just their flows. While the SARB is working on providing a comprehensive set of stock data for the South African economy (Monyela, 2012), figures on NFCs’ stocks of financial assets and liabilities are not currently available. In the absence of better data sources, the author has estimated NFCs’ financial stocks by deflating and summing up flow of funds data since 1995. In this way, we do not obtain the total volume of financial instruments held by NFCs but we can gain an idea about relative shares of different types of financial investment purchased. Hence, it is useful to express the estimations of financial stocks by type of financial instrument as a share of the total financial asset stock.
Eight main categories of financial assets are identified (Figure 6): (1) Cash and deposits, (2) interest in retirement and life funds, (3) other financial assets, (4) trade credit and other short-term loans given by non-financial firms, (5) government securities, (6) long-term loans and mortgage loans, (7) amounts receivable and (8) bond and equity purchases. Cash and cash equivalents and long-term deposits have been grouped together, since these assets are all held with South African banks, that is commercial banks, mutual banks, the Land Bank and the Postbank. These assets tend to be very liquid, as they are either held in current accounts or in short- and medium-term deposits with banks. Even long-term deposits, which have a maturity span of a year and more, can typically be resolved before the end of their maturity period, albeit for a fee.
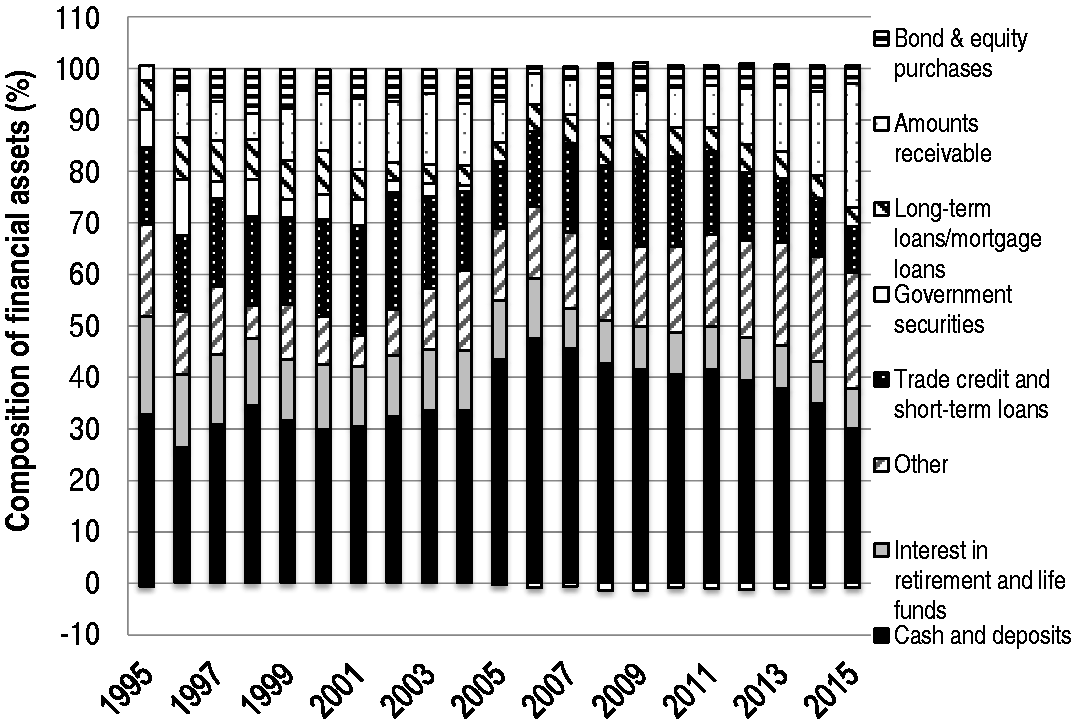
NFCs’ stocks of financial assets, 1995–2015. Source: Author’s calculations based on SARB (1996a–2016a). Note: The calculation is based on financial liabilities stocks measured in constant 2010 ZAR, using the GDP deflator (World Bank, 2017) to obtain real values.
Notably, NFCs have increased their cash and deposit holdings over the 1990s and early 2000s, from around 30% of total financial asset stock during the late 1990s, to almost half of total financial asset stock by 2005. Subsequently, a falling trend in cash and deposit holdings is visible in relative shares among types of financial investment. As cash and deposits were increasingly less favoured by NFCs as outlet of their financial investment the category ‘other financial assets’ alongside receivables gained ground. While receivables most likely refer to outstanding balances with customers, other assets are probably highly liquid. Cash and deposits together with other assets accounted for more than half of NFCs’ financial investment when looking at the period 1995–2015.
The absolute levels of NFCs’ liquid holdings remain vast. As shown in the ‘Financialization in South Africa’ section, total corporate deposits with banks were worth R1.8 trillion in 2016. These large cash holdings by NFCs have come under scrutiny with the investment strike debate. They might be on the fall in relative terms. Equally, they might not be at their historical peak. And, more generally, financial investment among South African corporations might have been larger in the past. Nevertheless, NFCs’ liquidity in South Africa is substantial and, more importantly, because of a change in their financial investment behaviour during the 1990s (i.e. because of corporate financialization) these liquid assets contribute to generating financial fragility through house price inflation as is shown in the next section.
Financialization and house price inflation in South Africa
NFCs’ financial investment into cash and deposits ends up with South African banks, therefore we see the R1.8 trillion of NFC assets on banks’ balance sheets. In the mid-1990s, half of all deposits held in South African banks still came from households (Figure 2), while only around one quarter belonged to NFCs, with the balance made up by deposits from financial institutions, public entities and foreign residents. According to conventional economics, households are the main savers in the economy, depositing their savings with banks, which then, in their role as financial intermediaries, lend those funds out to companies.
Since 1995 corporate deposits have grown at a pace which far outstripped growth in household deposits in South Africa. As a consequence, by 1999 NFCs had taken over the position of major depositors from households, accounting for more than 50% of total deposited funds in South African banks by 2009. This share has fallen somewhat since, but nevertheless remains above 50% of total deposits. Hence, South African banks are not only the main destination for the liquidity held by NFCs, but equally, they are also the biggest depositor group with South African banks. The switching of roles between households and NFCs is a symptom of financialization, with NFCs becoming major creditors while households run down savings and accumulate debt. As investment spending by NFCs falters, debt-financed consumption and real estate expenditure of households become major drivers of growth in a finance-led accumulation regime (Stockhammer, 2008).
Some economists argue that the investment strike is not a problem since banks’ balances are not ‘idle’ cash (Keeton, 2018). Hence, if large NFCs do not invest someone else in the economy will. The question arises what banks do with the substantial volume of liquid financial assets they receive from their corporate clients. On their balance sheets, these assets owned by NFCs turn into liabilities which – together with banks’ equity – are matched on the asset side. Banks in South Africa have not financialized in the same way their Anglo-Saxon counterparts did. While fee-income generating activities have become more important in the course of the 1990s, lending remains their main business (Teles, 2012). In fact, even bank’s fee-based income is mostly linked to mundane transactions (e.g. administrative and transaction charges on deposits) rather than financially innovative instruments. In this sense, banks follow a more traditional business model. Thus, the majority of banks’ liabilities (85% in 2014) are customers’ deposits, while loans and advances make up their main assets (The Banking Association South Africa, 2014). Between 1995 and 2016, credit accounted for three quarters of banks’ total assets on average (SARB, 2017). 11
Within this asset group mortgage loans are the single biggest category which amounted to more than 50% of total lending at their peak in 2009 and 2010 (SARB, 2017). Mortgage extension made up more than half of banks’ outstanding credit. This share has since fallen due to subdued mortgage growth in the aftermath of the global financial crisis. In 2016, 42% of total loans and advances by South African banks were mortgage loans. During the boom years of the early 2000s, there has been an accelerated growth of mortgage volumes extended by South African banks (Figure 7). Mortgage extension rose from around R130bn in 1995 to R850bn by 2007, almost doubling in size from 23% of GDP to 41% of GDP. In 2016, total outstanding mortgages were worth close to R1.3trn, having declined to 30% of GDP because of slower growth in new mortgages. The boom years coincide with particularly strong growth in deposits by NFCs. While corporate deposit growth fluctuated between 1995 and 2007, on average, it was at a very high level, exceeding 20% per year. Markedly, this growth has fallen to just above 7% since 2008.
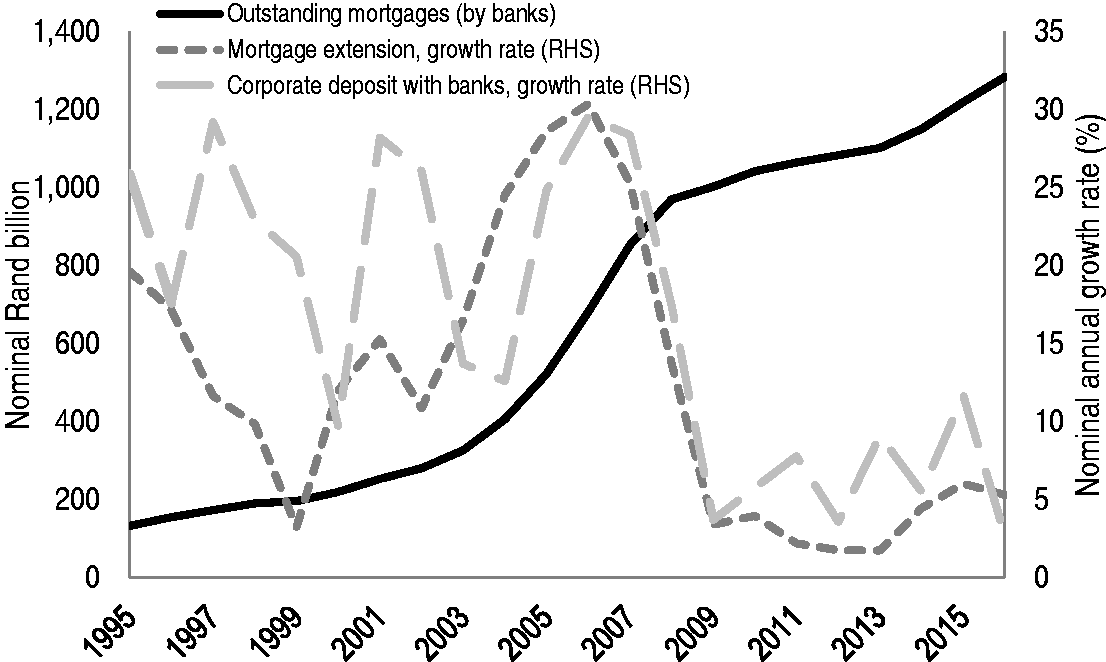
Mortgage extension by South African banks, 1995–2016. Source: SARB (2017). RHS: right-hand scale.
In this situation corporate liquidity on banks’ balance sheets can encourage credit creation. Crucially, this result depends on South Africa’s status as an emerging market. This paper does not argue that deposits create credit since in most countries money is endogenous, i.e. can be created by commercial banks through credit extension (Jakab and Kumhof, 2015). However, financial institutions are time- and country-specific, rather than generic, which is often implicitly assumed. As argued by Chick (1992) in her discussion of stages of banking evolution, for reserves not to be a constraint on credit creation at all, the central bank needs to accept full responsibility for financial stability. This goes hand in hand with a stable and low interest rate policy. Since there is no commitment of the SARB to a policy of low interest rates, interest rates have been relatively high (some would say ‘ridiculously’ so, Bond, 2005: 98) and, like in many emerging economies, driven by portfolio inflow considerations. This is especially the case since the mid-1990s when the country became the IMF’s poster child of ‘prudent’ macroeconomic policies (Isaacs, 2014). 12 In fact, it has been argued that in emerging economies central banks’ ability to influence interest rates, i.e. to commit to low and stable rates, is severely limited by the international institutional setting in which they operate, being dependent on foreign currency for reserves (Lapavitsas and Saad-Filho, 2000). Socio-economic stability in the two countries that pioneered financialization, the US and UK, are dependent on low interest rates to sustain domestic demand in the face of waning government spending (Crouch, 2009). In contrast, poorer countries with liberalized financial accounts are forced into a high-interest rate monetary regime (Bonizzi, 2017).
Thus, commercial banks in emerging countries can be expected to engage more actively in deposit management with the aim to reduce their own borrowing of liquid funds. A symptom of this was the steadily declining interest rate spread of commercial banks, meaning the difference between deposit and lending rates, in the course of the housing boom in South Africa. It fell from 5.2 to 3.5 percentage points between 2003 and 2008 as deposit interest rates increased from 6.6 to 11.6%. Nevertheless, the interest rate spread firmly remained well below the money market rate which in turn is close to the SARB's policy rate. Thus, banks offered rising interest rates attracting more depositors, while staying well clear of the money market rate above which deposit management would become too costly. Under these circumstances inflows of corporate deposits encouraged South African banks in extending large volumes of credit. Banks increased their share of mortgage loans in total loans between 1999 and 2010, channelling NFCs’ liquidity into the booming property markets. The inflationary process attracted increasing investment, further raising prices until mortgage extension stalled in 2008, and, in fact, contracted in real terms in 2009.
Over this period, mortgage loans were mostly home loans, which accounted for three quarters of total mortgages. The rest were commercial mortgages taken up by businesses. What about the other half of bank lending? What type of activities do South African banks mainly finance? Looking at the loan books for the big four banks, i.e. Absa, FirstRand (operating in South Africa as FNB), NedBank and Standards Bank, it is clear that their lending is conducive to financialization processes. Figure 8 provides the shares in overall outstanding loans to the industries which are the main beneficiaries of bank credit from those four institutions. Absa, FirstRand, NedBank and Standards Bank are collectively sometimes referred to as the Big Four since they own the vast majority of banking assets in South Africa. In the early 2000s, these four owned three quarters of total banking assets in the country (Falkena et al., 2002). By 2014, they accounted for more than 80% of total banking assets (The Banking Association South Africa, 2014). Thus, their loan books are representative for South African credit extension in general.
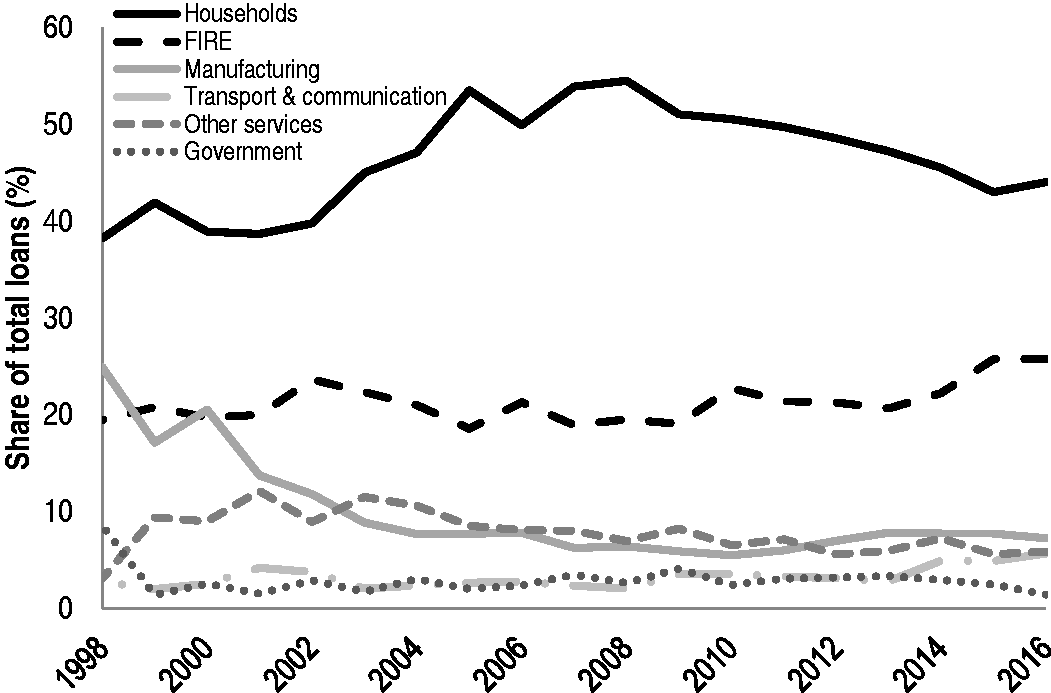
The big four banks’ lending (unweighted average) by sector, 1998–2016. Source: Annual reports by Absa Group Limited (2003–2016), First Rand Bank Limited (2000–2016), Nedbank (1998–2015) and Standard Bank (2002–2016).
In recent years, the main recipients of credit in South Africa are households and the FIRE industry (i.e. finance, insurance and real estate services). They receive at least 65% of credit issued by any of these four banks. Manufacturing, transport and the services industry together did not manage to obtain more than a fifth of provided loans. The rest is taken up by agriculture, mining, wholesale and the electricity sector. Thus, an overwhelming share of lending is channelled towards activities which are at the core of financialization: housing purchases, debt-financed consumption and FIRE services. In fact, since the late 1990s lending to households (including both mortgages and consumption credit) and the FIRE industry has captured an ever-increasing share of banks’ loan books (Figure 8). The average share of borrowing by these two sectors was a mere 16% in 1997, before climbing up to three quarters of total loans in 2008 and staying at a very high level until today (in 2016 it stood at 70%). As house price inflation has come to a halt with the 2008 recession banks have been less favourable towards households, especially in terms of mortgage extension. This accounts for the falling share of household credit in total loans. However, rather than shifting lending towards more productive sectors (such as manufacturing), credit now increasingly benefits the FIRE industry. Banks’ direction of lending remains supportive of financialization processes.
Conclusion
This article has explored the processes of financialization in the South African economy by tracing the sources and destinations of NFCs’ liquidity. The paper argues that rather than the volume of NFCs’ financial investment, the composition of financial assets is crucial to assess corporate financialization in the country. While some authors (e.g. Nyamgero, 2015) claim that cash holdings of South African NFCs are not unusually high in historical perspective, this misses the point. Non-financial businesses in the country fundamentally transformed their investment behaviour during the 1990s, shifting from more productive uses such as trade credit towards highly liquid and potentially innovative (and therefore risky) financial investment. Following the direction of financial flows the article shows that – fuelled by foreign capital inflows – companies’ financial operations supported the price inflation in South African property markets. NFCs draw a substantial share of their liquid funds from abroad, issuing equity which is purchased by foreign investors. To counter their liabilities NFCs have been managing their liquidity actively since the 1990s, holding between 40 and 60% of financial assets in highly liquid instruments.
Most of NFCs’ liquidity ends up with domestic banks. During the 2000s, banks directly contributed to the build-up of financial fragility in South Africa by channelling this liquidity into the housing market through mortgage extension. While deposits do not create loans, the growth in corporate deposits on banks’ balance sheets can facilitate this development in the global South. In contrast to rich countries, central banks in emerging economies (believe they) cannot commit to stable and low interest rates. ‘Prudent’ macroeconomic policies dictate that inflation expectations alongside foreign capital flows guide monetary policy, resulting in high interest rates. In such a situation, growing NFC deposits cheapen liquidity management, facilitating credit expansion. Crucially, commercial banks’ lending increasingly supports financialized activity. Thus, the investment strike is problematic because South African NFCs are unwilling to invest, while at the same time the handling of their financial assets contributes to financial fragility.
In terms of financialization theory, this means that certain financialization processes in emerging economies will be distinct from those in rich countries. For instance, credit extension in Anglo-Saxon markets has been observed to be almost completely independent of banks’ liabilities and is rather guided by their considerations of market share and willingness to aggressively push loan creation. Therefore, NFCs’ cash holdings, which are also large in rich countries, do not influence banks’ credit creation. In fact, banks in rich economies such as the UK and US have diversified their assets away from loans and advances (dos Santos, 2009). In emerging economies, by contrast, where traditional deposit taking and credit lending activity is more prevalent among banks, liquidity held by NFCs can feed into credit booms. Corporate liquidity lowers banks’ cost of liquidity management, while encouraging the creation of lucrative loans on the asset side of banks’ balance sheets.
Footnotes
Declaration of conflicting interests
The author(s) declared no potential conflicts of interest with respect to the research, authorship, and/or publication of this article.
Funding
The author(s) received no financial support for the research, authorship, and/or publication of this article.