



Abstract
Oil trade-related monetary arrangements have far-reaching impacts on the international monetary system and the global financial circuit. Current arrangements were set in the mid-1970s through the establishment of the petrodollar regime. This article empirically assesses the effective and potential impacts of the change in the integration pattern of the Gulf Cooperation Council (GCC) countries in the global economy on the two pillars of the petrodollar: recycling oil export revenue into the US economy and invoicing oil exclusively in dollars. The results show that the effectiveness of the petrodollar regime has been significantly reduced as China has overtaken the United States as the largest destination for the recycling of the oil receipts from the GCC through the trade channel. This article investigates the possible further expansion of oil settlements in the renminbi (RMB), based on China–GCC relations, following China’s release of the petroyuan contracts. The structure and the weight of their trade and investment relations constitute solid grounds to settle bilateral oil trade in RMBs. Moreover, China’s targeted and regulated financial opening provides operating channels for overseas holders of RMBs to invest in China’s relatively attractive assets. To better discern the GCC’s inclination to change their oil-invoicing arrangements, this article analyses their participation in the RMB internationalization channel.
Keywords
Introduction
Oil trade-related monetary and financial arrangements have far-reaching effects on the international monetary system and the global financial circuit. As the principal energy source fueling economic growth, oil is one of the most traded commodities; therefore, accumulating reserves of its invoicing currency is necessary. In addition, energy trading involves income redistribution from oil importers to oil exporters, raising the question of how to manage and channel the resulting capital surplus. The operation of these arrangements was set in the mid-1970s through the establishment of the petrodollar regime following agreements between the USA and Saudi Arabia that designated the dollar as the exclusive currency for oil invoicing and the US economy as the principal destination for oil export revenue recycling. These arrangements led to maintaining the dollar’s status as the key international currency (Spiro, 1999).
Four decades later, the global economy’s restructuring has brought these arrangements’ effectiveness into question due to China’s rising position as the world’s largest economy in terms of gross domestic product (GDP) based on purchasing power parity. This shift has taken place in parallel with the reorientation of regional, interregional, and transnational trade and investment relations, including in the Gulf Cooperation Council (GCC) countries, and with China now acting as a central node in the flow network. However, the consequences of these momentous changes for the petrodollar regime have been underinvestigated. This article examines the effective and potential impacts of changes in the integration pattern of GCC states in the global economy on the two pillars of the petrodollar: recycling oil export revenue into the US economy and invoicing all oil purchases in US dollars.
In order to do this, I analyze changes in the relative weights of the United States, China, and the European Union (EU-15 group) as major destinations for recycling of GCC countries’ oil revenues through the trade channel (otherwise known as the absorption channel). The results show that the petrodollar regime has been effectively weakened by the GCC states’ shifting trade flows. The United States is no longer the largest destination for the recycling of their oil revenues through the trade channel; instead, China has become the largest single-country destination, accounting for 14% of GCC countries’ total imports in 2018.
China’s geoeconomic power has been projected in oil markets, resulting in what Strange (1988) labeled a structural power that works to reshape the oil trade’s existing monetary arrangements. A first significant manifestation of this is the release of the petroyuan contract, which successfully ended the exclusive pricing of oil in US dollars. This article examines how the profound economic relations between the GCC and China constitute a possible venue for further expansion of oil invoicing in renminbis (RMBs). China has huge geoeconomic leverage in its relations with the GCC as the largest destination for their oil exports and first source of regional investment. More importantly, the concrete structure of bilateral economic relations provides objective grounds and an economic rationale for the GCC to invoice oil in RMB. In parallel, China’s innovative management of the monetary trilemma (McNally and Gruin, 2017) has established effective pipelines that increasingly grant overseas holders of RMB investments access to its financial centers (McNally, 2015). The recent rush by major global financial market actors into China’s low-risk and high-yield assets attests to the presence of channels for investable opportunities of the excess RMBs derived from oil recipients.
The GCC countries seem increasingly responsive to China’s new financial framework, with some of them participating very actively in the hybrid institutional workaround of RMB internationalization, such as the Qualified Institutional Investors, Bond Connect, and Bond Direct schemas, trade settlements in RMBs, local currency swap agreements, establishment of RMB clearing centers, issuance of RMB-denominated debt, development of a multi-arrangement cross-border payment system based on central banks’ digital currencies, and the release of the Dubai Exchange’s RMB-denominated gold future.
The next section presents the analytical framework, which combines some elements of the geoeconomic literature with the concept of structural power. The petrodollar and the US position in the international monetary system section defines the petrodollar and its importance for the United States and for the international monetary system. The reorientation of Gulf oil receipt’s recycling through trade: China overtakes the United States section analyzes the evolution of the GCC countries’ oil revenue recycling through the trade channel over the 2001–2018 period in their trade relations with the United States, the EU, and China. The China’s market and resource leverage on the Gulf section assesses China’s market and resource powers over GCC countries. The Shanghai’s oil future: the end of exclusive oil invoicing in US dollars section considers the launch of the Shanghai oil future and how it relates to China’s efforts to internationalize the RMB. The Will the GCC states settle oil exports to China in RMB? section examines the determinants of the GCC decision to invoice oil in RMB. The Conclusion section concludes.
Geoeconomics, structural power, and international economic institutions
In recent decades, there has been a resurgence of interest in geoeconomics, a highly debated and loosely and differently defined term. Geoeconomics is mainly considered to be the state’s use of economic instruments to achieve geopolitical objectives (Luttwak, 1990) and also economic objectives endowed with a strategic dimension (Wigell, 2016). Geoeconomic analysis importantly focuses on power relations residing in economic interdependence (i.e., trade, financial, and investment flows and infrastructure projects linking states and regions). In a context of globalized production and exchanges across different and competing political jurisdictions interacting through asymmetric interdependence relations, geoeconomic practice uses positive inducements and/or negative sanctions to alter trade, production, and capital to push another party to adopt and/or avoid certain political and economic practices (Scholvin and Wigell, 2018).
Blackwill and Harris (2016) identified four foundations of a state’s geoeconomic power: (1) its ability to control financial outflows by strategically using domestic capital; (2) its domestic market features, including overall size and degree of control of entry terms of capital and merchandise; (3) its influence over commodity and energy flows, defined by monopoly power (production capacity), monopsony power (purchasing power), and centrality as a transit point between major buyers and sellers; and (4) its centrality to the global financial system, which enables the control of global financial flows.
China has accumulated some of these gravitational geoeconomic foundations, especially of the first three types, and is making considerable progress with respect to the fourth. China derives its geoeconomic power from its import absorption capacity and ability to control merchandise and capital inflows; this enables it to redirect its domestic demand according to its strategic objectives. China’s market power also comes from its industrial and export competitiveness (Park, 2018). It was the largest trading partner of 128 countries as of 2013, 1 and by 2018, it was the world’s leading goods exporter, with 13.5% of global exports, and the second-highest importing country, with 11.4% of global imports. 2 China is the largest source of international lending, with a high level of control of financial flows through its state-owned investment vehicles and banks (Beeson, 2018). The international financing of two Chinese global policy banks totaled $458 billion between 2009 and 2018, a figure that is higher than the World Bank’s sovereign commitments for the same period. 3 In this context, the Belt and Road Initiative (BRI) can be understood as an umbrella seeking to coordinate China’s de facto international economic role, grant it policy coherence, and mobilize it as a means of achieving China’s economic and political objectives both at home and abroad.
Indeed, a geoeconomic analysis of the mutations of transregional economic interdependence adds value to the broader analysis of the international political economy as long as an international economic institution is conditioned by a specific regional integration process (Scholvin and Wigell, 2018). Thus, geoeconomic analysis helps to assess the consequences of mutations of transregional economic relations and of the effects their built-in power dynamics have on international institutions’ transformations.
Geoeconomic foundations can be seen as providing leverage for the construction and practice of what Strange (1988: 25–26) labeled structural power (i.e., the ability to shape the structure of the global political economy and the framework within which other states and their political institutions and enterprises have to operate). The possessor of structural power changes the range of choices open to others without apparently directly pressuring them to make one decision over others. Although it extends the range of options, it may also restrict it by imposing larger costs than would otherwise be faced, thus making it more difficult or easy to make some choices (Strange, 1988: 31). In this sense, China has grown its structural power by establishing alternative international trade and financial institutions when attempting to reframe existing global economic governance has failed (e.g., Paradise, 2016). Two fundamental built-in characteristics of China’s international approach have effectively widened the range of choices available for other states.
First, new institutions align with the political economy of China’s development model in which market forces are dominated by a state-led industrialization strategy (McNally, 2015; Strange, 2011); this diverges from dominant international institutions guided by neoliberal agendas (e.g., Petry, 2020; Chin and Gallagher, 2019; Alshareef, 2023, 2017; Brautigam, 2009). Thus, it enlarges its partners’ development policy space and facilitates new political-economic choices that were restricted by Western-led institutions, making the so-called Beijing consensus more appealing than the Washington consensus (Browne, 2015). Second, new institutions are engineered from within the dominant international ones (McNally and Gruin, 2017; Strange, 2011) and are open and inclusive (Paradise, 2016). This allows China’s partners to diversify their international economic relations without being obliged to opt out of the current system.
For instance, China’s hybrid RMB internationalization approach has produced a distinct type of financial market characterized by a logic regarding the interaction of state and market forces that is unlike the profit-driven neoliberal variety (Petry, 2020). It could potentially transform the international monetary regime to make more space for illiberal economic policies (McNally and Gruin, 2017). As the Shanghai’s oil future: the end of exclusive oil invoicing in US dollars section shows, overseas investors are responsive to China’s financial liberalization/regulation approach and are increasing their investment in RMB-denominated assets through the devised institutional channels. Thus, a fundamental condition for oil invoicing in RMBs (i.e., access for overseas holders of RMBs to profitable opportunities) seems to be maturing.
Given historical US–GCC political relations, studying the possibility of a Gulf state trading oil in RMBs may seem to be an extravagant analytical undertaking. Eichengreen et al. (2019) demonstrated correlations between the pattern of political alliances and reserve currency choices. Momani (2008) argued that the GCC will continue invoicing oil exclusively in dollars as long as the US army remains strong in the region. However, these studies do not examine the determinants of such alliances to understand how they change. Meanwhile, Hinnebusch (2011) analyzed US–GCC political relations through a Marxism-inspired structuralist framework whereby the Gulf is peripheral and the economic and political interests of its dominant classes overlap with those of the core. He found that this led the Gulf to align its foreign policies with the latter. Full consideration of the changes related to this overlap is beyond this article’s scope, but our analysis provides significant material for future studies on the mutations of the economic foundations of US–GCC political alignment. A reorientation of the GCC’s international economic interdependences toward China and away from the United States is expected to be politically transformative for several reasons.
First, the Gulf would become increasingly deferential to China’s preferences and geoeconomic power; hence, it will, at least, have to balance between two rival powers’ interests instead of uniquely sticking to the US ones. Second, geoeconomic use of concessions and sanctions as a wedging and binding strategy creates a centrifugal force within allied states depending on the parties’ losses and benefits, thus weakening the alliances’ balancing potential (Wigell and Vihma, 2016). If necessary, China can use its geoeconomic power to deleverage the balancing potential of US–GCC political relations against its quest for monetary autonomy in the oil trade. Third, on the demand side, China’s economic engagement within a specific region and its introduction of new choices and frameworks offer its partners the long-awaited opportunity to pursue greater autonomy from the United States (Chávez, 2015). In sum, China’s structural power provides the Gulf with a range of advantageous options, but their potential losses could have deleveraging effects on US–GCC political relations regarding oil invoicing in RMB.
The petrodollar and the US position in the international monetary system
The economist Oweiss (1984) defined the petrodollar as the US dollar earned from the sale of oil or as oil revenues denominated in US dollars. It has two complementary elements: invoicing oil exclusively in dollars and recycling oil export revenue to the US economy. Exclusively invoicing oil in US dollars and recycling oil revenue into the US economy through the purchase of goods and services and investment in US financial assets (Spiro, 1999) was first established in a 1974 US–Saudi Arabian Joint Commission on Economic Cooperation agreement prior to the Organization of the Petroleum Exporting Countries (OPEC) adopting the practice in 1975. OPEC had intended to invoice oil in a diversified basket of currencies, such as the International Monetary Fund’s Special Drawing Rights, before Riyadh succeeded in changing its mind. These moves came after the collapse of the post-war Bretton Woods arrangements following the American decision to end the US dollar’s convertibility into gold. Because oil is the key energy source fueling global economic growth, the petrodollar arrangements pushed states to accumulate large dollar reserves to purchase it. Thus, the petrodollar de facto replaced the dollar gold standard, guaranteeing a constant demand for US dollars. As the financialization of commodity markets has increased unabated, the demand on the dollar derived from the demand for oil is much greater than the daily physical oil transactions (UNCTAD, 2011: chapter 5); energy commodities generally comprise one-third of the Bloomberg Commodity Index (EIA, 2018).
In agreeing to invoice oil in dollars, the Gulf countries contributed to the US dollar’s preeminent status as the key international currency (Spiro, 1999) and its continued exorbitant privilege (Gourinchas and Rey, 2014). The petrodollar arrangements have influenced the global financial structure and reinforced the centrality of Anglo-American financial markets through large amounts of surplus capital received for oil exports in the United States’ and Europe’s financial centers (Hanieh, 2018). This has also enabled the United States to finance its debt-led consumption (Ivanova, 2012), and, combined with the central role of the dollar, it has fueled the current account deficit, the mechanism by which real resources are transferred from the rest of the world to the United States (McKinnon, 2011).
Based on available data, Hanieh (2018: chapter 2) assessed the GCC flows into global financial markets through the US debt and capital markets, the international banking system, and foreign direct investment (FDI). Hanieh estimated the collective value of disposable wealth and foreign assets of GCC governments, sovereign wealth funds, private Gulf firms, and individuals to have been well over $6 trillion in 2016. In November 2020, Saudi Arabia’s, Kuwait’s, the UAE’s, and Oman’s holdings of US treasury bonds were $137.6 billion, $46.1 billion, $36.8 billion, and $5.7 billion, respectively, according to the US Department of the Treasury.
Another crucial route for recirculating GCC surpluses into the US economy is through military hardware imports (Hanieh, 2018). According to the Stockholm International Peace Research Institute, the US’s first and third export destinations between 2015 and 2019 were Saudi Arabia and the UAE, whose shares of total US arms exports were 25% and 6.4%, respectively (Kuimova et al., 2020). In the same period, GCC countries (excluding Bahrain) accounted for 20.5% of total global arms imports, with Saudi Arabia being the world’s largest importer (12%). The main supplier to Saudi Arabia is the United States (73%), followed by the UK (13%) and France (4.3%) (Kuimova et al., 2020). The GCC countries are therefore among the top military spenders in the world; three are listed in the top ten as measured by their military expenditure share to GDP in 2017: Saudi Arabia 8.8%, Oman 8.2%, and Kuwait 5.1% (Tian et al., 2019).
Finally, as the global reserve currency, the dollar has been crucial to the operation of US hegemony during the post-World War II period (Kirschner, 1995). Because of the dollar’s status, the United States can finance its Department of State and Department of Defense allocations, cut off disobedient states from the international financial circuit, and finance the socio-economic conditions of its relative domestic political stability.
The reorientation of Gulf oil receipt’s recycling through trade: China overtakes the United States
According to Nsouli (2006), petrodollar recycling occurs through two channels: • the absorption channel (trade channel)—petrodollars are spent to finance domestic consumption and investment, thus increasing demand for imports of goods and services; and • the capital account channel—petrodollars are invested in foreign assets and financial instruments, including different currencies, resulting in a capital account outflow.
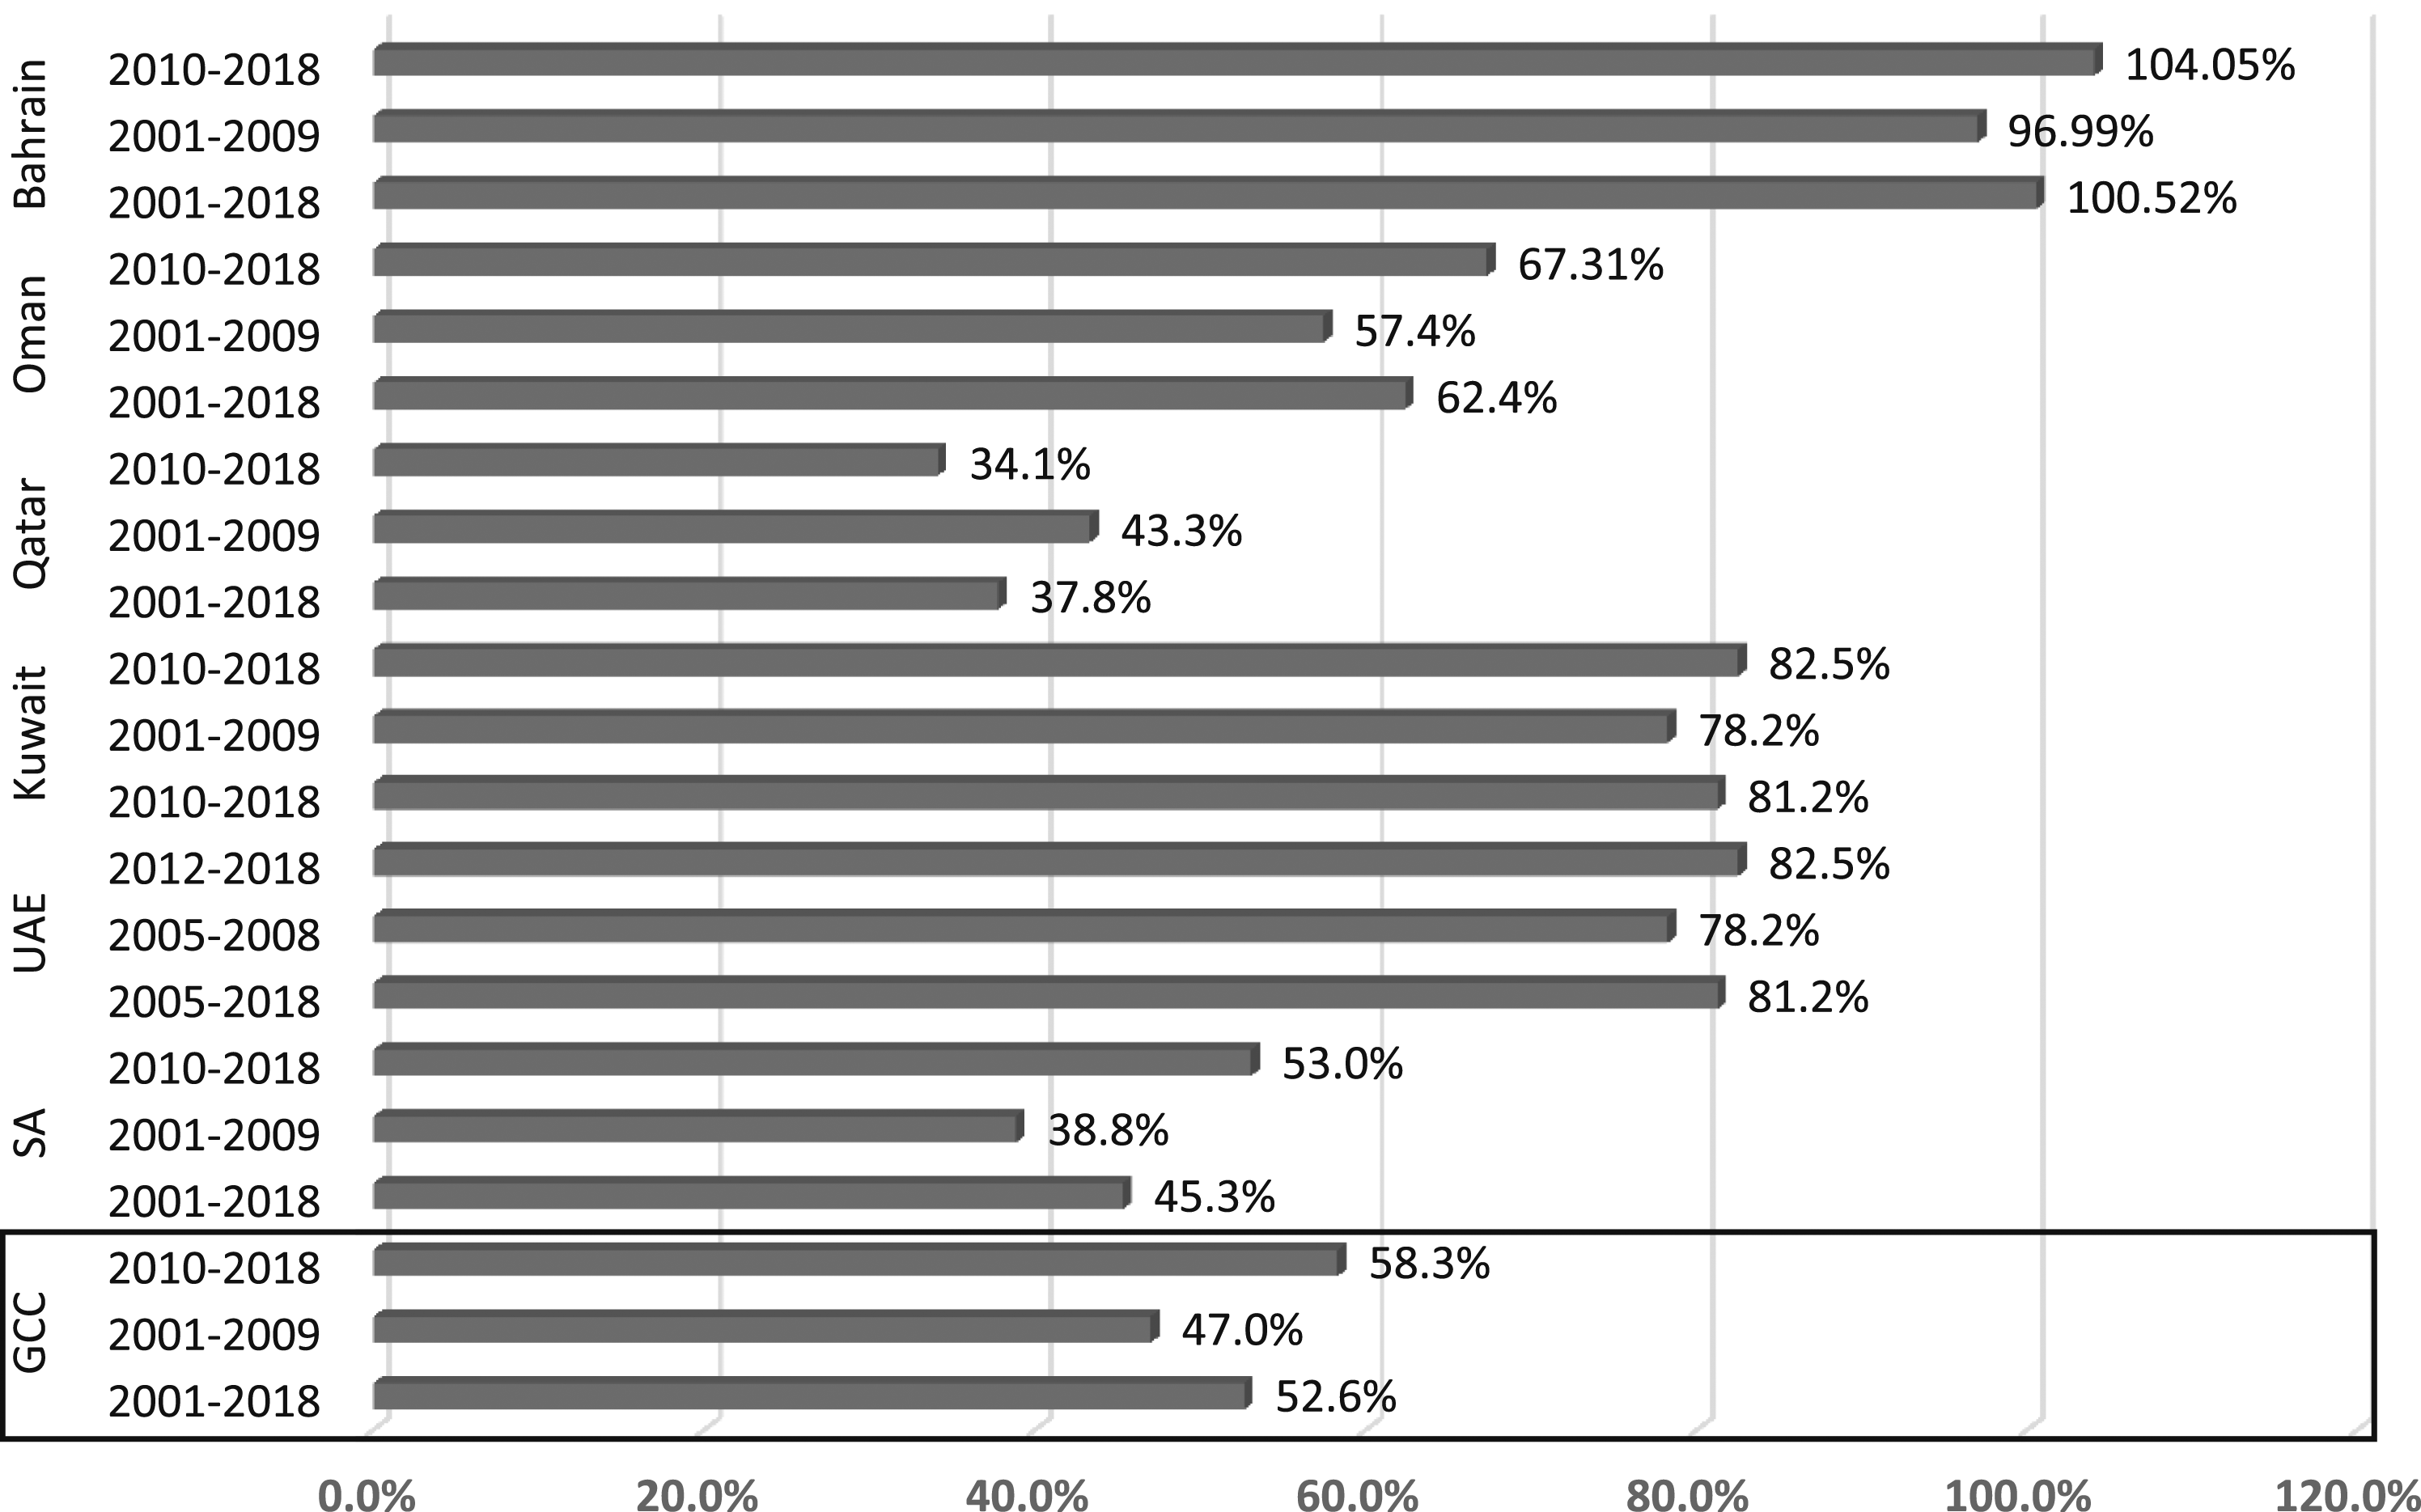
Detailed and accurate mapping of the various paths of capital account recycling is difficult because public data on the GCC’s financial outflows are lacking. However, publicly available data on exports and imports provide information on the recycling’s destinations through the trade channel. While the few studies on the subject often focus on the capital account channel, producing aggregate estimations (e.g., Higgins et al., 2006), the relative weight of the trade channel as measured by the ratio of the value of total imports to total exports has been increasing on average in the GCC. This ratio allows estimating the export revenue percentage recycled back into the world economy through import payments. Figure 1 shows that: • on average, the equivalent of more than half of total export receipts were used to finance imports between 2001 and 2018. In the case of Bahrain, it was 100.5%;
4
and • the general trend is increasing for GCC countries, from an average of 47% between 2001 and 2009 to 58.3% between 2010 and 2018, and from 38.8% to 53% for Saudi Arabia. Total imports to total exports (value, %). Source: Author’s calculations based on the Trade Map-International trade center.
GCC countries’ exports component (share, 2018).

Source: GCC-STAT.
According to the Trade Map data, the value of the GCC’s imports increased from over $287 billion in 2007 to almost $511 billion in 2018. Over the same period, exports grew less rapidly, from $533 billion in 2007 to $824 billion in 2018, peaking at more than $1 trillion in 2013 just before oil prices collapsed in 2014. Trade flow origins and destinations have been reorienting eastward: imports from China have multiplied more than 36 times (soaring from less than $2 billion in 2001 to almost $74 billion in 2018) and overtook the United States by 2008. Imports from the United States and the EU increased from $7.2 billion to $50.2 billion and from $15.1 billion to $94.3 billion, respectively.
Our first indicator for tracing the evolution of countries’ relative importance as destinations for GCC oil revenue recycling through the trade channel is the ratio of the value of the GCC’s annual imports from a partner economy (i.e., the United States, China, and the EU) to the value of the GCC countries’ total exports. This facilitates estimating the partner economy’s share from the annual receipt of the importing country’s exports. Figure 2 shows the evolution of the ratio from 2001 to 2018: • China’s share of GCC countries’ annual export revenue increase almost fivefold, rising from 1.8% in 2001 to 8.9% in 2018 for the GCC on average. This trend is observable for all GCC countries individually. • The US economy’s share of the annual export revenue from GCC countries fell to 4% in 2011, after which the curve began to climb again. On average, the US share of energy export revenues from GCC countries decreased from 6.5% to 6.1%. • The EU’s share of annual export revenue from GCC countries decreased significantly from 13.6% to 11.5%. We observe the same pattern as for the United States; the EU share fell sharply to 7% in 2011 before it began to recover its losses. Ratio of imports from partner countries to total exports (value, %). Source: Author’s calculations based on the Trade Map-International trade center.

The second indicator is imports by provenance, which enables us to estimate the partner country’s share of the GCC countries’ total imports in absolute terms, not just relative to annual export revenue. Figure 3 shows the evolution of this ratio from 2001 to 2018: • There was a spectacular 279% increase in China’s share of the GCC’s total imports, whereas the US and EU shares decreased substantially by 31% and 38%, respectively. This trend is clearest for Saudi Arabia, where China’s share increased by 284% and the US and EU shares declined by almost 35% and 30%, respectively. • The relative decline of the United States as a destination for the trade channel is clear: its share fell from 14.2% to 9.8%. Moreover, the latest available data show that the gap grew between the shares of the United States and China in 2019 in the case of Saudi Arabia, with their shares estimated at 11.8% and 18.8%, respectively. • China’s share of GCC countries’ total imports rose from 3.8% to 14.4% and from more than 4% to almost 17% in the case of Saudi Arabia and Kuwait. China, as a single country, is the largest foreign source of imports for the whole GCC and for individual GCC countries, except for Qatar, where it is second after the United States (apart from 2015 when China’s share overtook the United States). • The EU as an economic bloc remains the largest source of GCC imports, but its share is falling rapidly, decreasing from 29.7% to 18.5%. In the case of the UAE, China overtook the EU in 2017. Share of total imports (value, %). Source: Author’s calculations based on the Trade Map-International trade center.

China’s market and resource leverage on the Gulf
GCC’s share of total Chinese oil imports (%, 2017).

Source: Author’s calculations based on OPEC (2018).
GCC exports to China multiplied by more than 21 times between 2001 and 2019, increasing from $5.2 billion to $111.1 billion, and made China the primary destination, except for Bahrain, for GCC members’ exports. Moreover, Oman’s 2018 exports to China were recorded at more than 45% of its total commodity exports’ value (see Figure 4), and since 2009, Saudi Arabia’s export share to China has exceeded its export shares to the EU and the United States. Finally, since 2010, the UAE’s and Kuwait’s share of exports to China has overtaken those to the EU and the United States; since 2006, China has received a larger share of Qatar’s exports than the United States; and since 2017, it has received a larger share than the EU. Export destinations, share of total exports (value, %). Source: Author’s calculations based on the Trade Map-International trade center.
If we consider the volume of commodities exports, the contrast is even starker. GCC countries’ exports to China rose to 164 million tons in 2018 from 21.9 million tons in 2000, but their volumes of exports to the United States and the EU decreased over the same period from 87.7 to 65.1 million tons and from 77.1 to 75.3 million tons, respectively. 5
China’s market power leverage has become even stronger because GCC countries are dependent on energy export revenues, which is an increasingly acute problem due to developments in the oil market. Since 2014, the GCC countries’ overall fiscal balance and current accounts have deteriorated because of collapsing oil prices and their aggravated fiscal revenue dependence on oil receipts (IMF, 2016). For example, in 2018, Saudi Arabia’s hydrocarbon exports accounted for 78.7% of its total exports, and oil exports supported 67.8% of its total revenues (SAMA, 2019: 112, 128). After the oil price drop in 2014, its current account deficit reached 17.2% of GDP by 2016.
In the wake of declining oil prices through 2015, the GCC states financed 80% of their expenditure with their financial assets, including commercial bank deposits. To preserve their global asset base and avoid liquidity pressures on local financial markets from government deposit withdrawals, GCC states increased government debt issues (Hanieh, 2018). Their debt issuance level since 2015 has been so high that about 30% of the total emerging market debt issued internationally in 2018 came from the Gulf (Young, 2019: Figure 4). In a clear signal of Saudi Arabia’s readiness for monetary diversification, it issued its first ever euro-denominated bonds, valued at 3 billion euros—the equivalent of 30% of the debt issued in 2019. However, debt issuance is a short-term reaction, and its limits have started to become apparent, especially in the case of Bahrain and Oman (World Bank, 2019: 15–16).
Awareness of the dangers of overdependency on energy revenue has led the GCC countries to launch economic diversification strategies, such as Saudi Vision 2030. These meet with China’s “going west” strategy and the BRI initiative. The Gulf region is particularly important for the BRI’s Maritime Silk Road connecting to East Africa, South Asia, and the wider Middle East. Regional investment in infrastructure and industrial parks are integrated into China’s geostrategic plan to build Indian Ocean-centric regional production networks (Kenderdine and Lan, 2018), including Khalifa Port Container, Khalifa Industrial Zone Abu Dhabi, and China-Oman Industrial Park in Duqm.
China’s investments are making it a major project development player in the region: it made more than $107 billion in direct investments and contracts in the GCC between 2005 and 2021 (Saudi Arabia: $43.5 billion, UAE: $36.2 billion, Kuwait: $11.75 billion, Qatar: $7.8 billion, Oman: $6.62 billion, and Bahrain: $1.42 billion). 6 In 2016, China topped the list of the most important investors in Arab countries with $29.5 billion, representing 31.9% of total new investments; the United States came third with $7 billion, the equivalent of 7.6% of new investment flows (ICAC, 2017: 12). Data on the sectorial distribution from Chinese Investment Tracker show that more than 64% of China’s investment and contract stocks in Saudi Arabia are in the transport, utilities, metals (aluminum), alternative energy, industry, agriculture, and construction (including the construction of cement factories) sectors. Finally, investment relations are bidirectional: the Gulf states want to connect with China as a site for the production and consumption of their petrochemicals products. Their total outward investment reached $27 billion between 2003 and 2015 (higher than the GCC countries’ historical US FDI stock of $26 billion 7 ), making China the first destination for Saudi and Kuwaiti overseas investments (ICAC, 2017). Importantly, despite the US’s objections, GCC states joined the China-led Asian Infrastructure Investment Bank with a combined capital contribution of more than $5.1 billion (AIIB, n.d.).
Shanghai’s oil future: The end of exclusive oil invoicing in US dollars
Based on its monopsony power as the largest oil importer, China ended exclusive oil pricing in US dollars in March 2018 upon releasing an RMB-denominated oil futures contract on the Shanghai International Energy Exchange. Among China’s key motivations for the contract release is to gain commodity-pricing power against international market forces, knowing that futures contracts function as reference prices for physical commodity trading (Petry, 2020). The oil dollar benchmark limits China’s price-making capability because it has no say in US monetary policy, which influences global oil prices (Kamel and Wang, 2019). Currently, China has opened five commodity contracts to foreign traders: crude oil, iron ore, natural rubber, bonded copper, and low-sulfur fuel oil.
The contract is an expression of China’s structural power because it provides an effective new framework for oil market players through several distinctive features other than its monetary denomination. First, the contract builds on the RMB-denominated gold future launched in Hong Kong in 2017, thereby ensuring gold convertibility (Mathews and Selden, 2018). Second, the contract is based on medium-sour crude produced mainly in the Gulf region (SIEE, 2020) and exported to Asia; thus, it is better aligned than other international benchmarks with GCC–Asia oil trade patterns. Third, the contract works to fill the gap presented by the lack of a regional oil benchmark in the Asia-Pacific region, which suffers from the expensive Asian premium in international markets (Liao et al., 2018).
The contract received market acceptance, including from two of the biggest oil traders—Glencore PLC and the Trafigura Group—and exceeded the market share of comparable futures (the Oman crude oil future), becoming the third active crude oil future in the world. Within a year, the Shanghai contract’s trading volume achieved a significant share at the expense of the Brent Crude and West Texas Intermediate contracts, reaching 14% of global activity in similar futures or about half the volume of Brent (Hong, 2019). Still, the contract development faces several challenges, including speculative transactions, relatively limited international players’ participation, and inadequate infrastructure for storage and physical delivery (Hyde and Reeves, 2021; McNally, 2020). China partially addressed some of these challenges during the Covid-19 global oil demand shock. It soaked up the massive oversupply of oil, increasing the petroyuan contracts’ liquidity, and the exchange simultaneously doubled storage capacity to more than 48 million barrels in April 2020 (Lewis et al., 2020). This encouraged more established foreign traders, notably British Petroleum and Mercuria, to deliver into the Shanghai contract. To attract more foreign participation, the exchange started to deliver the oil for oversea clients (Zhou and Jaipuriyar, 2020) and launched a crude oil option for better risk management. Consequently, trading activity has substantially expanded. In the first half of 2021, overseas clients have made up 28% of daily open interest, an increase of 6.5% on a year-on-year basis. By 2021, there were 68 registered overseas brokerages (from 23 countries), up from 45 in 2018. The list includes JP Morgan, Goldman Sachs, BNP Paribas, and Société Générale (INE, 2021a; Ping, 2020). The overseas oil delivery destinations were mainly in Asia, in places such as South Korea, India, Singapore, Malaysia, and Japan (INE, 2021b). The contract performance during the Covid-19 crisis demonstrates its potential in Asia as a manifestation of China’s growing structural power.
One recurrent argument on the limited prospects of the petroyuan contract is based on what McNally and Gruin (2017) labeled the “techno-economic” perspective on the currency internationalization conditions. According to them, China lacks financial markets that are: (1) substantially free of controls to ensure currency convertibility; (2) broad, in that they contain a wide array of financial instruments; and (3) deep (i.e., having well-developed secondary markets). Accordingly, due to scarce opportunities for profitable investments, oil producers are not incentivized to invoice oil in RMBs (for a discussion see McNally, 2020).
Although China has not liberalized its financial markets in a neoliberal way (Petry, 2020), being guided by a state-led development strategy, it has been opening its capital account following a hybrid and experimental approach (McNally, 2015). With its targeted liberalization, it maintains state control over the exchange rate, cross-border capital flows, and domestic financial system (Subacchi, 2017). This has generated variegated openings to different financial actors and purposes, such as domestic/foreign, onshore/offshore, and investor/speculator (McNally and Gruin, 2017). It aims to prevent building up excessive financial risks and puts financial activities at the service of the real economy (Petry, 2020).
Practically, five schemes (two onshore and three offshore) exist for overseas actors seeking to invest RMBs into China. The first onshore program, the Qualified Foreign Investor (QFI) scheme, evolved from the Qualified Foreign Institutional Investor scheme and the RMB Qualified Foreign Institutional Investor scheme 2020 merger; the second, the China Interbank Bond Market scheme (CIBM Direct), offers direct access to the bond markets. Two of the offshore schemes combined constitute the Northbound Stock Connect (Shanghai-Hong Kong Stock Connect and Shenzhen-Hong Kong Stock Connect) and Hong Kong-Shanghai Bond Connect and give offshore investors license-free and (at the individual investor level) quota-free access to Chinese assets. The third, the Shanghai-London Stock Connect, offers the possibility for Chinese and UK issuers to list their RMB-denominated stocks on each other’s stock exchanges (BNP Paribas, 2021).
These channels have continued to widen and evolve at an accelerated pace since 2015 and are already adapted to grant access to overseas RMB holders, including oil producers and traders. By 2021, investment quotas and access licenses were abandoned for the QFI, CIBM Direct, and Bond Connect; access conditions were relaxed; and the list of investable products was enlarged (see NAFMII and ICMA, 2021a). For instance, starting from November 2021, commodity futures, commodity options, and stock index options were added as eligible financial derivatives accessible to QFIs, including oil futures and options (CSRC, 2021).
CIBM Direct and CIBM Connect are central channels for overseas RMB holders to access to China’s bond market, which is the world’s second largest and was Asia’s largest by the end of 2017, and where the outstanding volume of bonds-to-loans ratio has increased from 36% to 68% between 2007 and 2020. By June 2021, foreign participants accessing CIBM through the CIBM Direct scheme reached 483. Between its launch in 2017 and December 2021, the number of Bond Connect overseas investors rose from 139 to more than 3233 (covering 35 jurisdictions) from 713 entities, including 78 of the 100 top global asset management institutions (NAFMII and ICMA, 2021a). As a sign of booming activity, the average daily turnover of Bond Connect soared from RMB 2.2 billion in 2017 to RMB 29.3 billion by November 2021. 8 Between 2017 and 2021, the value of RMB bonds held by international investors increased from about RMB 975 billion to more than RMB 3.6 trillion, and the proportion of bonds overseas investors held increased from about 2% to more than 4.2%. 9
The increase in international capital flows is better understood given China’s high-yield and low-risk assets. China’s 10-year government bond yield in June 2021 was 3.1%; the comparable figures for the United States, the UK, Japan, and Germany were 1.57%, 0.93%, 0.08%, and −0.20%, respectively. Chinese bonds’ low correlations with other markets’ bonds also offer a means to diversify portfolio allocations and reduce volatility (Chen, 2021). Indeed, China’s government bonds and its policy bank bonds constitute the absolute majority of foreign holdings, representing 11% and 5.5%, respectively, of their total value in December 2021. 10 Furthermore, international investors are increasingly participating in issuing panda bonds. As of August 2021, 64 overseas issuers had issued RMB 370 billion panda bonds in CIBM. Nonfinancial enterprises, including members of the world’s top 500 companies (e.g., Air Liquide, Daimler, Trafigura and Veolia), constitute 78% of panda bonds’ issuing volume. Overseas investors purchased between 55% and 88% of the panda bonds issued by governments (e.g., Canada, South Korea, Poland, Hungary, the UAE, the Philippines, and Portugal) and international institutions (e.g., the World Bank and Asian Infrastructure Investment Bank) (NAFMII and ICMA, 2021b).
As a signal of international recognition, Chinese bonds have been included in three major global bond indices: Bloomberg Barclays Global-Aggregate (2019), JP Morgan Government Bond Index Emerging Markets (2019), and FTSE World Government Bond Index (2021), where the RMB bond’s proportion accounts for 6.06%, 10%, 10%, respectively, of their total market capitalization (NAFMII and ICMA, 2021a). It is expected that these inclusions will accelerate overseas investment in CIBM.
Growing overseas investment, including by BlackRock, Vanguard Funds, and state-owned institutional investors, means investors are adapting to China’s financial market variety (Petry, 2020) and its geoeconomic power. Thus, China’s structural power is manifested through the creation of a new illiberal framework of interaction between state authorities and financial markets, and also through the provision of channels granting access to overseas RMB holders as a necessary condition to expand oil invoicing in RMB.
Will the GCC states settle oil exports to China in RMB?
Given GCC countries’ weight in the oil market, their willingness to invoice oil in RMBs will be a determinant of the petroyuan’s future evolution. China has already asked some GCC countries to accept RMB payment, but they declined, citing risks to their strategic partnership with the United States as the main reason (Seznec and Dunais, 2021). However, Salameh (2018) argued that Saudi Arabia will compromise by invoicing oil in RMB for oil exported to China and the Asia-Pacific, while continuing to invoice in dollars for exports to the EU and the United States. This issue should be approached from a historical perspective by focusing on structural drivers, including the GCC’s economic interests and its power relations with both China and the United States and the tempo of the US–China strategic conflict.
As previously analyzed, GCC countries are vitally dependent on accessing China’s market and resources. China’s market leverage over GCC countries will be more pronounced if it can diversify its oil import source, and several indicators show that some major suppliers have agreed to use RMBs for their invoicing to China (Briscoe, 2018). In 2010, more than half of a 10-year oil-backed $20.6 billion loan to Venezuela was denominated in RMB; in 2015, Angola, China’s third-largest supplier, began accepting RMBs for oil transactions and made the RMB its second currency (Mathews and Selden, 2018); and in 2015, China started to settle its crude oil imports from Russia in RMBs (Farchy, 2015), with shares of the ruble and the RMB in Russia–China exports and imports increasing from 3% and 6% in 2013 to 18% and 19% in 2017, respectively (Dolgin, 2018). In addition, the US weaponization of the dollar is fueling some oil exporters’ search for alternative payment arrangements. For instance, the day after the US announcement of renewed sanctions against Iran, daily trading volumes in Shanghai crude oil futures more than doubled compared to the previous day (Gloystein and Meng, 2018). Despite those sanctions, reports estimate that close to one million barrels per day of Iranian crude reached China in March 2021; this amounts to about half the Saudi supply (Reuters, 2021).
The GCC’s acceptance of the RMB against oil is not merely a matter of power relations but also a question of structural interests. The structure and weight of the Gulf’s economic relations with China, as its first trade and investment partner, constitute solid grounds and an economic rationale for invoicing oil exports to China in RMB, at least to cover their imports from China, Chinese development contracts in the GCC, and GCC investments in China. In addition, invoicing oil in RMBs would require changing the GCC’s dollar-peg system to a basket-peg system composed of the dollar, euro, and RMB, which is more adapted to the GCC’s patterns of international integration, especially in the context of waning confidence in the US dollar (Seznec and Dunais, 2021). The dollar-peg regime’s major deficiency is the loss of monetary policy independence because business cycles between the center of the exchange regime (the United States) and its periphery (GCC) are unsynchronized, so pegged exchange rates contribute to highly procyclical macroeconomic policies and highly volatile inflation and growth (Looney, 2008; Momani, 2008; Setser, 2007). Indeed, a less constrained monetary policy and more manageable exchange rates are both needed as policy tools in the Gulf to foster economic diversification.
GCC’s QFIs.

i: China Security Regulatory Commission.
UAE and Qatar issuance of RMB debt securities (millions of RMB).

Source: Author’s calculations based on London and Luxembourg exchange markets data.
At the monetary level, Qatar and the UAE signed and renewed currency swap agreements with China worth $5.25 billion each or $21 billion in total (Song and Xia, 2019), and Qatar and the UAE established two RMB clearing centers in 2015 and 2016, respectively, as logistical hubs for RMB internationalization. In 2019, the RMB amount cleared in the UAE reached RMB 53.02 billion, and, starting in September 2019, both the UAE dirhem and Saudi riyal are among the 24 currencies with official direct bilateral currency trading arrangements with the RMB (PBC, 2020).
RMB use has been rising across the entire Gulf region. In 2015, the UAE’s and Qatar’s RMB use accounted for 74% and 60%, respectively, of all payments by value to China and Hong Kong (SWIFT, 2016a). By August 2016, over 80% of the direct payments between the UAE and China/Hong Kong (payments sent and received by value) were in RMB. In 2016, Kuwait’s RMB use rate in direct payments with China and Hong Kong exceeded 10% (SWIFT, 2016b).
Beyond general institutional channels to access China’s market, specific pipelines between the mainland and GCC countries may be needed to accommodate the huge RMB holdings resulting from possible invoicing of oil in RMB. There are some indications that such a development may be on the horizon, especially in the UAE, which seems to be positioning itself as a regional RMB hub (SWIFT, 2016b). Abu Dhabi Global Market, the emirate’s international financial center, has agreed in principle with the Shanghai Stock Exchange to cooperate in establishing the One Belt One Road exchange market, focusing on China’s foreign trade and investment, and supporting the internationalization of the RMB in the region (Meredith, 2018). In turn, Chinese financial institutions have recognized the Dubai International Financial Center, including the four largest state policy banks involved in RMB internationalization, as a central node in the BRI according to the center’s CEO (Amiri, 2018). By 2015, Chinese banks had doubled their balance sheets compared to mid-2014 (DIFC 2016), and by 2018, they made up nearly a quarter of the total assets in the Dubai International Financial Center (Bridge, 2018). Significantly, the Dubai Exchange has listed the first offshore RMB-denominated gold futures based on the Shanghai Gold Exchange benchmark in addition to the USD-RMB futures contract. In a sign of an advanced cooperation level for developing alternative payment arrangements, the UAE Central Bank is participating with its counterparts from China, Thailand, and Hong Kong in developing a multi-arrangement cross-border payment system based on each central bank’s digital currencies. The experimentation is at an advanced stage, and the system technically performs at a higher level than the current payment infrastructure dominated by the United States (BIS, 2021).
Conclusion
The global and regional reorientation of trade and capital flows has reduced the effectiveness of petrodollar arrangements. China has already displaced the United States as the main destination for the recycling of the GCC countries’ oil receipts through the trade channel. The US dollar’s monopoly over oil invoicing was broken as China successfully released the petroyuan contract. Furthermore, the proportion of oil invoiced in RMB could be expanded. China’s use of its geoeconomic foundations in its multilevel institutional engineering at home and abroad is resulting in a growing structural power that could transform global oil-related monetary and financial arrangements.
First, China–GCC economic relations provide Beijing with a powerful means of geoeconomic leverage. But, more importantly, the concrete structure and the relative weight of trade and investment relations between the two sides constitute the material foundations and satisfy mutual interests to invoice bilateral oil trade in RMB.
Second, China’s moves in both the global oil market and the financial arena are establishing new institutional arrangements that pave the way for the petroyuan’s further growth.
Based on its purchasing power and in line with its endeavor to ensure greater monetary autonomy, China has launched the RMB-denominated oil contract. It effectively provides oil market players with a new and needed choice because: (1) its grade specification better fits oil trade patterns between GCC and Asian Pacific countries than other global benchmarks; (2) it fills a gap in the missing East Asian oil benchmark, which suffers from the expensive so-called Asia premium; and (3) it offers RMB–gold convertibility. The petroyuan contract is an instrument among others to trade oil in RMBs (e.g., using interstate agreements) and is a part of China’s experimental and multilayered RMB internationalization approach.
At the financial level, targeted capital account opening has widened the concrete channels for RMB flows into and out of China’s financial centers. As a result, overseas investments, including by first-tier global financial institutions, have increased in relatively high-yield and low-risk RMB-denominated asset investment. This attests to the presence of profitable opportunities from investing RMBs earned from the oil trade. The GCC seems highly receptive to China’s new financial framework, and some, especially the UAE, not only participate in different RMB internationalization channels but also promote their jurisdictions to join the institutional RMB internationalization network.
Still, China’s structural power is not the sole determinant of oil invoicing in RMB. The US’s geoeconomic and structural power is, for now, more significant than China’s power in the global monetary sphere. Certainly, the United States’ monetary power counts for much, but it is not omnipotent. The overuse of US monetary power may simply backfire and accelerate the reshaping of the monetary system, because the global balance of power has effectively changed (Brzezinski, 2009), and it is increasingly providing alternative options and thus objectively permitting other states to seek more autonomy. Indeed, one determinant of the fate of the US international economic and political stance is its adaptability to new global realities. Seznec and Dunais (2021) argued that the United States has restricted choices to counter a GCC move to price oil in RMBs because any penalties imposed on it would bring it closer to China, and any freeze of the Gulf-held US Treasury bonds would set an unacceptable precedent that would undermine confidence in the US economy. Indeed, the euro is the best example of the contestability of US monetary power even by the United States’ fundamental allies, and invoicing oil in RMBs would simply mark a second historical phase in the decline of the US dollar.
Another determinant factor of GCC countries’ invoicing oil in RMBs is the dynamic of their strategic relations with the United States. These relations certainly count, but the question is: to what extent? And is it an impeding or aborting factor in the mid to long run? While the answers intertwine with other factors, and this need further investigation, this article shows that US–GCC relations have not blocked GCC countries from actively cooperating with China on RMB internationalization. Thus, instead of statically approaching the effects of political alignments on oil-invoicing currencies, some GCC countries’ involvement in the currency internationalization of a “systemic rival” to the US invites further inquiry into the acutely important question of how political alliances transform during a seeming transition to a pluripolar world.
To conclude, whether the GCC members will effectively invoice oil in RMBs or what the timing might be for such a move remains open to historical contingency. However, the trends analyzed in this article support Beijing’s ambition to invoice oil in RMB.
Footnotes
Acknowledgements
The author acknowledges reviewers for valuable inputs.
Declaration of conflicting interests
The author(s) declared no potential conflicts of interest with respect to the research, authorship, and/or publication of this article.
Funding
The author(s) received no financial support for the research, authorship, and/or publication of this article.
