



Abstract
The article presents a constructive critique of the ‘financialization of the firm’ hypothesis. Without calling into question the idea that financialization has been a major structural change over the last four decades, it argues that the financialization of the firm argument has been pushed too far, especially regarding its ‘crowding-out’ and ‘drain’ effects on investment. Instead, the capacity of finance to accelerate the process of ‘creative destruction’ through the reallocation of capital has not been sufficiently taken into consideration. Consequently, the corporate financialization approaches tend to underestimate other structural changes in business organization, like the associated rise of Global Value Chains (GVCs) and intangible investments, both conceptualized by the ‘smiling curve’ notion. These secular changes challenge the categories of investment and capital we inherited from industrial capitalism. It remains, however, that we do not know how to measure intangible investment.
Keywords
Introduction
The political economy of financialization constitutes a very rich domain that extends to most of the social sciences (Mader et al., 2020). The present article focuses on a specific topic, the financialization of the firm and its impact on investment and business organization, also known as ‘the financialization-investment nexus’.
Before the advent of financialization approaches, most political economists followed Galbraith and/or Chandler’s analysis of firm in managerial capitalism (e.g. Eichner, 1976; Lavoie, 1992; Lazonick, 1993). Financialization theorists argued that the model of the managerial firm was outmoded by the rise of finance-led capitalism (e.g. Lazonick and O'Sullivan, 2000; Stockhammer, 2004; Crotty, 2005; Orhangazi, 2008). The obsolescence of the firm organization proper to managerial capitalism can hardly be refuted. Instead, the question is what kind of firm dominated in post-1980s capitalism. The strong argument, criticized in this paper, claims that the financialization of non-financial corporations (hereafter NFCs) is the main cause behind the downtrend in investment and accumulation rates observed in most advanced economies over the past three or four decades (Stockhammer, 2004, 2005/6; Orhangazi, 2008; Davis, 2017, 2018; Tori and Onaran, 2020).
Not all political economists agree with this strong version of financialization. For example, Dallery (2009), after modeling different possible scenarios within the post-Keynesian theory of the firm, argued that it is possible to maintain accumulation rates if the managers transfer shareholder pressure to workers, or manage the firm more tightly (albeit riskily). Lavoie (2014, pp. 128-147) presented a more general treatment of this issue in the context of post-Keynesian theory. Fiebiger (2016) challenged the financialization of the firm thesis by showing that the statistics on financial assets were inflated by the inclusion of US Direct Investment Abroad (USDIA), ‘goodwill’ and ‘other intangible assets’ (patents, trademarks, copyrights, etc).
At the same time, Milberg and Winkler (2013) provided a sophisticated version of financialization. They argued that offshoring created an important source of ‘dynamic efficiency gains’ from international trade. Still, in finance-led capitalism, an important part of the profits created by offshoring has been seized by financial rents at the expense of productive investment (ch. 6). Finally, Orhangazi (2019: 1277) added another explanation for the puzzle of decreasing investment trend: thanks to intangible assets figuring on the balance sheet, ‘firms would be able to increase their profits without necessarily making a corresponding increase in investment in fixed capital’.
Considering the debate in its current state, the present article makes three points. The first point seeks to go further down the road opened by Fiebiger’s (2016) facing off the financialization of the firm hypothesis against the existing empirical evidence. Given that the U.S. remains one of the most financialized economies, and an important part of financialization studies uses the U.S. as an example, this article focuses on US NFCs. The discussion on new empirical evidence reveals two ‘real economy’ explanations for the slowdown of accumulation in the U.S.: the globalization of production, and above all the rise of intangible investments like R&D.
The second point concerns how the above underestimation of contemporary business organization is paired with a problematic conception of finance. The idea that financialization is simply a parasitic regime loses sight of the functional (albeit dangerous) role of financial speculation during capitalist crises. Finance’s primary function in such transitional phases is to speed up the reallocation of capital to new sectors and spaces.
The third and most important point sheds light on the breakthroughs in business organization that are obfuscated by the notion of financialization of the firm. In this context, the analysis firstly focuses on Global Value Chains (GVCs) as a radically new division of labor leading to new sources of efficiency gains, power, and wealth. The final outcome of this secular change, exemplified by the notion of ‘smiling curve’, is the subsumption of production stricto sensu under the intangible and service-based functions of dominating firms. This also implies that intangible investments have become the principal value creators in modern business (e.g. WIPO, 2019; Haskel and Westlake, 2018; Lev, 2019).
In the end, the concluding remarks point to the need to update the notions of investment and capital we inherited from industrial capitalism.
Financialization of the firm and investment: From theory to empirics
Synthesizing the literature thus far, financialization of the firm can be seen through three different theoretical frameworks. The first framework is based on the critique of the Maximizing Shareholder Value (hereafter MSV) imperative. According to Lazonick and O’Sullivan (2000), the domination of the MSV – first in academic and then in political cycles – led to the shift from the managerial firm based on the principle of ‘retain and invest [profits]’ to the contemporary finance-led corporations guided by the principle of ‘downsize [the firm] and distribute [the profits to the shareholders]’.
The second theoretical framework (Crotty, 2005) analyzes financialization as a part of a more comprehensive change in modern capitalism, that is, ‘neoliberal globalization’. The focus is on the rise of the ‘financial or portfolio conception of the NFC’ and therefore the domination of the NFC by the short-termist logic proper to financial markets, and more specifically to modern ‘impatient’ finance.
Finally, a third theoretical framework relates the financialization of the firm to the structural limits to accumulation in monopoly capitalism and US hegemony. Combining the main ideas put forward by Magdoff and Sweezy (1987) and Arrighi (1994), Krippner (2005: 181) defines ‘financialization as a pattern of accumulation in which profit-making occurs increasingly through financial channels rather than through trade and commodity production’.
It is worth noting that only in Krippner’s account there is a direct link between the financialization of NFC and the slowdown of accumulation. Neither Crotty (2005) nor Lazonick and O’Sullivan (2000) refer, at least not explicitly, to a similar relationship. 1 The econometric estimation of financialization’s impact on investment was pioneered by Stockhammer (2004, 2005-6), and then by Orhangazi (2008) who used firm-level data for the US NFCs. Following Orhangazi (2008), the literature that came after usually distinguishes between two channels through which the financialization of the firm impacts on investment.
The first channel implies that NFCs cut real investment in favor of financial placements from which they draw higher profits. This corresponds to a crowding-out effect. The second channel presumes that the rise of shareholder power triggers an important increase in NFC financial payouts – mainly dividends and share buybacks – which results in a decrease in internal funds and subsequently lower investment rates. Therefore, we witness a drain effect on productive investment. Note that a third effect can be produced when investments in innovation like R&D fall victims to the portfolio conception of the NFC, which considerably shortens the planning horizon of firms (Lee et al., 2020).
Only Krippner’s account corresponds explicitly to the crowding-out effect. The MSV and short-termism approaches favor the drain effect, but they usually also accommodate the crowding-out effect. For example, in Stockhammer (2004: 133), the MSV implies that ‘managers and consequently non-financial businesses identify increasingly as rentiers and consequently will also behave as such. We would expect higher dividend payout, lower growth and more financial investment of non-financial businesses’.
The idea of a crowding-out effect has been already challenged by Fiebiger (2016), and then by Rabinovich (2019). Fiebiger (2016) showed that NFCs’ financial assets are artificially inflated – in the Federal Reserve’s Financial Accounts of the United States – by the inclusion of ‘US Direct Investment Abroad’ (USDIA), ‘goodwill’, and ‘other intangible assets’ (patents, trademarks, copyrights, …). Rabinovich (2019: 748-9), who used the Compustat database, remarked that ‘the most prominent change in the asset structure of NFCs is the increase of intangibles (“goodwill” + “other intangibles”) which, starting from less than 0,5% in 1961 reaches around 25% in 2015’. Practically speaking, this means that the decrease in the percentage of tangible assets (net property, plant and equipment) is counterbalanced by the rise of intangibles. 2 Therefore, there is a crowding-out effect in NFCs balance sheets, but it concerns the relationship between tangible and intangible assets.
Regarding the drain effect, there is little doubt about the surge of NFC financial payouts (dividends plus equity buybacks) during the financialization era. Besides, in the 2000s, buybacks became the most important component of financial payouts. The real question is to what extent is the increase in total net financial payouts responsible for the decline in productive investment?
Calculating net equity buybacks is far from evident. 3 But the major concern is that the negative impact of rising financial payouts on the internal financing of investment is also contingent on the cost of fixed capital and labor, as well as net taxes and interests. At least over the last three decades, the evolution of most of the other variables ran contrary to profit squeezing via financial payouts. Thanks to ‘neoliberal globalization’ (Crotty, 2005), labor costs and corporate taxes dropped substantially. Certainly, financialization is an important part of the neoliberal puzzle, but it does not constitute the puzzle in its entirety. Moreover, after the monetarist shock of the 1980s, the monetary policy managed to combine its anti-cyclical interventions with low real interests in the long run.
Figure 1 illustrates the above arguments by representing the evolution of wages and salaries, net interests, and total financial payouts as percentages of Gross Value Added (GVA), from 1960 to 2020. It is clear that financial payouts have thrived at the expense of the labor and the (welfare) state. Therefore, financialization contributed – along with other causes like anti-labor and anti-state policies and the globalization of production – to the rise of inequalities and the decline of wage share (Kohler et al., 2019; Guschanski and Onaran, 2022), but did not really squeeze available funds for investment. To put it in another way, had all the other GVA components remained stable, the increase of net financial payouts would have negatively impacted investment. But that is not what happened. Selected components of Gross Value Added (in %), US NFCs, 1960–2020. Source: Federal Reserve, Z1. Financial Accounts of the US, https://fred.stlouisfed.org/.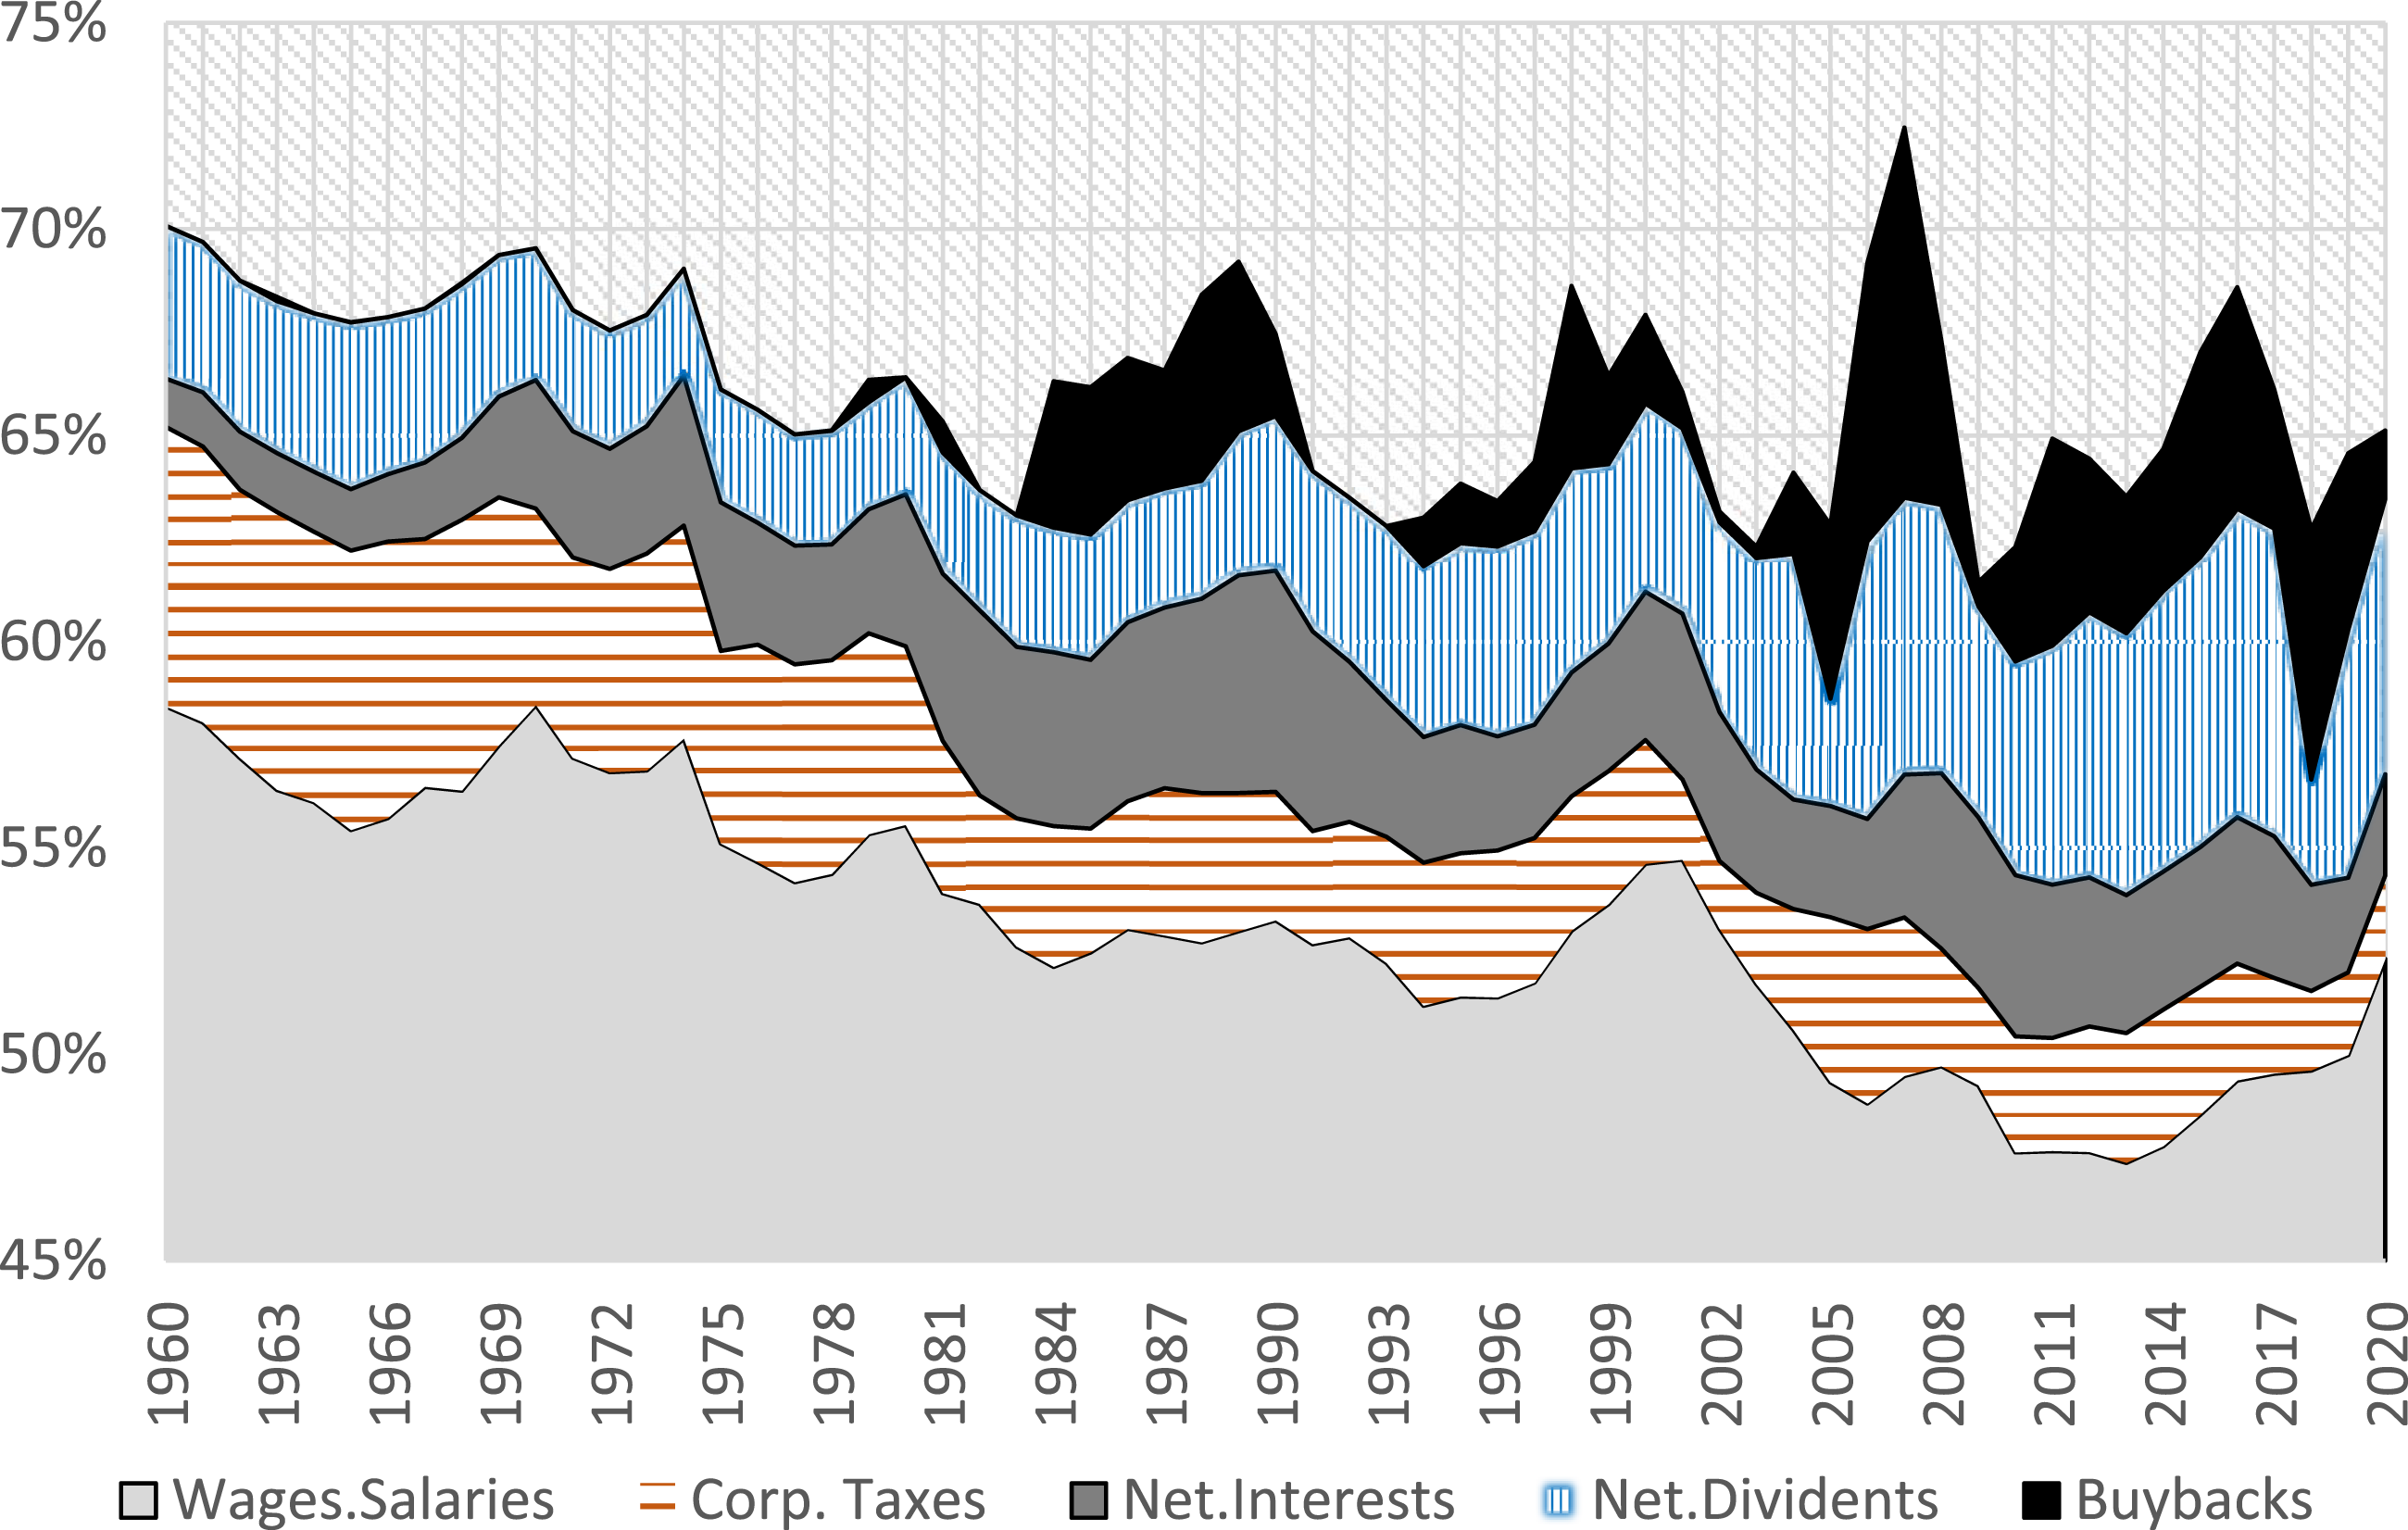
More finely tooled studies obtain similar results. For example, Kahle and Stulz (2021) in the paper entitled ‘Why Are Corporate Payouts So High in the 2000s?’ compare the evolution of capital expenditures of US-listed industrial firms from 1971–1999 to 2000–2019. Regarding the financial payouts, they distinguish between three groups for each period: the nonpayers, the payers and the top-200 payers (accounting for 82 and 87% of aggregate payouts in the first and second period, respectively). They found that ‘the drop in capital expenditures occurs equally for top payers and other payers, as well as for payers and nonpayers’ (1369). Consequently, increasing payouts can hardly be considered the cause for decreasing investment expenses.
Moreover, two hot issues in corporate finance and financial macroeconomics over the last two decades – the corporate saving glut and the cash hoarding paradox – point in the opposite direction of the drain effect. 4 Interestingly enough, a part of the literature on the causes of the cash hoarding paradox (e.g. Bates et al., 2009; Falato et al., 2013) emphasizes the rise of new business models characterized by increased volatility (due to globalization), and the need to finance intangible investments like R&D.
Finally, the question of short-termism’s impact on the quality of innovation (e.g. Lee et al., 2020) merits special scrutiny. By the end of the 1970s, NFCs began to downsize their laboratories and concentrate their efforts on product development and commercialization of inventions produced by universities, and start-ups. Thus, Arora et al. (2018: 3) summed up the new system in the following terms: ‘large firms still value the golden eggs of science (as reflected in patents), but seem to be increasingly unwilling to invest in the golden goose itself (the internal scientific capabilities)’.
Short-termism, however, is one explanation among others. As further explained in Arora et al. (2020), firms were constrained by global competition to narrow their scope and this reduced the likelihood of exploiting their own inventions. At the same time, the interval between invention and commercialization ‘narrowed’, implying that any important invention is rapidly adopted by a swarm of imitators/rivals (Arora et al., 2020: 72,73). Consequently, the danger of spin outs to rivals rose substantially. In such an environment, it does not come as a surprise that corporations have gotten specialized in product development and commercialization.
In any case, the empirical evidence of the negative impact of financialization on innovation seems to be exaggerated. First, the decrease in publications does not concern the two most important ‘General Purpose Technologies’ in contemporary capitalism, biotechnology (Arora et al., 2020: 70-72) and Artificial Intelligence (AI) (Hartman and Henkel, 2020; Jacobides et al., 2021).
Second, the data provided by the NSF (National Science Foundation) paint a more nuanced picture regarding research in the business sector as a whole. Figure 2 compares the evolution of business effort in research – the basic and applied research funded by business (Res.Bus) – as a percentage of three denominators. The right axis of Figure 2 (bars) presents the evolution of research funded by business, divided by the Net Operating Surplus of private enterprises (NOS). We observe that the business research effort rises steeply during the period 1980–1991 and that despite its relative decline after 1991 it remains substantially higher than in the golden era of corporate labs (the 1960s and 1970s). Note also that the evolution remains the same for alternative denominators ranging from GDP to NFC after-tax profits. Business-Funded Research as percentage of selected indicators, 1953-2020. Sources: NSF, Tables 2-4 for business R&D components, and Federal Reserve, Z1. Financial Accounts of the US for the Net Operating Surplus of private firms. Note: Res.Bus = Business-Funded Research, NOS = Net Operating Surplus (in the right axis), Res.Tot = Total Research Expenditures, and RD.Bus.Fund = Business-Funded R&D.
Moving to the left axis of Figure 2 (lines), we observe that a similar evolution (the dashed line) can be depicted regarding the evolution of the research funded by business as a percentage of total research expenditures in the US (Res.Tot). In short, the above two indicators regarding business effort in research do not support the hypothesis of a dramatic decline from 1980 onwards. Especially, during the first period of financialization (1980–2000) the opposite is true.
The picture is very different when (in the solid line) we examine the evolution of the business-funded research divided by the totality of business-funded R&D. The share of research in R&D increases from 26% in 1980 to 36% in 1987, and then it declines steadily to 20.5% in 2009. After 2009 it plateaus at around 22.5%. In fact, this evolution fits well with the story of the corporate science downsizing since the mid-1980s. However, it suffices that Development expenses increase at a faster rate than Research expenditures for the research share in R&D to drop. Furthermore, as already stressed by Mowery (2009: 15), the major decline in the share of research in R&D took place between 1958 and 1973, that is, before the downsizing of corporate research laboratories.
Certainly, there is much to dislike in the new division of innovative labor: mainly, the perversion of academic ethos by the commercialization imperative (Mirowski, 2011), and the negative consequences of the IPRs for the economy and society (Pagano, 2014). It seems, however, that the major flaw of the contemporary innovation system resides less in the organization of the private sector than in the demise of public sector. According to the NSF data, the federally funded R&D represented 1.86% of GDP in 1964 against 0.62% in 2018. Instead, the business funded R&D rose from 0.86% of GDP in 1964 to 1.96% in 2018. Therefore, the big and dangerous downsizing of US innovation efforts issued from the withdrawal of the state. 5 Obviously, this important debate expands far beyond corporate financialization.
From empirical to theoretical puzzles: The question of (im)patient capital
A second strand of empirical literature, coming from mainstream financial economists, seems more conclusive about the negative impact of short-termism on corporate innovation. These fine econometric studies pointed to the negative ‘real’ consequences either of the quarterly published Earnings Per Share (Almeida et al., 2016), or of top management vesting equity (Edmans et al., 2022). Almeida et al. (2016) used a regression discontinuity design to study the reaction of firms that just missed their Earnings Per Share (EPS) target. They found these firms were more prone to proceed to share buybacks and to finance them through reductions in cash holdings, tangible investment, R&D and employment.
However, a more careful study of the paper reveals that things are more complex than commonly presumed. First, firms marginally manipulating the EPS through shares buybacks seem quite ‘judicious’. The manipulating game is a luxury that only financially unconstrained firms can offer themselves, and in general without relying on external financing. Second, and more importantly, financial markets react more rationally than expected because they take into consideration how firms finance their stock buybacks. Thus, firms cutting R&D spending and cutting down on employment are not rewarded for managing to change the sign of EPS surprise.
The last remarks bring us to a more general concern about the functioning of financial markets. There is a general tendency to mistake the static analysis advanced by the proponents of the MSV narrative for the reality of financial markets. Political economists who overemphasize Keynes’ or Ricardo’s analysis on rentiership align with this same tendency. Paradoxically enough, their speculators’ conception is more akin to mainstream economics than to Keynes’ thought on uncertainty, long-term expectations, and conventions. In reality, financial gamblers are shrewder than presupposed by financialization theorists; or, at least, they are not so careless as to blindly penalize all firms presenting low profits, or even losses. In the specific case of start-ups having the potential to pursue winner-take-all strategies, patient capitalists (private funds, venture capitalists, angel investors, and so on) are willing to incur losses for many years in anticipation of making high profits in the future. 6 But the same applies to all firms which according to speculator’s conventional wisdom are expected to generate big profits in the future.
To be sure, the impatient capital effect is still applicable. Yet, roughly speaking, this mainly concerns the firms that (are supposed to) belong to the ‘old economy’. For instance, financial markets are impatient with NFCs like General Motors and Ford, but not with Tesla, nor with the ‘Big Tech’ firms. In fact, Google, Apple, Facebook, Amazon, and Microsoft (GAFAM) represent for US capitalism today what Ford and General Motors stood for in the heyday of the ‘Fordist’ era (1945–1980). Significantly enough, GAFAM, and the smaller firms operating in their ‘ecosystem’, invest little in physical capital but heavily in intangible assets instead.
The rise of a new type of capitalism also points to the difficulty in performing a cost–benefit analysis of finance in transition periods. If the costs can be roughly computed – and they are certainly high enough! (Epstein, 2018) – the ‘benefits’ (for the capitalist system) defy any kind of objective measure. To make a long story short, financial capital plays a critical role in capitalism’s capacity to overcome its accumulation crises. In transition periods, the ultimate function of finance is not funding the ‘economy’ (in general) but re-allocating the capital and thus accelerating what Schumpeter called ‘creative destruction’ (Perez, 2003). As we also know from US history (e.g. the ‘Gilded Age’, and the ‘Roaring Twenties’), these periods of ‘mad money’, ‘frenzy-crazy finance’, ‘irrational exuberance’, ‘casino economy’ and so on, imply not only very high costs for the majority of society but also substantial hazards regarding the stability of the whole economic system. It seems, however, that American capitalism survived this perilous leap. Therefore, the major question today is why GAFAM headquarters are located in the U.S., (namely, on the West Coast), and not in the EU, UK, or Japan (Kenney and Zysman, 2020). Rahman and Thelen (2019: 181) point to three major reasons including the political, legal and financial specificities of the U.S.; the latter cause implying that ‘the heavily financialized US political economy is able to provide the abundant sums of patient capital that platform firms require to grow to scale’.
The above remarks also imply that it is impossible to proceed to an a-historical cost–benefit analysis of finance. Today, financialization – as we know it – tends to become counter-productive for capitalism. Perhaps it is no coincidence then that, over the last 5 years, more and more articles attacking short-termism have appeared in prestigious mainstream journals; or that CEOs, economic advisors, politicians and journalists have suddenly discovered the economic and social inefficiency of short-termism.
But the most important proof that we are indeed witnessing the beginning of the end of frenzy financialization comes from the evolution of finance itself after 2008, and in particular from the impressive rise of index funds, the so-called ‘Big Three’: Vanguard, BlackRock and State Street (Fichtner and Heemskerk, 2020). In a nutshell, index funds rather than promising to ‘beat’ the market, they mimic the evolution of an Index – say the S&P 500 – by investing proportionally in all of its companies. The expansion of passive and thus low-cost strategies – which do not seek to pick winners among individual firms – raises radically new questions about future corporate governance and financial stability (Braun, 2020; Durand 2022).
In conclusion, if we move from the empirical anomalies presented up to now towards the theoretical kernel of financialization of the firm approaches, the latter’s major drawback consists in assuming that we have witnessed four decades of destruction without creation. Practically speaking, this is a Schumpeterian manner of rephrasing the ‘investment-profit puzzle’ stressed ab initio by Stockhammer (2005/6: 197): ‘How can high profits be realized in the face of low investment expenditures?’ Or, given that ‘tomorrow’s profitability depends on today’s accumulation’ (Dallery, 2009: 501), how is it possible that capitalism has survived four decades of financialization? The critical examination of empirical evidence revealed two sources of creation, which are underestimated by the financialization of the firm accounts: the globalization of production and the rise of different kinds of intangible investments. The rest of the article focuses on the above structural changes.
From Adam Smith’s pin factory to global value chains and smiling curve economics
Global Value Chains (hereafter GVCs) constitute the first form of creative destruction explaining the tendency of US NFCs to underinvest. By organizing their production networks on a global scale, US NFCs economize considerably on their tangible capital expenditures. Therefore, investment that is lost for the U.S. is garnered in other regions like East Asia. The inner workings of GVCs have been common currency for political economists over the last decades (Ponte et al., 2019). 7 What follows focuses on their critical importance for the future of capitalist business organization.
A dynamic view of offshoring
It is hardly debatable that the firms’ initial or short-run reaction to the ‘destructive market product competition’ (Crotty, 2005) and financialization’s pressure (Lazonick, 2014) was a costs-slashing strategy based on offshoring. Yet, even if we limit the scope of this discussion to costs reduction, the latter can lead to more investment and growth at both the firm-level and the economy-level if we adopt the classical political economy’s ‘dynamic point of view’. Thus, Milberg and Winkler (2013: 148-156) oppose the static comparative advantage analysis of international trade – which neoclassical economists attributed to Ricardo – against the latter’s dynamic conception of trade liberalization leading, through food price reduction, to increased profits, investment, productivity, and growth. As Milberg and Winkler insist, we can find similar dynamic conceptions of international trade in authors like Marx and Mill. Generally speaking, cost reductions in any input used in the production process – directly or indirectly (e.g. commodities consumed by workers) – counterbalance the tendency of the rate of profit to fall in Marx and the stationary state tendency in Mill.
It remains that the classical political economy scenario, presupposes that – thanks to competition – profits are totally reinvested in production, instead of being redirected to rents and/or luxury consumption. In this sense, offshoring far from contradicting financialization approaches, offers a plausible explanation for their paradox of continuously renewed profits – and, therefore, high financial payouts – through less investment (see also Auvray and Rabinovich, 2019).
Pushing Milberg and Winkler’s dynamic analysis further, the rest of this section focuses on the efficiency gains stemming from the global organization of production (GVCs) instead of the international trade and offshoring. 8 The main argument of this production-based perspective is that GVCs represent a radically new division of labor challenging industrial capitalism’s fundamentals in business organization. 9
GVCs: Revisiting Adam Smith’s division of labor and Alfred Chandler’s economies of speed
Roughly speaking, over the last two centuries, efficiency gains within the capitalist firm were obtained through two main mechanisms. The first was prophetically announced in Adam Smith’s example of the pin factory. In the beginning of his ‘Wealth of Nations’, Smith maintained that dividing the production process of a pin in separate tasks (operations), performed by corresponding workers, generates a tremendous increase in labor productivity. Taylor’s scientific organization of work, and then Ford’s assembly line further extended the Smithian division of labor to its limits. Since the late 1960s, advanced economies have realized that they can no longer obtain efficiency gains from any further deskilling of human work. Therefore, they have tried to augment labor productivity mainly through the adoption of Japanese methods of management (e.g. lean or just-in-time manufacturing), and/or robotization.
The second mechanism, analyzed mainly by Alfred Chandler (1977), generated efficiency gains at the level of indirect labor thanks to the realization of ‘economies of scale and scope’, or better yet ‘economies of speed’, stemming from the vertical and horizontal integration achieved by the multidivisional firm. This new business organization presupposed the entrepreneurial exploitation of new communication and transport technologies (telegraph, telephone, train). However, as evidenced by the difficulties Western firms experienced in competing with Japanese ones in the 1980s, the coordination feats realized by the vertically and horizontally integrated firm have become superfluous in the new environment of turbulent global markets.
At the same time, as is usually mentioned in the relevant literature (e.g. Baldwin, 2012), ICTs enabled the vertical disintegration, or in other terms the downsizing, of big corporations along with the progressive creation of GVCs. The latter assure not only flexibility in a rapidly changing environment, but they also curb labor’s resistance to change – mainly regarding wages and work conditions. The introduction of different forms of effective and potential competition in the ex-vertically integrated firm is based upon a new form of separation between ownership and control. The objective is to achieve the maximum possible control with the minimal possible ownership.
Beyond the need for flexibility in an environment characterized by fast change and consequently higher degrees of radical uncertainty, there are also cognitive reasons for narrowing the focus of the firm. As observed by Contractor et al. (2010, p. 1418): with the growing complexity of products and services, even the largest companies no longer have all the diverse components of knowledge within their own organization, or personnel, to be competitive in research, production, and marketing.
The final outcome is that the different stages of value chain that were integrated in the typical Fordist firm are now being performed by different enterprises spread across the globe. For example, the assemblage of a smartphone realized by a South-East Asian firm on behalf of a US firm like Apple requires some hundreds of individual components provided by an extended network of suppliers and sub-suppliers. And even more important processes of vertical division of labor can be found within the production of equipment required for manufacturing semiconductors. The Netherlands-based company of ASLM, specialized in the more advanced technology of Extreme Ultra-Violet (EUV) lithography, combines ‘about 100,000 parts provided by over 5,000 suppliers spread across the globe’ (BCG & SIA, 2021: p. 29). In brief, the division of labor within GVCs is like revisiting Smith’s pin factory and substituting the word ‘firm’ for the word ‘worker’.
Of course, like in the case of the pin factory fable, behind the efficiency gains that could be reaped by the new division of labor lurk ruthless power dynamics (Davis et al., 2018; Schwartz, 2022), and violations of human rights. Yet, presuming that the whole story is only about power is not very convincing. In order for the leading firm to capture the maximum of value produced, the new division of labor must first be able to create sufficient value. Furthermore, at least for technology firms like Apple, cheap labor is not the principal reason for offshoring the manufacturing of its products. According to Apple’s CEO, Tim Cook, the main reasons concern ‘speed’ and ‘flexibility’: In part, Asia was attractive because the semiskilled workers there were cheaper. But that wasn’t driving Apple. For technology companies, the cost of labor is minimal compared with the expense of buying parts and managing supply chains that bring together components and services from hundreds of companies. For Mr. Cook, the focus on Asia “came down to two things” … Factories in Asia “can scale up and down faster” and “Asian supply chains have surpassed what’s in the U.S.” (Duhigg and Bradster, 2012).
Of course, it is well known that the speed-flexibility nexus is not achieved simply by taking full advantage of ICTs, but also through harsh, even inhumane, working conditions. In any case, speed and flexibility redefine the Chandlerian economies of scale and scope. Thus, companies like Foxconn assemble an important array of consumer electronics on behalf of the biggest firms of the sector (scope), and are able to scale up faster than any Western company: Apple’s executives had estimated that about 8,700 industrial engineers were needed to oversee and guide 200,000 assembly-line workers eventually involved in manufacturing iPhones. The company’s analysts had forecast it would take as long as nine months to find that many qualified engineers in the United States. In China, it took 15 days (ibid.).
In sum, the most general ideas regarding the importance of the division of labor (Smith) and the economies of speed (Chandler) still pertain, but with a radically new content.
The smiling curve: Relocating the dominant source of value added
The most visible effect of GVCs on industrial capitalism has been popularized through the ‘smiling curve’ concept, launched at the beginning of the 1990s by Stan Shih, the founder of Acer computers (e.g. Baldwin, 2012). If we separate the whole value chain into roughly three stages, that is, pre-fabrication (product concept, R&D, design), fabrication, and post-fabrication (sales, marketing, and after
Some limits to the smiling curve concept have already been mentioned. For example, the separation between the three stages does not take into consideration the strategy of leading firms that are fine slicing the high-value company functions, like R&D, and are likewise offshoring the less important segments to lower-cost locations (Mudambi, 2008; Contractor et al., 2010). However, the aforementioned limits do not contradict the big picture conveyed by the smiling curve notion. In fact, the proliferation of manufacturers without manufacturing units – ranging from Nike and Coca Cola to Apple and Cisco – perfectly exemplifies the tendencies anticipated by the smiling curve. More generally, the importance of the ‘fabless’ firms in the US economy is indicative of the dominated position of industrial capitalism in 21st century.
Hoping that this secular change could be reversed if we could somehow manage to get deregulated finance under control seems unrealistic. However successful the efforts were to rein in finance that had gone rogue, tangible investment and manufacturing employment could hardly make a comeback in the US or in other advanced economies. In the foreseeable future, Foxconn or other Asian companies will continue to make smartphones for Apple, and Apple will continue trying to maintain control over the higher value-added segments of the smartphone smiling curve. This seems to be the tendency of high-tech sectors like the semiconductor industry, where China’s ascent happens in tandem with the fall of the US and the EU: The US’s share of global semiconductor manufacturing capacity fell from 37% in 1990 to just 12% last year, while Europe saw a 35 percentage point decline in the period, to 9%. China’s mainland expanded its share from almost nothing to 15%, a figure that is expected to rise to 24% in the next decade (Irwin-Hunt, 2021).
Therefore, if we cast aside the perspective of ‘methodological nationalism’, there is no longer any mystery surrounding the investment slowdown tendencies exhibited in the US and the EU.
Given the important economies of scale, scope, and speed that the globalization of production yields, the only hope for the ‘re-industrialization’ of advanced economies presupposes a new gale of creative destruction known as ‘reshoring’. How realistic is the reshoring scenario (backed by near-shoring?), and for which sub-sectors (Butollo, 2021) is an area beyond the purview of the present article. It must be clear however that the realization of digital revolution, implied by the reshoring scenario, would further enhance the redistribution of value implied by the smiling curve: it would transform material production into an appendix of digital circulation and associated service/intangible activities.
Intangible investments: ‘Le Tiers État’ of 21st-century capitalism
If GVCs explain why US NFCs invest less now than in the past, especially within the U.S., intangible investments suggest that NFCs invest much more than we think, or we measure in our official statistics and accounting systems.
Intangible investment at the firm level can be studied from two different perspectives: the intangibles recorded as assets on the balance sheet (see The Financialization of the firm and investment: From theory to empirics), and the intangible investments commingled as immediate expenditures in the income statement (R&D, branding, organizational investments, ….). These two perspectives correspond to diametrically opposed visions of the firm. The balance sheet
Both perspectives are intimately related to the previous discussion regarding the smiling curve. Draconian laws for protecting Intellectual Property Rights are the sine qua non condition for the development of GVCs. And heavy investments in intangibles like R&D, design, big data, brands, and training go together with the shift of the locus of value creation from production stricto sensu to the pre- and post-production stages. There already exists very important political economy scholarship dealing with the socio-economic consequences of the new enclosures imposed by the tightening of laws protecting Intellectual Property Rights (Pagano, 2014; Orhangazi, 2019; Rikap, 2021; Schwartz, 2022). 10
The rest of this section will concentrate on the second perspective, that is, the production or creation of intangible assets.
From the big picture …
The pioneering work by Corrado et al. (2005) defined three basic categories of intangible investment: 1. Computerized information (software, databases,…) 2. Innovative Property (scientific [officially measured] and non-scientific R&D, design, new product/service development, entertainment and artistic originals,…) 3. Economic competencies (brands, organizational change, training, and any other investment in human or organizational capital)
In tangible investment, firms only rarely produce the equipment and the structures they use. Therefore, there is usually a market price that serves as a starting point for measuring investment and capital. Instead, the most acute problem in measuring intangible investments stems from the fact that a considerable portion of them is produced internally, and therefore not priced by markets. For example, regarding organizational change, Corrado et al. (2005) took into account not only the consulting services purchased by the business sector, but also a part (actually one fifth) of managers’ and executives’ payrolls as a proxy for the in-house investment in organizational change.
Even though some assumptions could appear rather arguable, the long-run tendencies are very instructive. Figure 3, taken from the INTAN-Invest (2018) data base, relies upon successive updates (e.g. Corrado and Hulten, 2010). It compares the evolution of US non U.S. non-farm business investment rates in tangibles and intangibles, 1977–2017. Source: INTAN-Invest (2018) http://www.intaninvest.net/charts-and-tables/.
Of course, the statistical services of international organizations (U.N., O.E.C.D.) as well as in advanced economies have tried to cope with the ever-increasing importance of intangible investments/assets. Thus, since the 2013 comprehensive revision of US National Income and Product Accounts (NIPAs) by the Bureau of Economic Analysis (BEA), fixed investment has included ‘Intellectual Property Products’ (hereafter IPPs), that is, computer software and databases, R&D, mineral exploration, and entertainment, literary and artistic originals. Contrary to ‘goodwill’ and ‘other intangibles’ (see The Financialization of the firm and investment: From theory to empirics), which are based on the balance sheet model, IPPs reflect the production perspective. Even though, the bulk of IPPs expenditures rely rather on in-house production than on external purchases, they are conceived in the same manner as tangible investments: they are also ‘produced’ through capital, labor, and other inputs. Moreover, the fact that IPPs computation is contingent on the cost of their production/acquisition – and not on the ‘fair value’ of their associated property (or access) rights – implies that even patents are not included in R&D, and therefore in IPPs. Instead, the cost of unsuccessful R&D is comprised in IPPs (Rassier, 2014: 3). 11
The results from the inclusion of IPPs in the fixed investment are impressive (Figure 4). In 2020, the NFC investment in IPPs represented almost 40% of their non-residential gross fixed investment, that is, the same percentage as investment in equipment. The evolution of composition (%) of US NFC non-residential gross-fixed investment, 1980–2020 (current prices). Source: Federal Reserve, Z1. Financial Accounts of the US, https://fred.stlouisfed.org/.
Most importantly, the above broader picture presents remarkable sectoral differentiations. Figure 5 portrays the evolution of the private non-residential investment in IPPs as a percentage of tangible investment (equipment plus structures) in manufacturing. We remark that the key-sectors of the ‘Fordist’ era – ‘machinery’; ‘electrical equipment, appliances and components’; ‘motor vehicles, bodies and trailers, and parts’; ‘other transportation equipment’ – steadily rate over 100% during the whole period. The new high-tech sectors, of ‘chemical products’ (including pharmaceuticals and biotechnology) and ‘computer and electronic products’ follow the same trend as the ‘Fordist’ sectors up to the mid-1990s. Then they skyrocket, even though chemicals encounter a strong downward trend after the 2008 crisis, that is, during the period 2010–2015. The percentage of investment in IPPs also rises in the rest of manufacturing going from 15% in 1980 to 53% in 2020. Still, in Figure 5 this increase is overshadowed by the scale used to represent the evolution of intangible-intensive sectors. Private non-residential investment in IPPs as percentage of tangible investment, US manufacturing, 1980–2020 (current prices). Source: BEA, Detailed Data for Fixed Assets and Consumer Durable Goods, https://apps.bea.gov/national/FA2004/Details/Index.htm.
The above data confirm the basic idea, advocated in the previous two sections, of ongoing structural change in U.S. economy. The change is led by ICT-related sectors and presumably by biotechnology and nanotechnology sub-sectors.
... to the ‘fundamental accounting absurdity’
Nevertheless, the NIPAs data underrates intangible investment, because it does not take into account the ‘soft’ (and hardly measurable) investment in design and economic competencies (mainly training, brand, and organizational change). The resulting mismeasurement will be substantial in ‘low-tech’ sectors, like the ‘rest of manufacturing’ and many services. More generally, according to the INTAN-Invest database, the share of non-measured intangible investment in the GDP non-farm business sector is higher than the corresponding share of the NIPA
This claim may appear too strident, but it is very difficult to provide a well-founded alternative. For example, one would hope to find help at the micro level, from innovations in business accounting. Yet this is far from the case. The US accounting system’s underlying logic is that only assets acquired through markets should figure on the balance sheet. Almost all the in-house intangible investments – even R&D – are presented on the income statement as immediate expenditures: In the U.S., practically all expenditures on internally-generated intangibles – R&D, information technology, brand creation and enhancement, business designs and processes, employee training and other human resources development costs, artificial intelligence and ‘big data’ development and exploitation, customer acquisition costs, etc. – are immediately expensed, whereas expenditures on similar but acquired intangibles (including in-process R&D) are capitalized (Lev, 2019: 713).
With the (small) exception of software, which is capitalized, the only investment that transfers from the income statement to the balance sheet is the tangible one (plant, property, and equipment). This is perhaps appropriate for the sub-contracting firms belonging to the GVCs of US multinationals like Nike, Coca Cola, Dell, and Cisco, but not for the big multinationals themselves, and even less for high-tech services companies.
Therefore, the most fundamental concern in contemporary accounting is first and foremost qualitative. The unmeasured intangible investment contributes to the creation of ‘strategic assets’, which have critical importance for the firm’s competitive advantage. Echoing the previous discussion on the smiling curve economics, Lev (2019) remarks: Consider the accounting absurdity: the major value creators of modern business, like R&D, brands, or IT, are treated as salaries or interest expenses having no future benefits, whereas the ‘commoditized’ tangible (fixed) assets – marginal value creators because they are available to all competitors – are capitalized (Lev, 2019: 714).
It remains, however, that it is quite difficult to agree on ‘reasonable’ conventions for evaluating, deflating and capitalizing an intangible investment that is internally created and that has never passed a ‘market test’.
To complicate things: The organizational investments conundrum
The best example for the underground existence lived by in-house intangible investments comes from what Corrado et al. (2005) termed ‘economic competencies’, mainly investments in branding, organizational change, and training. In the income statement, investment in economic competencies is paired with diverse expenses with the aim of supporting the firm’s current operations in the composite category of Selling, General and Administrative (SG&A) expenditures. Only, Advertising is reported separately, but even now the median US public firm does not report such expenses (Enache and Srivastava, 2018: 3452). This lack of refinement reflects the resilience of the ‘old-fashioned physiocratic way’ of thinking (Simon, 1966: 112), according to which organization expenses represent overhead costs, and thus potentially unproductive expenditures that should be kept in check, even minimized.
Yet, this physiocratic way of thinking has pernicious effects on the quality of the income statement. More specifically, different accounting scholars (Dichev and Tang, 2008; Srivastava, 2014; Enache and Srivastava, 2018; Lev, 2018, 2019) put forward the following three interrelated outcomes: - A steady increase in SG&A expenditures; especially, in intangible-intensive firms where they constitute the most important part of their expenditures (Ayyagari et al., 2021). - A widening discrepancy between revenues and costs, an evolution that violates the fundamental principles of classical accounting (and is attributed to the conflation of intangible investments and operational expenses within the SG&A category). - A progressive deterioration in the quality of reported earnings, which is mainly reflected in the ongoing disconnection between earnings and stock returns or share prices.
One might ask whether the resulting loss of meaning in the income statement is due to the rise of the knowledge-intensive economy (Srivastava, 2014), or to the supplanting of the income statement by the balance sheet model promoted by the ‘fair value’ revolution (Dichev and Tang, 2008). It seems, however, that both factors acted simultaneously and complemented each other. As Lev summed it up (2018: 474): ‘while standard-setters took their eyes off the income statement, intangibles rose to strip the meaning of reported earnings’.
The different methodologies developed for measuring organizational capital in US corporations stumble on the lack of consistency in reporting SG&A expenditures even within the same sector (Crouzet and Eberly, 2018). 12 Nevertheless, most of scholars agree that the category of ‘other intangible assets’, that we find on the balance sheet, constitutes the tip of the iceberg regarding total intangible assets. For example, Peters and Taylor (2017: 256) note that in their data covering the period from 1975 to 2011 the ‘mean (median) firm purchases only 19% (3%) of its intangible capital externally, meaning the vast majority of firms’ intangible assets are missing from their balance sheets’. Enache and Srivastava (2014: 3455, Table 4) found for the period 1970–2009 that the mean firm purchases of ‘other intangible assets’ corresponded to 10% of its expenses for intangible investments.
In any case, it is not surprising that financialization proponents by privileging the balance sheet model neglect the intangible investments included in the income statement. Instead, it is high time that scholars criticizing financialization take this secular change in investment and capital more seriously.
Concluding remarks
At the turn of the 21st century, the political economy of financialization contributed substantially to our understanding of contemporary capitalism. However, the corporate financialization argument has been overextended, especially regarding the crowding-out and the drain effects on investment. Most importantly, the main concern is that pushing the financialization argument too far obscured from view the revolutionary changes that were taking place in business organization, and in capitalism more generally: the smiling curve economics, and the resulting intangible nature of (the dominant faction of) capital.
The paper’s main argument is that the above structural changes challenge the paradigm of industrial capitalism, which underpins the analysis of an array of founding political economists ranging from Ricardo, Marx and Veblen to Keynes, Kalecki and Galbraith. The upshot is that, even in the manufacturing, the production realm no longer occupies the key-role in the dominant type of capitalist firm. The main locus of value creation has shifted towards the pre- and post-production stages, which are characterized by the importance of intangibles and service relationships. If the above analysis is right, the tendency of domestic – mainly tangible – investment to decrease in advanced economies does not really require the financialization hypothesis in order to be understood. In fact, most of the financialization-based explanations are contingent on the conception of the factory as the main locus of value creation. If we drop this preconception, the paradox of a parasitic/rentier capitalism that survived over the last three or four decades by investing a dwindling part of its profits might find a plausible explanation. Capitalism as a whole is still investing sufficiently both in tangible and intangible capital.
Moreover, if we follow Marx who understood capital as a social relation, then there is no reason to see in intangible economy ‘capital’s vanishing act’ (Haskel and Westlake, 2018), or the obsolescence of the notion of capitalism (Kay, 2018). Capitalism is more than ever an all-encompassing force, but it is no longer the capitalism Marx’s or Keynes’ times. It brings to the forefront radically new social pathologies (e.g. Couldry and Mejias, 2020), and economic contradictions. The latter are not limited to the monopolization of intangible capital by ‘star firms’, and the resulting anti-trust concerns. For example, the uncertainty characterizing the valuation of intangible assets, in combination with the fair value revolution in financialized accounting, increases the probability of discretionary behavior on the part of managers, as well as the risk of outside investors’ self-fulfilling prophecies. Consequently, the inherent instability of capitalism, if not kept in check by adequate standards and regulations (Dafermos et al., 2023), will reach new heights in an intangible-intensive economy. In fact, the importance of intangible investment adds a strong point in favor of the Minsky–Veblenian analysis regarding the inherent instability of financialized capitalism (Nikolaidi and Stockhammer, 2017; Argitis, 2019).
More generally, the objective of the present article was not to call into question the idea that financialization implies a major structural change in contemporary capitalism, or that it dangerously expands to new realms of individual and social life (e.g. student loans and social impact bonds). As pointed out by Lysandrou (2016), financialization is about the colonization of the future or time by capital, and as such it represents an important change in the history of capitalism. The point is rather that financialization should not overshadow the structural change in the nature of investment and capital. In fact, most political economists – not only those working on financialization – implicitly assume that industrial capitalism is still dominant. 13 Perhaps, it is time to problematize this ontological postulate, even though we are still lacking well-established conventions for measuring capital, output, and economic performance in our post-industrial economy (Block, 1985). After all, it is during the transition periods that the dictum ‘it is better to be roughly right than precisely wrong’ makes sense.
Footnotes
Acknowledgements
I am indebted to Yannis Dafermos and the other participants in the sessions of the Research Area ‘Effective Demand, Income Distribution and Finance’ at the 2021 EAEPE (European Association for Evolutionary Political Economy) Conference for their helpful comments. Special thanks to the three anonymous Referees for their meticulous remarks. All remaining errors and imprecisions are mine.
Declaration of Conflicting Interests
The author(s) declared no potential conflicts of interest with respect to the research, authorship, and/or publication of this article.
Funding
The author(s) received no financial support for the research, authorship, and/or publication of this article.
