
Abstract
The important role of symmetry perception in the visual domain has been well documented in a large number of studies. Less clear, however, is its effect and potential role as a Gestalt grouping principle in the audio domain. We investigated the perceptibility of melodic symmetry using a series of algorithmically generated sonifications. Twenty-eight naïve participants were presented with a series of nine symmetrical sonifications, nine partially symmetrical sonifications (with approximately half of the mirrored elements changed), and nine asymmetrical sonifications. The participants were asked to identify the sonifications as belonging to one of those three categories. The sonifications utilized Karplus-Strong string synthesis and had a duration between 500 and 8,000 ms. The sonifications were presented three times each in order to check for participants’ consistency. Although participants tested far closer to chance level than perfect accuracy, we observed large effect sizes on measures of both accuracy and consistency. We found an effect of the number of tones in a melody on accuracy, with sonifications containing more tones being more difficult to attribute to the correct category. Sonifications with shorter duration and a faster tempo were also found to be more difficult to attribute accurately, indicating some minimum duration of the melody as well as the individual tones constituting the melody. We also found evidence of a significant effect of age on participants’ consistency, with older listeners performing more consistently.
Certain fundamental mechanisms that underlie the process of auditory grouping appear to be related to Gestalt principles of perceptual organization (Wagemans et al., 2012). In some cases, it has been possible to draw parallels between visual and auditory grouping principles. The principle of proximity, for example, has been shown to apply to both visual and auditory perception (Heise & Miller, 1951). 1 In the visual domain, the principle of proximity states that objects that are placed closer together tend to be perceived as forming a group. Figure 1 illustrates this phenomenon. The nine squares on the left are perceived as separate, while those on the right are perceived as forming a group.

Dispersed and proximate array (good Gestalt) of squares illustrating grouping by proximity.
In the acoustic domain, the term proximity can be used in conjunction with multiple parameters, including location, temporal onset, pitch, and timbre. Composers have sometimes made use of the principle of grouping by proximity in their works. The phenomenon of grouping by pitch proximity is utilized, for instance, in Caprice No. 2 from Paganini’s 24 Caprices (1820, Op. 1). Figure 2 shows the first eight measures of the caprice.
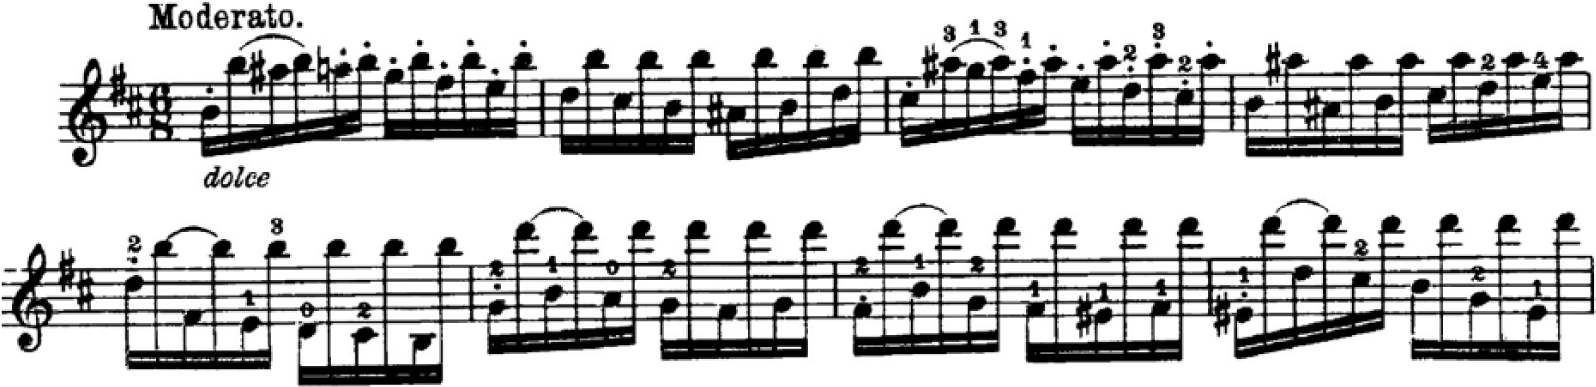
Grouping by pitch proximity in Caprice No. 2 from Paganini’s 24 Caprices (1820, Op. 1).
Although the violin plays a sequence of straight sixteenth notes, the first, third, and fifth sixteenths of every beat are perceptually streamed into a separate group from the second, fourth, and sixth, due to their proximity to one another in register. Other Gestalt principles of visual organization dating back to the beginnings of Gestalt psychology for which parallels have been drawn in the acoustic domain include similarity (Lamont & Dibbon, 2001), common fate (Nakajima, Tsumura, Matsuura, & Minami, 1988), figure-ground (Thurlow, 1957), and good continuation (Huron, 2006). 2
What appears to have received little attention in music psychology is the principle of symmetry. The visual principle of grouping by symmetry states that objects that are symmetrical to one another are more likely to be grouped together. This phenomenon is illustrated in Figure 3, where three sets of symbols are perceived as groups due to their symmetrical characteristics.

Three sets of symbols illustrating grouping by symmetry.
A number of classical compositions widely considered to be great masterpieces utilize reflection symmetry. 3 Johann Sebastian Bach’s Canon No. 1 a 2 cancrizans from Musikalisches Opfer (1747, BWV 1079), shown in its entirety in Figure 4, is a two-part canon in which the parts mirror each other perfectly in time. Anton Webern’s Symphonie (1928, Op. 21) is characterized by symmetry on multiple formal levels; the 11-bar coda at the end of the work is, for example, a palindrome.
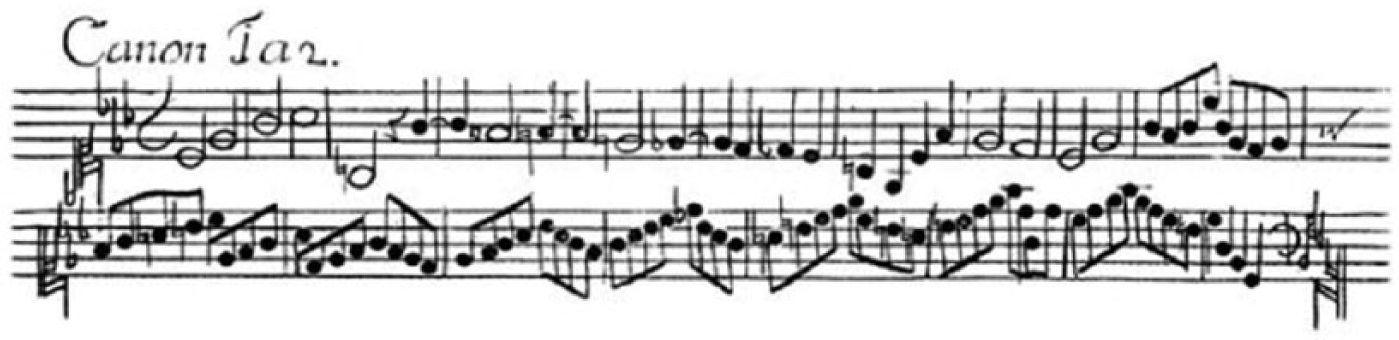
Canon No. 1 a 2 cancrizans from Johann Sebastian Bach’s Musikalisches Opfer (1747, BWV 1079).
At first glance, it certainly does not appear that grouping by symmetry would represent an auditory processing universal in the same way as grouping by proximity. Intuitively, we have a strong sense that it is more difficult to perceive acoustic symmetry – which is generally temporal in nature – than non-temporal visual symmetry. Composers also do not appear to have utilized symmetry as a grouping principle as overtly as many of the other principles mentioned above.
In regards to visual symmetry, numerous studies have shown that perceptibility of reflection symmetry is quick and effortless; this stands in contrast to the perception of the type of symmetry created by translation or rotation (Wagemans, 1997). It has been shown in tachistoscopic investigations (Carmody, Nodine, & Locher, 1977; Locher & Wagemans, 1993), for instance, that reflection symmetry can be perceived in stimuli ranging from simple dot patterns to complex abstract art when flashed very briefly (10–100 ms). Furthermore, the mechanism responsible for symmetry detection has been shown to be robust enough to tolerate imperfect symmetry, where random elements are interspersed (Barlow & Reeves, 1979), or where the symmetrical stimuli are smeared or skewed to some degree (Wagemans, Van Gool, & d’Ydewalle, 1991).
In contrast to the wealth of research on visual symmetry, few studies have addressed research questions related to the detection of acoustic reflection symmetry. Most studies in this area have concentrated specifically on the perceptibility of serial transformations of melodies, and some researchers have obtained conflicting results in regards to the perceptibility of mirror forms of melodies. Dowling (1972), for instance, conducted a study in which participants were trained to identify retrograde, inversion, and retrograde inversion transformations (mirror forms) of short atonal melodies consisting of five tones of equal duration. The melodies consisted of small intervals in order to aid accuracy. The order of increasing difficulty was: inversion, retrograde, retrograde inversion. Although the participants performed above chance level, Dowling found no evidence that listeners were able to distinguish between transformations that preserve the exact interval relationships of the original melody and those that merely preserve its contour. In a similar study utilizing melodies of equal length tones carried out by DeLannoy (1972), which utilized the entire 12-tone aggregate as opposed to only five tones, participants did not succeed above chance level in distinguishing the classic non-prime transformations from those that violated serial rules. Another study, however, concluded that listeners were indeed able to classify non-prime 12-tone row forms as being related to the original with performance significantly above chance level (Krumhansl, Sandell, & Sergeant, 1987). Participants had varying degrees of success that appeared to be correlated with the extent of their musical training. Balch (1981) conducted a study investigating the aesthetic effect of symmetry in good continuation ratings of diatonic melodies. A significant effect of symmetry was detected, with listeners preferring melodies demonstrating some symmetrical properties to those where no form of symmetry was present. Although Balch did not directly measure perceptibility, he suggested that one implication of his study is that melodic symmetry must be recognized to be preferred.
The question of symmetry perceptibility in the acoustic domain is complex, as acoustic symmetry – like proximity – can manifest itself in various ways (e.g. in a temporal series of loudness levels, frequencies, timbres, digital samples, sound source locations, or in a series of frequencies heard simultaneously). Kempf (1996) provides a summary of various manners in which reflection symmetry can be manifested in music. For the purposes of the study at hand, seeing that very little information is currently available, we chose to concentrate specifically on the perceptibility of melodic symmetry. This enabled us to maximize the amount of time we could spend with each participant concentrating on one of the most fundamental unaddressed questions at hand: Is melodic symmetry at all perceivable?
We took an entirely new approach to stimulus generation in our experimental design. Instead of relying on existing classical works or a particular fixed set of stimuli directly related to the established canon of Western music, which potentially causes confounding effects of familiarity and preference, we utilized electroacoustic, algorithmically generated sonifications of integer sequences that were unfamiliar to the participants. 4 This approach proved to be advantageous. Although each stimulus occurred in the same parametric space, the stimuli evaluated by each participant were unique, enabling us to focus more on general properties of symmetry and asymmetry rather than the characteristics of any particular set of stimuli. This approach also enabled us to gather information on the effect of certain parameters on the participants’ performance using a larger set of stimuli than would be possible if the stimuli had been the same for every participant.
Method
Participants
Prior to conducting the experiment, the authors determined using the statistical analysis software G*Power (Faul, Erdfelder, Lang, & Buchner, 2007) that at least 27 participants would be required (with an assumed medium-sized effect of dz = 0.5, using a pre-set α = .05 and power 1− β = .80). The first author recruited 28 volunteer participants ranging in age from 8 to 91 years (M = 35.3, SD = 19.3). Of the 28 participants that took part, 14 were students enrolled at the University of California, Santa Barbara. Ten were female and 18 were male. The participants varied greatly in their level of musical training, with some possessing a degree in music and others having almost no training whatsoever. No compensation was provided for participation in the experiment.
Materials
A computer program written in Objective-C was created to administer the test and the data were recorded in a MySQL database. The database also contained all information pertaining to the sonifications themselves, which facilitated the analysis of the effect of various parameters of the sonifications on listeners’ performance. Each participant was presented with 1) nine symmetrical sonifications, 2) nine partially symmetrical sonifications (with approximately half of the mirrored elements changed), and 3) nine asymmetrical sonifications. The participants were asked in a three-alternative forced-choice test to identify the sonifications as belonging to one of those categories. We chose to include partially symmetrical sonifications in order to see whether listeners would be able to discern some gradations of symmetry, as has been shown to be possible in the visual domain (Barlow & Reeves, 1979). Various researchers have also observed that offering more than two alternatives improves efficiency and reduces response bias (McKee, Klein, & Teller, 1985; Shelton & Scarrow, 1984). Each of the 28 participants evaluated 3 × 9 = 27 unique sonifications, making for a total of 756 unique sonifications used in the experiment (252 from each of the three categories).
The sonifications were monophonic and utilized Karplus-Strong string synthesis – a well-known physical modeling technique used to produce a sound that resembles a plucked string. They were realized algorithmically using C++ software that utilized the API of the synthesis language Csound (Boulanger, 1999) created specifically for the experiment. We first established a series of constraints to create a parametric space in which all of the sonifications would take place:
The integer sequence to be sonified contains pseudorandom integers between 1 and N, where N is an integer between 8 and 16.
The length of the integer sequence l lies in the interval 8 ⩽ l ⩽ 128.
The duration of each individual integer d lies in the interval 62.5 ⩽ d ⩽ 1,000 ms.
The fundamental frequency f (the lowest pitch in the sonifications) lies in the interval 128.0 ⩽ f ⩽ 256.0 Hz.
The minimum duration of the entire sonification, d × l, lies in the interval 500 ⩽ d × l ⩽ 8,000 ms.
While all of the sonifications took place in the same parametric space, each sonification was unique; this was accomplished by employing pseudorandom numbers generated by the C++ rand() function. The algorithm itself worked as follows: for each of the above values, N, l, d, and f, a pseudorandom number was drawn falling within the above constraints. If the duration of the entire sonification fell outside the bounds described in the fifth constraint (e.g. if l = 9 and d = 1,000, the total duration would exceed 8,000 ms), then new pseudorandom values were drawn until values for l and d were found that resulted in a duration falling within the bounds of the fifth constraint.
Symmetrical integer sequences were constructed essentially as follows, observing constraints one and two described above:
A pseudorandom integer sequence was generated, e.g. < 4, 1, 7, 12, 3, 5 >.
If the sequence was to contain an even number of members, then a mirror of the sequence rendered was simply appended to the end, e.g. < 4, 1, 7, 12, 3, 5, 5, 3, 12, 7, 1, 4 >. If the sequence was to contain an odd number of members, then the last integer acted as a pivot, e.g. < 4, 1, 7, 12, 3, 5, 3, 12, 7, 1, 4 >.
Partially symmetrical sequences were created by randomly selecting exactly floor(l ÷ 4) elements from the second half of a symmetrical sequence and changing them to different pseudorandom integers (e.g. < 4, 1, 7, 12, 3, 5, 5, 1, 8, 7, 2, 4 > or < 4, 1, 7, 12, 3, 5, 9, 12, 7, 6, 4 >). The asymmetrical sequences were simply pseudorandom integer sequences with an additional checking function integrated into the algorithm to eliminate any pseudorandom sequences that also happen to be symmetrical or partially symmetrical.
The sonification, or mapping, of the integer sequences occurred purely in the frequency domain. We used the series of harmonic partials as a tuning. This means that the integer 1 was represented by a tone having a frequency of f Hz, the integer 2 by 2 × f Hz, 3 by 3 × f Hz, 4 by 4 × f Hz, etc. This resulted in a potential frequency range of 128.0–4,096.0 Hz for all the sonifications in the experiment. For more information on the Csound instrument used in the experiment, including the actual code, see the Appendix. All sonifications used in the experiment can be heard at http://caseymongoven.com/experiment/II.
Procedure
The tests were administered in a quiet environment using our Objective-C program and a pair of Sennheiser HD 201 headphones (circumaural closed-back dynamic stereo headphones with a frequency response of 21–18,000 Hz). The 27 sonifications for each participant were presented in pseudorandom order three times each without the participant’s knowledge (for a total of 81 sonifications) in order to ascertain listeners’ consistency. Before the test was administered, the participants completed a demographic survey which contained information on age, sex, country of birth, nationality, level of musical training, and level of mathematical training. Musical training was measured on a point scale from 0 to 4. Four questions were used to determine listener’s musical training, with each positive answer counting as one point on the scale: 1) Do you have a degree in music? 2) Do you play an instrument? 3) Do you like to sing? 4) Do you write music? Mathematical training was measured in a similar manner on a point scale from 0 to 2. The two questions were: 1) Do you have a degree in mathematics? 2) Do you often use mathematics in your studies or work?
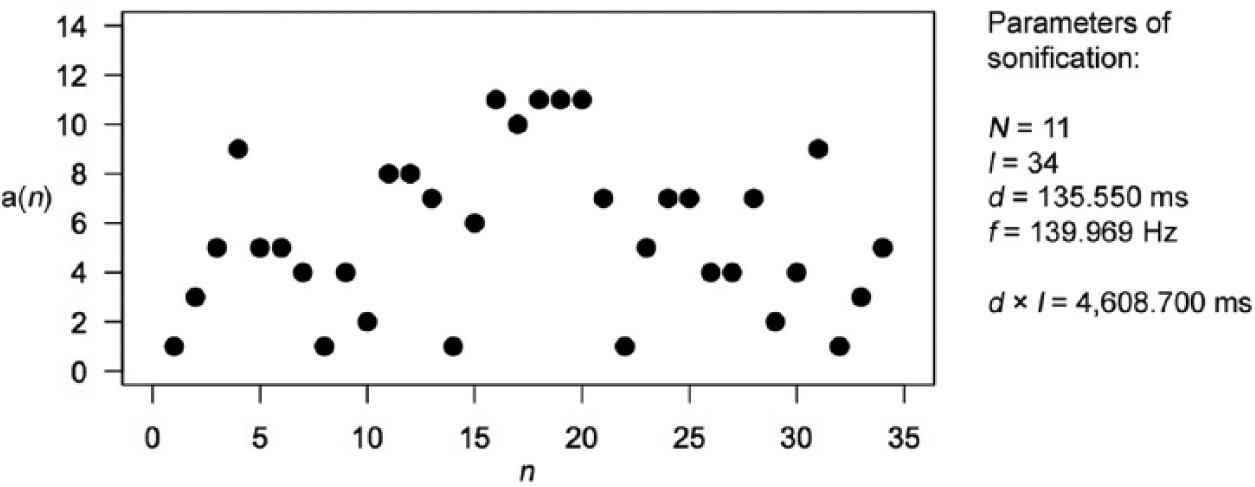
After completing the survey, participants were required to listen to and read instructions. The instructions included one example of each type of sonification along with visual graphs of the integer sequences sonified (no visual graphs were provided in actual testing). They were required to listen to the example sonifications at least once but were allowed to listen to them as many times as they desired. Figures 5, 6, and 7 depict graphs of the integer sequences used in the example sonifications, represented as a(n), along with the actual parameters used in the sonifications, listed on the right (these parameters were not shown to participants). Sound files of the three example sonifications provided in the instructions have been included as Supplementary Material online.
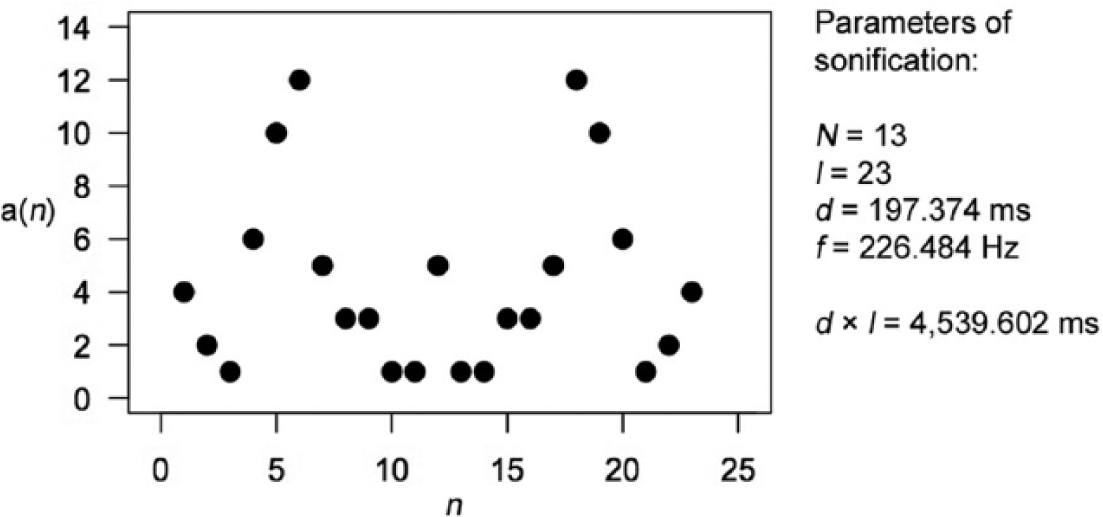
Graph of integer sequence and parameters for symmetrical sonification (listen to “Symmetrical_sonification.mp3” in Supplementary Material online).
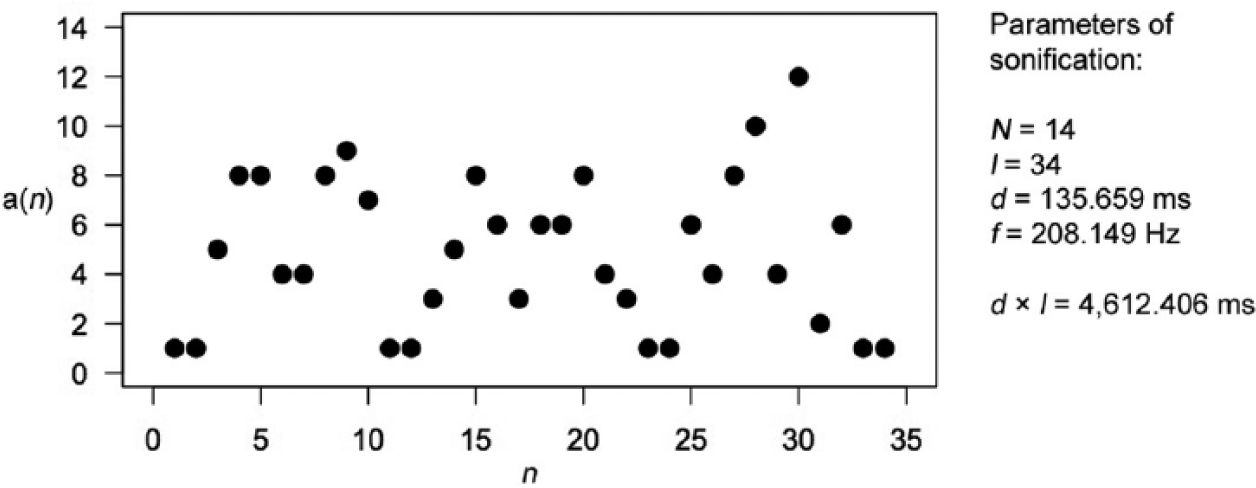
Graph of integer sequence and parameters for partially symmetrical sonification (listen to “Partially_symmetrical_sonification.mp3” in Supplementary Material online).
Graph of integer sequence and parameters for asymmetrical sonification (listen to “Asymmetrical_sonification.mp3” in Supplementary Material online).
Upon conclusion of listening to the instructions and example sonifications, the experimenter (first author) asked the participants whether they felt that they understood the directions, and further clarification of the task was provided if necessary. Participants then commenced with the testing portion of the experiment, evaluating the 81 sonifications in a three-alternative forced-choice test. The experimenter was not present during the testing portion. Upon completion of the test, participants were invited to enter any comments they had about their experience taking part in the experiment. Tests took approximately 20 minutes on average to complete. Screenshots from the program used are depicted in Figures A1, A2, and A3 in the Appendix.
Results
We analyzed the data from the experiment to determine participants’ accuracy in identifying the symmetrical, partially symmetrical, and asymmetrical sonifications. All statistical calculations were carried out using R version 3.2.3 (R Development Core Team, 2016). Single sample two-tailed t-tests were conducted to evaluate whether sample means were significantly different from chance level accuracy of 33.3% for each category as well as for all of the sonifications combined. Accuracy for the symmetrical examples (M = 52.25%, SD = 14.96%) was found to differ significantly from chance level (p < .001, d = 2.58), exceeding Cohen’s (1988) criterion for a large effect (d = 0.8); mean accuracy for the partially symmetrical examples (M = 37.70%, SD = 8.00%) also differed significantly from chance level (p = .008, d = 1.11), yielding a large effect size; for the asymmetrical examples, however, mean accuracy (M = 36.51%, SD = 14.32%) was not found to differ significantly from chance level (p = .250). Mean overall accuracy (M = 42.15%, SD = 7.34%) differed significantly from chance level, and also yielded a large effect size (p < .001, d = 2.45). Figure 8 summarizes the results we obtained. In each histogram, the y-axis shows the number of participants scoring within the percent ranges defined on the x-axis. A dotted line indicates chance level accuracy and a gray line represents the sample mean for that category.
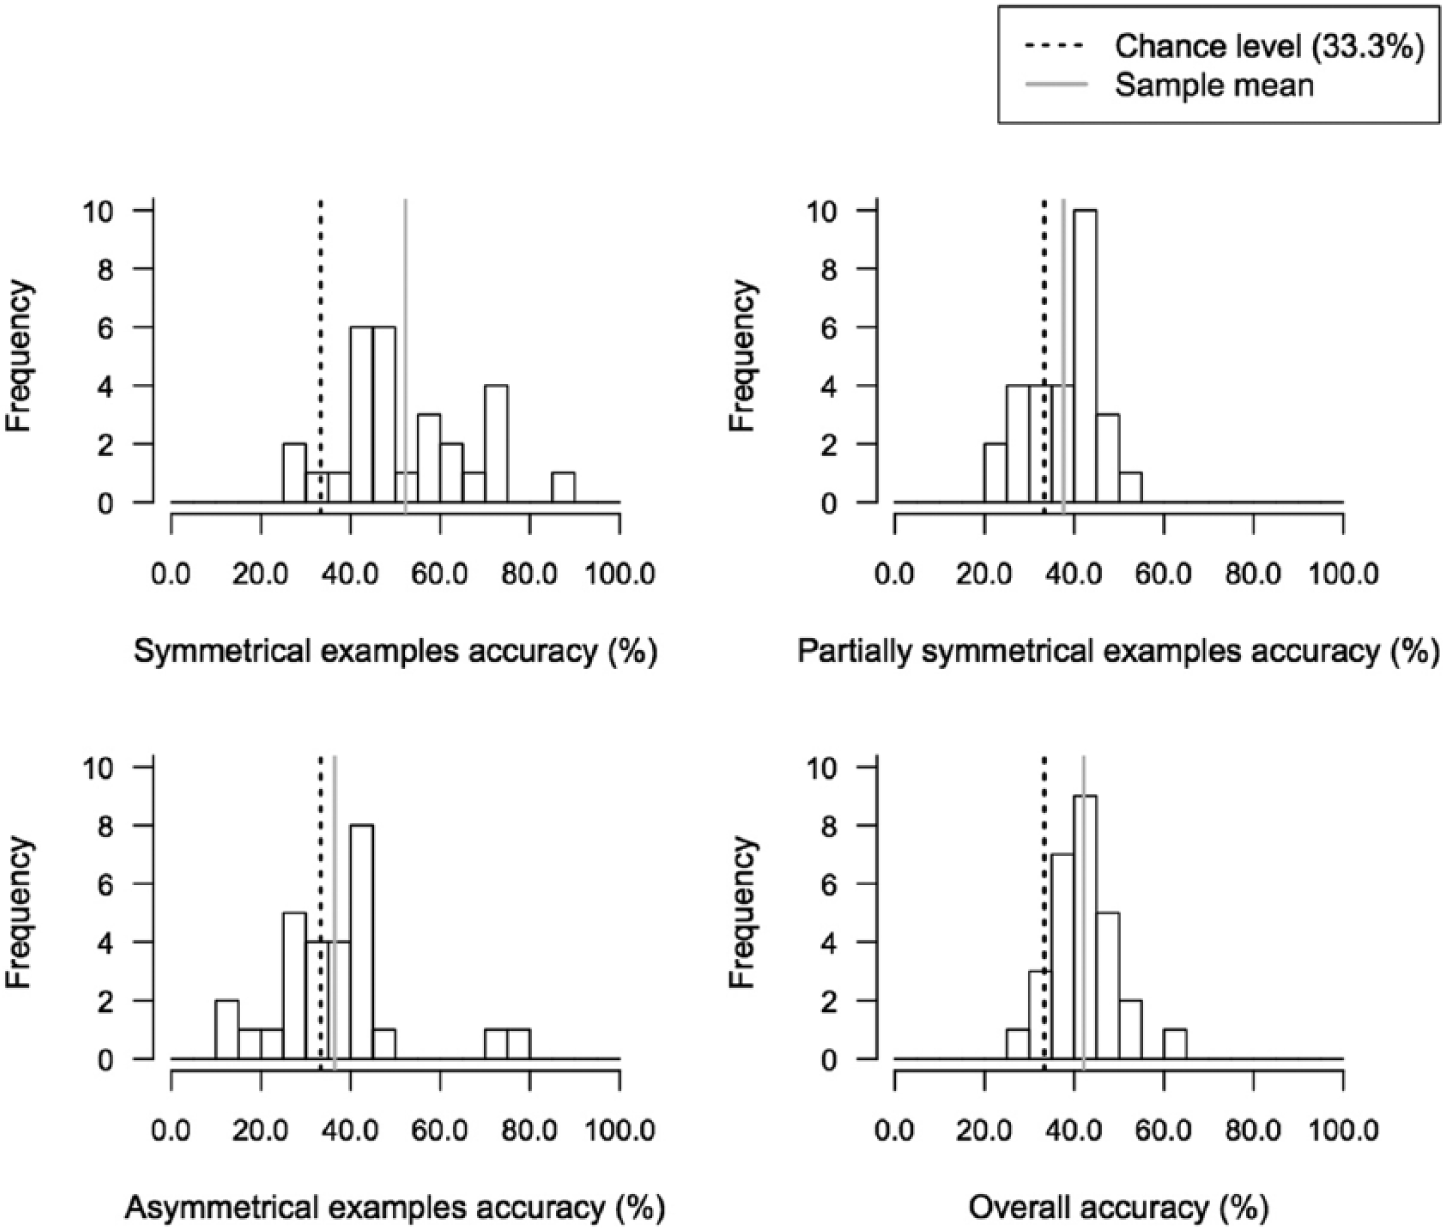
Histograms summarizing results obtained on listeners’ ability to detect melodic symmetry. Chance level plus empirical mean is provided for all graphs.
We also looked at the breakdown for each category to see whether there was any trend in attribution errors that could be identified. It would be a more accurate assessment in terms of degree, for example, to categorize a symmetrical example as partially symmetrical than to conclude it is asymmetrical; similarly, it would be more accurate to categorize an asymmetrical example as partially symmetrical than to conclude it is symmetrical. It would be equally inaccurate, however, to attribute a partially symmetrical sonification to either other category. The results showed that, when an error was made on a symmetrical or asymmetrical sonification, it was indeed most common for participants to attribute that sonification to the partially symmetrical category. Figure 9 contains a series of bar charts illustrating the categories that the sonifications (including their three repetitions) were attributed to. Although there was an equal number of each type of sonification in the experiment, the bottom-right chart shows a general tendency of attributing sonifications to the symmetrical category, followed by partially symmetrical and asymmetrical. It can also be seen that asymmetrical sonifications were actually most often categorized as partially symmetrical.
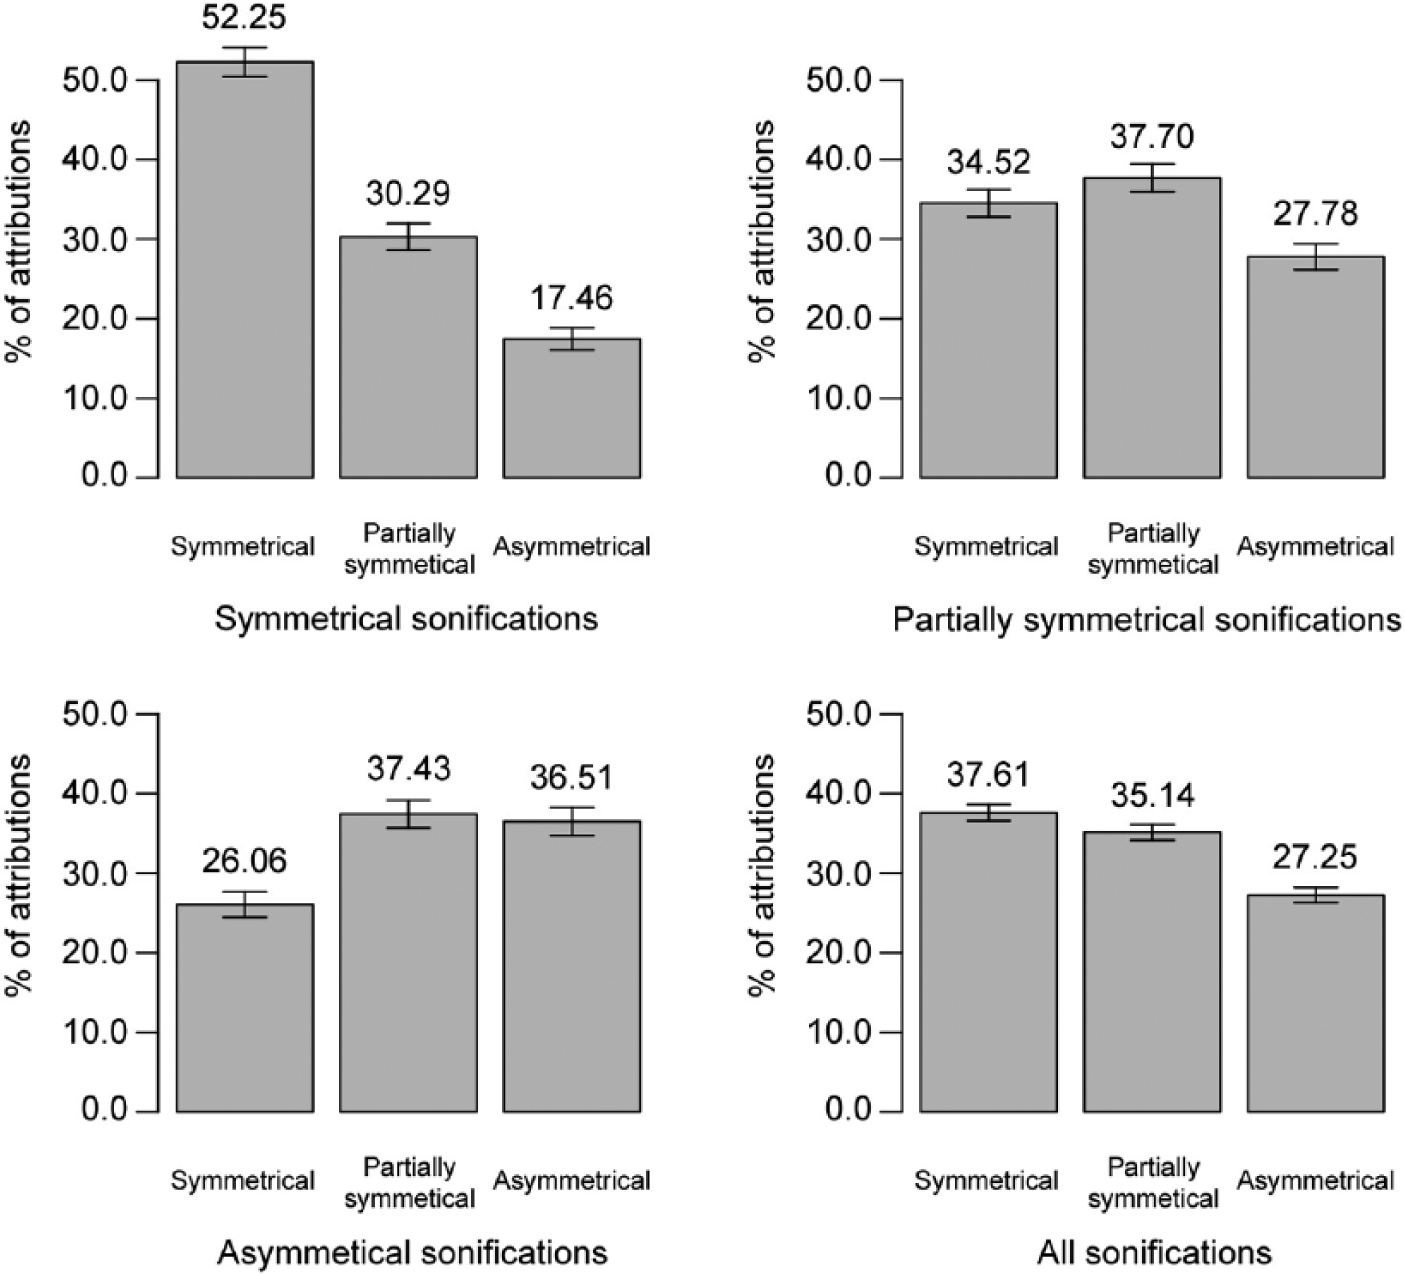
Three bar charts showing the attribution of symmetrical, partially symmetrical, and asymmetrical sonifications to specific categories. A fourth bar chart at the bottom right shows general attribution for all sonifications to those categories. Standard errors are represented by error bars attached to each column in the figure.
An additional analysis was carried out to determine the participants’ consistency in attributing a sonification to one of the three categories. 5 Each sonification was presented three times, so if a participant chose the same category every time a sonification was heard, participants were considered to be 100% consistent. If the same category was chosen two of the three times, they were considered to be 50% consistent. If a different category was chosen every time, participants were considered to be 0% consistent. One-group t-tests were conducted to evaluate whether the sample means for consistency were significantly different from chance level consistency of 50%. Large effect sizes were observed in every case (dvalues ⩾ 0.92). Mean consistency for symmetrical examples (M = 58.53%, SD = 9.74%) differed significantly from chance level (p < .001, d = 1.78) and was highest for all categories; consistency for partially symmetrical examples was lowest (M = 54.76%, SD = 9.16%), but a significant difference was nonetheless observed (p = .011, d = 1.06); consistency for the asymmetrical examples (M = 55.56%, SD = 12.28%) demonstrated the smallest effect size of the three categories (p = .024, d = 0.92). Mean overall consistency (M = 56.28%, SD = 6.14%) demonstrated the largest effect size (p < .001, d = 2.09). Figure 10 shows a series of histograms summarizing our results.
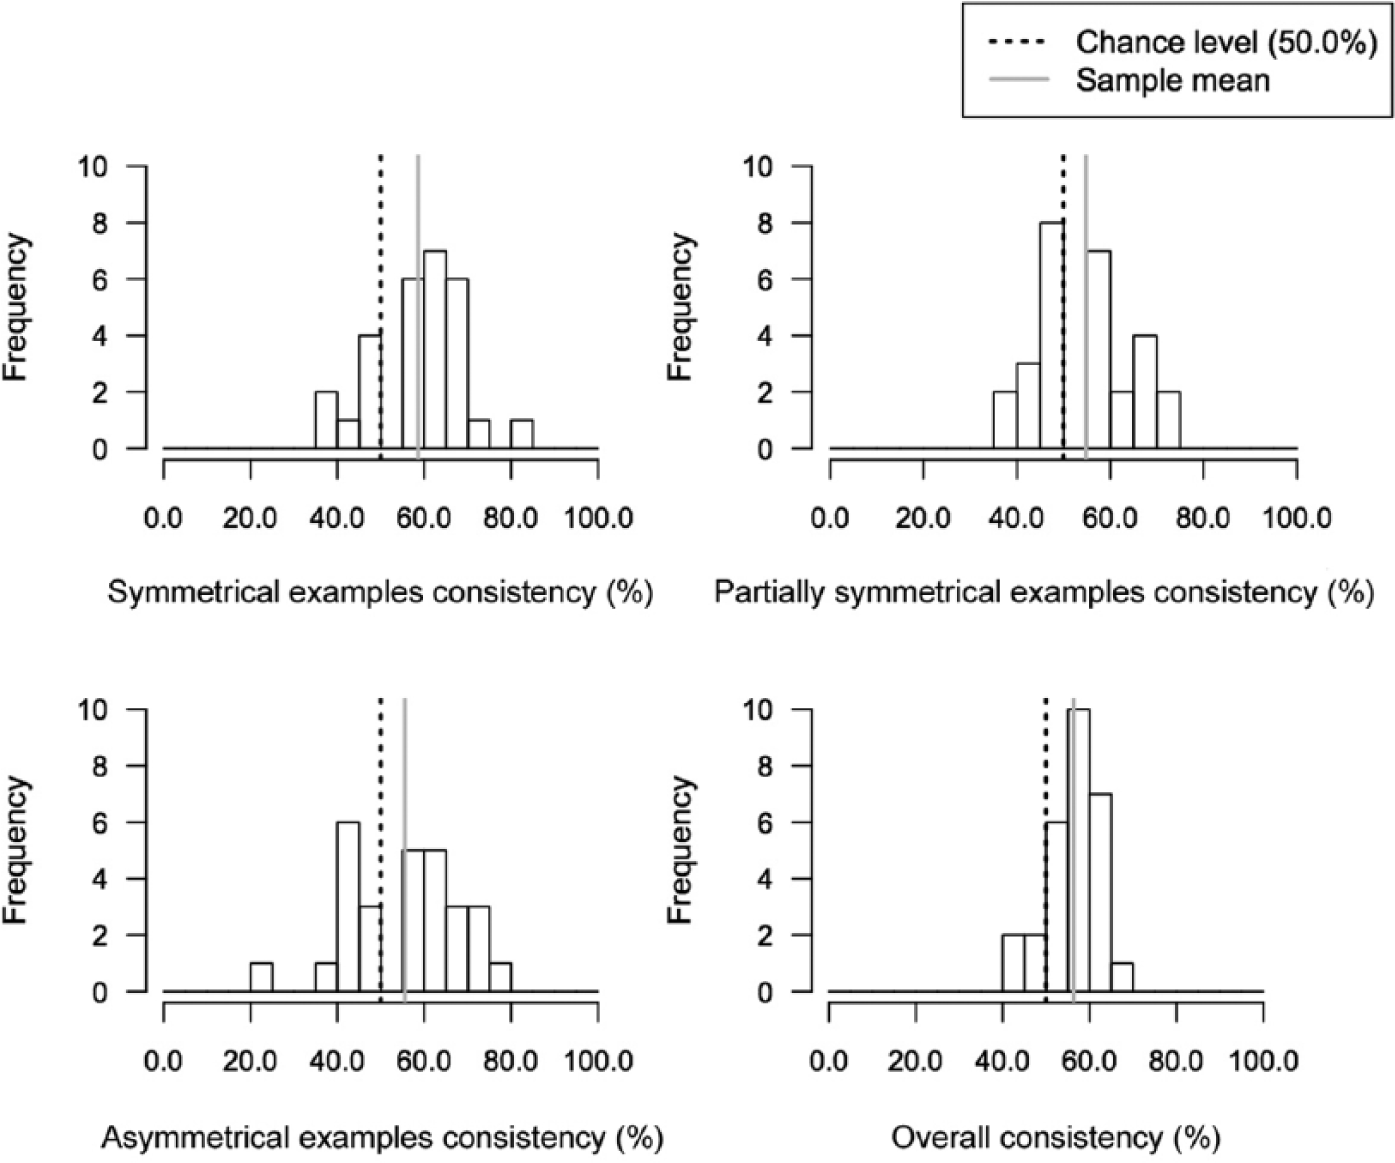
Histograms summarizing results obtained on listeners’ consistency in their attribution of a sonification to a particular category.
We conducted a series of simple linear regression analyses in order to attempt to determine the possible effects of demographic variables and various parameters of the sonifications on listeners’ performance. In our analyses, we looked at the results for each of the 756 sonifications as individual data points, as each sonification had unique parameters. As such, the results reported here concern the effect of various parameters of the sonifications on participants’ performance on the whole and not on the individual level. The effects we discovered were mostly in the small range (r2values < .01). There was a significant but very small effect of integer sequence length on participants’ accuracy, r2 = .007, F(1, 754) = 5.051, p = .025, with melodies containing more tones being more difficult to classify than shorter ones. Figure 11 shows a scatterplot with a regression line depicting the effect of sequence length on listeners’ accuracy. Each light gray circle represents the result for a single unique sonification (756 total); because every sonification was evaluated three times, participants either scored 0.0%, 33.3%, 66.7%, or 100.0% accuracy for that sonification. The x-axis indicates the length of the integer sequence (the number of tones in the melody). No statistically significant effect of sequence length on participants’ consistency was detected.
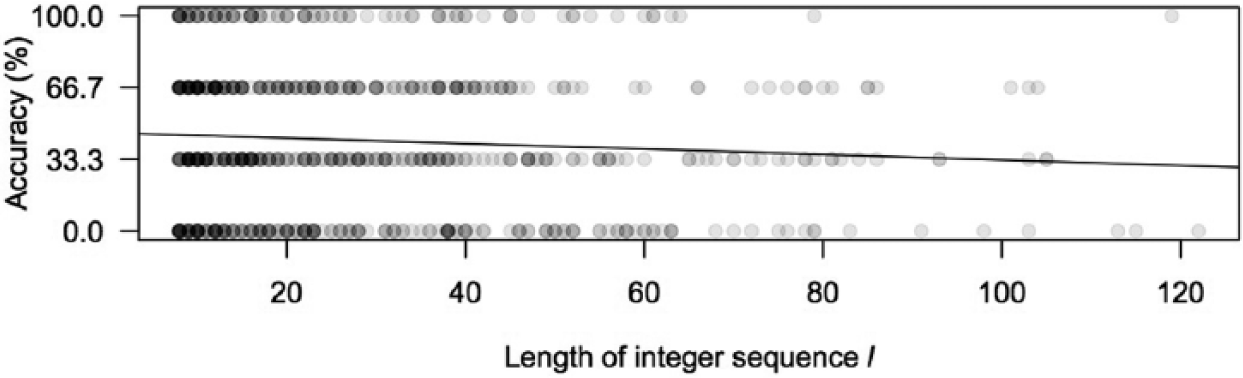
Effect of sequence length on participants’ accuracy.
We also found a significant effect of integer duration – which essentially amounts to tempo – on accuracy, r2 = .016, F(1, 754) = 12.40, p < .001. Here the effect size was larger. Faster sonifications were more difficult to classify than slower ones. Figure 12 shows a scatterplot and linear regression line summarizing these results.
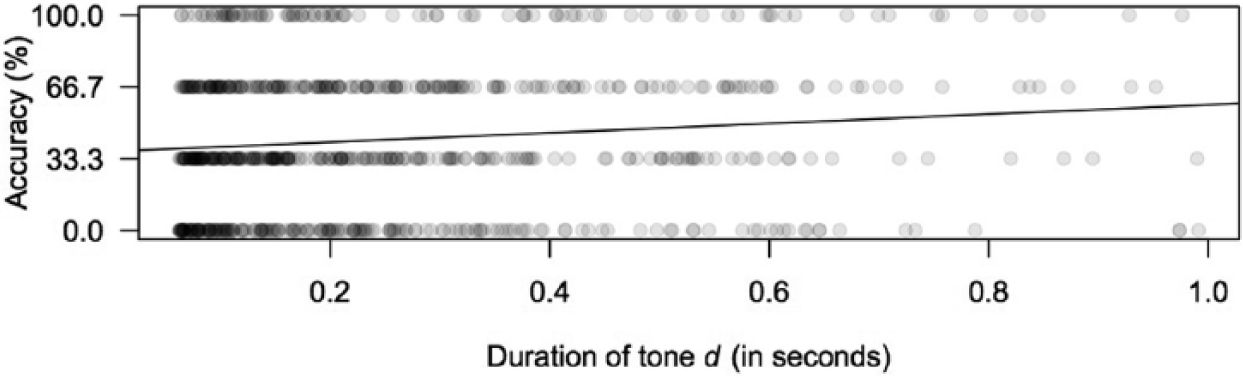
Effect of integer duration on participants’ accuracy.
In this case, we also found a significant effect of integer duration on participants’ consistency, r2 = .007, F(1, 754) = 5.15, p = .024, with consistency decreasing with increased tempo of the sonification. Figure 13 shows a scatterplot showing the effect of integer duration on consistency.
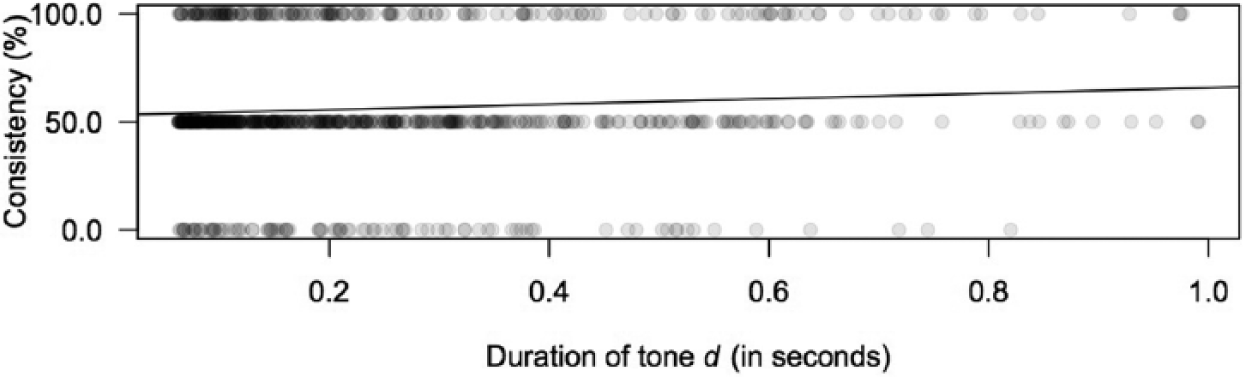
Effect of integer duration on participants’ consistency.
Overall length of a sonification was also found to have a significant effect on performance, r2 = .009, F(1, 754) = 6.47, p = .011, with longer sonifications being easier to classify than shorter ones. Figure 14 shows a scatterplot summarizing the results. No statistically significant effect of duration on participants’ consistency was detected.
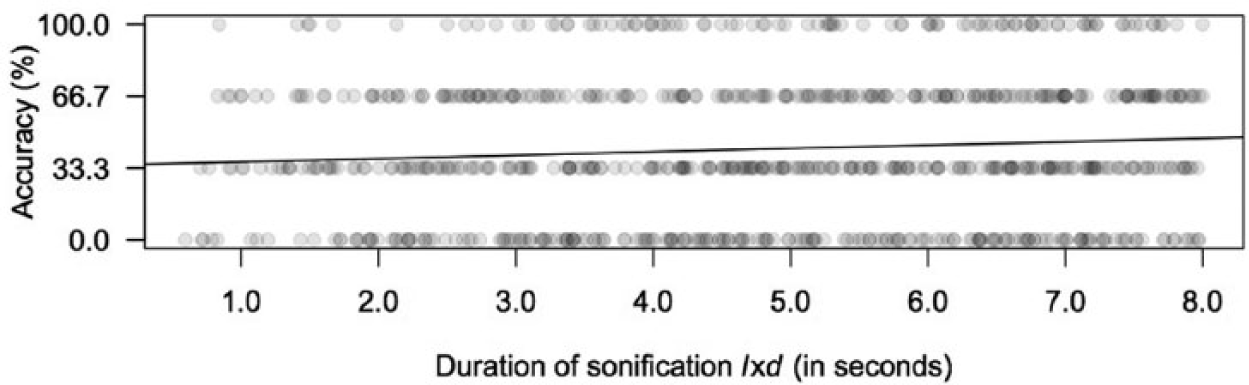
Effect of the duration of a sonification on participants’ accuracy.
We discovered a significant but small overall effect of the number of unique frequencies utilized in a sonification on participants’ performance, r2 = .009, F(1, 754) = 7.10, p = .007, 6 with the number of unique frequencies occurring in a sonification increasing the difficulty of attributing that sonification to the correct category. We took a closer look and analyzed the three categories independently. A significant effect was found in this regard for the symmetrical sonifications, r2 = .023, F(1, 250) = 5.89, p = .015, but interestingly not for the partially symmetrical, r2 = .008, F(1, 250) = 2.04, p = .155, or asymmetrical examples, r2 = .002, F(1, 250) = .62, p = .432. The results pertaining to the 252 symmetrical sonifications are depicted in the scatterplot and regression line in Figure 15. No similar statistically significant effect on participants’ consistency was detected. We also found no statistically significant effect of the fundamental frequency f on participants’ accuracy or consistency.
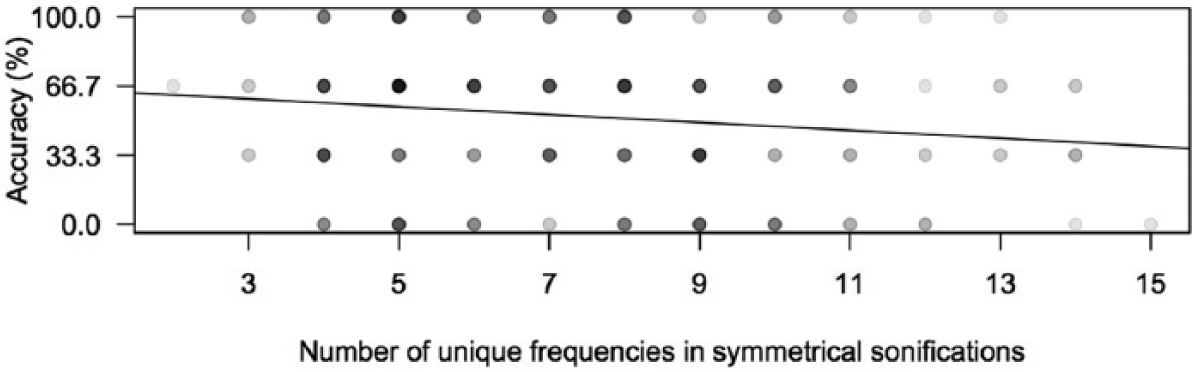
Effect of the number of unique frequencies utilized in a sonification on participants’ accuracy.
Age was found to have a significant, medium-sized effect on participants’ consistency, r2 = .167, F(1, 26) = 5.20, p = .031. However, no other statistically significant results were obtained when we looked at the effect of the demographic variables from the survey (age, gender, musical training, and mathematical training) on accuracy or consistency. Figure 16 shows a scatterplot and regression line depicting the effect of age on participants’ consistency, with older participants performing more consistently than younger ones.
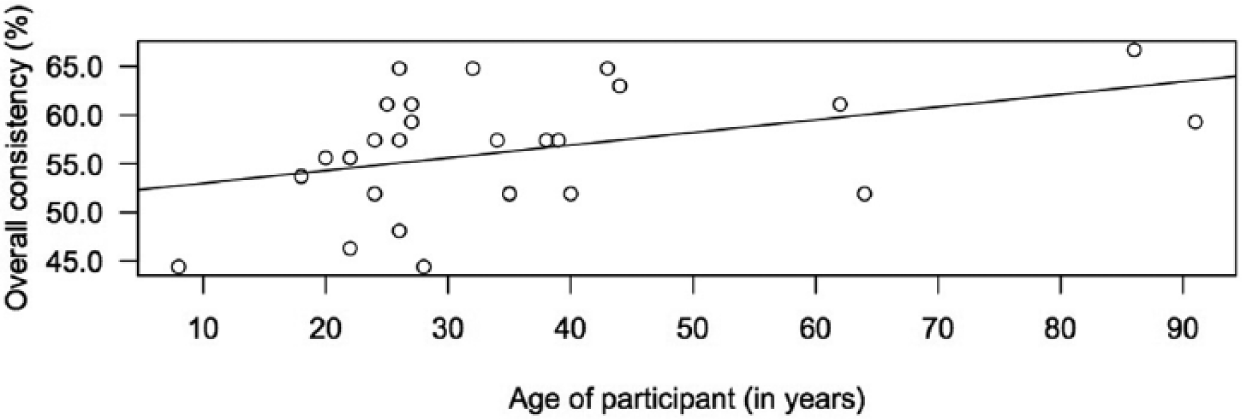
Effect of age on participants’ consistency in attributing a sonification to a particular category.
Discussion
The current study provides us with initial insight into the question of the degree to which melodic symmetry perception is possible. In some respects, it is surprising given the prevalence of Gestalt principles in research on melody perception that such a fundamental concept as symmetry would have received so little attention up until this point. At the same time, the results of this experiment show that, in contrast to visual perception of reflection symmetry, melodic symmetry perception is difficult and requires effort. Although participants were far from 100% accurate, we nonetheless observed large effect sizes on measures of accuracy. This is in line with Balch’s (1981) assertion that melodic symmetry must be perceivable in order to enhance the aesthetic value of a melody. Krumhansl et al. (1987) also observed large effect sizes in their study on the perceptibility of mirror forms of 12-tone rows. Attribution errors in our study also tended to be “intelligent” in that partially symmetrical sonifications were most often chosen when a listener made a false attribution of a symmetrical or asymmetrical sonification. However, it remains unclear whether listeners can properly distinguish degrees of symmetry given the lack of a significant result for accuracy on the asymmetrical examples. Also, the fact that listeners most often attributed sonifications to the symmetrical category, followed by partially symmetrical and asymmetrical, may be some indication of response bias. Semantically, each category contains the word “symmetry” in some form, which could have influenced listeners’ responses or mode of listening. Participants also described the following techniques in their comments at the end of the tests, suggesting a focus on identifying symmetrical examples: trying to listen for the axis of symmetry (described by two participants as difficult because of the arbitrary length of the melody); listening for the beginning and ending pitches to identify symmetry; using lower and higher pitches as reference points (streaming by pitch proximity) to gauge symmetry. Performance in consistency provided further evidence of the difficulty of the task of perceiving melodic symmetry.
Given the challenges presented by its perceptibility, it is doubtful that any significant phenomenon of grouping by melodic symmetry occurs in auditory perception on a regular basis. The effort required to detect melodic symmetry effectively disqualifies it from being a universal perceptual grouping principle. Whereas there are indications of some evolutionary function of symmetry perception in the visual domain (Grammer & Thornhill, 1994; Ludwig, 1932), there is no evidence for such a function in the acoustic domain. The visual world is replete with objects and living things that demonstrate reflection symmetry, whereas it is only rarely encountered in the acoustic world. Even if one looks at the sound files for the stimuli used in this experiment, the waveforms themselves are not perfectly symmetrical. 7
Multiple studies in the visual domain have shown that the ability to detect reflection symmetry increases with the number of elements until that number reaches approximately 20, at which point no further gain in perceptibility is achieved (Baylis & Driver, 1994; Dakin & Watt, 1994; Tapiovaara, 1990). We found in contrast that sonifications that contained more elements and those that contained more unique elements were more difficult to categorize. Sonifications with an extremely fast tempo and those that were extremely brief were also more difficult to categorize. One would expect a point of diminishing returns in this regard, however, where tones or sonifications that were all-too-long would also present a difficulty in the opposite respect. Although no statistically significant effect of musical training was detected, we strongly suspect that a larger sample size would have shown such training to play a role. The participant who scored the highest in accuracy in our experiment (61.73% on overall accuracy) was a doctoral student in music composition. His score was more than one standard deviation higher than the next highest score (53.08%). He commented at the end of his test that he began to picture the shapes of the melodies in his mind as the test went on, suggesting the use of synesthesia as a perceptual aid. The participant with the lowest accuracy (29.62%) had no musical training whatsoever.
Conclusions and outlook
The algorithmic generation of the stimuli used in this experiment proved to be advantageous, as it yielded a more varied pool of results and provided us with a better foundation for generalizing our findings. The parametric space in which the sonifications took place was, however, very limited, and this study concentrated specifically on melodic symmetry perception. Further research is necessary to gain a more complete understanding of acoustic reflection symmetry detection in general. Other temporal manifestations of symmetry could be investigated, such as symmetry in a sequence of note durations, loudness levels, timbres, or sound source locations. One might also look into the role that polyphony might play: Are polyphonic symmetrical structures with timbral cues such as the palindrome at the end of Webern’s Symphonie (1928, Op. 21) easier to perceive than monophonic symmetrical structures such as those presented in this study? Non-temporal manifestations of symmetry could be investigated as well: Are non-temporal manifestations of symmetry easier to detect than temporal ones for trained listeners? How easy is it, for example, to detect symmetry of sound sources in space? How quickly can trained listeners identify symmetrical chords in comparison to asymmetrical ones? Particularly interesting, given the importance of symmetry in visual aesthetics, would be a further investigation into the general aesthetic effect of symmetry in the acoustic domain.
Footnotes
Appendix
The Csound instrument used in the experiment, depicted below, was a Karplus-Strong string synthesizer that utilized a Butterworth low-pass filter with the cutoff frequency sweeping from the fourth partial of the fundamental frequency (represented here by p4) down to the fundamental on an exponential curve over the duration of a note:
Figures A1 through A3 depict screenshots of the program used in testing:
Funding
This research received no specific grant from any funding agency in the public, commercial, or not-for-profit sectors.