
Abstract
This study examined a modified version of the Student Engagement Scale, as adopted from the Australasian Survey of Student Engagement. It did so through examining model fit, predictive validity of the engagement factor, and testing of score reliability and measurement invariance across colleges and class years. Participants were volunteer undergraduate students (n = 536) from two colleges of a large university in Ethiopia. Confirmatory factor analysis using structural equation modelling was used. The results reasonably supported a nine-factor model over other models, and testing of measurement invariance confirmed a good model fit for the nine-factor model across college and class year. Overall, the findings demonstrated supporting evidence for the validity of the nine-factor structure.
Given the versatility of cultures, diversity of higher education environments, and increased pressure of quality assurance, quality issues involving undergraduate programmes need special consideration (Coates, 2006). Scholars argue that assessing quality for improvement in teaching and learning needs psychometrically valid and reliable tools that institutions can use to provide data that will enable them to make targeted improvement plans (Harvey, 2008). The entire effort in the test development and validation process is primarily about creating contextually appropriate quality measurement, while at the same time paying attention to international standards (Krause & Coates, 2008). This process is increasingly challenging and needs both qualitative and quantitative procedures (Griffin, Coates, McInnis, & James, 2003).
As far as cultural issues are concerned, difference in contextual realities can lead to differences in the way these issues are conceptualized and interpreted (Hernandez, Mobley, Coryell, Yu, & Martinez, 2013). Central to this can be the role of contextual uniqueness and distinctiveness as opposed to warranting universality and sameness in measuring quality in higher education (Hagel, Carr, & Devlin, 2012). Thus, both localizing and internationalizing features of the instrument are particularly significant (Strydom, Mentz, & Kuh, 2010).
Student engagement is the litmus test of an institution’s policy and practice and how effective it is performing (Krause, 2005; Kuh, 2009). Assessment of student engagement provides valuable insights into how students engage in education, which has implications for policy and practice (Radloff, 2011; Tang & Wu, 2010). Quality assessment practices and quality assessment tools of student engagement can guide or direct institutional self-evaluation, management, and continuous improvement (Pike, Kuh, & Gonyea, 2003). Additionally, the application of such instruments could provide a cross-cultural platform capable of achieving consistent quality assurance practices across national boundaries (Ross, Cen, & Zhou, 2011). Stakeholders, particularly students, funding governments, and quality assurance agencies, would also be more confident in the credibility of undergraduate qualifications assessed using such a validated international instrument than depending upon the assessment of quality based on mere compliance to standards of procedures (Coates, 2005; Ewell, 2009).
While there has been a growing interest to incorporate student engagement into higher education quality assessment schemes, efforts are underway only in a number of countries (Bryson & Hand, 2007; Zepke & Leach, 2010). From the African perspective, only South Africa has recently incorporated student engagement in its higher education system to enhance the quality of teaching and learning (Strydom, Basson, & Mentz, 2012). However, simple correlational studies provide little by way of illuminating the nature of the student engagement construct and its dimensions. What is required are more advanced analyses and multi-validations of these student engagement scales.
One way to advance this cause is to develop and test the cultural equivalence of original versions of student engagement instruments developed in other populations with different higher education settings. Such a process has important implications not only for the development of culturally validated measures but also for cross-cultural fertilization of the notion of student engagement and its application in the global higher education space.
The National Survey of Student Engagement (NSSE; Kuh, 2009) and its successor, the Australasian Survey of Student Engagement (AUSSE; Coates, 2010), emphasize the two sides of the engagement equation: what the student does to become involved in effective educational practices, and what the institution does to create meaningful engagement experiences for the student (Campbell & Cabrera, 2011; Coates, 2010).
A recent review of student engagement frameworks has indicated that a five-factor model of student engagement is the most empirically supported framework to date (Coates, 2010; Cruce, Kinzie, Kuh, Gonyea, & Shoup, 2008; Kuh, 2009; Strydom et al., 2010). These five factors include active and collaborative learning, student–teacher interaction, academic challenge, enriching educational experience, and supportive campus environment. However, the results of (Tadesse, Manathunga, & Gillies, 2017) in combination with studies by Campbell and Cabrera (2011) and LaNasa, Cabrera, and Tangsrud (2009) suggest that, at least for a single institution study, the five-factor engagement model did not hold. Instead, six-, eight-, and nine-factor models have been proposed (Chosang, Steven, & Penny, 2013; Gordon, Ludlum, & Hoey, 2008; LaNasa et al., 2009). As the results for single institutions are inconclusive, further assessment of the factor structure is required.
The Student Engagement Scale
Recent research and theory has suggested that a conceptually and psychometrically sound measure of student engagement is necessary for the measurement of student engagement (Coates & Mahat, 2014). In previous investigations, both the NSSE and the AUSSE engagement scores have demonstrated adequate reliability and validity evidence for the five-factor model of student engagement based on large-scale datasets (Coates, 2011; Pascarella, Seifert, & Blaich, 2010). These results highlight the relevance of the student engagement construct as a general agent for the use with evidence-based quality management in higher education (Coates, 2010).
However, the establishment of measurement invariance is a prerequisite for meaningful comparisons across groups (Van de Schoot, Lugtig, & Hox, 2012). Thus, unless measurement invariance is established for the Student Engagement Scale (Kuh, 2009), performing cross-group comparisons of mean difference, regression coefficients, or other parameters is problematic (Schmitt & Kulijanin, 2008). Therefore, testing invariance is fundamental for advanced studies dealing with group comparison or prediction studies (Milfont & Fischer, 2015).
Given the positive effects attributed to student engagement on a number of educational outcomes in higher education, the need for a reliable and accurate measure of this construct is very much needed, especially in sub-Saharan Africa, where there is a lack of existing student engagement measures. In Ethiopian higher education, the significance of the student learning experience as a base for evaluating teaching quality has been acknowledged (Zerihun, Beishuizen, & Van Os, 2012). However, there is no study that has examined the factor structure of the Student Engagement Scale in the Ethiopian university context except for a recent study that proposed a nine-factor model (Tadesse et al., 2017).
The present study tested a five-factor structure, which has been suggested in the student engagement literature, and a nine-factor structure confirmed recently (Tadesse et al., 2017). The study also sought to investigate the concurrent validity and measurement invariance of the Student Engagement Scale. Measurement invariance was examined across two colleges (College of Natural Sciences and College of Social Sciences and Law), and two class year groups (second year and third year and above). Specific questions were as follows:
Is the Student Engagement Scale, as applied in an African higher education context best represented by five or nine factors? Does the Student Engagement Scale factor predict important educational outcomes? Does the Student Engagement Scale, as applied in an African higher education context, demonstrate measurement invariance across college type and class year?
First, we present the model fit statistics and practical indices for the whole sample. Following this, we present the descriptive statistics and the reliability analyses for the nine-factor model across groups classified by college type and class year. After that, we present the relationships between the Student Engagement Scale factors and selected validity variables. Finally, we report the results of measurement invariance tests across college type and class year.
Student engagement: Predictive validity and measurement invariance
Research shows that student engagement has an important effect on students’ academic experiences and overall outcome of university education (Coates & Mahat, 2014; Pascarella et al., 2010). Moreover, three decades of evidence suggest that student engagement, that is students dedicating their time and energy to educationally purposeful activities, is a significant predictor of their satisfaction and attainment of multiple educational outcomes of university (Ko, 2011; Pascarella & Terenzini, 1991, 2005; Wefald & Downey, 2009).
Researchers compare groups of individuals on student engagement variables to examine the level of measurement equivalence. The methodological approach used to test measurement equivalence is known as measurement invariance testing, which assesses invariance of construct, factor loading, item intercepts and error variances, and structural invariance, among other dimensions (Byrne, Shavelson, & Muthén, 1989; Vandenberg & Lance, 2000). In this analysis, it is quite common to make a comparison of the student engagement scores across gender, major, and class year (Coates, 2011; Comer & Brogt, 2011; Indiana University, 2010). For example, in a recent European study, researchers developed the University Student Engagement Inventory and described its psychometric properties in a sample of Portuguese college students. In that study, researchers examined content, construct, and criterion-related validities, and measurement invariance in two independent samples of students from public and private universities and several study areas (Maroco, Maroco, Campos, & Fredricks, 2016).
Method
Research methods
The complete details of the methodology of the full study have been presented in a prior report (Tadesse et al., 2017). Accordingly, the current study presents only those features of methodology pertinent to the present study.
Study participants
The study participants included in the final analysis were undergraduate second year (n = 226) and third year (n = 310) students from the College of Natural Sciences (n = 206) and College of Social Sciences and Law (n = 330) at a large university in Ethiopia. In terms of gender composition, there were 429 (80%) men and 107 (20%) women.
Measures
The dataset for the present study contained the Student Engagement Scale, which was designed to assess the key student behaviours that foster student outcomes in the undergraduate context. Specifications of the nine-factor model of the Student Engagement Scale were given in a recent study (Tadesse et al., 2017). Accordingly, the specifications of the underlying nine-factor model were integrative and collaborative learning (α = .81), academic challenge (α = .76), student–teacher interaction (α = .78), class interaction (α = .71), assessment tasks (α = .74), supportive campus environment (α = .75), enriching learning experiences (α = .74), interpersonal relationships (α = .73), and reading and writing (α = .63).
The items for this scale asked participants to think about the experiences or behaviours they exhibited during their university years. Each item was scored from 1 to 4, with 4 reflecting a higher perceived engagement level. Detailed information regarding the measurement of each of the engagement factors is presented in (Tadesse et al., 2017). Sample items are ‘To what extent have you discussed grades or assignments with a teacher?’ (student–teacher interaction), ‘To what extent has your coursework emphasized making judgments about the value of information, arguments, or methods?’ (academic challenge), and ‘To what extent does your college emphasize providing the support you need to succeed academically?’ (supportive campus environment).
Study procedure
For this study, the measurement model was specified a priori, and the construct was analysed using covariance-based structural equation modelling using maximum likelihood estimation method (Reinartz, Haenlein, & Henseler, 2009). Accordingly, items were allowed to load on only one hypothesized factor, factors were allowed to correlate freely, factor variances were set to one, and error terms were not allowed to correlate. The factorial validity of the scores derived from the scale was assessed by examining the item-factor loadings. Here items were considered for deletion if they displayed large standardized residuals (>2) or if an item had a low factor loading <.40 (Kline, 1998). None of the 38 items produced a factor loading below .04, and thus all of them were retained.
Data analysis
The instrument validation and invariance test entailed four essential steps: (a) confirmatory factor analysis using maximum likelihood estimation, (b) model fit evaluation using structural equation modelling for the total sample, (c) reliability analysis for each scale and subscale using Cronbach alpha across groups, and (d) invariance testing at both the structural and measurement levels. Models that test relationships between measured variables and latent constructs are measurement invariance tests. There are different common models that fall in this category: configural, metric, scalar invariance, among others. In this study, we used both configural and metric invariance tests.
Results
The five-factor model of student engagement
The five factors include (a) active and collaborative learning (Acl), (b) student–teacher interaction (Sti), (c) academic challenge (Lac), (d) supportive campus environment (Sci), and (e) enriching educational experiences (Eee). The factor structure of the five-factor model of student engagement is presented in Figure 1.
The five-factor model using student engagement dataset (n = 536).
From Figure 1, it can be seen that poor item loadings on a few items indicate that the factor structure specified in the model has some level of model misspecification or incongruity with the data. Despite this, the model structure correlation among the sub-components seems acceptable with a range of low to moderately high associations, with only one high correlation between active and collaborative learning and academic challenge (r = .78). The absence of excessive or negative correlations among the latent constructs is a good indication of model characteristics. With the intention to find a more parsimonious model, we examined several potential models, including six-, seven-, eight-, and nine-factor models. Before dealing with the results of the model tests the features of the nine-factor model will be presented. Figure 2 presents the path diagram of the nine factors of student engagement model.
The path diagram of the nine factors of Student Engagement Scale.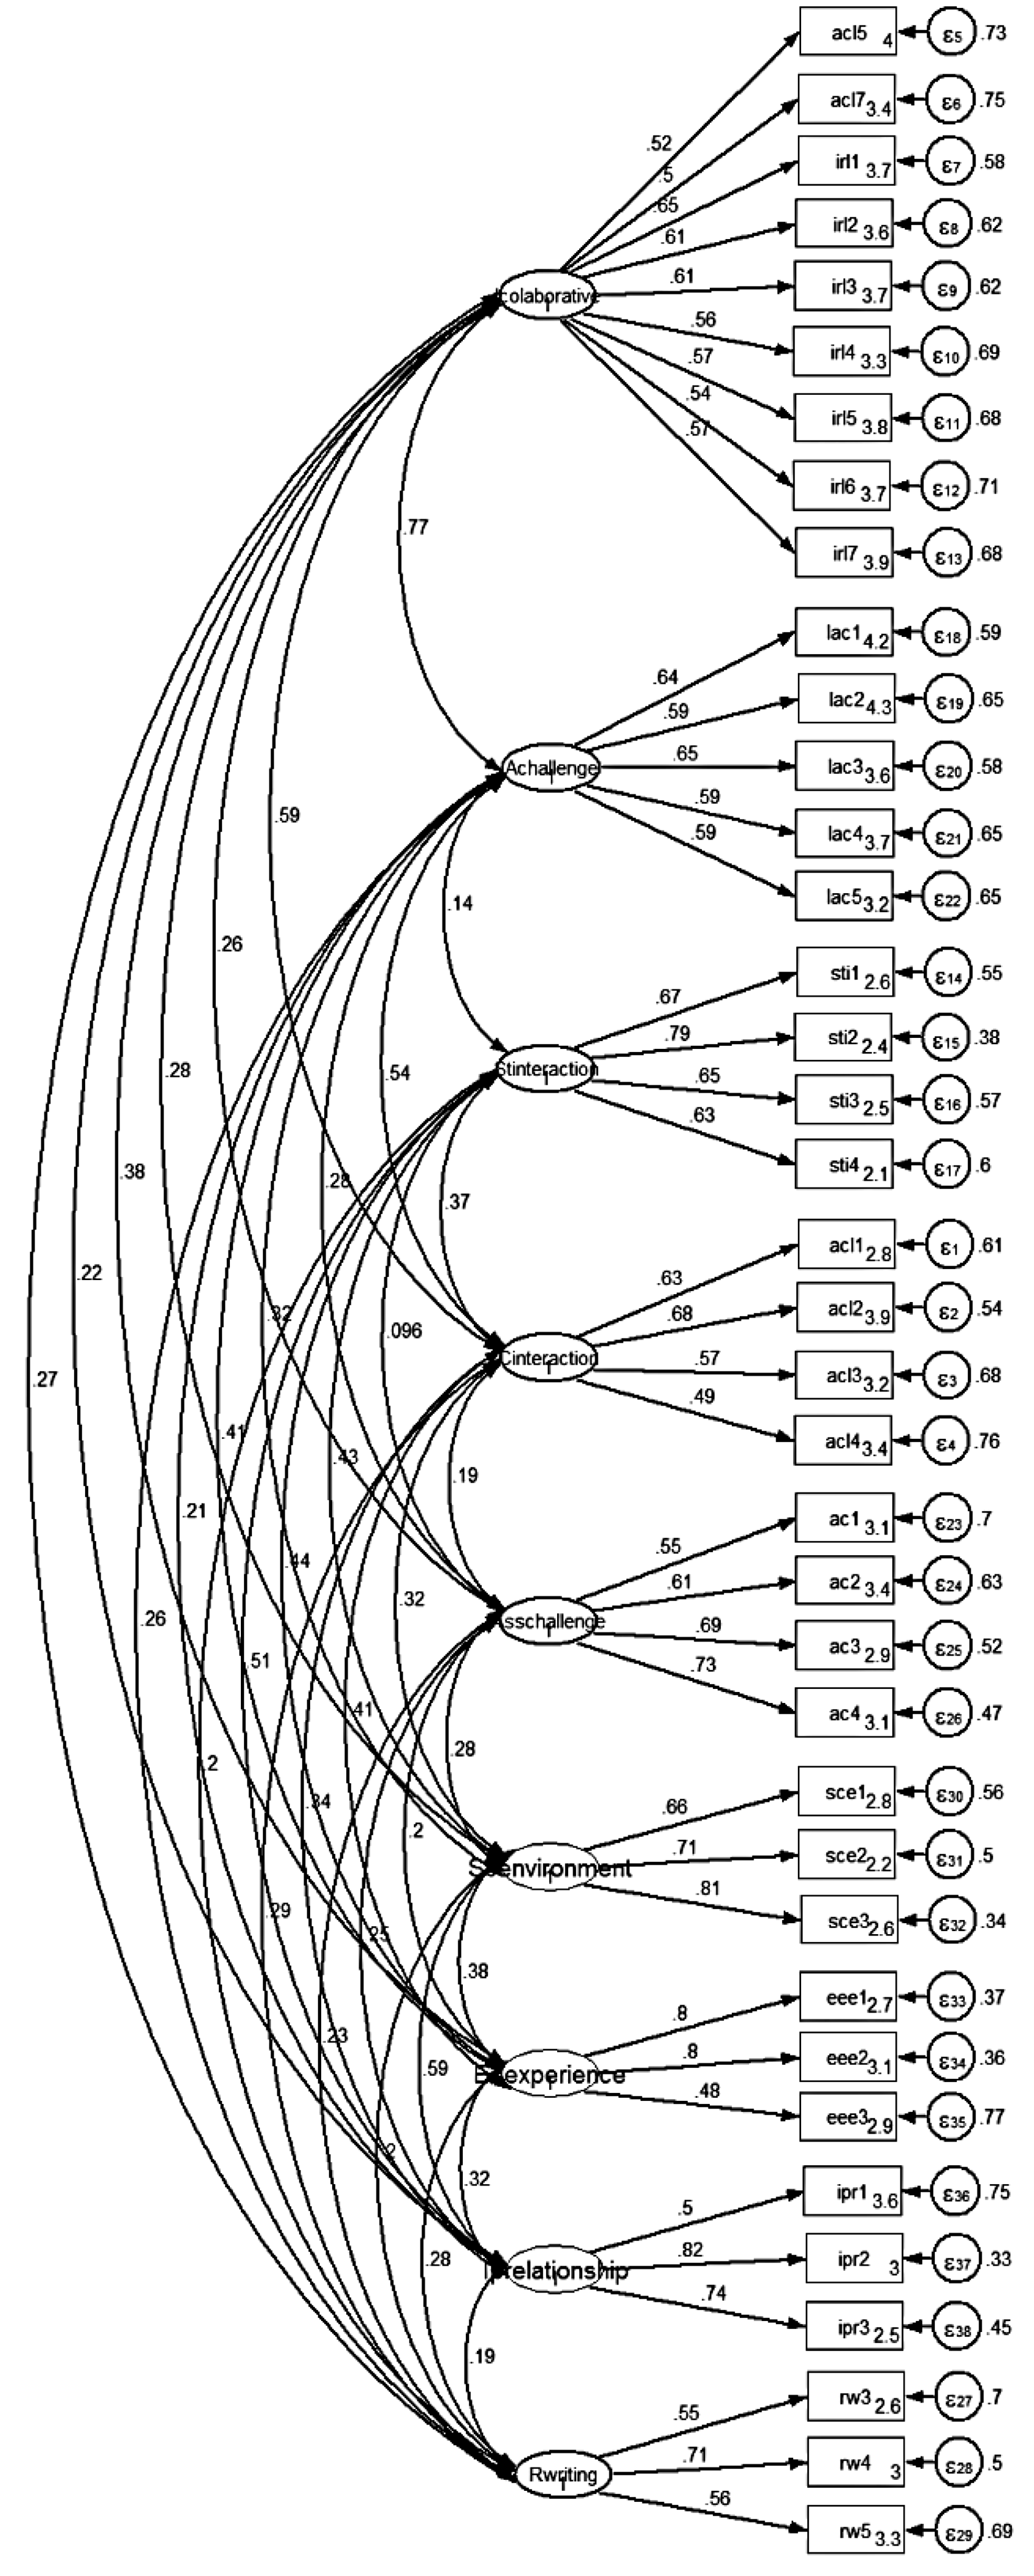
As illustrated in Figure 2, the different factors did not show any excessive correlations between the factors; however, there are few places where relatively higher correlations of the factors were exhibited. For all sub-components, moderate to high proportions of the variance were explained by the indexed items. It is important to note that the overall reliability of the scale is very high (α = .92) and no single item had loading below the recommended threshold of λ ≥ .40 (Stevens, 2002). From the diagram it is clear that there are low to moderate relationships among the variables with the correlation coefficients varying between .12 and .78, with the majority of them having moderate correlations. These testify to the interdependence among the factors, and the absence of excessive and negative relationships is good feature of the scale.
Post-estimation analysis and goodness-of-fit tests
Model fit was assessed according to Chi-square (χ2) test and multiple indices. The χ2 test (Cochran, 1952) was used to assess absolute fit of the model to the data, but this test often rejects models based on large samples (Bollen, 1989; Bollen & Long, 1993). To address this limitation, the Chi-square to degrees of freedom (χ2/df) ratio was used. The χ2/df ratios up to a ratio of 5–1 have been used as general rules of thumb to establish reasonable fit (Marsh & Hocevar, 1985) and a ratio 3–1 as a good fit (Wheaton, Muthén, Alwin, & Summers, 1977). Also, another four indices, Comparative Fit Index (CFI), the Tucker–Lewis Index (TLI), the root mean square error of approximation (RMSEA), and the standardized root mean square residual (SRMR), were used to judge model fit. The CFI and TLI range from 0 to 1 with the conventional value for the acceptable model fit at .90 or greater (Bentler & Bonett, 1980; Bollen, 1989; Hu & Bentler, 1999). In interpreting RMSEA and SRMR, it is suggested that values less than .05 indicate close model fit, values between .05 and .08 indicate reasonable fit, those between .08 and .10 indicate mediocre fit, and values greater than .10 indicate unacceptable fit (Browne & Cudeck, 1992; Schreiber, Nora, Stage, Barlow, & King, 2006).
Fit statistic tests across different student engagement models.
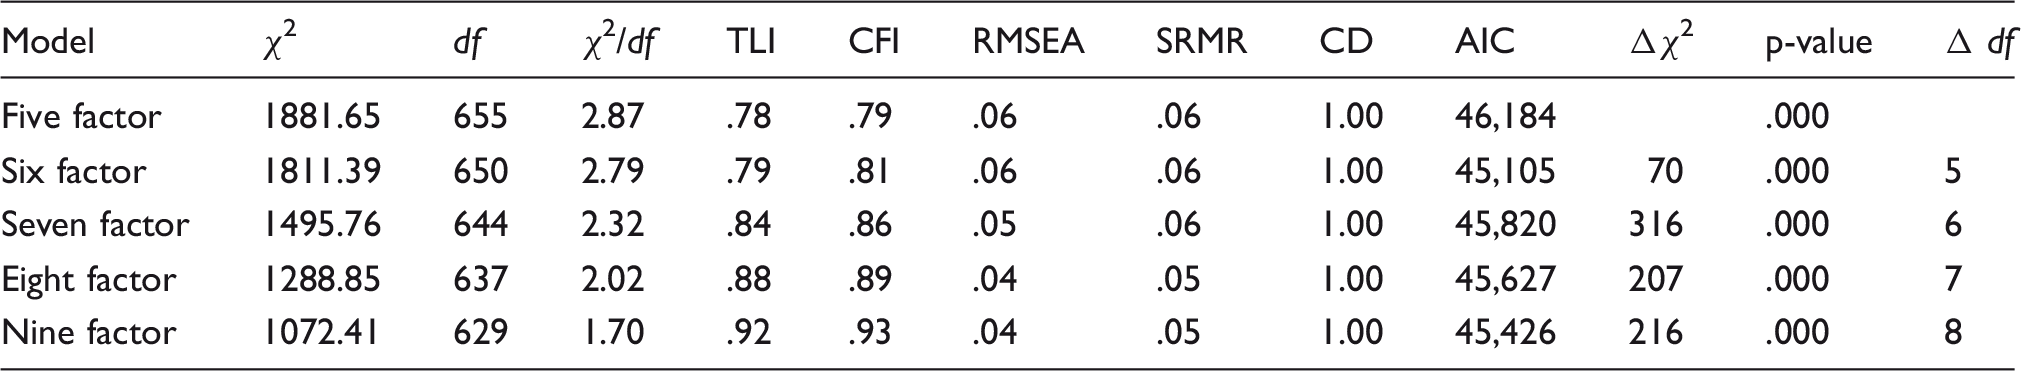
AIC: Akaike's information criterion; CD: coefficient of determination; CFI: Comparative Fit Index; RMSEA: root mean square error of approximation; SRMR: standardized root mean square residual (testing residual invariance); TLI: Tucker–Lewis Index.
Note: The components of the five-factor model are presented in Figure 1. All modifications in the subsequent models were based on a prior classification scheme reported in scholarly publications and preliminary principal component factor analytic results.
The six-factor model (by separating the active and collaborative learning items into two, a new component was added to the five-factor model).
The seven-factor model (by separating academic challenge items into two courses and literacy related and assessment related components a new component was added to the six-factor model).
The eight-factor model (by separating assessment and literacy related components, a new component was added to the seven-factor model).
The nine-factor model (by separating the learning support items into the supportive campus environment and interpersonal relationships components, a new component was added to the eight-factor model).
As shown in Table 1, the range of goodness-of-fit indicators offered reasonable support for the different models. For example, the χ2 test results are statistically significant across the different models. While these values are within the standard acceptable range (a χ2 per degree of freedom value of less than 3), the χ2 values reduce in size as we go from the five-factor model to the nine-factor model. In terms of RMSEA, SRMR, and the coefficient of determination (CD), the score values for the different models are all within the acceptable range. However, in terms of baseline comparative goodness-of-fit tests, the two indices, CFI and TLI, were acceptable only for the nine-factor model. In conclusion, nine-factor model was the only model that had acceptable fit statistics. Thus, the nine-factor model demonstrated best fit to the data.
Correlations between engagement factors and validity variables.
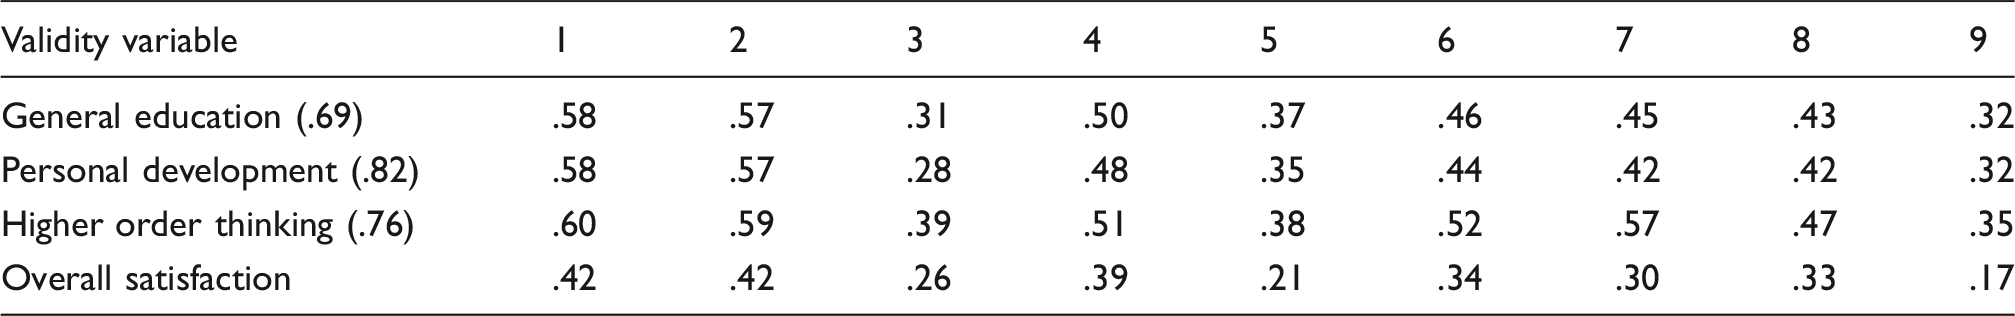
Note: 1 = Integrative and collaborative learning, 2 = Academic challenge, 3 = Student–teacher interaction, 4 = Classroom interaction, 5 = Assessment challenge, 6 = Supportive campus environment, 7 = Enriching educational experience, 8 = Interpersonal relationships, 9 = Reading and writing.
Reliabilities (Cronbach’s alpha coefficients) are in parentheses. All correlations are significant (p < .001).
General education = 3-item scale (AUSSE) rated 1–4. Personal development = 6-item scale (AUSSE) rated 1–4. Higher order thinking = 4-item scale (AUSSE) rated 1–4. Higher scores indicate greater gains in each measured scale.
Overall satisfaction = a single item scale (AUSSE) rated 1–5, with higher scores indicating more satisfaction.
Descriptive statistics and reliability analysis for the nine-factor Student Engagement Scale across colleges and class year.
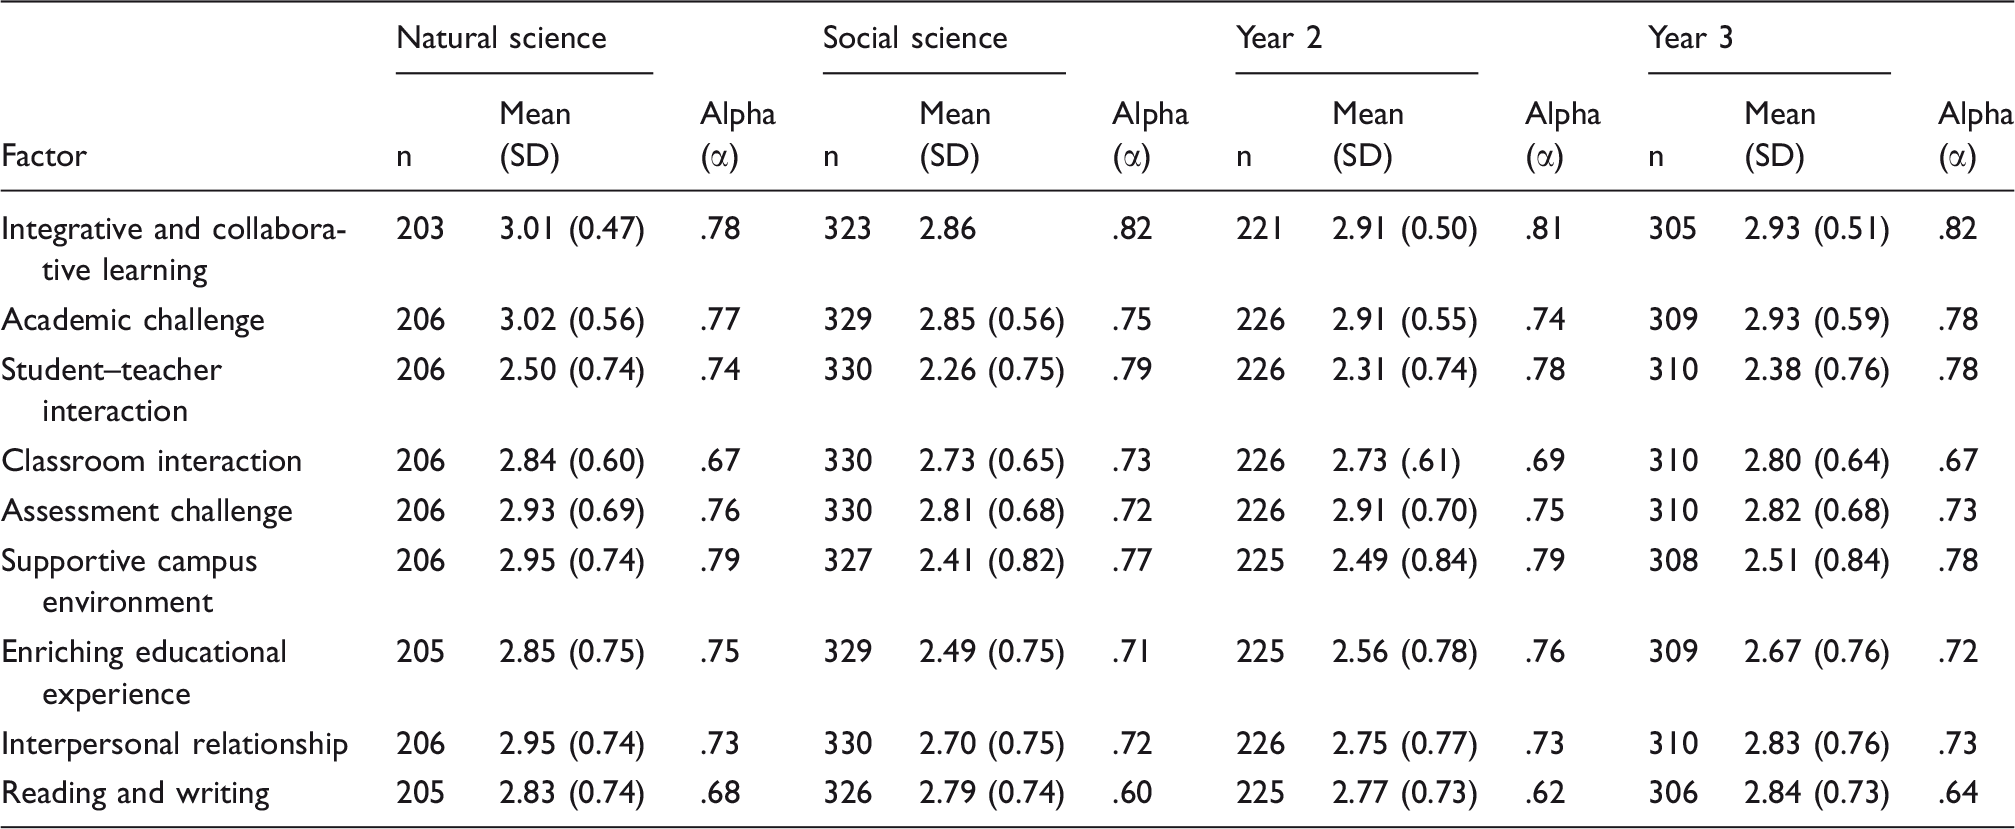
Note: Evaluation of the distribution of the nine-factor model indicated that kurtosis ranged from 0.00 to 0.96 and skewness from 0.00 to 0.76, suggesting univariate normality for the whole sample.
Testing for a common nine-factor structure
In higher education research, where the focus is on multi-group comparisons, it is usually presumed that the measuring instrument is functioning in exactly the same way across groups so that the underlying construct has the same theoretical structure and psychological meaning irrespective of group differences. However, these assumptions might be violated due to measurement errors disturbing assumed equivalence.
The primary approach to address this issue of instrument equivalence is testing for cross-group invariance, which involves testing the structural model against each group component and then checking whether or not the same structure works across the two groups (Van de Schoot et al., 2012). Before comparing the groups, it is important to make sure that the hypothetical structure provides a good fit for both groups. Thus, the first step is to test whether the proposed nine-factor model fits the empirical data from each group classified by major discipline and class year. The second step is to move from single-group confirmatory factor analysis to multi-group confirmatory factor analysis in order to cross-validate the two-factor model across the two groups.
Fit statistics and practical indices for invariance tests for student engagement scale across college and class year.

CD: coefficient of determination; CFI: Comparative Fit Index; RMSEA: root mean square error of approximation; SRMR: standardized root mean square residual (testing residual invariance); TLI: Tucker–Lewis Index.
p < .10, *p < .05, **p < .01, ***p < .001.
As shown in Table 4, the results indicated that the theoretically based, second-order factor structure did result in an adequate fit of the data. For the college-level data, the hypothesized model (Model 1) provided an adequate fit, resulting in a chi-square value of χ2/df = 1.54, RMSEA = .05, SRMR = .61, CFI = 89, TLI = .87, and CD = 1.00. Also, Model 2 of the college data had the same fit statistics and indices. The models from the class year-level data had a good fit: χ2/df = 1.44, RMSEA = .04, SRMR = .06, CFI = .91, TLI = .90, CD = 1.00, as did Model 2: χ2/df = 1.42, RMSEA = .04, CFI = .91, TLI = .90, CD = 1.00. These fit statistics and indices show that the results are within the acceptable threshold, indicating the adequacy or fit of the model to the collected data.
Discussion
As shown in Figures 1 and 2, there were moderate to high factor loadings for both models, but compared to the five-factor model, the nine-factor model had higher factor loadings for some items, particularly to those factors decomposed into additional sub-themes (see Figure 2). This item-level factor loading improvement indicated the relative advantage of the nine-factor model in creating more common factor space for the measured variables (items).
The factor loading estimates were quite similar to the factor loading estimates reported for the AUSSE Student Engagement Scale examined in an earlier study (Coates, 2011). For example, the correlations in the earlier study between the supportive campus environment construct and its six constituent items ranged from .54 to .77, and in the present study the factor loadings for the three items ranged from .66 to .81. Moreover, in terms of covariances among the latent factors, the separation of some of the factors in the nine-factor model brought more diversity, which can be one indication of improved discriminant validity of the instrument (Campbell & Fiske, 1959), which is one advantage of using the nine-factor model.
The results of the reliability analyses for the different groups were found acceptable for most of the measured engagement subscales, except for the subscales of classroom interaction and reading and writing, whose Cronbach alpha values were lower than the recommended threshold, although still adequate for subscales with this number of items (Cortina, 1993). The Cronbach alphas of the other subscales were all >.70, which is acceptable (Nunally & Bernstein, 1994). Also, the reliability coefficients reported for the groups compared in the present research (see Table 3) are in line with the reliability coefficients reported for the AUSSE Student Engagement Scale (Coates, 2011).
The modified version of the Student Engagement Scale demonstrated comparable internal consistencies. In addition, this version produced a nine-factor solution as evaluated by different goodness-of-fit statistic tests, almost with all the required criteria being met – confirming the validity of the factor structure of the Student Engagement Scale. Also, these factorial structures supported recent analyses that suggested the need to reconstitute and decompose the five dimensions of the NSSE into additional dimensions through the incorporation of a breakdown of the five benchmark domains (Gordon et al., 2008; LaNasa et al., 2009; Lutz & Culver, 2010).
The modified Student Engagement Scale demonstrated adequate psychometric properties as a measure of meaningful learning experience in the Ethiopian higher education context. Internal consistency and inter-item correlation coefficients approximated those from prior studies and are considered to be adequate for sample-based research (e.g. Coates, 2011, reported inter-item correlations ranging from .18 to .81). This is consistent with other studies that demonstrated similar outcomes (Marti, 2009; Strydom et al., 2010).
The fit of the nine-factor model is indicative of a robust structure, as the different model fits highlighted the nine-factor model was substantially improved across a range of fit statistics and practical indexes. Although these results were not meant to suggest that there is no meaning in the original five factors, it does suggest that further breakdown of the five-factor model provides several advantages to improve the psychometric properties of the engagement scale.
The present study provides supporting evidence on the adequacy of the Student Engagement Scale for use in the Ethiopian higher education context. This study builds on earlier studies conducted to validate the use of the scale in contexts other than for which it was originally developed and validated (Hernandez et al., 2013; Matthew, Ashleigh, & Christopher, 2012). While the focus of the current study was on its use in the Ethiopian culture, and the applicability of the five-structure model in this specific institutional context, the study provides empirical support for the measurement invariance of this engagement scale when used in a single institution study, supporting use of the Student Engagement Scale across college and years (Maroco et al., 2016).
Limitations and recommendations for further research
This study is limited as it only presents analyses of samples of senior students of two colleges at a university in Ethiopia. These results might not hold for all colleges within the university and in other higher education settings, and might not be representative of first-year student cohorts. These results do, however, suggest that more work is needed to understand the sub-components of student engagement. Student engagement as a construct consisting of a multitude of instructional processes, cognitive tasks, expectations, interactions, environments, relationships, and satisfaction (Coates, 2006). While this is the spectrum of its dimensions, this study did not cover all of these dimensions, and in framing a conceptual model of student engagement, measuring the different variants and specifying the relationships among these measures need special consideration.
The other limitation of the study is that the modified Student Engagement Scale was not evaluated by using independent samples. Instead it was measured using the same sample involved in the EFA using the partial least square method. When model testing is made on the basis of the results from the initial CFA, it is often necessary to assess the validity of this modified model with new data. Despite this, testing the modified model with current data is an acceptable, if not ideal, procedure (Marsh, 1994). The justification for this relies partly on the practical difficulties involved if new datasets need to be collected for every new model that is to be tested (Mueller, 1996). Nevertheless, a clear direction for future research is to evaluate the modified model in other comparable samples. Also the sample size for female student participants was small (about 20%), and, due to this, gender group comparisons were not undertaken. Future research will need to evaluate the generalizability of the Student Engagement Scale in other undergraduate populations and with larger samples of undergraduate female students.
The study supported the construct validity of the subscales intended to represent the multidimensional conceptualization of the Student Engagement Scale. However, future research needs to confirm its reliability and add to the validity of the scale. The conceptualization of student engagement as a 9-component construct, rather than a 5-component construct, needs to be examined. Based on the findings of this study, future research needs to provide further replications of the model in diverse educational settings beyond a university and test model hypotheses using experimental methods.
Conclusions
From our CFA, we concluded that student engagement was a multidimensional construct with nine dimensions and supported the application of the Student Engagement Scale as a sound measure of undergraduate student engagement. The study provided support for invariance of the Student Engagement Scale across college and class year groups. In this sample, second and third year and above students did not substantially differ, nor did students from the Natural Sciences College and Social Science and Law College, in terms of the underlying construct of student engagement and the composition of these construct. For these reasons, the present research makes a useful contribution to the measurement of undergraduate student engagement. Evaluation of the students learning experience through culturally appropriate student engagement indicators will encourage individual institutions to increase access, and maximize achievement, for all who can benefit.
Footnotes
Acknowledgements
We are grateful to UQ’s institutional support. Moreover, we are indebted to the student participants of Jimma University who took their time and energy to complete the survey. Lastly, we would like to express our special appreciation to Prof. Peter Creed (Editor of the AJCD) for his invaluable contributions to shaping up this manuscript in its current form and providing critical comments on the applications of advanced statistics.
Declaration of Conflicting Interests
The author(s) declared no potential conflicts of interest with respect to the research, authorship, and/or publication of this article.
Funding
The author(s) disclosed receipt of the following financial support for the research, authorship, and/or publication of this article: This article is part of the PhD research project of the corresponding author, which is fully funded by the School of Education, the University of Queensland.