



Abstract
Anaplasma platys is an obligate intracellular bacterium that primarily affects dogs, but it can also infect humans. Our study aimed to standardize a quantitative real-time (q)PCR method using the citrate synthase gene (gltA) as a specific target for A. platys detection in naturally infected dogs. Primers (gltA84F and gltA84R) and probe (PLATYSp) were designed to amplify an 84-bp fragment based on the gltA gene sequences of A. platys available in GenBank. A total of 186 dog blood samples originating from the Brazilian state of Rio de Janeiro were tested by qPCR. Additionally, the same samples were tested by cytology and a nested (n)PCR that targeted the 16S ribosomal DNA to determine the performance of our qPCR method compared to these existing techniques. Among the samples tested with qPCR, 17.2% were considered positive, significantly more than detected by nPCR (14.0%). Under optical microscopy, inclusions were observed in platelets of 25.3% of the samples, and among these samples, only 33.9% were identified as positive for A. platys using qPCR. The qPCR technique proved to be more specific than cytology and to have superior sensitivity to nPCR for detecting A. platys in dogs. The development of this new qPCR method contributes to the advancement of research involving A. platys. Furthermore, it can be used to quantify the presence of this bacterium to evaluate the treatment of infected animals, or even as a more sensitive and specific tool for situations indicating possible clinical disease but with negative cytology.
Introduction
Anaplasma platys is an obligate intracellular, gram-negative bacterium and pleomorphic organism that affects dog platelets, causing canine infectious cyclic thrombocytopenia. This bacterium was once housed in the genus Ehrlichia, but it has been recently reclassified based on a phylogenetic analysis of the 16S ribosomal DNA (rDNA) gene. 15 Although this agent is important for small animal clinics, A. platys has a broad host range, including cats, 11 cows, 12 camels, 24 and humans.4,7,26
The most common diagnostic methods for canine infectious cyclic thrombocytopenia are the direct identification of the morulae in blood smears, serologic methods to detect antibodies, and DNA amplification by PCR. 17 The newer diagnostic tools are typically based on PCR, with advantages of greater sensitivity and specificity. Targets such as the heat-shock operon, 23S rDNA, and the citrate synthase gene have been used in diagnostic and phylogenetic studies, as well as in the characterization of A. platys strains.1,12,24 As well, a nested (n)PCR approach targeting the 16S rDNA gene has been reported.1,27 The quantitative real-time (q)PCR technique has been used to detect A. platys infection, 19 but this assay was based on the p44 polynucleotide that encodes the surface-exposed protein P44. 25 However, it is important to search for new targets that are less mutable between strains and that result in the lowest number of false negatives. Our study sought to standardize a qPCR technique targeting the gltA gene of A. platys for the detection of this agent in naturally infected dogs.
Materials and methods
Standardization of qPCR
Primers and probe were designed using commercial software a to examine the sequences of the gltA gene from A. platys available in GenBank (EU516387, AB058782, KC342665, JN121381, DQ525688, DQ525687, DQ525686, AY077620, AY530807, and AF478130). The characteristics of primers, combined and separate, and the probe were tested using commercial software, b and primer specificity was tested using both a software tool c and sequence alignment. The following selected primers amplified a 84-bp fragment of the gltA gene of A. platys: gltA84F (5′-GACCTACGATCCGGGATTCA-3′) and gltA84R (5′-TGGCGCAGTATACCCTTTTCTC-3′). The probe was PLATYSp (5′-FAM-TCTACCGCGGCATGCAGCTCTG-TAMRA-3′).
To optimize the primer and probe concentrations, concentration curves were generated using the positive control DNA as a template. The positive A. platys DNA sample (GenBank FJ755157) was obtained from a symptomatic dog with microscopic inclusions in platelets and confirmed by PCR targeting the 16S rDNA gene. This positive control has been characterized and represents the strain of A. platys circulating in Brazil. An existing assay d was used to determine the optimal primer concentration and the minimum primer concentration necessary to have the lowest quantification cycle (Cq) and maximum fluorescence signal, with the baseline subtracted (ΔRn) in the absence of nonspecific peaks for temperature of dissociation compared to the positive control. A PCR was performed with 4 replicates of each of the 9 conditions established for primer testing (300 nM/300 nM, 300 nM/600 nM, 300 nM/900 nM, 600 nM/300 nM, 600 nM/600 nM, 600 nM/900 nM, 900 nM/300 nM, 900 nM/600 nM, and 900 nM/900 nM) according to a commercial protocol. e The reactions were run in a total volume of 20 µL comprising 1× commercial PCR master mix f and 3 µL (100 ng/µL) of A. platys DNA using the following thermocycling conditions: 95°C for 10 min, 40 cycles of 95°C for 20 s, and 60°C for 1 min. A curve of dissociation was generated to verify the specificity of the amplifications.
After the standardization of the optimal concentrations of primers, the optimal probe concentration was determined. Single-probe assays were run in 4 replicates for each concentration (50 nM, 100 nM, 150 nM, 200 nM, and 250 nM). The PCR to determine the optimal concentration of the probe was performed in a final volume of 20 µL comprising 1× commercial PCR master mix, g 600 nM of each primer, 3 µL (100 ng/µL) of A. platys DNA, and the respective probe concentration. The selection of the optimal probe concentration for qPCR was based on the result of the lowest Cq and the maximum ΔRn obtained in the target detection assay. DNA extraction, mixture preparation, and sample pipetting were performed in separate locations, and filter tips were used in all steps to avoid contamination.
Analytical sensitivity and specificity of qPCR
The analytical sensitivity of qPCR was evaluated by using serial decimal dilutions of the amplicon cloned into plasmid. h Plasmid DNA concentration and purity were verified using a spectrophotometer. i The plasmid copy number versus Cq values were plotted to determine the analytical sensitivity of the qPCR based on commercial technology. j The number of copies ranged from 1 to 1 × 10⁴ per µL, with 5 separate dilution series performed for each point of the curve in triplicate. This assay was performed using an exogenous internal positive control reagent (termed E-IPC) k that contains a probe marked with a reporter dye l and a quencher. m The linear regression, along with the determination coefficient (R2) formed after determination of each point of the curve, can be used to evaluate whether the qPCR assay has been optimized. Each reaction’s efficiency was determined considering the slope of standard curve using the following formula: [Efficiency = 10(−1/slope) – 1]. 43
The specificity of the assay was evaluated using DNA from the following related organisms and other pathogens transmitted by ticks: Anaplasma phagocytophilum, Neorickettsia risticii, and Rickettsia rickettsii obtained from cellular cultures; Anaplasma marginale obtained from a blood sample of a naturally infected bovine; Babesia canis vogeli, Ehrlichia canis, and Hepatozoon canis obtained from blood samples of naturally infected dogs; and Theileria equi obtained from a blood sample of a naturally infected equine. All blood samples were obtained from animals with high parasitemia, in acute phase, with infection detected by microscopy and confirmed by the relevant specific molecular assay.13,18,23,28,30,34
Sampling
Between June 2011 and June 2012, 186 blood samples were collected from domestic dogs in the state of Rio de Janeiro, Brazil. Collection was performed by cephalic venipuncture, and the collected blood was placed in sterile tubes containing ethylenediaminetetra-acetic acid (EDTA). These samples were used to determine the performance of the new qPCR technique compared to both cytology (blood smear) and nPCR, which targeted 16S rDNA. These procedures were approved by the Ethics Committee on Research of the Federal Rural University of Rio de Janeiro (protocol 363/2013, process 23083.003990/2013-93) and the Ethics Committee on Animal Use (protocol 001/2014) from the same university.
DNA extraction
Genomic DNA was extracted from 300 μL of each blood sample using a commercial DNA purification kit, n according to the manufacturer’s recommendations. Next, the samples were quantified using a spectrophotometer i and diluted in aliquots of 100 ng/µL. As noted above, the positive blood control was obtained from a symptomatic dog with platelet inclusions. Nuclease-free water o was used as a negative control.
Evaluation of the qPCR performance
The E-IPC was added to the reaction to identify the presence of inhibitors. The experiment performed was a standard curve reaction carried out in duplicate using the same equipment used for qPCR. p The final volume was 20 µL comprising the following components: 1× E-IPC mix, k 1× E-IPC DNA, k 1× universal PCR master mix, k 600 nM of each primer (gltA84F and gltA84R), 250 nM of probe (PLATYSp), and 3 µL (~300 ng) of total DNA extracted from whole blood. The thermocycling conditions were as follows: 52°C for 2 min, 95°C for 10 min (denaturation), 40 cycles of 95°C for 15 s, and 60°C for 1 min. Samples were considered positive if they had a Cq of <40 and if the same result was observed between replicates.
Nested PCR
To evaluate the performance of qPCR, the same DNA samples extracted from whole blood were also submitted to nPCR using primers targeting the 16S rDNA gene that was performed as previously described. 27 The amplification products were subjected to electrophoresis in a 1.5% agarose gel. The electrophoresis was run for 60 min at 90 V (5 V/cm). The gel was stained with ethidium bromide (0.4 mg/mL) and visualized under ultraviolet light. q
Blood smear evaluation
Smears were prepared using the same whole blood samples used for DNA extraction and qPCR. The laminas were fixed in methanol, stained with Giemsa, and subjected to immersion microscopy (1,000×) to enable visualization of morulae in platelets. Approximately 100 fields were evaluated per lamina.
Statistical analysis
The McNemar test at a 5% significance level was used to measure the proportions of disagreement between qPCR and the other tests evaluated for the diagnosis of A. platys. All statistical analyzes were performed using BioEstat 5.0 software. 5
Results
After designing and testing the probe and primers, it was found that the sequences were specific to the target after analysis in silico using a software tool as well as the in vitro test using DNA from other members of family Anaplasmataceae. The optimal concentration chosen for the forward and reverse primers was 600 nM, which reached a Cq of 16.98 in the positive control (Supplemental Table 1, available at http://vdi.sagepub.com/content/by/supplemental-data). The primer concentration of 900 nM/900 nM (forward/reverse) achieved the best results in relation to the average value of Cq obtained (16.68) and ΔRn (3.830). However, after the analyses of the dissociation curve, a primer dimerization was observed, which led to the exclusion of this concentration. The optimal concentration of the probe was 250 nM, reaching an average Cq value of 16.33 in the positive control (Supplemental Table 2, available at http://vdi.sagepub.com/content/by/supplemental-data) and a higher ΔRn with the minimum Cq.
The detection limit of the qPCR was 1 copy of the plasmid per microliter in both tested curves. The determination coefficient of the 5 dilutions tested in the standard curve with the E-IPC was 99%, with a Cq range of 23.66 ± 0.17 cycles in the first dilution (1 × 10⁴ plasmid copies) to 37.77 ± 0.35 cycles in the last dilution (1 plasmid copy; Fig. 1). The amplification curve with the E-IPC had the same layout during the exponential phase, and the reaction efficiency was 96.06%. This finding demonstrates that, even in reactions with few targets, the reaction was a success. Without the E-IPC, the reaction efficiency of the PCR was 101.80%. The determination coefficient of the 5 dilutions tested in the standard curve with the E-IPC was 99%, with a Cq range of 23.52 ± 0.10 cycles in the first dilution (1 × 10⁴ plasmid copies) to 36.88 ± 0.40 cycles in the last dilution (1 plasmid copy; Fig. 2). As before, even in reactions with few targets, the reaction was efficient.

Standard curve plotted from serial decimal dilutions of plasmid DNA, containing the Anaplasma platys gltA gene and internal positive control reagents included in the reaction. The quantification cycle (Cq) value obtained by hydrolysis probe quantitative real-time PCR was plotted as a function of the initial number of plasmid copies.
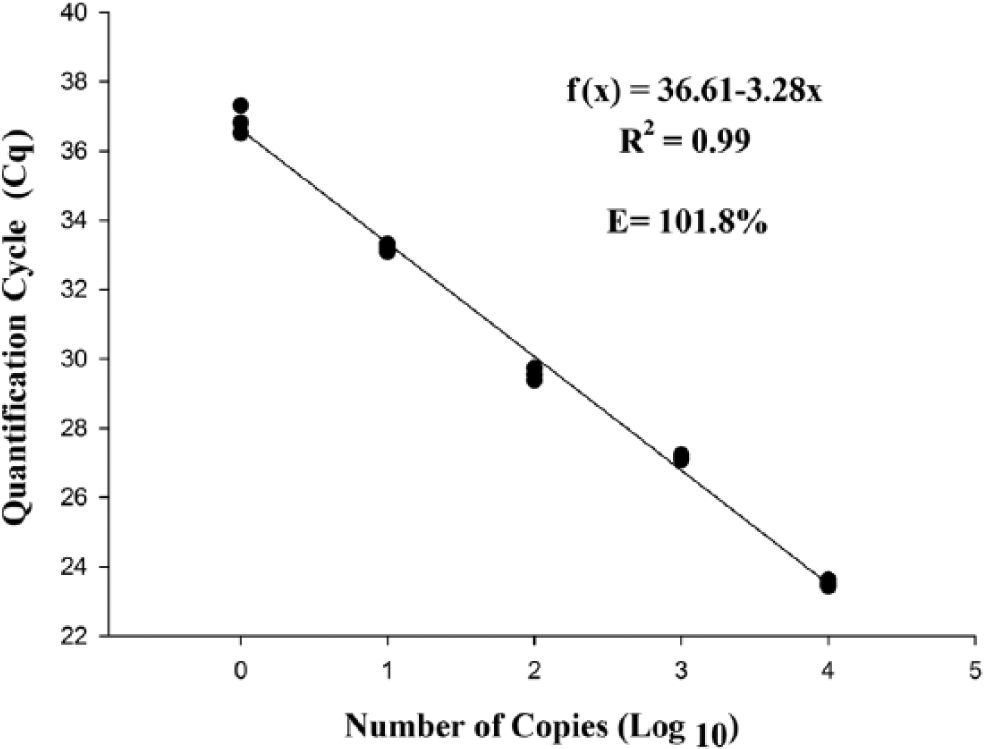
Standard curve plotted from serial decimal dilutions of plasmid DNA, containing the Anaplasma platys gltA gene, without the addition of internal positive control reagents. The quantification cycle (Cq) value obtained by hydrolysis probe quantitative real-time PCR was plotted as a function of the initial number of plasmid copies.
Regarding qPCR specificity, only A. platys DNA was amplified when other organisms were tested in vitro. The A. platys hydrolysis probe qPCR assay proved to be efficient in the amplification of a 84-bp fragment from the gltA gene in clinical samples. Among the samples tested using qPCR, 17.20% (n = 32/186) were positive, whereas only 13.98% (n = 26/186) amplified the target when using nPCR. The average value of Cq observed in positive samples was 28.83 ± 6.48, with a range of 18.79–38.58 cycles. In all reactions, the E-IPC amplified properly, producing an average value of Cq of 27.77 ± 0.06, with a range of 27.71–27.90 cycles. According to the equation generated by the standard curve, the detection of the number of A. platys copies ranged from 1 to 234,188, with Cq values of 38.58 and 18.79, respectively (Table 1).
Relationship between the quantification cycle (Cq) and the Anaplasma platys gltA gene copy number obtained from quantitative real-time PCR using samples from naturally infected dogs.*

Volume of blood was 300 µL.
All positive nPCR samples were found to be positive when using qPCR. However, nPCR did not detect the target fragment in 18.75% (n = 6/32) of the positive samples identified using qPCR (p = 0.0313; Table 2). Likewise, the results of qPCR compared with the results of blood smears (Table 2) showed that there was a significant difference (p = 0.0455) between the discordant pairs.
Analysis of the disagreement between the results from the quantitative real-time (q)PCR and nested (n)PCR assays and blood smear tests.
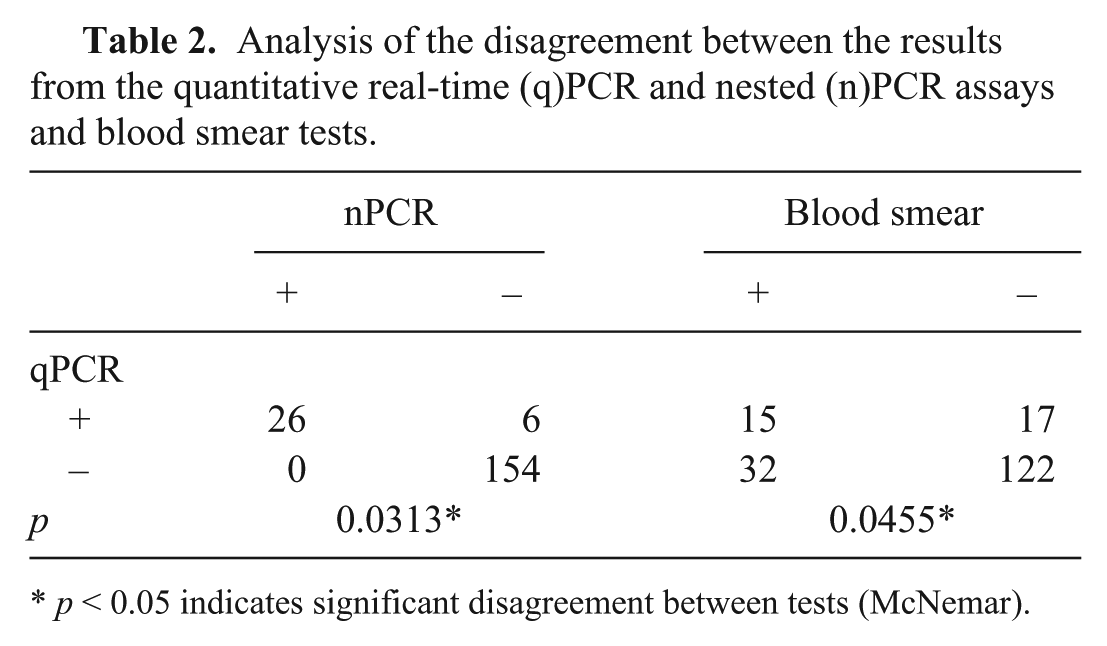
p < 0.05 indicates significant disagreement between tests (McNemar).
In the blood smears evaluation, 25.27% (n = 47/186) of the samples showed basophilic inclusion suggestive of parasitism in platelets. However, among these samples only 33.91% (n = 15/47) were positive for A. platys by qPCR (Table 2).
Discussion
This study presented the development of a hydrolysis probe qPCR assay targeting the A. platys gltA gene for diagnostic and quantitative detection of A. platys in dog blood samples. Typically, approaches to the molecular detection of A. platys focus on the 16S rDNA gene as a target.1,14,27 This gene is commonly used in molecular diagnostic methods because of the high conservation of the gene and the multiple copies in the bacteria genome, 33 which makes the molecular technique more sensitive and reliable. These characteristics were used in the choice of the 16S rDNA gene as a comparative target to the gltA gene used in the qPCR. The gltA-based qPCR developed in our study was more sensitive compared with the nPCR targeting the 16S rDNA gene, even though the gltA gene is a single-copy gene, as usually observed in rickettsial agents. 6 This fact demonstrates that the primers and probe designed for our study had high sensitivity and specificity in the detection of A. platys in dog blood samples.
The quantitative reverse transcription (qRT)-PCR targeting 16S rRNA has been used previously as a molecular diagnostic tool.37,39,40 The qRT-PCR test is considered a robust diagnostic method because ribosomes and rRNA are present in a higher copy number, because of their role in the translation of genetic code, than genes on the chromosome. 37 However, a RNA-based technique is demanding because of the RNA degradation problem and the difficulty in handling RNA samples. 38 The use of a DNA-based method for the detection of hemoparasites, as used in this and other studies,12,14,19,22 is a less demanding approach. The qPCR technique can be used to monitor amplification products during the reaction and eliminate post-amplification processing, thus decreasing the turnaround time for the assay. 16 In addition to the operational advantages, the qPCR technique has a quantitative nature and is both sensitive and reproducible, potentially replacing direct PCR assays in diagnostic routines. 32
The primers and the probe used in our study were designed to provide high specificity and sensitivity. At the end of the probe, there is a purine (guanine), whereas in the E. canis and E. chaffeensis sequences, there are 2 purines (adenine). The pairing of these bases blocks the formation of hydrogen bonds between the bases because of steric hindrance. The bulky molecular structure of the purines 45 interferes with the hybridization of the DNA strand. We also sought the ideal concentration for the primers and the appropriate conditions to avoid the formation of primer dimers, and other factors that may interfere with PCR. 45
Our results showed that the potential inhibitors in the reaction were absent because of adequate amplification of E-IPC used in this assay. False-negative results in PCR may be related to the presence of inhibitors, problems with assay sensitivity, or unexpected pipetting errors. 10 The use of an internal positive control is common in reaction optimizations, and it is described as an appropriate tool because it determines whether the absence of specific amplification is actually a result of the absence of the target DNA. 36
Marked thrombocytopenia and low parasitemia occur in dogs during the initial period of A. platys infection. For this reason, specific and sensitive tests are needed to identify this etiologic agent. 16 When the nPCR was analyzed in parallel with the qPCR, it was clear that both could detect A. platys DNA fragments in dog blood samples with high parasitemia. However, the qPCR was more sensitive than the nPCR because the qPCR was able to detect the target in samples with low parasitemia. Although nPCR has been reported as a technique with high sensitivity, 27 our results demonstrate a higher sensitivity with the newly developed qPCR technique. Additionally, the risk of sample cross-contamination is low in qPCR tests and high in nPCR assays. 3
The adoption of a standard curve to evaluate qPCR efficiency is considered a quality benchmark for the assay, 43 and it is recommended in guidelines for qPCR experiments. 8 It has been shown that the optimum efficiency for qPCR assays range from 90% to 110%. 44 The efficiency for the qPCR developed in our study was 96.06%, which is considered desirable for adequate target detection in a qPCR reaction. 44 The curve without the E-IPC generated in this study had a higher efficiency (101.80%). This demonstrates that the presence of the E-IPC can interfere with the reaction because of the occurrence of competition, and thus lower the amplification efficiency of qPCR, a finding that has been previously reported. 21 However, this does not diminish the role of the E-IPC, which in our study was useful in confirming the absence of inhibitors in the reaction, maintaining the credibility of qPCR.
One of the A. platys detection methods commonly used is the search for morulae inside platelets in a blood smear, 17 which is a rapid and inexpensive technique, but which offers only low sensitivity. 41 Other studies have shown a difference in performance between a molecular method and blood smears for detection of A. platys. 35 In our study, the concordance of qPCR with the blood smear was low, demonstrating the accuracy of qPCR, as observed in the literature. 31 Additionally, whereas blood smear and nPCR approaches can detect A. platys, they cannot provide quantitative data, 16 unlike the qPCR developed in our study.
The false-positive cytology results may be explained by the occurrence of granulations in platelets a result of platelet activation, 17 dense granules, nuclear remnants of megakaryocytes, 29 technical artifacts, or inclusions of E. canis in platelets.2,29 We found some samples to be negative using the blood smear technique and positive by qPCR. This finding can be explained by the presence of thrombocytopenia during infection, which interferes with the visualization of microorganisms by microscopic observation 17 because of the cyclic parasitemia behavior of A. platys. Bacteremia is usually found to be low because of difficulty with detecting the bacteria in blood smears where <1% of platelets may be infected.20,27
Our study describes the development of a hydrolysis probe qPCR assay targeting the gltA gene for the detection of A. platys. Reliable and accurate diagnosis of canine infectious cyclic thrombocytopenia is necessary to ensure correct treatment for the animal and to monitor the treatment of infected animals. Additionally, research has shown that qPCR can be used as a suitable tool for monitoring parasite load during hemoparasite investigations.9,42 As well, qPCR is useful in the evaluation of therapy for diseases, and it is capable of detecting and quantifying parasitism, even during the chronic phase of infection. 9 In our study, it was observed that the developed qPCR method can detect this parasite, even in samples with small copy numbers, thus demonstrating that this assay can be useful in monitoring the treatment of both symptomatic and asymptomatic animals. The qPCR method we have developed is more specific and more sensitive than cytology and is more sensitive than the nPCR approach used for comparison.
Footnotes
Authors’ contributions
CB da Silva, MS Pires, M Peckle, HA Santos, and CL Massard contributed to conception and design of the study, and contributed to acquisition, analysis, and interpretation of data. JAR Vilela contributed to conception and design of the study, and contributed to acquisition of data. RL da Costa and GLV Vitari contributed to design of the study, and contributed to analysis and interpretation of data. LA Santos contributed to design of the study, and contributed to analysis of data. All authors drafted the manuscript; critically revised the manuscript; gave final approval; and agreed to be accountable for all aspects of the work in ensuring that questions relating to the accuracy or integrity of any part of the work are appropriately investigated and resolved.
a.
Primer Express 3.0, Thermo Fisher Scientific, Waltham, MA.
b.
Oligo Explorer 1.2, Gene Link Inc., Hawthorne, NY.
c.
primerBLAST, NCBI, Bethesda, MD.
d.
SYBR Green assay, Applied Biosystems, Carlsbad, CA.
e.
Getting Started Guide of Primer Express Software 3.0, Applied Biosystems, Foster City, CA.
f.
SYBR Green PCR master mix, Applied Biosystems, Carlsbad, CA.
g.
TaqMan universal PCR master mix, Applied Biosystems, Foster City, CA.
h.
pGEM-T Easy vector system, Promega Corp., Madison, WI.
i.
Spectrophotometer Nanodrop ND-2000, Thermo Fisher Scientific, Wilmington, DE.
j.
TaqMan Technology, Applied Biosystems, Foster City, CA.
k.
TaqMan exogenous internal positive control reagents (VIC probe), Applied Biosystems, Foster City, CA.
l.
VIC, TaqMan Technology, Applied Biosystems, Foster City, CA
m.
TAMRA (carboxytetramethylrhodamine), TaqMan Technology, Applied Biosystems, Foster City, CA.
n.
Wizard genomic DNA purification kit, Promega Corp., Madison, WI.
o.
Ambion nuclease-free water, Thermo Fisher Scientific, Wilmington, DE.
p.
StepOnePlus real-time PCR system, Applied Biosystems, Foster City, CA.
q.
L-PIX Touch system, Loccus Biotecnologia, Cotia, São Paulo, Brazil.
Declaration of conflicting interests
The author(s) declared that there is no conflict of interest with respect to the research, authorship, and/or publication of this article.
Funding
The author(s) disclosed receipt of the following financial support for the research, authorship, and/or publication of this article. The National Council for Scientific and Technological Development and the “Carlos Chagas Filho” Foundation for Research Support of the State of Rio de Janeiro provided financial support.