




Abstract
Infection with bovine leukemia virus (BLV) results in economic loss because of reduced productivity, especially reduced milk production, and early culling. In the United States, studies in 1996, 1999, and 2007 showed BLV infection to be widespread, especially in dairy herds. We updated information herein on BLV seroprevalence in the United States, using samples submitted for testing and found negative for antibodies for Brucella by the Kentucky Eastern Regional Federal Brucellosis Laboratory. From October 2014 through August 2015, 2,000 samples from all regions of the contiguous United States were selected and tested for BLV antibodies by enzyme-linked immunosorbent assay. The overall percentage of samples positive for BLV antibody was 38.6%. Based on the animal’s origin, the percent positive by region ranged from 32.5% (Mountain West region) to 54.3% (Northeast region; p < 0.05). The positive rate for slaughter plants that processed mainly dairy animals (dairy plants; 47.6%) was higher than the positive rate at slaughter plants that processed mainly beef animals (beef plants; 33.6%; p < 0.05). The results suggest that BLV infection remains widespread in all regions of the United States and that rates may differ between beef and dairy cattle.
Species Bovine leukemia virus (BLV) (family Retroviridae, subfamily Orthoretrovirinae, genus Deltaretrovirus) infects cattle and is the cause of enzootic bovine leukosis. Three stages of the disease are described: asymptomatic or aleukemic (AL), persistent lymphocytosis (PL), and leukemia or lymphoma. Although 30–70% of infected animals may develop PL, leukemia or lymphoma is restricted to a smaller fraction of ~5%. 6 BLV infections can impact animal health and productivity resulting in economic loss to producers. 5 The virus can be detected in the milk of infected animals. 4 Given the direct economic impact on cattle productivity and potential public health concerns, some countries have chosen to eradicate BLV from their cattle populations.1–3,7 Several European regions started controlling the virus early in the 1960s, and 22 countries have completed eradication of the agent. 1 No commercial vaccine is available for the disease. Although the most efficient control measure is testing and elimination of positive animals, the most-used plan consists of stringent management methods (EFSA-AHAW, 2015, Enzootic bovine leukosis. Available at: https://goo.gl/ap6K7g). National Animal Health Monitoring System (NAHMS) studies in 1996, 1999, and 2007 indicated that the viral infection was widespread in the U.S. cattle population, especially among dairy cattle in the Southeast. Overall, 80% of U.S. dairy herds included animals that were BLV antibody positive and within-herd infection rates were typically ~40%.8–10 The objective of our cross-sectional epidemiologic study was to update information on the percentage of animals with antibodies to BLV in the United States.
Samples for the brucellosis surveillance program were submitted to 1 of 2 laboratories based on the geographic location of the 9 slaughter plants collecting samples. Samples used in this study were from 5 of the 7 slaughter plants submitting samples to the Kentucky Eastern Regional Federal Brucellosis Laboratory (Frankfort, Kentucky) and found negative on testing for Brucella antibodies (Fig. 1). The samples eligible for testing represented 51.9% of the total samples collected for the surveillance program and tested in both laboratories. The number of samples per plant was reflective of the relative slaughter volume among the 5 plants. At an assumed BLV prevalence of 30% of the population, a desired margin of error of 2%, and a 95% confidence, ~2,000 samples would be required. From October 2014 through August 2015, 200 samples were selected throughout each month and shipped to the U.S. Department of Agriculture, Agricultural Research Service laboratory (National Animal Disease Center, Ames, Iowa) for testing for BLV antibodies.

Number of samples for each state in the contiguous United States. Gray scale determines the 6 regions: Pacific West, Mountain West, Upper Midwest, South Central, Southeast, and Northeast. State of location for each processing plant is marked with an asterisk.
Samples were individually filtered using the 0.2-μm Millex-GV filter unit (Merck Millipore, Ireland). All of the samples were banked and held at −20°C until tested. Samples were tested individually by leukosis serum X2 Ab ELISA (IDEXX Laboratories, Hoofddorp, The Netherlands). Results were classified as positive, negative, or suspect based on the manufacturer’s recommendations. Samples with suspect results were re-tested to confirm their status. Samples classified as suspect after re-testing were considered positive for the analysis. The ELISA results along with information about the sampled animals including state of origin (based on backtag number) were entered into a spreadsheet and converted to a SAS (SAS Institute, Cary, NC) dataset for analysis.
Regions were defined based on the state of origin of the animal (Pacific West: CA, OR, WA; Mountain West: MT, ID, WY, NV, UT, CO, AZ, NM; Upper Midwest: NE, ND, MN, WI, SD, IA, KS, MO, IL, IN, MI, OH; South Central: OK, TX; Southeast: AR, LA, MS, AL, GA, FL, SC, NC, TN, KY, WV, VA, MD, DE; and Northeast: PA, NY, VT, CT, NJ, RI, MA, NH, ME). The slaughter plants from which the blood samples were collected were categorized into 3 types based on the annual mix of animals processed. Facilities in which ≥70% of the animals processed were beef cows were classified as “beef plants,” whereas facilities in which ≥70% of animals processed were dairy cows were classified as “dairy plants.” Facilities not fitting these criteria were classified as “mixed plants.” The prevalence of BLV antibodies was compared based on region as well as on plant type. Contingency tables were analyzed using software (SAS). The mean prevalence by region was compared using a Tukey correction for multiple comparisons. Statistical analyses with p ≤ 0.05 were considered significant.
Overall, 1,996 samples of the original 2,000 samples had sufficient serum and were available for testing (Table 1). The overall percentage of samples positive (positive and suspect results combined) for BLV antibody was 38.6%. Three samples were classified as suspect. The percentage of samples positive differed by region of origin overall (p < 0.001). Specifically, the prevalence among samples from cattle from the Northeast (54.3%) was higher than for samples from cattle from either the Mountain West (32.5%) or the Upper Midwest (35.5%; p < 0.05). The percentage of samples positive was significantly higher from plants that processed predominantly dairy cattle (47.6%) compared to plants that processed predominantly beef or mixed cattle (33.6% and 33.3%, respectively; p < 0.05; Table 2). This finding is consistent with earlier work from NAHMS estimating that 43.5% of dairy cows were infected. 10 However, the 33.6% positive rate in slaughter cattle samples from slaughter plants that processed predominantly beef cattle is higher than that reported by NAHMS in 1999 wherein 10.3% of beef cows tested in a study of 403 cow–calf operations were positive for BLV antibody. 8
Number and percentage of samples positive for bovine leukemia virus antibody by U.S. region.

Numbers in parentheses are 95% confidence intervals. Values with different superscripts differ with p < 0.05.
Number and percentage of samples positive for bovine leukemia virus antibody by type of slaughter plant.
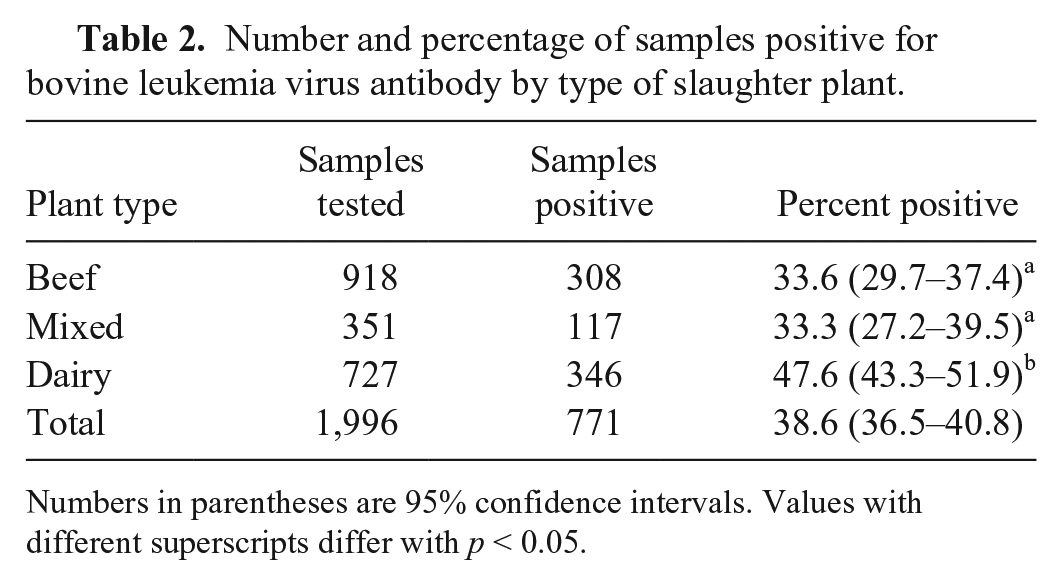
Numbers in parentheses are 95% confidence intervals. Values with different superscripts differ with p < 0.05.
The results from our study suggest that BLV infection is widespread in the United States cattle population. The data are insufficient to determine infection rates separately for beef and dairy cattle. However, based on the difference in percentage of samples positive by plant type, these results are consistent with previous studies reporting that the infection rate is higher in dairy cattle than in beef cattle.8–10 Knowing the current status of the distribution of BLV infection may be useful in planning control of the disease in the United States.
Footnotes
Acknowledgements
We thank the staff at the Kentucky Eastern Regional Federal Brucellosis Laboratory including Christopher Cracraft, Shanna Wilburn, April Shannon, Lisa Burke, Megan Zinner, Phyllis Bays, and Jeffery Gifford for logistic support in identifying and shipping serum samples to the laboratory for testing. We also thank Dr. Mark Camacho for his technical assistance in setting up the collaboration between USDA:ARS and the laboratory, and Dr. Kathy Simmons and the National Cattlemen’s Beef Association for their interest in this project and their work to promote cattle health research projects at USDA-ARS.
Declaration of conflicting interests
Disclaimer: Mention of trade names or commercial products in this publication is solely for the purpose of providing specific information and does not imply recommendation or endorsement by the U.S. Department of Agriculture.
Funding
The authors received no financial support for the research, authorship, and/or publication of this article.