



Abstract
Growth is important for the long-term success of a business. Regrettably, the impact of family influence on firm growth is largely neglected. We examine whether family firms have a higher growth rate than their nonfamily counterparts. Based on a large sample of firms across 43 countries over a 10-year period, we show that family firms on average have higher growth rates than nonfamily firms, and this positive effect is greater for family firms operating in strong national institutional environments which are less corrupt, more democratic, more subject to rule of law, and have effective government policies. We also find that the positive effect of family influence on firm growth varies significantly across different types of family firms and different business cycles. These findings show that family control has an economically significant impact on growth rates and important implications for both family firm theory and practice.
Financial returns and revenue growth are important aspects of firm success (Davidson et al., 2006). The former has been well-studied by scholars of family business in dozens of articles and several meta-analyses (Chen et al., 2014; Miller et al., 2007; Wagner et al., 2015). However, the literature on family firm growth is far less developed. According to a survey of over 300 variables examined in empirical family business studies (Yu et al., 2012), growth has been very much neglected and indeterminate as to its relationship with family influence (Evert et al., 2016). The common theoretical view is that family influence changes the strategic behavior of the family firm (Chua et al., 1999), thereby affecting its growth. However, the nature and magnitude of this influence remains unclear: specifically, whether family firms grow faster or slower than their nonfamily counterparts remains unknown. Empirical evidence on the topic would not only enrich our knowledge of family business behavior but also improve policy options.
In fact, vying perspectives of family firms surface conflicting views of family firm growth. One suggests that such firms will grow more slowly due to a desire to maintain current family control—the temporally restricted view, as family members use their publicly traded firms for private benefit (Le Breton-Miller & Miller, 2018; Pérez-González, 2006; Villalonga & Amit, 2006). In sharp contrast, the transgenerational view suggests that families will invest generously in their firm and its growth due to the temporally extended benefits that will bring to their offspring, the firm, and its stakeholders (Arregle et al., 2007; Eddleston & Kellermanns, 2007; Miller et al., 2008). Both views embrace the socioemotional wealth (SEW) perspective (Gómez-Mejía et al., 2007; Gomez–Mejia et al., 2014). Indeed, Miller and Le Breton-Miller (2014) distinguish between restricted and extended notions of SEW, with the current SEW priorities relating to the former and the transgenerational SEW priorities referring to the latter.
To shed light on family firm growth, we analyze the growth rates of 5265 publicly traded firms from 43 countries in 33 industrial sectors from 2007 to 2016. Specifically, we examine whether family firms grow more—the transgenerational view, or less—the current view, than nonfamily firms, and also identify the institutional country-level governance indicators under which family firms can achieve superior growth. To that end, we develop a model of family firm growth and test it across different institutional environments. In so doing, we construct absolute and relative firm growth proxies using net sales and total assets to account for the diversity in growth measurements. We also adopt an overall index of country-level governance based on indicators from the World Bank, along with individual dimensions of this index to capture the heterogeneity of institutional environments around the world. To mitigate endogeneity and sample selection bias, we exploit the longitudinal nature of our data and employ panel data and 2SLS estimators. We also examine variations of the family business effect on firm growth across different types of family firms, industries, and over business cycles. In addition, a battery of robustness tests is performed to rule out possible alternative explanations for our findings.
We find that on average family firms exhibit a significantly higher growth rate than nonfamily firms, thus supporting the transgenerational view. Moreover, a positive country-level institutional environment of democratic freedom, government effectiveness, corruption control, and political stability positively moderates the effect of family influence on family firm growth.
The economic impact of family control on firm growth rates is substantial: on average family firms grow 2% more than nonfamily firms (i.e., about 50% more than their counterparts). Moreover, a positive institutional environment is linked to even more superior growth, close to 3%. These results demonstrate the significant effect of a family’s transgenerational perspective of its business, one that flourishes especially in positive, less uncertain institutional environments, thereby enabling family socioemotional and economic priorities to be realized via the future growth of the business.
This paper contributes to the literature in several ways. First, most studies have analyzed the financial returns of family firms. Growth is a key concern given the common view that family firms sacrifice growth in favor of family influence—a basis for much of the theorizing on this type of organization (Berrone et al., 2012). The few studies of growth are cross-sectional (Campopiano et al., 2019; Lee, 2006; McConaughy & Phillips, 1999), and have focused mainly on small- and medium-sized entrepreneurial firms (Chen et al., 2014; Chrisman et al., 2004). We arbitrate between and condition the application of two core SEW perspectives of family control: the current or temporally restricted view and the transgenerational or temporally extended view (Miller & Le Breton-Miller, 2014). To the best of our knowledge, this is the first longitudinal study supporting the transgenerational view of family business growth. In so doing, it opens an agenda for future research on the growth of firms with concentrated ownership.
Second, we identify institutional conditions around the world leading to the extraordinary growth of family firms. Where democracy, effective government, the rule of law, and political stability prevail, investing in the growth of the family firm is better able to achieve long-run economic and socioemotional family objectives than where institutional uncertainty abounds, and where the extraction of private benefits is a superior family option, which in turn can retard firm growth (Amit et al., 2015; Peng & Jiang, 2010; Soleimanof et al., 2018). Thus, our study reveals that the magnitude of the relationship between family influence and firm growth is dependent upon the institutional context, thereby bridging the family business growth literature with that on political and economic institutions. It also identifies variations of family business growth across different types of family firms, countries, and business cycles, providing a novel understanding of the complexity of family business growth.
Theory and Hypotheses: Current Control versus Transgenerational Control
We present two opposing sets of arguments concerning the growth of family firms drawn from two dimensions of SEW—namely maintaining current control, a more restrictive perspective, and achieving transgenerational control, a more temporally extended perspective (Casson, 1999; Chua et al., 1999; James, 1999; Miller & Le Breton-Miller, 2014). 1
Stunted Growth: Maintaining Current Control
The current control perspective argues that family firm owners will act to preserve control in the hands of the family and resist taking risks that may jeopardize that (Gomez-Mejia et al., 2013; Gómez-Mejía et al., 2007; Kotlar et al., 2018). Thus, they may ignore new business opportunities and innovate less if this threatens family control (Block, 2012; Gomez-Mejia et al., 2010; Patel & Chrisman, 2014). If family members wish to retain control of their firms, they will be less likely to incur debt (Mishra & Mcconaughy, 1999; Molly et al., 2019), or to issue shares that dilute their control (Villalonga & Amit, 2009; Wu et al., 2007). In addition, family members may differ in their priorities (Kotlar & De Massis, 2013), resulting in conflicts that drain the firm of resources required for growth.
It has also been argued that family firms can lack effective management because family top executives are drawn from a smaller talent pool than in nonfamily firms (Bertrand & Schoar, 2006; Mehrotra et al., 2013; Miller et al., 2015). Such executives may not have the skills to successfully orchestrate growth strategies. Bertrand and Schoar (2006) and Pérez-González (2006) suggest that family members can appropriate private benefits from the business via nepotism, favoritism, and entrenchment such that incompetent executives remain in their position despite poor results. Bloom and Van Reenen (2007) agree, finding that compared to family firms, nonfamily firms are more likely to adopt modern management techniques to be more efficient and innovative. Also, family firms are said to employ less sophisticated financial management techniques, except when they have an outside director or a nonfamily member involved in financial decision-making (Filbeck & Lee, 2000). These factors, reflecting a desire to maintain current control, are likely to stunt family business growth.
Superior Growth: Transgenerational Control
The transgenerational control perspective presents an opposite point of view of the growth potential of family firms (Miller & Le Breton-Miller, 2014, Miller & Breton-Miller, 2005). Kappes and Schmid (2013) suggest that families, wishing to preserve their firm for the family and its later generations, avoid short-term expedients to grow current profits and generously invest in the future of their companies. In other words, they promote conditions favoring future growth over current profits, thereby avoiding a “quarterly earnings mentality.”
As the family legacy and the well-being of subsequent generations may be tied to the robustness of the business, some family members are keen to ensure firm continuity across generations. They may do so by investing in the future of the business, strengthening relationships with employees via assiduous training and superior working conditions (Reid et al., 1999), and building long-term, flexible relational connections with outside stakeholders such as suppliers and customers (Orth & Green, 2009). They also may generously invest in renewing the business via new product offerings and market extensions (Miller, Le Breton-Miller & Lester, 2007).
Assiduous pursuit of a transgenerational sustainability also leads to the accumulation of unique resources. Habbershon and Williams (1999) highlight access to family financial capital, cheap and loyal family labor, a motivated and stable management team, and social capital in the form of relationships with the community, including government institutions (Arregle et al., 2007). Due to their transgenerational concern for the family’s reputation, some family firms also have an incentive to promote and sustain family-branded products (Craig et al., 2008). In addition, in view of the relative stability and authority of family governance, family firms can form enduring relationships with other family businesses to promote joint commercial interests (Le Breton-Miller et al., 2011; Miller & Breton-Miller, 2005; Salvato & Melin, 2008). And thanks to their discretion and independence from short-term pressures from public shareholders (Ali et al., 2007), family executives are able to make bold decisions to adapt to new conditions when the environment changes or when important new growth opportunities arise (Zahra et al., 2004). Finally, given their future-oriented investment horizons (Kappes & Schmid, 2013), owners are more likely to eschew opportunism (Blair & Stout, 2006) to embrace a more growth-oriented culture.
Stunted Growth versus Superior Growth
Clearly, the desire to maintain current control versus transgenerational control of family firms leads to opposite conclusions regarding firm growth (Miller & Le Breton-Miller, 2014). And the empirical findings to date do not help to resolve this debate. For example, whereas the cross-sectional analysis of S&P 500 firms by Lee (2006) reveals that family firms on average exhibit higher growth rates than nonfamily firms, larger cross-sectional studies of family firms from 35 countries by Campopiano et al. (2019) and of entrepreneurial firms from 80 countries by Chen et al. (2014) report a negative effect of family influence. In other words, “the jury is still out.” That being said, the firm growth literature suggests that high growth is largely a result of future-oriented investments in innovation and enduring relationships with employees, clients, suppliers, or the community (Del Monte & Papagni, 2003; García-Manjón & Romero-Merino, 2012; Unger et al., 2011). Firms that consistently invest in innovation experience higher growth by introducing new products, services, and business models (Geroski & Machin, 1992; Yasuda, 2005). Similarly, people-related investments boost employee motivation, engagement, and productivity (Bakker & Schaufeli, 2008; Oswald et al., 2015) and create strong organizational identities (Dorrenbacher et al., 2017), thereby boosting growth (Goedhuys & Sleuwaegen, 2016; Grover Goswami et al., 2019).
Family firms are also said by some to excel in investments in innovation vis-a-vis nonfamily firms (Bergfeld & Weber, 2011; Kappes & Schmid, 2013). Moreover, they may produce more innovation output than others (De Massis et al., 2015; Duran et al., 2016). Family firms also invest more in human capital in the form of union relations, employee involvement and protection, retirement benefits, cash profit sharing, health and safety than nonfamily firms (Kang & Kim, 2020; Sanchez‐Bueno et al., 2020). Moreover, they are known for investing in superior relationships with clients, suppliers, and community (Baù et al., 2019; Lamb & Butler, 2018; Le Breton-Miller et al., 2011). Thus, we argue that many family firms, thanks to their transgenerational sustainability regarding superior innovation- and employee-related investments, are more likely to achieve a higher growth rate than their nonfamily counterparts.
The Role of Institutional Environments
Whereas H1 predicts a positive impact of family influence on firm growth, the institutional environment may have an important moderating effect. This is in line with the prior research that has emphasized the theoretical and practical importance of institutional environments for family firm decision-making processes (Ahuja et al., 2018; Banalieva et al., 2015; North, 1990; Peng & Jiang, 2010).
Specific conditions in the macro institutional environment may contribute to family firm growth. Country-level governance dimensions such as democratic freedom, government effectiveness, regulatory quality, rule of law, corruption control, and political stability may have a profound effect on family firm growth—a core distinguishing priority of family firms (Lumpkin & Brigham, 2011; Miller & Breton-Miller, 2005; Miller et al., 2009)—because they influence the degree to which family owners and executives can embrace their natural transgenerational orientation toward their companies. Specifically, we shall argue that in the normal course, families want their companies to serve as vehicles for the future economic, vocational, and social benefits of family members. This will induce them to invest generously in their business, its people, and its products to build a promising future for the family inside the business (Kappes & Schmid, 2013; Miller & Breton-Miller, 2005). That can augur well for extraordinary family firm growth and give them a natural advantage over their nonfamily counterparts. However, where democratic institutions, government effectiveness, the rule of law, and political conditions are weak, an uncertain environment prevails. This makes it less possible for families to follow their natural orientation to achieve transgenerational control of their business, which faces abundant risks within such contexts (Kao, 1993). Instead, they are more likely to fulfill family objectives by taking resources out of the business, tunneling, and building a family nest-egg separate from their companies (Morck & Yeung, 2003, 2004), thereby decreasing the growth rate of family firms. Countries with democratic institutions, government effectiveness, the rule of law, and political stability can be said to benefit from strong, that is stable and promising, political and economic environments. There, the orientation to achieve transgenerational control of many family firms will induce them to invest in their companies to achieve superior growth. Conversely, they are likely to grow more slowly in unstable institutional environments, where politics and economics are uncertain, costs of doing business are high, and where it is safer for family owners to extract private benefits rather than invest in their companies’ growth. Therefore:
Data
Sample
To examine the relationship between family influence and firm growth, we constructed a worldwide sample of publicly traded firms. We employ the NRG Metrics database’s Family Firms dataset. This dataset is created by a team of expert analysts who manually enter, review, and cross check data with senior analysts, who perform frequent random audits. NRG Metrics sources publicly available documents such as annual reports, corporate governance reports, firm presentations, SEC filings, and press releases. Customized software programs verify all levels of data entry for inconsistencies and errors using a combination of quality control measures (NRG documents). NRG Metrics has been validated in both management and finance literatures (Cho et al., 2019; Delis et al., 2019).
The dataset covers 7000 publicly traded (active and nonactive) firms from America, Europe, Asia, and Africa beginning in fiscal year 2007. All financial firms were excluded following common practice (Barontini & Bozzi, 2018). We collected financial and accounting firm-level data from Thomson-Reuters Datastream. Country-level macroeconomic data were taken from the World Bank (see Measures section). In total, our final sample comprises 5265 publicly traded manufacturing and nonmanufacturing firms from 43 countries covering the period 2007–2016, inclusive.
Three types of publicly traded companies are present in our dataset: (1) companies in the dataset for the entire period of analysis (51.62%); (2) companies that enter the sample during the period (36.14%); and (3) companies that exit during the period (12.24%) because they become privately held, merged, liquidated, or inactive. This data structure enables us to mitigate survivorship bias (Elton et al., 1996).
The largest portion of publicly traded firms in our sample cover Anglo-Saxon (Australia, Canada, UK, USA, and New Zealand) and European countries, amounting to 43% and 39% of the sample. Asian countries represent 12.5% of the sample, and 5.5% are other countries. The largest fraction of family firms, 22%, come from the USA.
Over half of the samples are in industrial, consumer goods, and consumer services sectors (57%), while the rest fall into the basic materials, healthcare, oil and gas, technology and communications, and utilities sectors. Family control is a common characteristic of firms belonging to a broad array of manufacturing industries in our sample. 2
Measures
Dependent Variable
Several measures of firm growth appear in the literature: sales, total assets, profitability ratio, employment, and value added (Audretsch et al., 2014; Reuber & Fischer, 2002). Davidson et al. (2006) argue that sales growth is the more appropriate proxy of firm growth as it is less subject to accounting manipulations and short-term market reactions. We measure firm growth as the log-difference of net sales for company i from country c between time t and t − 1 (García-Manjón & Romero-Merino, 2012; Rahaman, 2011). Adoption of the 2-year and 3-year firm growth rates did not alter our results.
Independent Variables
Many studies operationalize a family firm by the ownership stake of the controlling family (Anderson & Reeb, 2003a; Barontini & Caprio, 2006; Faccio & Lang, 2002). Others use family management (Sciascia et al., 2013; Zahra et al., 2007). And still others require a substantial ownership stake as well as managerial presence (Chrisman & Patel, 2012; Chua et al., 1999; Kotlar et al., 2014, 2018). Accordingly, our Family variable captures fractional equity ownership of the founding family and/or the presence of family members serving on the board of directors. It is coded as a dummy that equals 1 if a founder, descendant, or family member is a director or large shareholder (Anderson & Reeb, 2003a, 2003b). 3 Family firms represent around 33% of our sample, which is in line with the prior studies of listed firms (Anderson & Reeb, 2003a; Villalonga & Amit, 2006).
To assess country-level institutional environments, we adopted the World Governance Indicators (WGIs) that capture the process by which governments are selected, monitored, and replaced, government capacity to effectively formulate and implement sound policies, and the respect of citizens and the state for the institutions that govern their economic and social interactions. Specifically, we focused on the following WGIs in this study: Democratic freedom, Government effectiveness, Regulatory quality, Rule of law, Corruption control, Political stability, and Absence of terrorism (Political Stability). These indicators are based on over 30 individual data sources produced by a variety of survey institutes, think tanks, NGOs, international organizations, and private sector firms (Kaufmann et al., 2011). These WGIs have been validated in the prior literature by both management (Chen et al., 2014) and corporate governance scholars (Ding et al., 2016).
Individual WGIs exhibit relatively high correlations (ranging from .67 to .96), suggesting that even though these dimensions reflect different dimensions of the country-level institutional environment, they are highly correlated. Therefore, we used Principal Component Analysis (PCA) to derive an overall WGI index of the institutional environment. Specifically, the PCA produced a linear combination of all the components of WGI with the highest variance. The WGI index has an eigenvalue of 5.157 and explains 86% of the total variance.
Control Variables
We controlled for both micro-level variables (financial leverage ratio, cash flow ratio, R&D, firm age, and firm size) and macro-level variables (gross domestic product (GDP) growth, trade, and inflation) in our explanatory model. Following the prior studies (Huynh & Petrunia, 2010), Financial leverage is included as a measure of debt, and Cash flow reflects internal finances (Brown & Petersen, 2009). We calculated financial leverage as total debt to total assets, and cash flow as net income and noncash charges to total assets (Testa et al., 2018). R&D was computed as R&D expenses to net sales to proxy for innovation (Audretsch et al., 2014). As missing R&D observations are common (Koh & Reeb, 2015), these data existed for only 34% of our sample; thus following O’Connor and Rafferty (2012), all missing R&D values were scored as zero.
Numerous studies suggest that larger and older companies grow more slowly than their smaller and younger counterparts (Hardwick & Adams, 2002; Oliveira & Fortunato, 2006; Yasuda, 2005). Therefore, following Hardwick and Adams (2002) and Huynh and Petrunia (2010), Firm size (logarithm of total assets) and Firm age (logarithm of numbers of years the firm exist) are added to our explanatory model. Moreover, as firms grow faster in open and expanding economies (Acemoğlu et al., 2019; Beck et al., 2008), we controlled for GDP growth (calculated as the annual percentage growth rate of real GDP) 4 and Trade proxies (calculated as the sum of exports and imports of goods and services of a country as a share of GDP) (Allen et al., 2005). We also incorporated the Inflation rate to control for price dynamics (Apergis, 2004), and industry (three-digit ICB codes) and year dummies to account for industrial differences and business cycles (Bozzi et al., 2017). It is important to note that firm-level fixed effects could not be employed as family firm status rarely changed during our period of analysis (Dyer & Whetten David, 2006; Villalonga & Amit, 2006).
Estimation Strategy
Empirical Model
We adopted a two-stage least squares (2SLS) estimator (Rose & Stone, 2011) because Firm sizeic,t , R&Dic,t , and Cash flowic,t variables did not meet the exogeneity assumption (p = .000). In the first stage, we regress the endogenous variables (Firm sizeic,t , R&Dic,t , and Cash flowic,t ) on all the exogenous variables (Familyic, t, Financial leverageic, t , GDP growthc, t , Tradec, t , Inflationc, t, Industry, and Time dummies) and the instrumented variables (IVs) to remove the proportion of these variables correlated with the error term. Due to an absence of strong external IVs in the literature, we adopted the first- and second-year lagged values of Cash Flowic,t and the second-year lagged values of Firm sizeic,t and R&Dic,t (Krafft et al., 2014). In the second stage, the predicted values of the endogenous variables are used to estimate the explanatory variables (Firm sizeic,t , R&Dic,t , and Cash flowic,t ). To confirm the strength of our IVs (their correlation with endogenous regressors) and their validity (their orthogonality to the error term), we conducted both Kleibergen–Paap and Hansen tests (Kleibergen & Paap, 2006). All the 2SLS regressions were estimated using the ivreg2 command in STATA (Baum et al., 2003). We used robust standard errors clustered at the firm level to relax homoscedasticity and autocorrelation assumptions (Petersen, 2009). In addition, to test the joint significance of the reported coefficients, industry dummies, and year dummies, we employed three Wald tests using the testparm command in Stata.
Our proxy for family influence was found not to be endogenous according to Durbin–Watson and Wu–Hausman tests (p = .467; p = .468). However, we also estimated the endogenous treatment regression-model using the full maximum likelihood estimator (Heckman, 1978; Maddala, 1983) with robust standard errors, where the treatment (being a family firm) was modeled as an endogenous choice in all models. 5 As the likelihood-ratio test of independence was not different from zero in all the estimated models, the necessity of applying the endogenous treatment regression model was rejected.
Descriptive Statistics, Univariate Tests, and Correlation Matrix
Table 1 displays descriptive statistics. Our firms exhibit significant variability in growth rates, averaging 0.047, with standard deviation 0.336. Univariate analyses displayed in Panel A of Table 2 show that family firms exhibit a higher annual growth rate than their nonfamily counterparts on average close to 2% more (p < .001), a growth rate around 50% higher than for nonfamily firms. The faster growth rate of family firms also holds for 2- and 3-year intervals (p < .001), suggesting that family firm superior growth persists for years. Panel B of Table 2 shows growth rates by geography. Family firms from Anglo-Saxon or Asian countries—leading economic superpowers—have higher growth rates than nonfamily firms (p < .001). Also family firms from Asian countries, including the “Asian Tigers” of Singapore, Hong Kong, and South Korea, have significantly higher growth rates over 1- (p < .001), 2- (p < .001), and 3-year periods (p < .001) than family firms from Anglo-Saxon countries, likely due to the extraordinary growth of the Asian economies (Fontana & Srivastava, 2009; Gulati, 1992).
Descriptive Statistics.
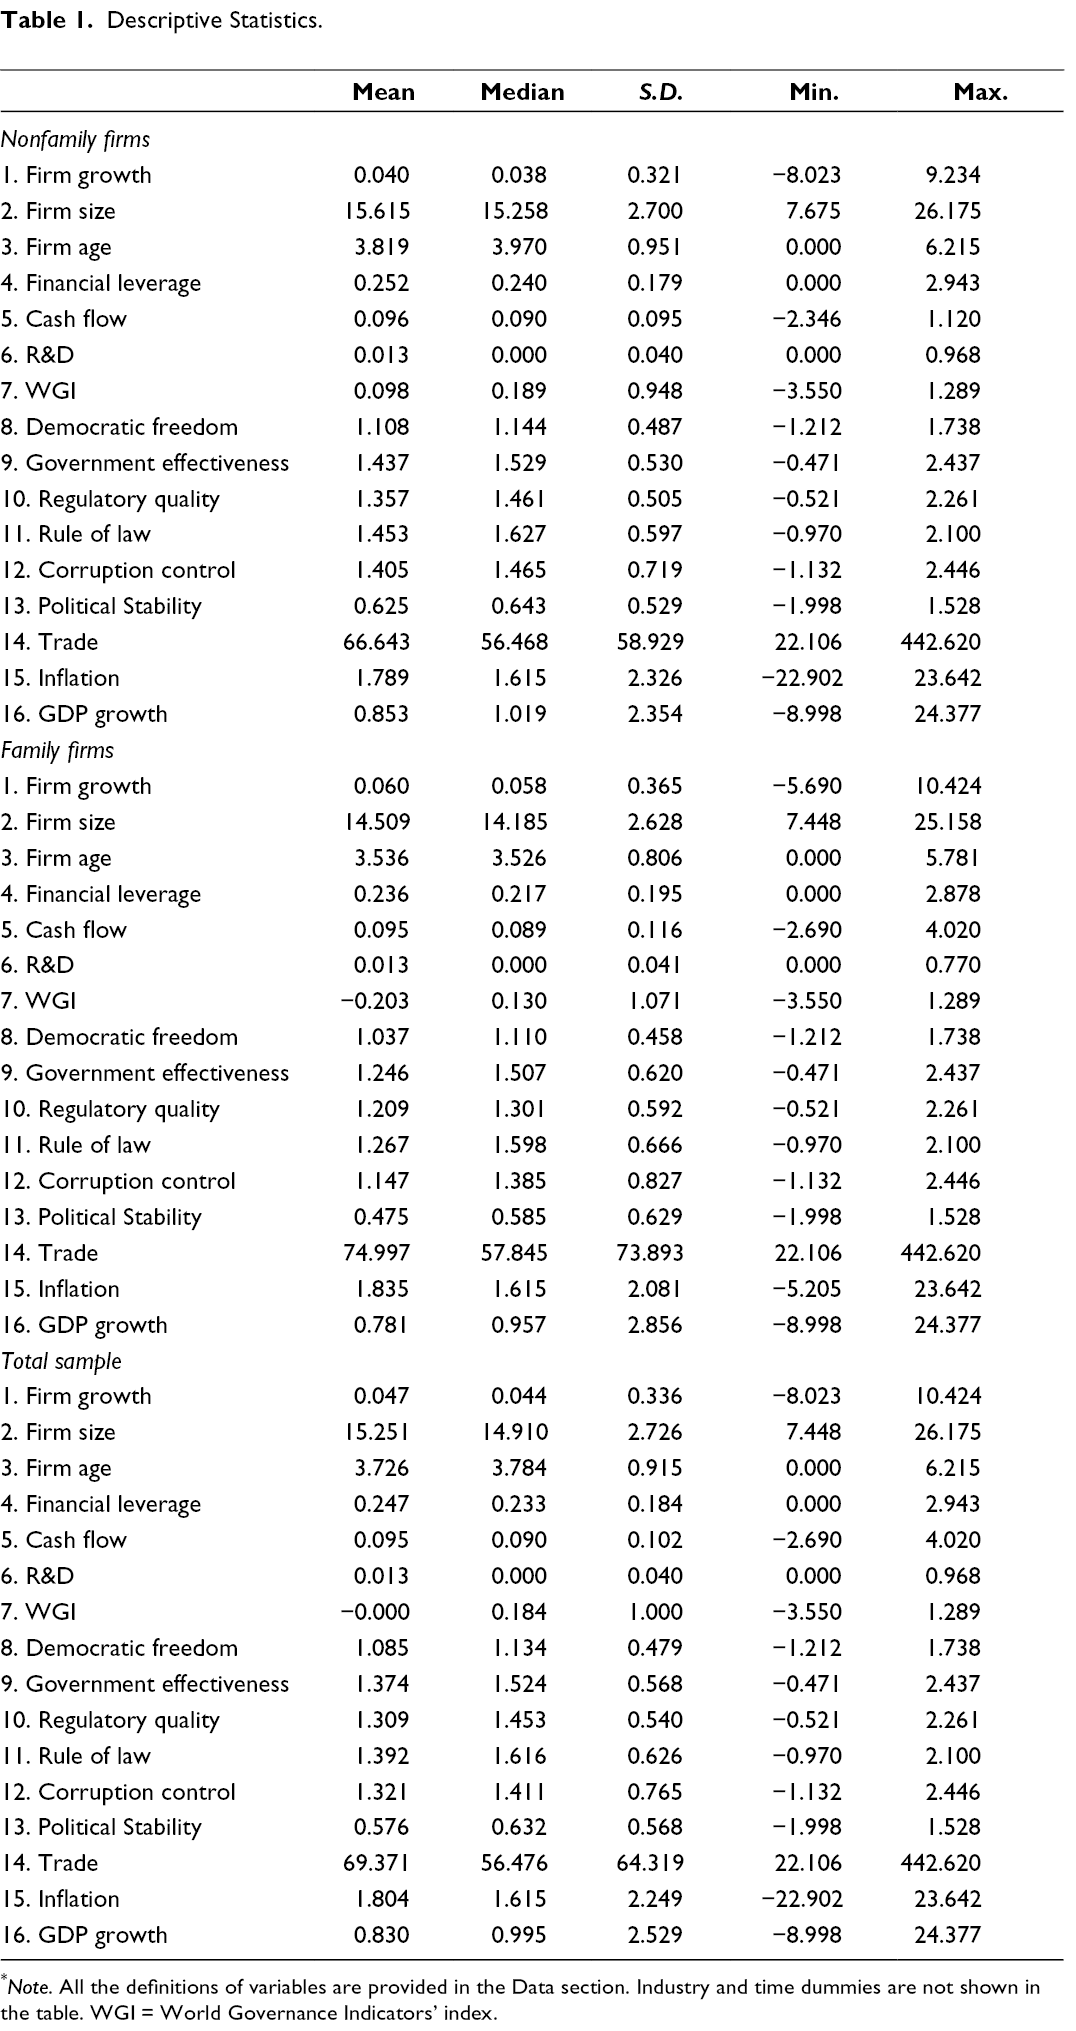
* Note. All the definitions of variables are provided in the Data section. Industry and time dummies are not shown in the table. WGI = World Governance Indicators’ index.
Univariate Tests.
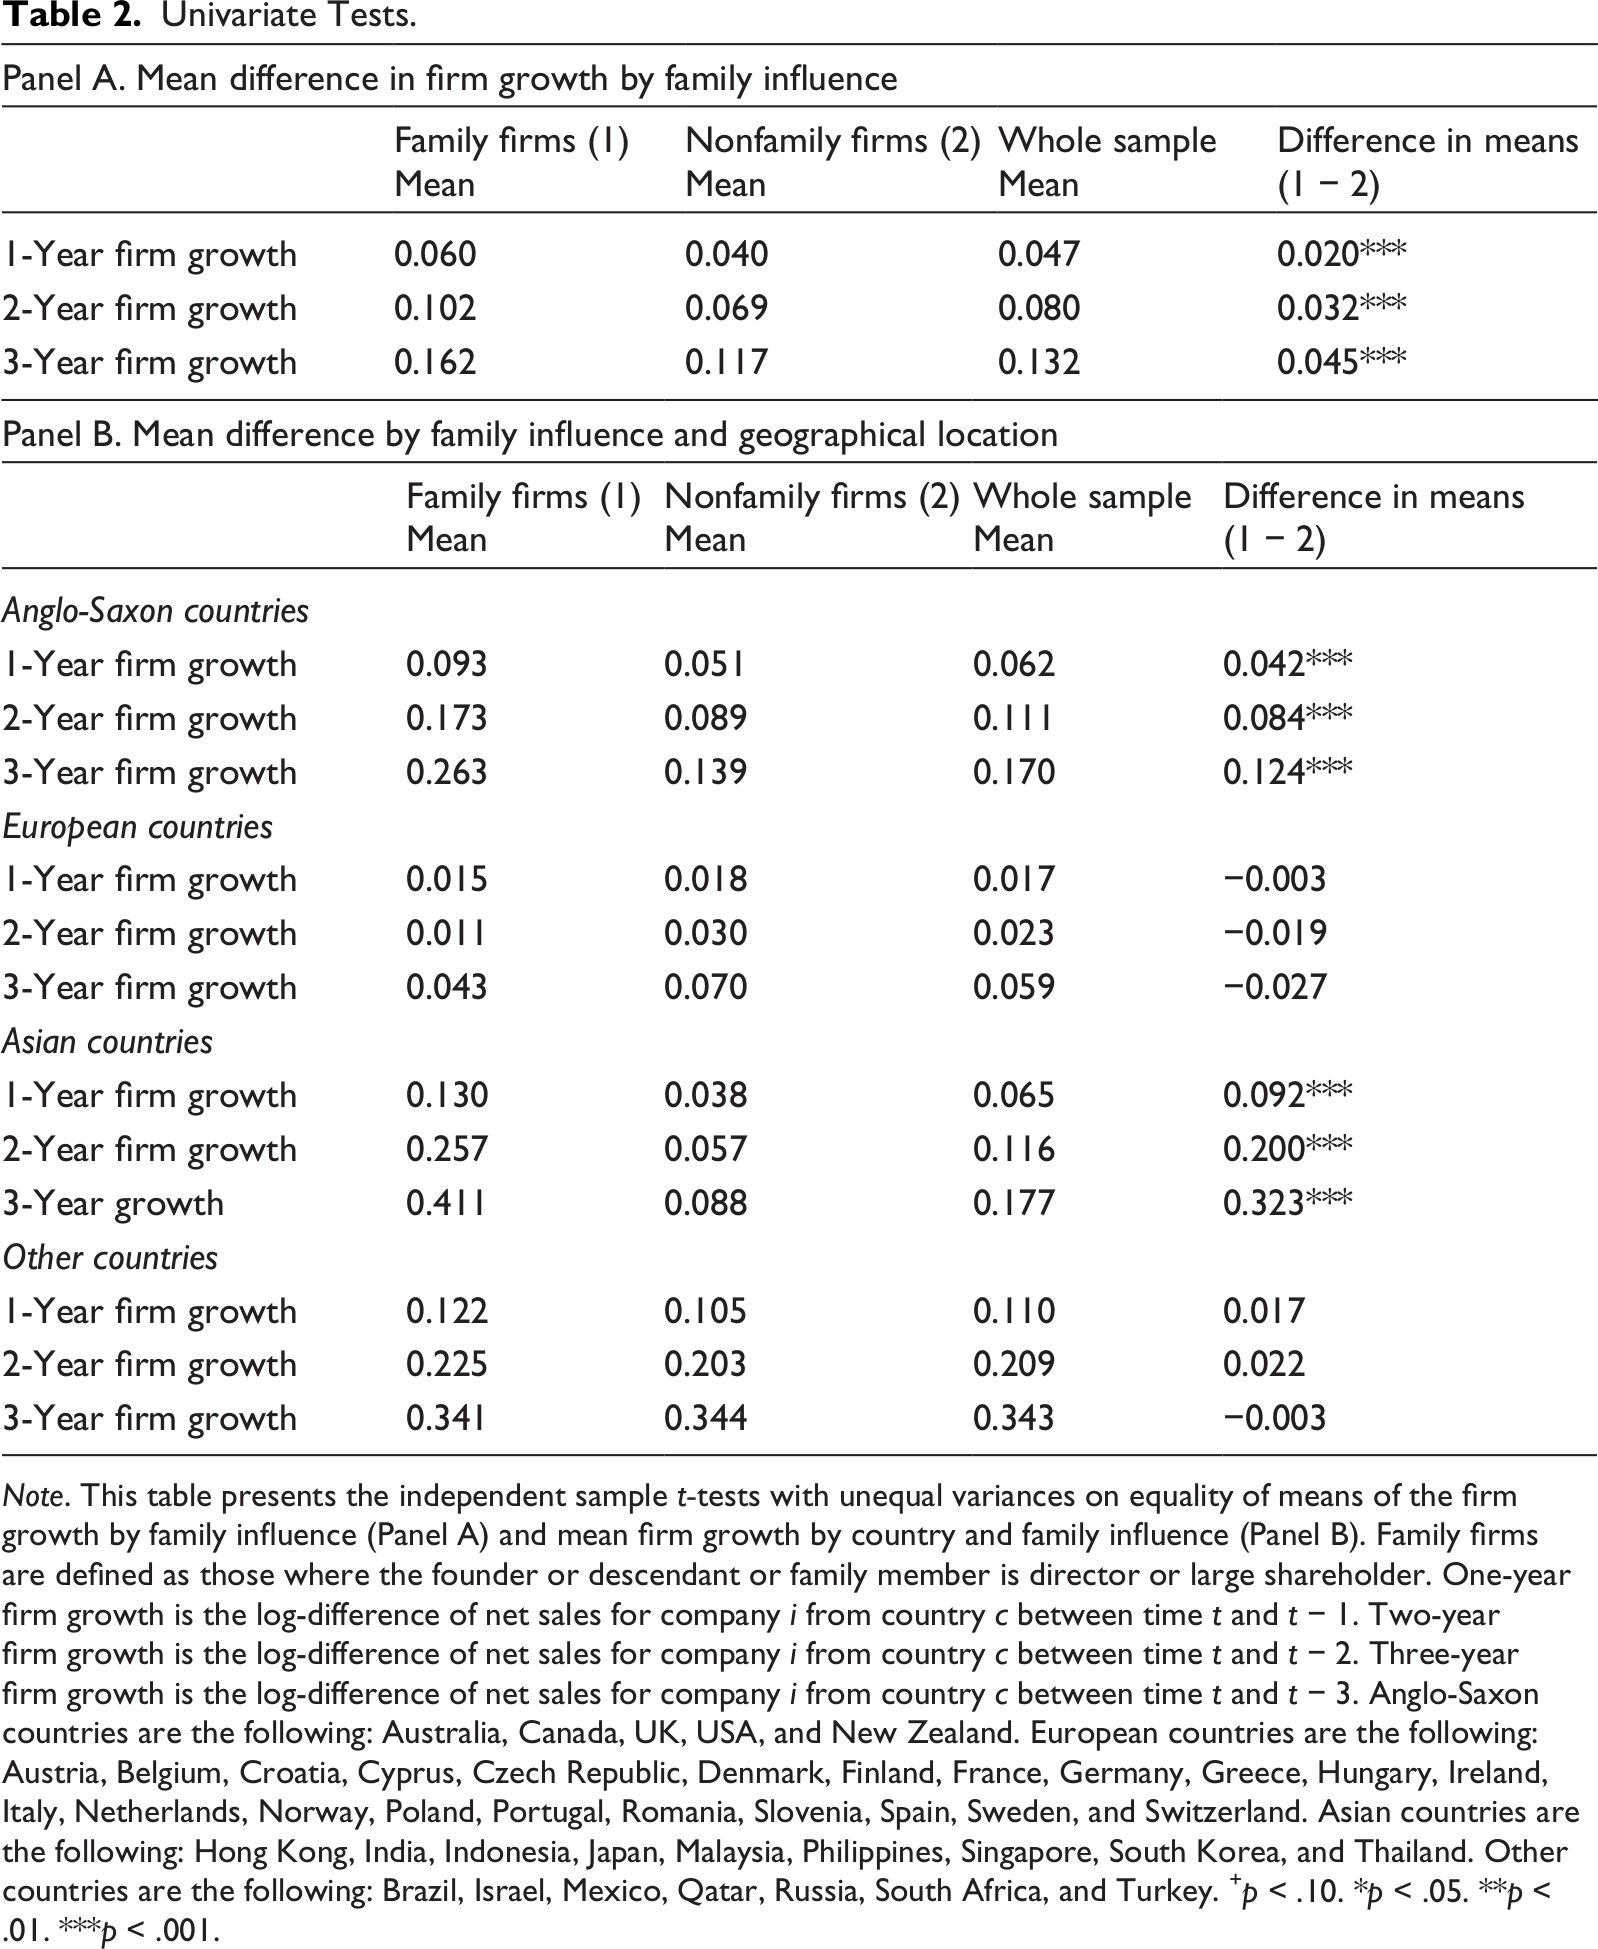
Note. This table presents the independent sample t‐tests with unequal variances on equality of means of the firm growth by family influence (Panel A) and mean firm growth by country and family influence (Panel B). Family firms are defined as those where the founder or descendant or family member is director or large shareholder. One-year firm growth is the log-difference of net sales for company i from country c between time t and t − 1. Two-year firm growth is the log-difference of net sales for company i from country c between time t and t − 2. Three-year firm growth is the log-difference of net sales for company i from country c between time t and t − 3. Anglo-Saxon countries are the following: Australia, Canada, UK, USA, and New Zealand. European countries are the following: Austria, Belgium, Croatia, Cyprus, Czech Republic, Denmark, Finland, France, Germany, Greece, Hungary, Ireland, Italy, Netherlands, Norway, Poland, Portugal, Romania, Slovenia, Spain, Sweden, and Switzerland. Asian countries are the following: Hong Kong, India, Indonesia, Japan, Malaysia, Philippines, Singapore, South Korea, and Thailand. Other countries are the following: Brazil, Israel, Mexico, Qatar, Russia, South Africa, and Turkey. + p < .10. *p < .05. **p < .01. ***p < .001.
Table 3 presents the correlation matrix. We find that family firm status and firm growth are positively correlated (p < .001). Also, firm growth is negatively correlated with firm age and financial leverage (p < .001), while cash flow is positively correlated with firm growth (p < .001). Variance inflation factors (VIFs) were never exceeded 4 (O’Brien, 2007), suggesting that multicollinearity was not a concern.
Correlation Matrix.
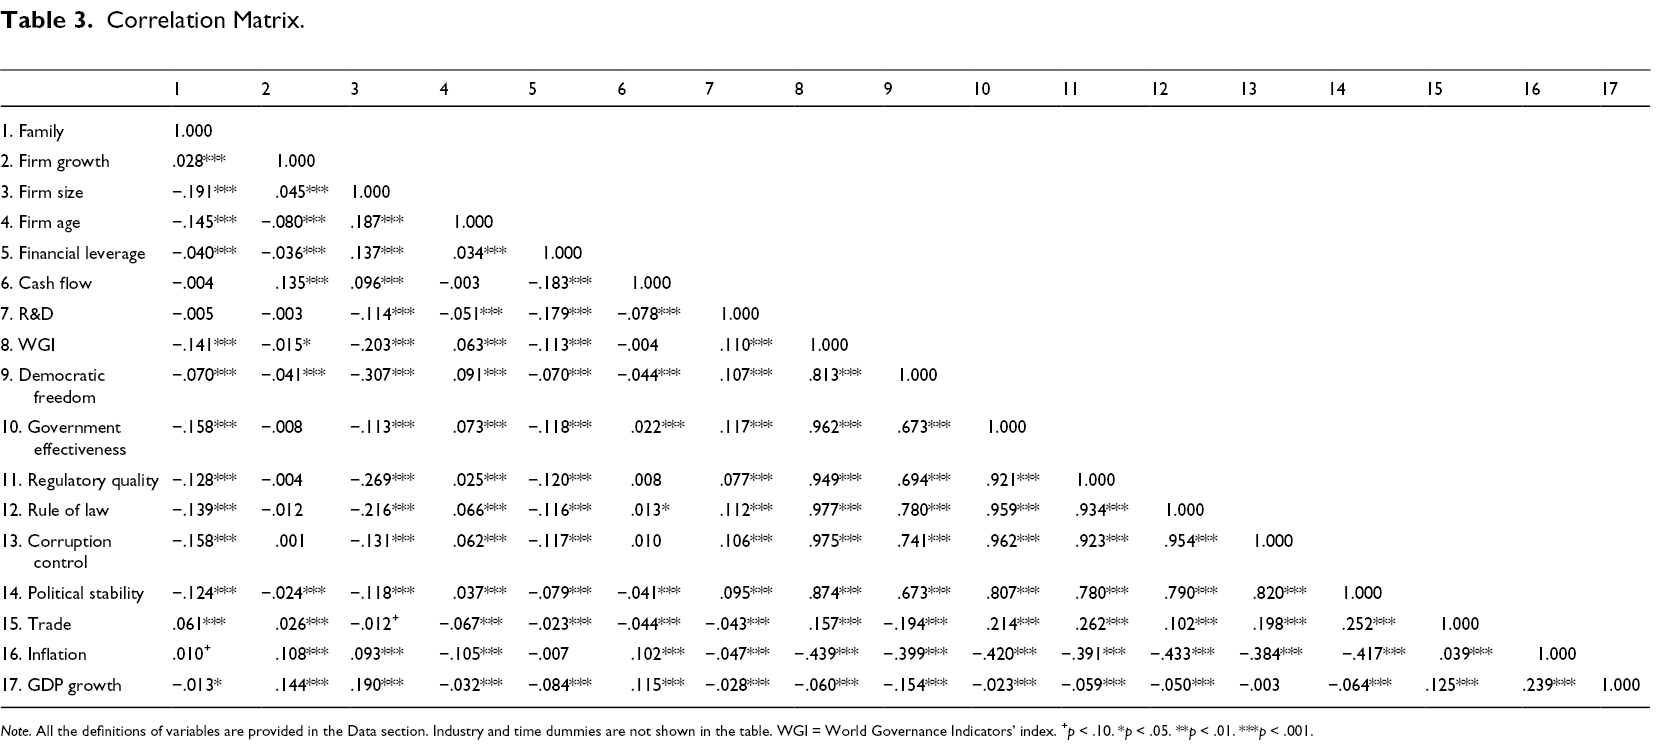
Note. All the definitions of variables are provided in the Data section. Industry and time dummies are not shown in the table. WGI = World Governance Indicators’ index. + p < .10. *p < .05. **p < .01. ***p < .001.
Results
Main Results
Table 4 presents the 2SLS estimates of the relationship between family influence and firm growth.
Main Results.
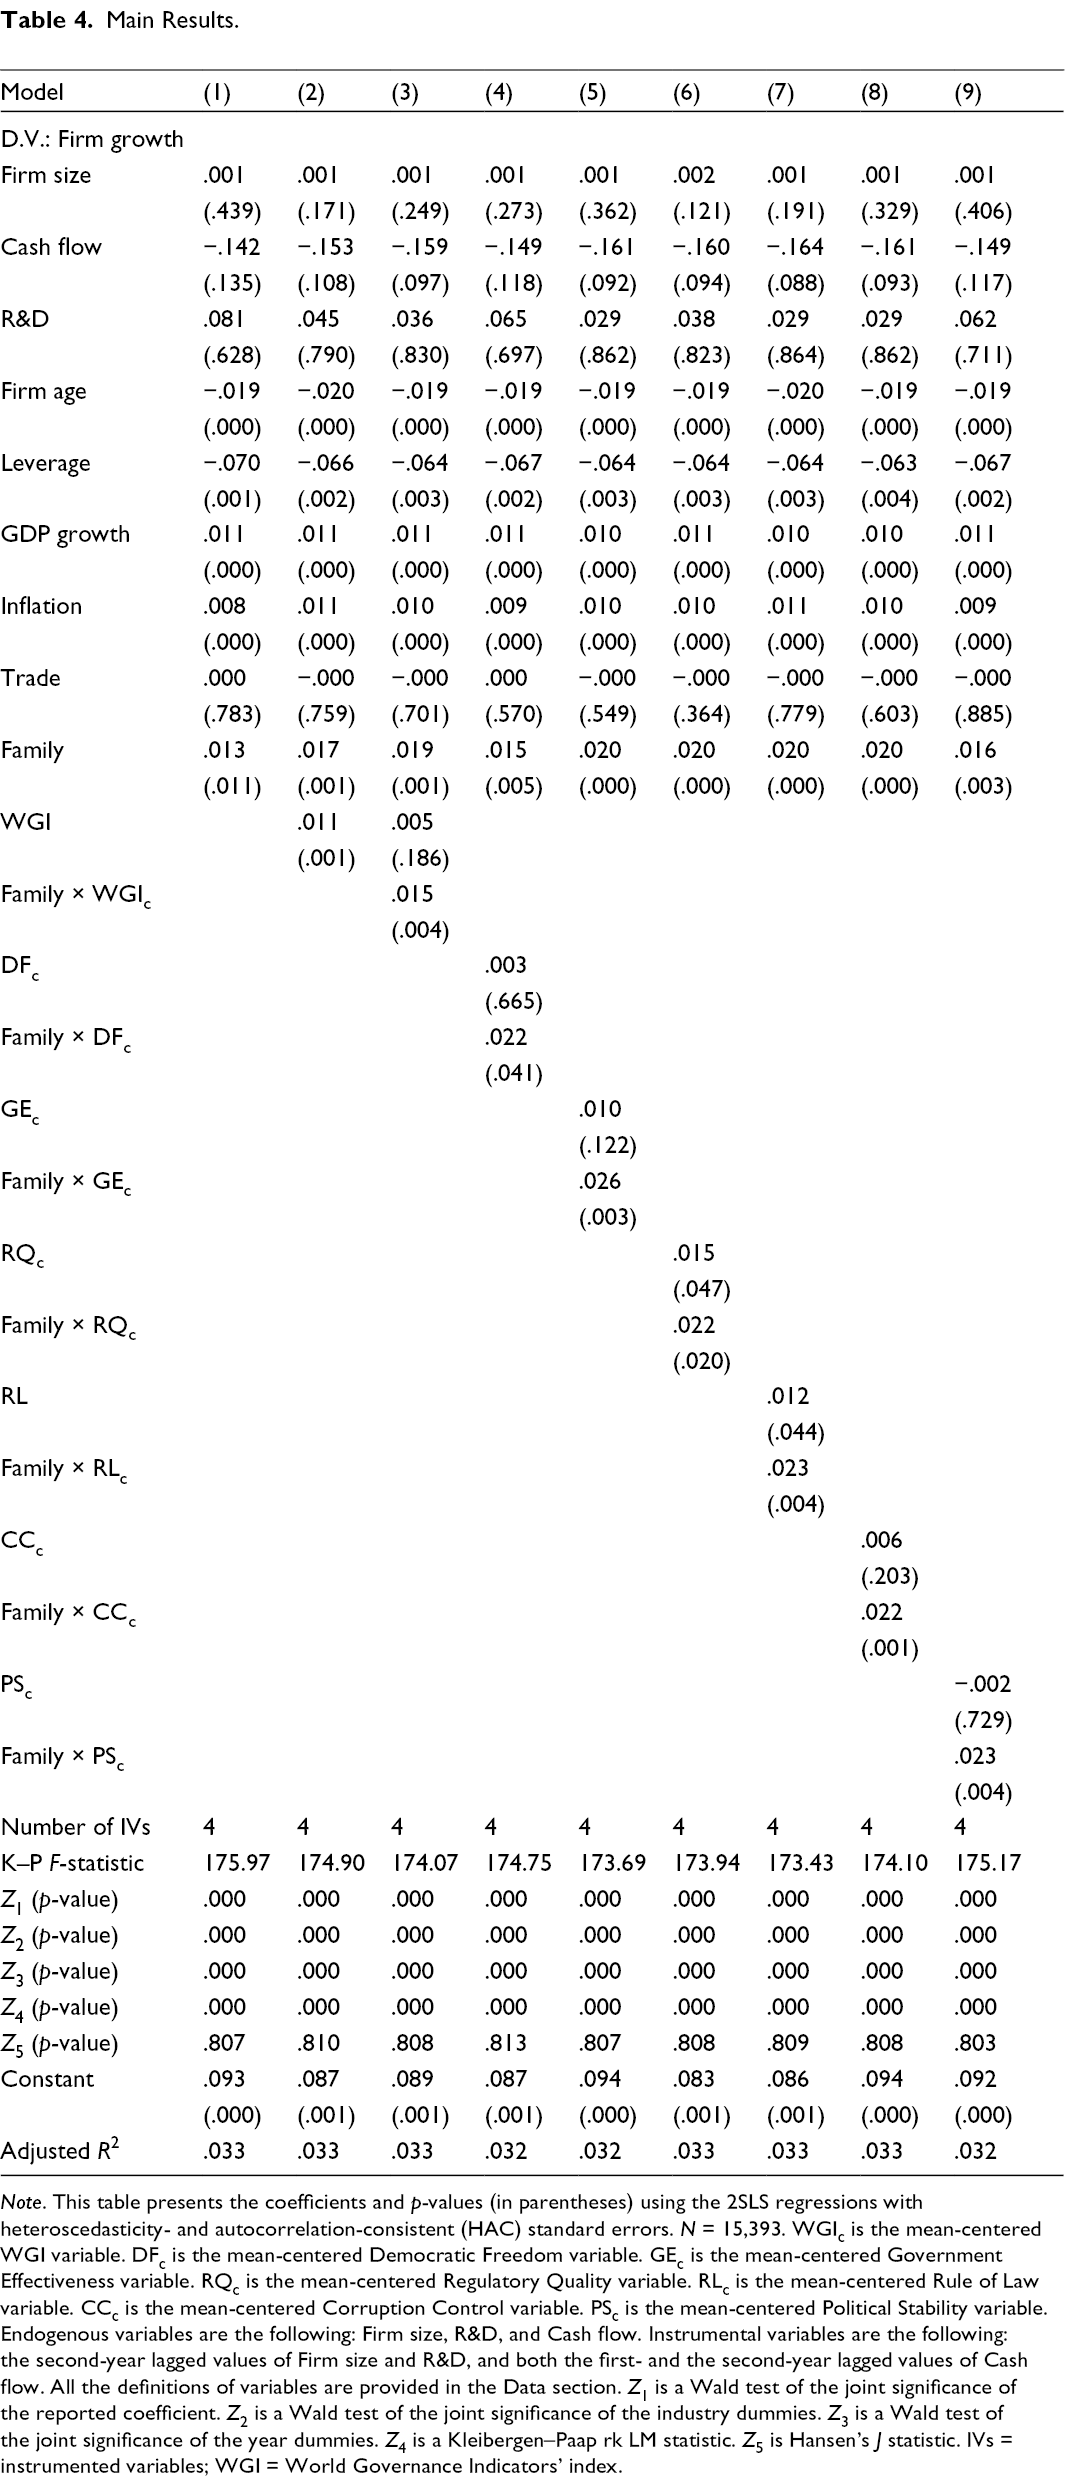
Note. This table presents the coefficients and p-values (in parentheses) using the 2SLS regressions with heteroscedasticity- and autocorrelation-consistent (HAC) standard errors. N = 15,393. WGIc is the mean-centered WGI variable. DFc is the mean-centered Democratic Freedom variable. GEc is the mean-centered Government Effectiveness variable. RQc is the mean-centered Regulatory Quality variable. RLc is the mean-centered Rule of Law variable. CCc is the mean-centered Corruption Control variable. PSc is the mean-centered Political Stability variable. Endogenous variables are the following: Firm size, R&D, and Cash flow. Instrumental variables are the following: the second-year lagged values of Firm size and R&D, and both the first- and the second-year lagged values of Cash flow. All the definitions of variables are provided in the Data section. Z 1 is a Wald test of the joint significance of the reported coefficient. Z 2 is a Wald test of the joint significance of the industry dummies. Z 3 is a Wald test of the joint significance of the year dummies. Z 4 is a Kleibergen–Paap rk LM statistic. Z 5 is Hansen’s J statistic. IVs = instrumented variables; WGI = World Governance Indicators’ index.
H1 predicts that family influence positively affects firm growth. In Table 4, the Family dummy is statistically significant, indicating that the average growth rate of family firms is in fact significantly higher than for nonfamily firms (Model 1: β = .013, p < .01). In contrast to private family firms that do not differ in growth from their nonfamily counterparts (Chrisman et al., 2004), our publicly traded family firms have, on average, a 1% higher growth rate than their nonfamily counterparts. Our finding also contrasts with the prior cross-sectional studies on family firm growth by Lee (2006) and Campopiano et al. (2019), very likely because our panel data allow us to obtain more accurate estimates of model parameters by observing growth rates over a longer period and covering different stages of the business cycle and of firm development (Evert et al., 2016). In addition, our identification strategy reduces endogeneity concerns via strong and valid IVs (Rose & Stone, 2011), as confirmed by both Kleibergen–Paap and Hansen tests, and it also mitigates survivorship bias (Elton et al., 1996). The Kleibergen–Paap F-statistic is far above the Stock–Yogo critical values, thus rejecting the hypothesis that our IVs are weak instruments.
Model 2 of Table 4 assesses the effect of institutional development on firm growth. The coefficient of WGI is positive and highly significant (β = .011; p < .001) suggesting that firms in countries with strong institutional development, on average, grow faster than firms from countries with weak institutional development, confirming the role of national institutions in boosting firm growth. In addition, after accounting for country-level institutional development, the Family coefficient increases in economic and statistical significance (β = .017; p < .001).
Model 3 of Table 4 indicates that the Family coefficient remains positive and statistically significant after incorporating the interaction between family influence and institutional development (β = .019; p < .001). The interaction between Family and WGI is also positive and significant (β = .015; p < .01). Holding all other variables constant, we calculated the economic impact of our regression estimates for family firms from countries with a strong institutional environment (defined as one standard deviation above the average), obtaining a growth rate close to 3.4% higher than for nonfamily firms ((.019 + .015*1.000) =.034%, statistically significant at the 1% level). Thus, the positive effect of family control on firm growth is greater in countries with superior institutional environments (3.4%) than in countries with average institutional environments (1.9%). This finding is confirmed in all other specifications of Table 4 (Models 4–9), with individual WGIs (Democratic Freedom, Government Effectiveness, Regulatory Quality, Rule of Law, Corruption Control, and Political Stability) as dependent variables, and all firm-, industry-, and country-level controls. Results are consistent and show a superiority in the growth rate of family firms in countries with stronger institutional environments (measured as one standard deviation above the average of the Index) that ranges from a minimum of 1.05% for Democratic Freedom to a maximum of 1.68% for Corruption Control. Thus, our empirical evidence robustly supports H2. In summary, the 2% superiority of family versus nonfamily firm growth is further enhanced to 2.6% to 3.7% in strong institutional environments.
Wald tests of the joint significance of industry and time dummies are statistically significant at the 1% level in all models, justifying their inclusion in our explanatory model.
Robustness Tests and Post Hoc Analysis
First, we reran our model using alternative definitions of our dependent variable as follows (see supplemental Table 6): (1) Absolute growth rate in total assets for company i from country c between time t and t − 1; (2) Relative growth rate in total assets for company i from country c between time t and t − 1; (3) Relative growth rate in sales for company i from country c between time t and t − 1; and (4) Return on Assets (ROA) defined as the ratio between earnings before interest, taxes, depreciation, and amortization divided by total assets for company i from country c (winsorized at the 1% level). 6 In most of the specifications, we obtain similar results for both magnitude and direction of the main effects. However, in a few cases, they lacked statistical significance, perhaps because different growth measures assess different qualities (Shepherd & Wiklund, 2009). In addition, we re-estimated our model using an alternative family firm definition (a dummy variable that equals one if the founder or descendant or family member is director or large shareholder owning more than 5% of the firm’s equity, zero otherwise) and found strong support for both H1 and H2.
Second, we re-estimated our explanatory model by including additional control variables (see supplemental Table 7): (1) Industry concentration estimated as the HHI (sum of squared market shares using segment sales at the industry level); (2) Innovation output estimated as the brands and patents-to-net-sales ratio; (3) Public spending estimated as cash payments for operating activities of the government in providing goods and services (this includes compensation of employees, interest and subsidies, grants, social benefits, and expenses such as rent and dividends); (4) Internationalization calculated as the ratio between foreign sales and net sales; (5) Population size calculated as logarithm of country’s population; and (6) All the aforementioned additional controls were included simultaneously. The results of all the abovementioned tests largely confirm our main findings.
Finally, we examined variations of the family business effect on firm growth across different types of family firms and industries, and over business cycles in additional analysis (see supplemental Table 8). We found that the positive family business effect on firm growth applies mostly to first-generation firms, regardless of whether the CEO is a family member or not, as compared to nonfamily firms and later-generation family firms. Later-generation family firms can achieve above-average growth rates only if they have a professional CEO and operate in countries with good institutional environments. As to variations across industries, we did not find that industry context played an important role. Regarding variations across business cycles, we found that the positive effect of family influence on firm growth does not hold in times of financial crisis for firms operating in countries with weak institutional environments. 7
Discussion and Implications
The restricted view of SEW, namely, maintaining the current family control, suggests that the growth prospects of family firms are limited (Miller & Le Breton-Miller, 2014). Rationales include extraction of private benefits, risk aversion, lack of resources, and entrenchment of incompetent family members. By contrast, the extended or transgenerational control view of SEW suggests that many family firms invest generously in their companies (Miller & Le Breton-Miller, 2014). That in turn fuels superior growth. In this study, we have compared current versus transgenerational control views to explain the growth rate of family firms and the concomitant impact of the institutional context using 5265 publicly traded firms from 43 countries in 33 industrial sectors from 2007 to 2016.
We find that family influence does in general increase firm growth. However, this is far truer in countries with a sounder institutional environment; specifically, countries that are more democratic, have more effective governing policies, are less corrupt, and where the rule of law prevails. These findings hold after controlling for endogeneity and sample selection, and adopting alternative model specifications and control variables. We also find that the positive effect of family influence on firm growth varies significantly across different types of family firms and different business cycles.
Our results appear to confirm the transgenerational control intentions of many family firms. Arregle et al. (2007), Block and Henkel (2010), Chrisman et al. (2011), Miller et al. (2008), Miller and Breton-Miller (2005), Miller and Le Breton-Miller (2014), and others have argued that family firms are concerned with the sustainable future of the business to support the careers, financial, and social circumstances of the current and later generations. As a result, many families tend to have orientations to achieve transgenerational control—to invest more in their companies than diffusely owned firms with agent executives who are pressured to deliver quarterly earnings and have less at stake in long-term outcomes. Such a transgenerational orientation can promote growth, particularly in positive institutional environment.
However, where a transgenerational control orientation is discouraged or stymied by an institutional climate that makes the future highly uncertain, and therefore, investments in the future less likely to pay off, then family firms will be less likely to invest, and their growth can be slower than otherwise. Indeed, where the institutional environment is undemocratic, underdeveloped, corrupt, ineffective, or risky, families may, in line with expectations to maintain current control, extract private benefits from their public companies to build a private family nest egg, thereby hobbling firm growth. Under those circumstances, financial security and social position are more likely to reside in the family rather than the business (Björnberg et al., 2016). That is exactly what our analysis suggests. 8
Theoretical Implications
Our study makes several theoretical contributions. First, we condition the restricted or maintaining current control SEW perspective by showing that family influence is on average beneficial to firm growth. We also show how that effect varies across different types of family firms, economies, and business cycles in publicly traded firms around the globe, where family firms are often of paramount economic importance (Barontini & Caprio, 2006; De Massis et al., 2018; European Commission, 2009; European Family Business Barometer, 2017; Faccio & Lang, 2002). To the best of our knowledge, our study is the first to examine family business growth around the world in longitudinal settings.
Second, whereas the prior studies have demonstrated that the institutional environment matters for the strategies (Brinkerink & Rondi, 2020) and financial performance of family firms (Banalieva et al., 2015; Liu et al., 2010), we demonstrate which national institutions boost family firm growth, showing that firms grow faster in countries with more democracy, government effectiveness, regulatory quality, rule of law, corruption control, and political stability. We also document how the positive moderating effect of the institutional environment varies across different types of family firms and different business cycles. Thus, we highlight the importance of studying the interplay between micro- and macro-level factors.
Third, we directly tackle the potential conflicts between the two most important dimensions of SEW (Casson, 1999; Chua et al., 1999; James, 1999). As such, we contribute to the growing stream of studies distinguishing very different aspects within the “black box” of SEW, each with potentially different performance and strategic implications (Chua et al., 2015; Filser et al., 2018; Miller & Le Breton-Miller, 2014; Schulze & Kellermanns, 2015).
Finally, family business research has been plagued by endogeneity problems (Evert et al., 2016), particularly the firm growth literature (Casillas et al., 2010; Lee, 2006; McConaughy & Phillips, 1999; Sraer & Thesmar, 2007). We have strived to mitigate that issue along with sample selection bias using panel data and IV estimators. We also employed a battery of robustness tests to rule out alternative explanations. Thus, we provide solid insights into family firms growth.
Practical Implications
Our study also has practical implications. Debates abound in the regulatory, business, and academic communities over policies to promote firm growth, worldwide (David et al., 2015; Rubini et al., 2012). We show that the institutional environment has an important effect on firm growth, and that this differs based on firm ownership and governance conditions. Policy-makers and potential investors must heed the institutional environment when evaluating growth potential.
Managers and consultants in promoting family firm growth may do well to consider the business cycle. Growth promotion initiatives may succeed better during normal economic times, whereas more conservative growth strategies may be better during financial crises. In other words, growth strategies could be adapted to the business cycle.
Limitations and Future Research
We also acknowledge the limitations of our work, which can present fruitful avenues for future research. Like many studies of SEW, ours does not directly measure managerial priorities. Nevertheless, we have performed a wide range of sensitivity tests to diminish alternative explanations of our main results, highlighting that the growth rate of a firm is indeed related to a family firms’ transgenerational orientation. We encourage future studies to examine the validity of our findings, measuring different aspects of a transgenerational orientation (Le Breton-Miller & Miller, 2006; Miller & Le Breton-Miller, 2014).
Data limitations prevented us from studying private family firms. Recent research suggests that such firms, insulated from financial markets, have more balanced temporal horizons and different investment strategies than listed family firms (Carney et al., 2015). Others show that private family firms can be excessively altruistic toward their descendants, thereby creating organizational inefficiencies (Schulze et al., 2001, 2002). Thus, analyzing private family firms’ growth dynamics will be an important initiative. We also hope that others will study organic versus acquisitive growth (McKelvie & Wiklund, 2010), and growth in small- and medium-size firms, and at different stages of their development.
Furthermore, family firm growth may be affected by the personal characteristics of family and nonfamily managers (i.e., education, age, and professional background), as well as governance qualities such as executive compensation, board of directors functioning and structure, and corporate takeovers (Daspit et al., 2018). For instance, a recent study by Tabor et al. (2018) suggests that the involvement of nonfamily members in managerial positions increases a commitment by family members to prioritize economic goals and, therefore, growth initiatives. Others show that incentive compensation matters more for the productivity of family than nonfamily firms (Chrisman et al., 2017), suggesting that incentives can influence family business growth via labor productivity. Other scholars argue that incentive compensation matters less for the innovation performance of family firms (De Massis et al., 2016) thereby potentially constraining their growth. We encourage future studies to investigate such influences.
Qualitative and mixed methods research can provide a more nuanced view of family business growth. Such methods could provide insight into growth decisions by family business owners and/or managers (De Massis & Kammerlander, 2020, De Massis & Kotlar, 2014; Fletcher et al., 2016). Mixed methods can assess the validity of our findings by combining primary and secondary data.
Conclusion
Our study has examined the neglected topic of family business growth based on a sample of 5265 publicly traded firms from 43 countries in 33 industrial sectors from 2007 to 2016. Consistent with the transgenerational control view of family business (Miller & Breton-Miller, 2005, 2014; Lumpkin & Brigham, 2011), we find that family firms on average have higher growth rate than nonfamily firms, and this positive effect is significantly stronger in countries with superior institutional environments. These results remain unchanged after correcting for endogeneity, accounting for potential sample selection problem, using alternative variable definitions, and including additional control variables. We also find that the positive effect of family influence on firm growth is stronger for family firms during normal economic times. All in all, our findings highlight that family influence is a significant determinant of firm growth, but the magnitude of that effect depends very much on the type of family business, the institutional context, and the business cycle.
Supplemental Material
Table S1 - Supplemental material for Family Business Growth Around the World
Supplemental material, Table S1, for Family Business Growth Around the World by Ivan Miroshnychenko, Alfredo De Massis, Danny Miller and Roberto Barontini in Entrepreneurship Theory and Practice
Footnotes
Acknowledgment
We gratefully acknowledge helpful comments from Todd Alessandri (Northeastern University), Sharon Belenzon (Duke University), James R. Brown (Iowa State University), Andrea Calabrò (IPAG Business School), Laura Nieri (University of Genova), Ross Levine (University of California), and Jan Taenzler (University of Mannheim).
Declaration of Conflicting Interests
The author(s) declared no potential conflicts of interest with respect to the research, authorship, and/or publication of this article.
Funding
The author(s) received no financial support for the research, authorship, and/or publication of this article.

Notes
Supplemental Material
Supplemental material for this article is available online.
Author Biographies
References
Supplementary Material
Please find the following supplemental material available below.
For Open Access articles published under a Creative Commons License, all supplemental material carries the same license as the article it is associated with.
For non-Open Access articles published, all supplemental material carries a non-exclusive license, and permission requests for re-use of supplemental material or any part of supplemental material shall be sent directly to the copyright owner as specified in the copyright notice associated with the article.
