



Abstract
Based on two samples of juveniles (total n = 1,629), this experimental study explores effects of modifying the design (not the wording) of a self-report questionnaire on prevalences and incidences of delinquency - the core instrument of the second International Self-Report Delinquency (ISRD-2) study. Research questions are: Do rates of self-reported delinquency differ by questionnaire design? Are there differences in item nonresponse? Do these effects differ by person characteristics, especially self-control? Do effect sizes of predictors of offending differ by questionnaire design? Omitting follow-up questions and reversing the response categories no/yes generates higher levels of self-reported delinquency as to minor offenses. Item nonresponse is affected by the design of filter questions and by person characteristics (e.g., low self-control) correlating with delinquency. Although the modifications reduce underreporting, effects of predictors on delinquency do not differ substantially. Nevertheless, more variance is explained using the modified version data.
Quantitative research on crime and delinquency seeks either to describe the level of crime or to explain variations in the level of crime, or both. Major ways to estimate the level and variation of crime and criminal behavior are the use of official (police and court) statistics, victimization surveys of the general population, and studies on self-reported offending asking respondents about their criminal behavior. Because official sources suffer from serious drawbacks (strong dependency on the reporting behavior of victims, police effectiveness, differential definitions of offenses, recording behavior, reaction of the criminal justice system) and victimization surveys cannot provide detailed information on the offender, self-report studies that are close to the criminal act and the offender belong to the most important tools of criminological research (Junger-Tas & Marshall, 1999; Kivivuori, 2011; Thornberry & Krohn, 2000).
Although the self-report technique has gained general acceptance by the 1980s at the latest (Hindelang, Hirschi, & Weis, 1981; Hirschi, Hindelang, & Weis, 1980), there are still concerns about the reliability and even more the validity of self-report data. It seems that victimization surveys are better suited than self-report studies to describe the level of crime because they do not suffer from the problem to underrepresent chronic offenders (Junger-Tas & Marshall, 1999) and because they are less affected by social desirable responding, especially when surveying adults. Although the self-report method that has been considerably improved since the early studies of Short and Nye (Nye & Short, 1957; Short & Nye, 1957) now appears to be reasonably valid, in their summary of a review of reliability and validity studies, Thornberry and Krohn (2000, p. 58) point to considerable underreporting as one of the remaining validity issues of self-reports. However, self-report studies are indispensable for testing and developing criminological theories. In contrast to victim surveys, they enable researchers to include potential correlates of offending in the same questionnaire, which allows one to explore variations in the level of crime and to test etiological theories. Even if nonprobability samples are used, self-report studies can provide valuable information about correlates of crime and delinquency (Junger-Tas & Marshall, 1999). This is why criminologists praise the self-report method as “one of the most important innovations in criminological research in the 20th century” (Thornberry & Krohn, 2000, p. 38).
When publishing results of self-report studies, responsible researchers caution the reader not to take estimates of the absolute level of crime too seriously. They know that their measures of crime are flawed and most likely underestimate the full extent of the problem. However, if the sampling frame is representative of the population, if there is no differential nonresponse, if the survey administration is compatible, and if underreporting is not systematically related to characteristics of the respondents, comparisons of the relative levels of crime across groups are acceptably valid—providing that the comparisons are based on data using identical or compatible questionnaires. Different questionnaires may result in different estimates of the prevalence or incidence of offending only because the instruments differ—even if the same survey mode (personal interviews, anonymous paper-and-pencil (P&P) questionnaires, or computerized interviewing) is used. Nevertheless, practitioners and policy makers not only are interested to learn about etiological models of crime and delinquency but also want to know more about the absolute levels of crime. They will also try to compare prevalence and incidence rates across different studies based on different questionnaires in order to see whether there are trends over time or whether certain regions or groups differ. Thus, it is not sufficient to attach warning labels to reports of self-reported delinquency, pointing to the possibility that differences in methods may result in different estimates of the amount of crime and that comparisons of levels may not be valid. Additionally, we need to know how serious the problem of using different methods of measuring crime in self-reported delinquency studies actually is.
Research shows that underreporting of socially undesirable behaviors in general and delinquent behavior (especially serious offending) in particular is common (Huizinga & Elliott, 1986; Krosnick & Presser, 2010; Tourangeau, Rips, & Rasinski, 2000; Tourangeau & Yan, 2007). To know which questionnaire design elicits higher prevalence or incidence rates of offending will also help us to improve the criterion validity of self-reports: If we accept the plausible assumption that underreporting of the prevalence or frequency of offending is far more likely than overreporting, self-report techniques yielding higher estimates are likely to produce more accurate results.
Research Questions
In 2005, we decided to participate in the second International Self-Report Delinquency (ISRD-2) study, a comparative study of youth crime and delinquency in 78 cities and small town clusters in 31 countries (Junger-Tas et al., 2010; Junger-Tas & Marshall, 2012). The ISRD-2 self-report delinquency instrument measures the lifetime prevalence, past year prevalence, and past year incidence (frequency) of 12 different offenses (see below). In previous years, we had already conducted a series of self-reported delinquency studies in the same population of juveniles in German cities (Enzmann & Wetzels, 2003; Wetzels, Enzmann, Mecklenburg, & Pfeiffer, 2001; Wilmers et al., 2002). Although the content and partially even the wording of many delinquency items were very similar and compatible, the design of the questionnaire differed: Whereas in the ISRD-2 questionnaire each question about the lifetime prevalence was followed by a series of five follow-up questions such that questions about two offenses took the space of one page, our previous instruments had only two questions per offence (lifetime prevalence and past year incidence); all self-reported delinquency items fit on a single page.
We anticipated that these differences in questionnaire design might result in different estimates of prevalence and incidence rates of offending. This created a dilemma: On the one hand, we wanted to be able to compare the level of delinquency as measured in the German part of the ISRD-2 study to results of our previous studies; on the other hand, we did not want to compromise the international compatibility of the ISRD-2 data by modifying the German questionnaire. Therefore, we decided to investigate the effects of a difference in the questionnaire design by setting up an experiment. The experimental group was surveyed by using the modified questionnaire and the control group by using the original ISRD-2 questionnaire.
There is a multitude of methodological survey research studying effects of questionnaire design on shaping the answers of respondents, thereby drawing on the psychology of cognition and social interaction (see Krosnick, 1999; Schaeffer & Presser, 2003; Schwarz, 1999). Many of its insights are important for the improvement of the questionnaire design and quality of self-report studies. But despite the wealth of knowledge produced, one can only guess which of the versions of the ISRD-2 questionnaire will produce higher rates of offending (if there are any differences at all). Specifically, the experimental study to test effects of the modification of the ISRD-2 questionnaire tries to answer four questions:
Is there a difference in the level of self-reported delinquency (lifetime prevalence, past year prevalence, or past year incidence) between the original (long) and the modified (short) versions of the questionnaire? Knowledge about the size of the difference in levels of self-reported offending due to the design of the questionnaire is already an important outcome. However, it is possible that the questionnaire design affects not all respondents in the same way. In this case, we talk about differential effects. This issue will be investigated when answering Research Question 3 (see below). If there are differences in the level of reported delinquency (i.e., if one version shows more underreporting than the other), it is still possible that causal models explain delinquent behavior independently of the version used. This issue will be explored when answering Research Question 4.
Are there differences in item nonresponse between both versions? In the original (long) version, the questions about lifetime prevalence of offending are clearly recognizable as filter questions, but less so in the modified (short) version (see below). Research has shown that the design of branching can have strong effects on item nonresponse of the follow-up questions (Redline & Dillman, 2002). If the two versions of the ISRD-2 questionnaire produce different rates of item nonresponse, we would expect higher rates as to the follow-up questions about past time incidences of the short version.
Item nonresponse can also be due to response fatigue (Krosnick & Presser, 2010). Because respondents have to answer far more follow-up questions in the long version, it is conceivable that the rate of nonresponse increases with the number of items already answered. This should affect items of lifetime prevalence of the long version.
Finally, item nonresponse can also be due to social desirability (Tourangeau & Yan, 2007). Because only the long version contains follow-up questions about detection by the police and punishment (see below), as a context effect this might increase the tendency of delinquent respondents to refuse answers to subsequent questions about their delinquent behavior. This would be an explanation of a higher rate of nonresponse of lifetime prevalence items in the long version of the questionnaire.
Investigating effects of the questionnaire design on item nonresponse is important because different levels of crime rates between the two versions (Research Question 1) might be due to differential item nonresponse stimulated by the questionnaire design. Differential nonresponse, however, implies the existence of interaction effects of the questionnaire design and respondents’ characteristics. This leads to Question 3.
(3) Are effects of the questionnaire design independent of characteristics of the respondents, or do effects of the questionnaire design and respondent characteristics interact? To explore this issue, effects of demographic characteristics of the respondents (sex, age, school type, migration status, family affluence) that might be associated with delinquent behavior will be investigated. Of special importance in this context are the effects of (low) self-control on item nonresponse. Already Gottfredson and Hirschi asserted that self-control is related to the precision and hence the validity of respondents’ self-reports of delinquent behavior (Hirschi & Gottfredson, 1993). Watkins and Melde (2007) showed that adolescents with low self-control are more likely to leave items measuring offending behavior unanswered.
Item nonresponse of respondents with low self-control may not be due to a higher need of socially desirable responding among delinquents but can also be explained by “satisficing,” a tendency to expend less energy in generating optimal answers to questions that are more difficult to answer (Krosnick, 1999). Instead of putting effort in generating accurate answers, satisficing respondents will settle for merely satisfactory answers or will refuse altogether to think about answers to more difficult questions. This has different consequences for the nonresponse of minor and serious offense items: The exact frequency of common behaviors is more difficult to retrieve than the frequency of serious and rare events (Huizinga & Elliott, 1986; Schwarz & Sudman, 1994). When asking respondents with low self-control about the frequency of having committed minor (i.e., more common) offenses, we should thus expect more item nonresponse than when asking about the frequency of serious (rare) offenses.
Likewise, respondents with low self-control may more often fail to answer follow-up questions if it is possible to overlook them. Thus, interaction effects of questionnaire design and self-control on item nonresponse are possible.
(4) Do effects of variables to predict offending (e.g., bonding to parents, disorganized neighborhood, risky lifestyle) differ by the version of the questionnaire used? This question is important because of the often voiced assertion that valid etiological models of crime and delinquency are possible despite the problem of underreporting in self-reports. If the long and short versions of the questionnaire differ in the level of self-reported delinquency measured, differences in crime rates are exclusively due to the experimental condition: The samples of the control group and experimental group are randomly drawn from the same population, and the administration of the questionnaire as well as the operationalization of the constructs treated as predictors of delinquency is identical. By comparing effect sizes and variances explained by causal models to predict delinquent behaviors across the experimental groups, it is possible to test whether underreporting affects the validity of etiological models.
To examine this issue, several models to explain delinquent behaviors will be analyzed. Next to control variables (demographics) the effects of family, neighborhood, and lifestyle variables will be compared across the experimental groups. Note, however, that the substantial explanation of delinquent behavior is not at the focus of this study.
Procedure
Design Versions of the Self-Reported Delinquency Questionnaire
To investigate the effects of designing questions about self-reported offending differently, two versions of the ISRD questionnaire were used. The original (long) version of the ISRD-2 study (ISRD-2 Working Group, 2005; see Marshall & Enzmann, 2012b) and a shortened version. In the long version, the question about lifetime prevalence is clearly indicated as a filter question. Next, a series of questions follows, asking about the age when the respondent did this for the first time, whether he or she did this during the past year (past year prevalence), and (if yes) how often (past year incidence). The frequency is asked using an open-response format. Additionally, referring to the past time of committing the offense, the respondent is asked whether he or she did it alone or with others (adults or other kids), whether it was found out by parents, the police, teachers, or someone else, and whether he or she was punished (if found out). The self-report offending section of the questionnaire took seven pages, with two (sets of) offense questions per page. Questions about lifetime and past year consumption of alcohol and drugs preceding the self-report offending section were constructed in the same manner and took another two and a half pages.
The design of the short version questionnaire differed with respect to the items asking about self-reported offending. In the short version, each question about the lifetime prevalence of an offense is immediately followed by an open-response question about the frequency during the past year, omitting the additional answer options “no” and “yes” about the past year prevalence (see Attachments 1 and 2). Furthermore, the sequence of the closed-question options “no” and “yes” of the lifetime prevalence was changed and ordered horizontally instead of vertically. It was expected that offering the “yes” option first might facilitate an affirmative answer of sensitive questions. In the short version, all self-reported offending items fitted on one page. In this way, respondents could overlook the series of questions at a glance. Preceding questions about lifetime and past year consumption of alcohol and drugs were shortened in the same way and reduced to a half page. Apart from condensing the layout of the drug use and offense items to one and a half pages and from dropping all follow-up questions except for the past year incidence (frequency), the sequence and wording of the self-report items and the contents of the preceding parts of the questionnaire were identical.
Measures
The 12 offenses measured in both versions can be grouped into property and violent offenses and into minor and serious delinquency. 1 The groupings we are using are minor property offenses (vandalism, shoplifting), serious property offenses (burglary, bicycle theft, car theft, and car breaking—that is, stealing from a car), minor violent offenses (carrying a weapon, group fights), and serious violent offenses (snatching, extortion, assault). An additional item asked about involvement in drug dealing. From this, we construct three indicators: Lifetime prevalence, past year prevalence, and past year incidence 2 per offense plus past year versatility (variety), which refers to the number of different offenses committed during the past year (sum of past year prevalences per person ranging from 0 to 12).
Alcohol and drug use was measured in the same way, however the reference period of incidences was restricted to the past month. There are four kinds of consumption measures: (1) beer, breezers, or wine; (2) strong spirits; (3) marijuana; and (4) hard drugs (ecstasy, speed, LSD, cocaine, or heroin)—each in the form of lifetime prevalence, past month prevalence, and past month incidence.
Victimization experiences were measured by questions about robbery, assault, personal theft, and bullying (past year prevalence and incidence). Demographic variables were sex, age, grade (seventh, eighth, or ninth), 3 school type (lower level, intermediate level/comprehensive, higher level/gymnasium), migration status (native born vs. first- or second-generation migrant), family structure (living with both biological parents or not), and family affluence. The latter serves as a proxy of social status and was measured by the number of rooms for children, car ownership, and consumer goods in the household (Boyce, Torsheim, Currie, & Zambon, 2006).
Self-control was measured using a shortened 12-item version of the Grasmick et al. self-control scale (Grasmick, Tittle, Bursik, & Arneklev, 1993; see also Marshall & Enzmann, 2012a) (Cronbach’s alpha = .83). Additional measures to test the effect of the questionnaire design on etiological models of delinquency (Research Question 4) are family disruption, family bonding, parental supervision, neighborhood bonding, neighborhood disorganization, neighborhood integration, lifestyle, number of risk behaviors, and delinquency of friends. Because the explanation of delinquent behavior using these predictor variables is not the focus of the article, the reader is referred for further details of operationalization to Marshall and Enzmann (2012b) and additional chapters of that volume.
Experimental Groups and Data
The two versions of the questionnaire were assigned randomly to a random sample of school classes of a large German city. In the context of the German part of the ISRD-2 study in 2006 (Enzmann, 2010), the control group (long version) classes were surveyed using the original ISRD-2 questionnaire in exactly the same way as the experimental group (short version) classes, which used the shortened version of the questionnaire. The school classes were randomly sampled stratified by school type (public secondary schools of lower level, integrated/comprehensive schools, and academic track [i.e., gymnasium]) and grade (Grade 7 to 9). A total of 78 classes in 41 schools took part (39 per control and experimental group). Although the cooperation rate at the level of school principals and teachers was low (schools 62% and classes 44% of the sampling frame), the participation rate of students of cooperating classes was much higher (83.9%). No cooperation at the level of schools and classes is presumably less a threat to the representativeness of the sample than nonresponse at the level of the students (some due to a parental veto, some to absenteeism of a student, to direct refusal of participation during the survey, or to unusable questionnaires).
In this context, it is important to note that the response rate in the long version group (80.1%, 782 participants) was lower than in the short version group (87.9%, 822 participants); this difference is statistically significant (z = −4.64, p < .001). The response rates were not equally distributed across grades (long: Grade 7 students 91.8%, Grade 8 students 72.9%, Grade 9 students 70.9%; short: Grade 7 students 85.1%, Grade 8 students 86.5%, Grade 9 students 95.0%), resulting in different proportions of students per grade by experimental condition, Chi2(2) = 6.61, p = .037. The two groups, however, do not differ by school type, Chi2(2) = 0.94, p = .625, sex, Chi2(1) = 0.16, p = .691, age, t(1,600) = 0.16, p = .873, or migration status, Chi2(1) = 0.09, p = .768. To compensate for deviations from population proportions due to (differential) unit nonresponse, the data of all subsequent analyses are weighted according to grade and school type. This effectively removes any differences between the experimental groups as to grade and school type. Additionally, all analyses will take into account possible design effects (Lohr, 1999) due to the clustered sampling of students within classes.
Using weighted samples, 50.2% (long version group) and 49.5% (short version group) of the respondents are female, and the mean age is 13.9 years in both groups; 38.6% and 40.7% are either first- or second-generation migrants (long and short version, respectively). Weighting reduced the nearly significant differences between the groups as to students living in families without both of their biological parents: In the weighted sample 33.4% (long version) and 38.4% (short version) live in incomplete families, F(1, 69) = 2.2, p = .140. Also as to family affluence, the experimental groups do not differ significantly (M = 90.1 vs. 89.2 in the groups “long” and “short”), t(1,596) = −0.58, p = .562. Concerning these variables as potential covariates of delinquency, one should not expect any differences of self-reported offending between the two experimental groups.
Results
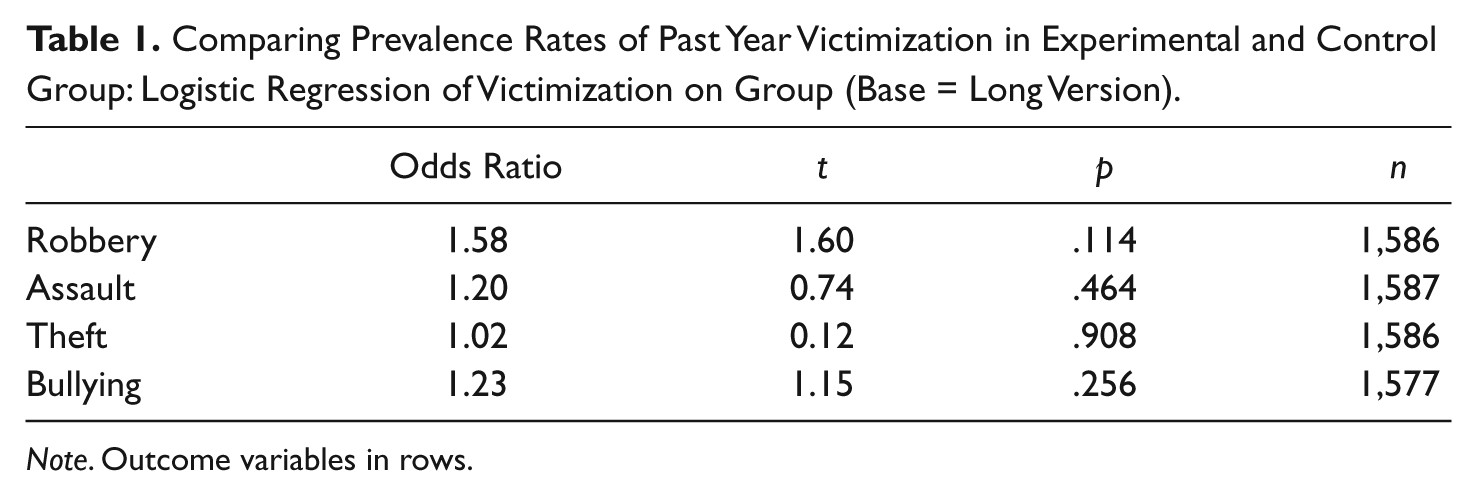
A strong indication that the students (school classes) were successfully assigned to the experimental and control group is the finding that both groups do not differ as to criminal victimization during the past year (Figure 1 and Table 1). Although the prevalence rates of robbery and bullying are somewhat higher in the short version group, the differences are not statistically significant and the effect sizes are small. We know from other studies that among adolescents there is a considerable victim–offender overlap and victimization experiences are strongly related to offending (Berg, Stewart, Schreck, & Simons, 2012). All the more, this finding demonstrates (together with the finding of nonsignificant differences as to demographic characteristics) that the experimental and control group are compatible and modifications of the questionnaire did not affect responses to questions in other parts of the questionnaire.
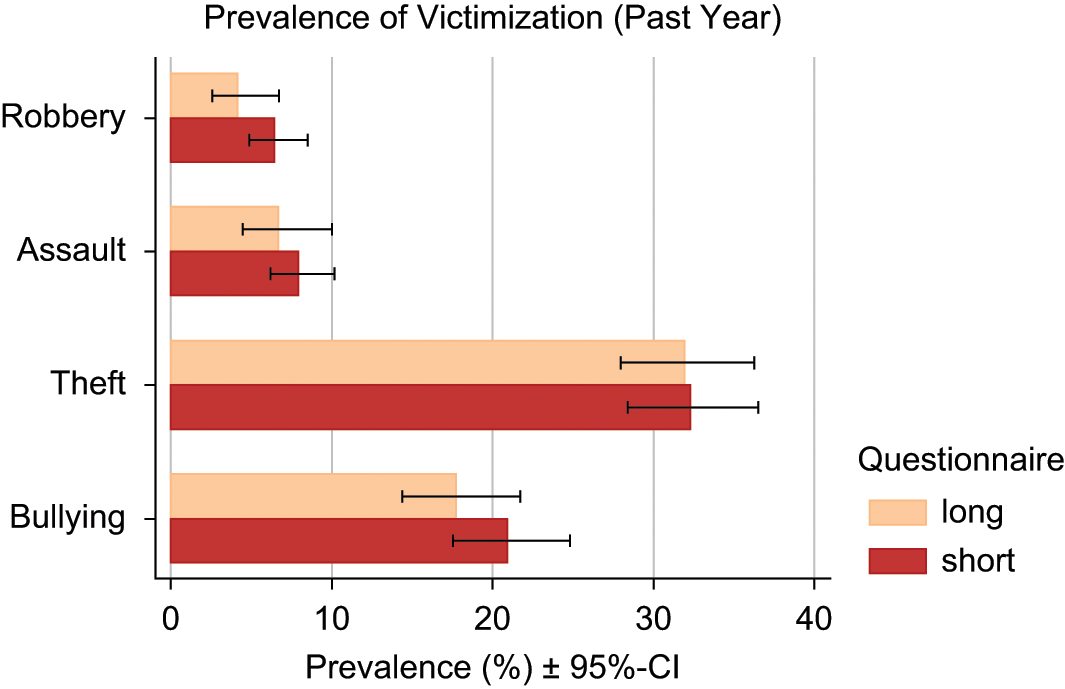
Past Year Prevalence of Victimization.
Comparing Prevalence Rates of Past Year Victimization in Experimental and Control Group: Logistic Regression of Victimization on Group (Base = Long Version).
Note. Outcome variables in rows.
Prevalence Rates of Alcohol and Drug Use
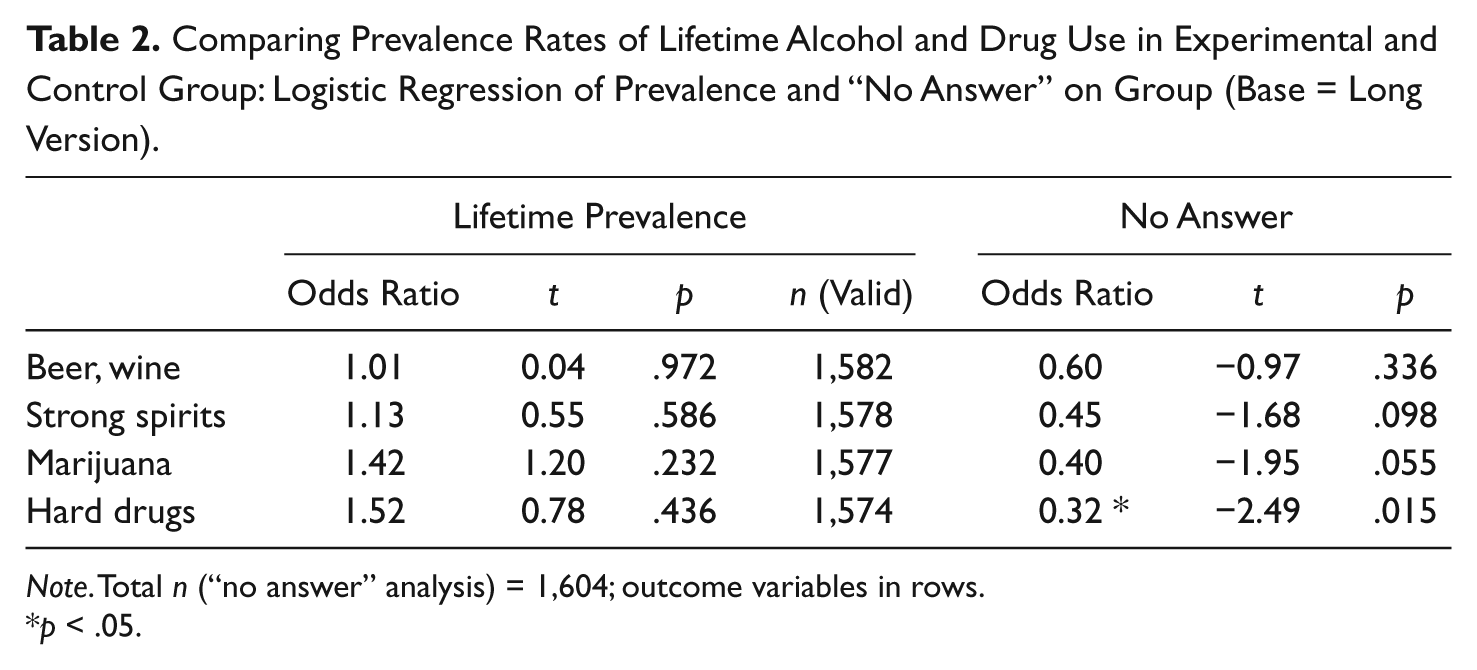
A first indication that the modification of the questionnaire affects the responses can already be observed as to the prevalences of alcohol and drug use (Figure 2, Table 2, and Table 3) (the questions were modified in the same way as the questions to measure self-reported offending). Whereas the rates of the lifetime prevalence do not differ significantly, the past month prevalence rates of beer/wine, strong spirits, and marijuana use are significantly higher in the short version group. As to the use of strong spirits and marijuana, the effect sizes are strong: In the short version group, the prevalence rates are about twice as high.
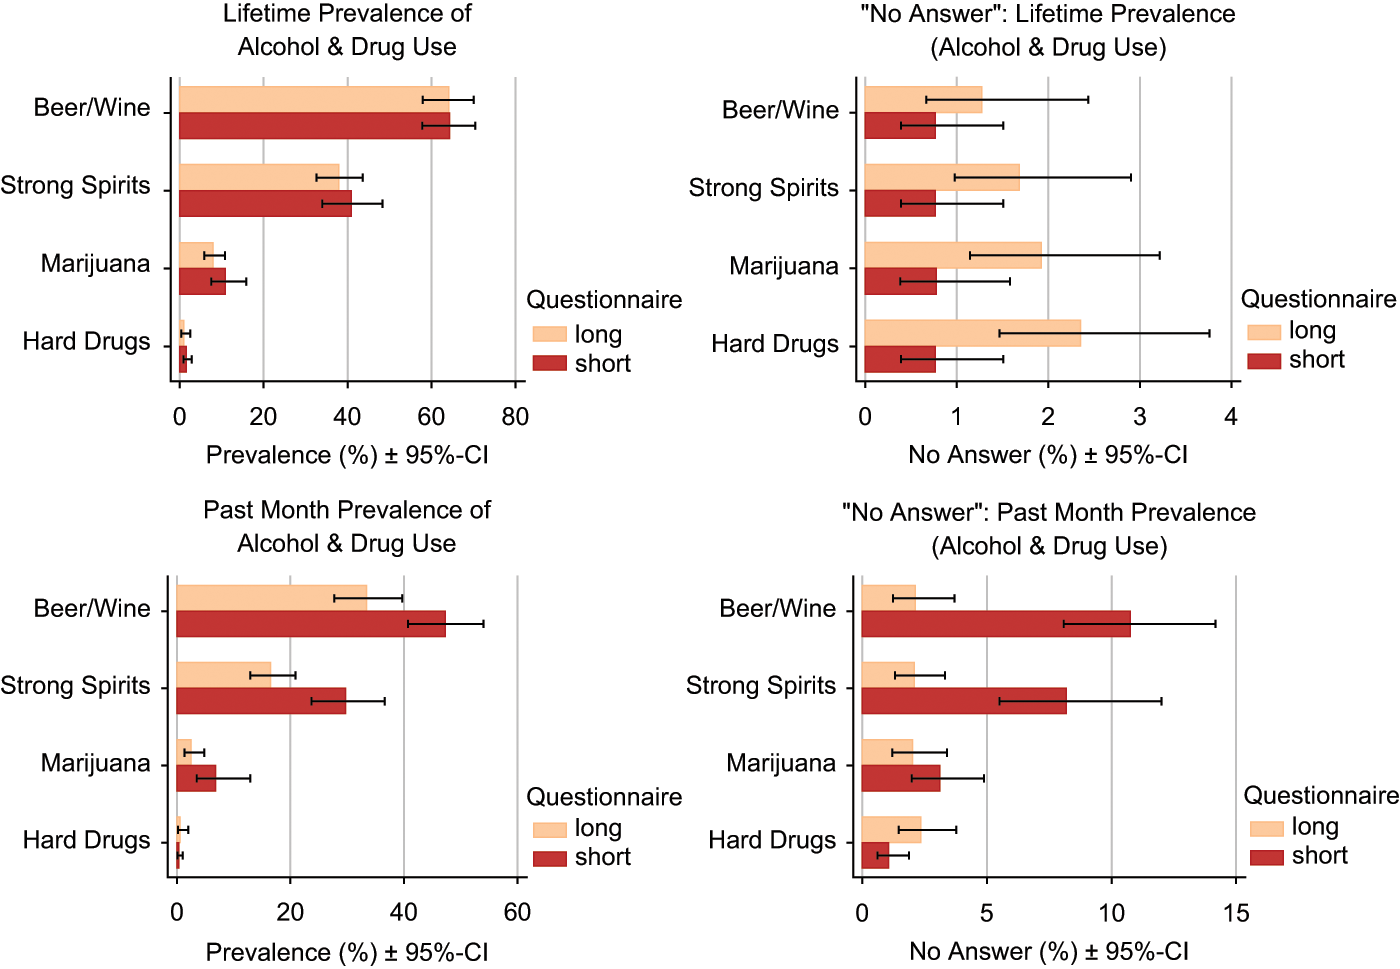
Lifetime and Past Month Prevalence of Alcohol and Drug Use and Item Nonresponse.
Comparing Prevalence Rates of Lifetime Alcohol and Drug Use in Experimental and Control Group: Logistic Regression of Prevalence and “No Answer” on Group (Base = Long Version).
Note. Total n (“no answer” analysis) = 1,604; outcome variables in rows.
p < .05.
Comparing Prevalence Rates of Past Month Alcohol and Drug Use in Experimental and Control Group: Logistic Regression of Prevalence and “No Answer” on Group (Base = Long Version).

Note. Total n (“no answer” analysis) = 1,604; outcome variables in rows.
p < .05. **p < .01. ***p < .001.
The questionnaire design affects not only the past month prevalence rates but also the item nonresponse of questions as to lifetime and the past month consumption (Figure 2, Table 2, and Table 3). Although the nonresponse rate of lifetime items is significantly different only with respect to hard drug use (the effect size of 0.32 = 1/3.1 is large), there is a clear pattern: (a) The overall nonresponse rates of lifetime items are much smaller than the overall nonresponse rates of last month items; (b) the nonresponse of the lifetime (filter) questions is systematically higher in the long version group; and (c) if significant, the nonresponse of the follow-up questions (last month items) is higher in the short version group. If significant, there are huge differences.
One may wonder whether the much higher rates of the last month prevalence of alcohol and marijuana use in the short version group can be explained by the much higher nonresponse rates in this group. Table 4 shows the comparison of the past month prevalence rates of the long and short version groups by assuming that all respondents with missing answers of the past month prevalence items (if answering “yes” to the questions about lifetime prevalence) did not consume any alcohol or drug during the past month. Even under the strong assumption of no consumption of those who did not answer a question, there are still significant and much higher past month prevalence rates in the short version group. Thus, the higher item nonresponse in this group cannot explain the simultaneously higher past month prevalence rates.
Comparing Prevalence Rates (Assuming “No Answer” = Never) a of Past Month Alcohol and Drug Use in Experimental and Control Group: Logistic Regression of Prevalence on Group (Base = Long Version).

If lifetime prevalence = “yes”; outcome variables in rows.
p < .05. **p < .01.
Rates of Lifetime and Last Year Offending
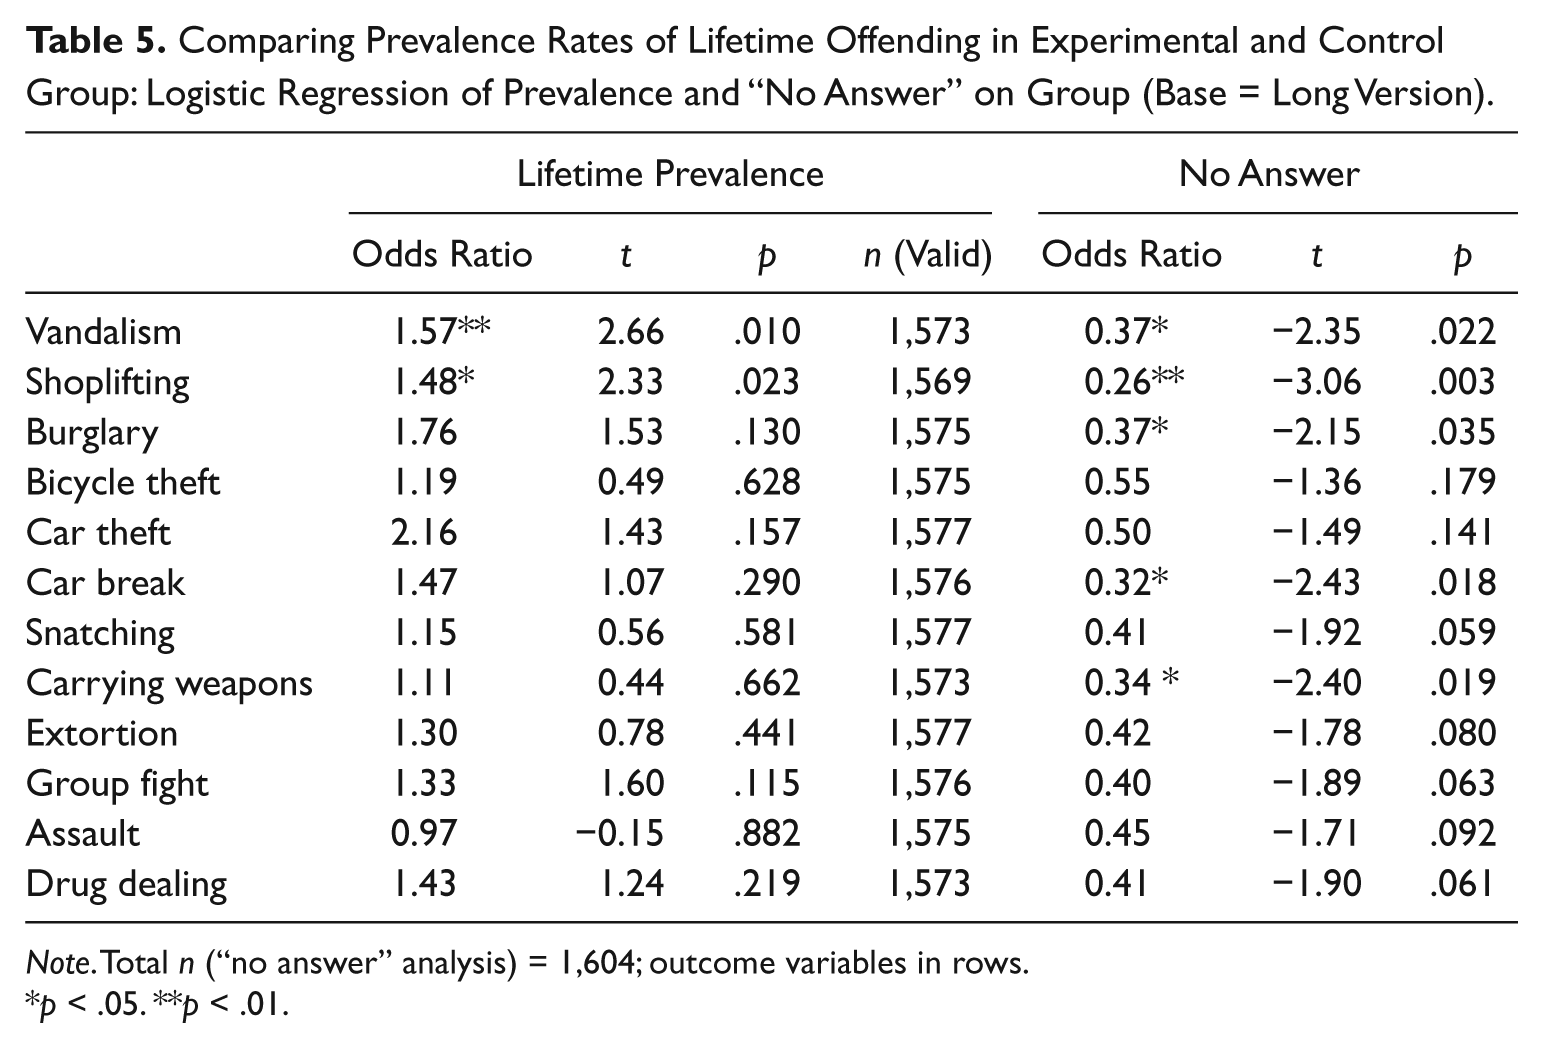
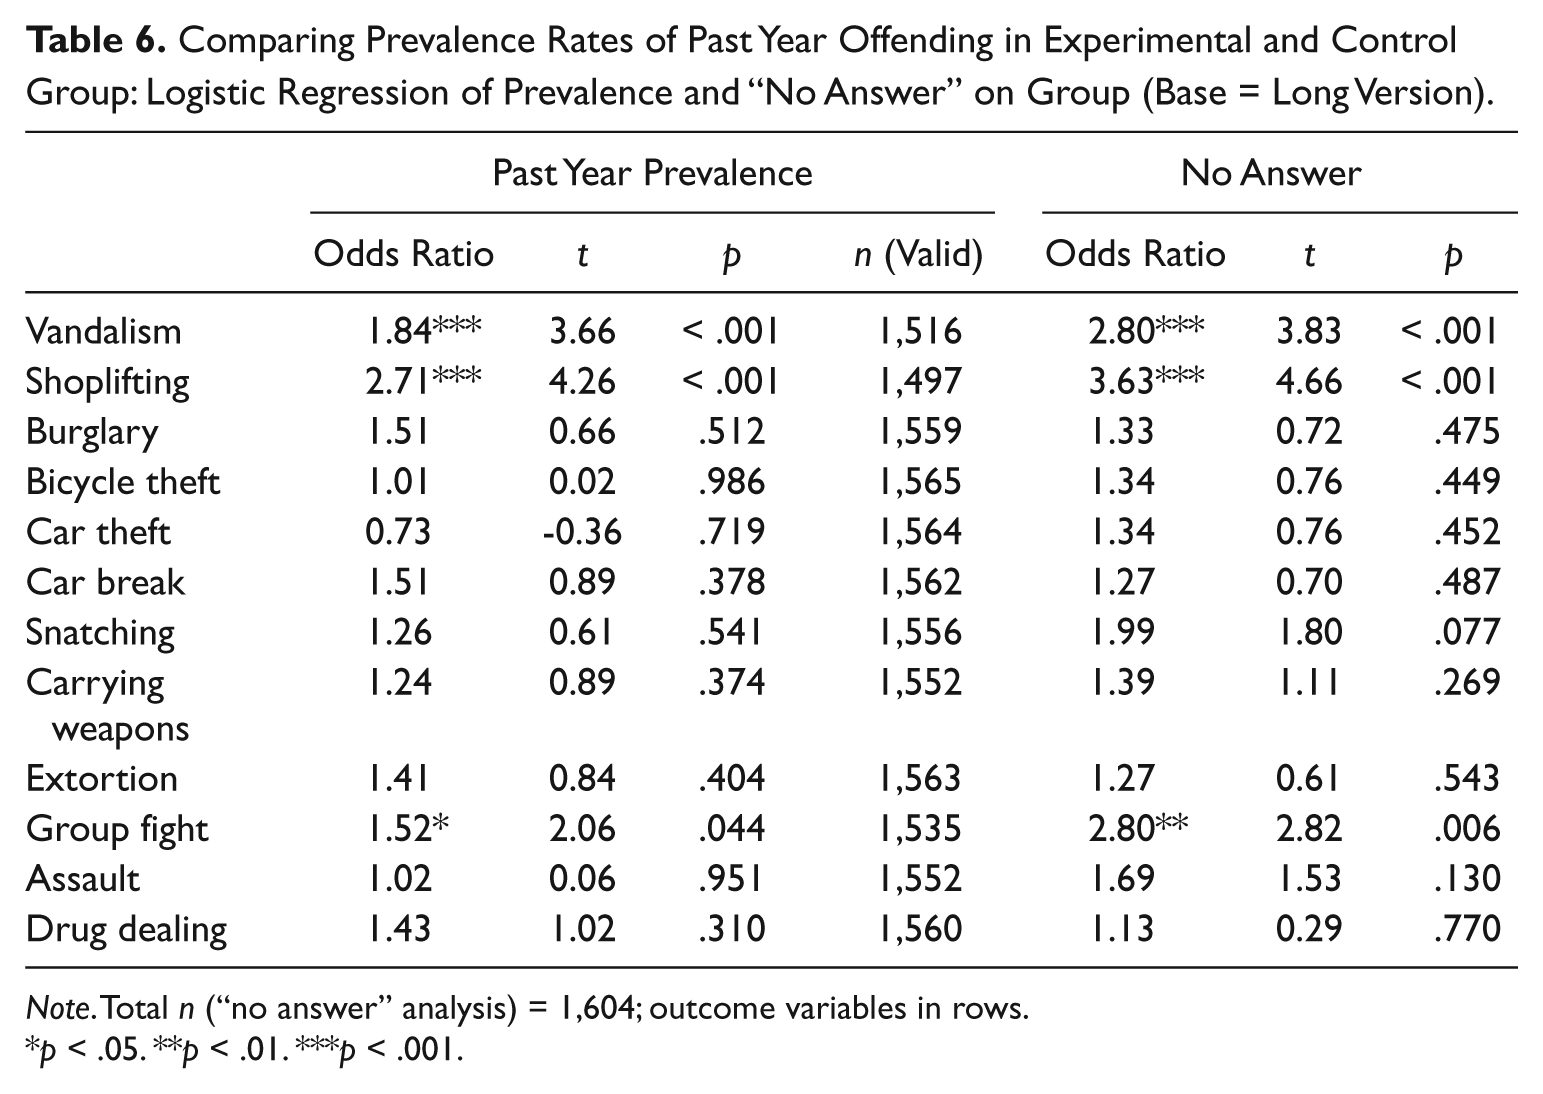
Figure 3, Table 5, and Table 6 compare lifetime and past year prevalences of offending in the long and short version groups. Effects of the questionnaire design on both measures of delinquency are observable. Although effects on lifetime prevalences are smaller than effects on past year prevalences, for both types of prevalences, a similar pattern emerges: The prevalence rates tend to be higher in the short version group, and the differences are most pronounced as to the more frequent offenses.
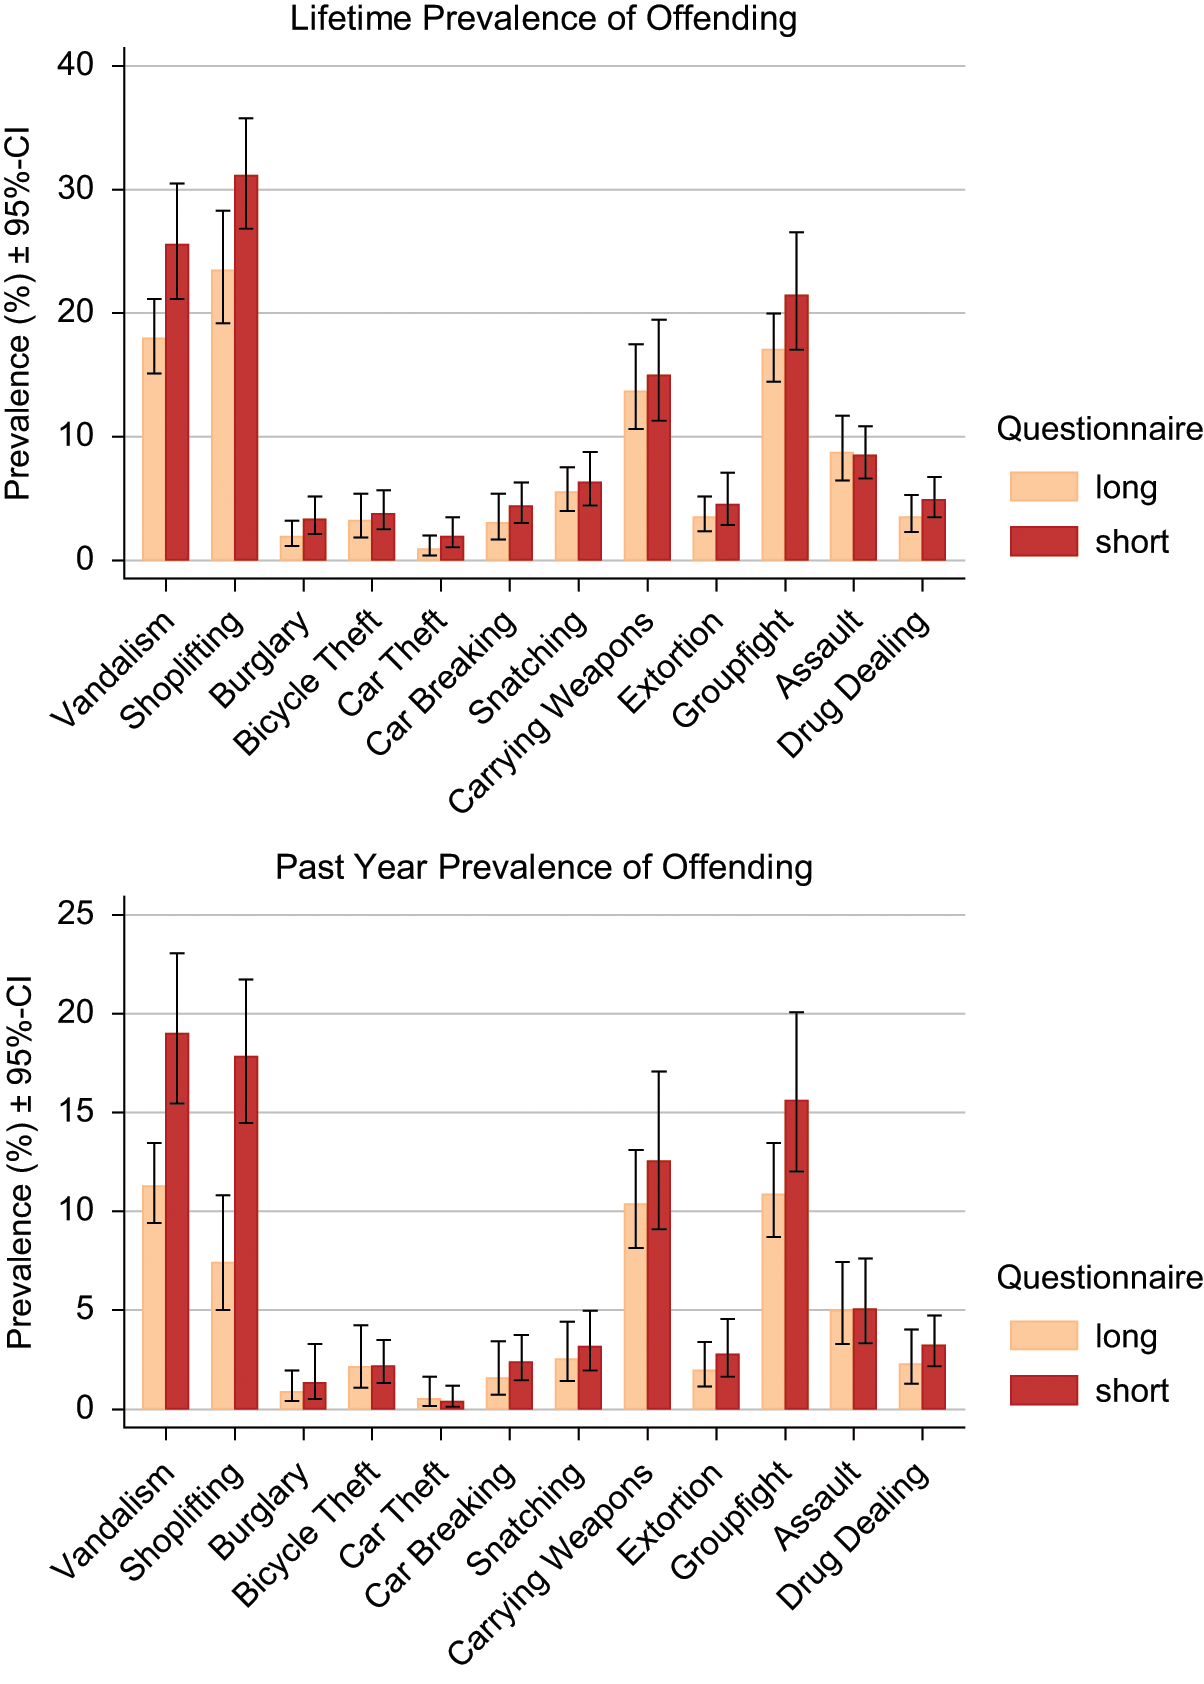
Lifetime and Past Year Prevalence of Offending.
Comparing Prevalence Rates of Lifetime Offending in Experimental and Control Group: Logistic Regression of Prevalence and “No Answer” on Group (Base = Long Version).
Note. Total n (“no answer” analysis) = 1,604; outcome variables in rows.
p < .05. **p < .01.
Comparing Prevalence Rates of Past Year Offending in Experimental and Control Group: Logistic Regression of Prevalence and “No Answer” on Group (Base = Long Version).
Note. Total n (“no answer” analysis) = 1,604; outcome variables in rows.
p < .05. **p < .01. ***p < .001.
The lifetime prevalences of vandalism and shoplifting are about 50% higher using the short version of the questionnaire. Although similar effect sizes can be observed as to other offenses, they fail to be statistically significant.
Differences of past year prevalences are even larger: The short version elicits significantly higher rates of the overall most frequent offenses of vandalism, shoplifting, and group fights. In the short version group, the past year prevalence rate is more than two times higher (17.8% of the juveniles vs. 7.4% in the long version group).
The design of the questionnaire not only affects the measurement of the level of delinquency but has also a strong impact on the number of missing answers. Figure 4 and again Table 5 and Table 6 show the differences of item nonresponse between the two designs. A clear pattern emerges: Whereas the item nonresponse of the lifetime prevalence questions is about 2% in the long version group, using the short version nonresponse is less than 1%. This difference is significant as to vandalism, shoplifting, burglary, car break, and carrying weapons. However, as to the past year prevalence (and hence also the past year incidence) questions in the short version group, nonresponse is clearly and significantly higher concerning the items of the overall most frequent offenses of vandalism, shoplifting, and group fights. Whereas the item nonresponse is about 2% under the condition of the long version, is it between 2% and 10% using the short version questionnaire.

Nonresponse of Lifetime and Past Year Offending Items.
Because the items that produce higher past year prevalence rates in the short version group are also the items showing much more missing answers, it might be conceivable that the higher prevalence rates are due to differential item nonresponse of juveniles who did not commit these offenses during the past year. To explore this possibility, the past year prevalence rates were re-estimated under the assumption that the true answers of students who missed the answer to questions about the past year prevalence (or incidence) (but did answer the respective questions about their lifetime delinquency) would have been “never during the past year.” However, results show (Table 7) that even under this assumption the past year prevalence rates of vandalism and shoplifting are still significantly higher in the short version group (17.8% and 16.2% as compared to 11.2% and 7.4% in the long version group). Obviously, although questions about delinquency during the past year yield higher item nonresponse rates when using the short version, overall the long version produces more underreporting (at least with respect to the more common offenses) than the short version.
Comparing Prevalence Rates (Assuming “No Answer” = Never) a of Past Year Offending in Experimental and Control Group: Logistic Regression of Prevalence on Group (Base = Long Version).

Note. Outcome variables in rows.
If lifetime prevalence = “yes.”
p < .01. ***p < .001.
The question remains whether this underreporting affects only the prevalence rates or also the incidence rates of past year offending. Or to put it differently, does the questionnaire design only determine whether the question about the past year prevalence is answered positively, or does it also affect the number of offenses admitted? This issue can be investigated by using hurdle regression models for count data (see McDowell, 2003), which estimate two regression coefficients per predictor: The first parameter represents a logistic regression coefficient predicting whether the incidence is zero or not, whereas the second parameter is a regression coefficient of a count model that estimates the effect of the predictor on the number of events once the hurdle is crossed. The model does not constrain the processes generating the zeros and the counts to be the same (Cameron & Trivedi, 1998).
Because serious offenses are rare events, to increase the stability of the count estimates, serious property offenses and serious violent offenses each were combined by calculating sum scores of the respective incidences. The analyses 4 reported in Table 8 show that the questionnaire design affects not only whether being delinquent is admitted or not (logistic regression part) but also the admission of the number of delinquent acts (negative binomial regression part). Whereas more than twice as many respondents admitted the commission of vandalism, shoplifting, and group fights, also the frequency of carrying weapons or being involved in group fights more than doubles in the short version group. In other words, in the long version, underreporting can be observed as to all minor offenses, either due to higher counts of nos or due to lower numbers of incidences, or due to both. The higher incidence rates in the short version as to the minor violent offenses are noteworthy because these are offenses characteristic for chronic offenders who seem to underreport their behavior when using the long version of the questionnaire.
Comparing Incidence Rates of Past Year Offending in Experimental and Control Group: Negative Binomial-Logit Hurdle Regression of Incidence on Group (Base = Long Version).

Note. Outcome variables in rows.
p < .01. ***p < .001.
Predicting Item Nonresponse
As shown above, item nonresponse is strongly influenced by the design of the questionnaire. To investigate whether item nonresponse also depends on characteristics of the respondents and whether respondents’ characteristics and questionnaire design interact, the number of missing answers per person was analyzed using a series of regression models. Sums of missing responses were calculated over questions about victimization experiences (four items), lifetime and past month prevalence of substance use (five items each), and lifetime prevalence, past year prevalence, and past year incidence of self-reported offending (12 items each).
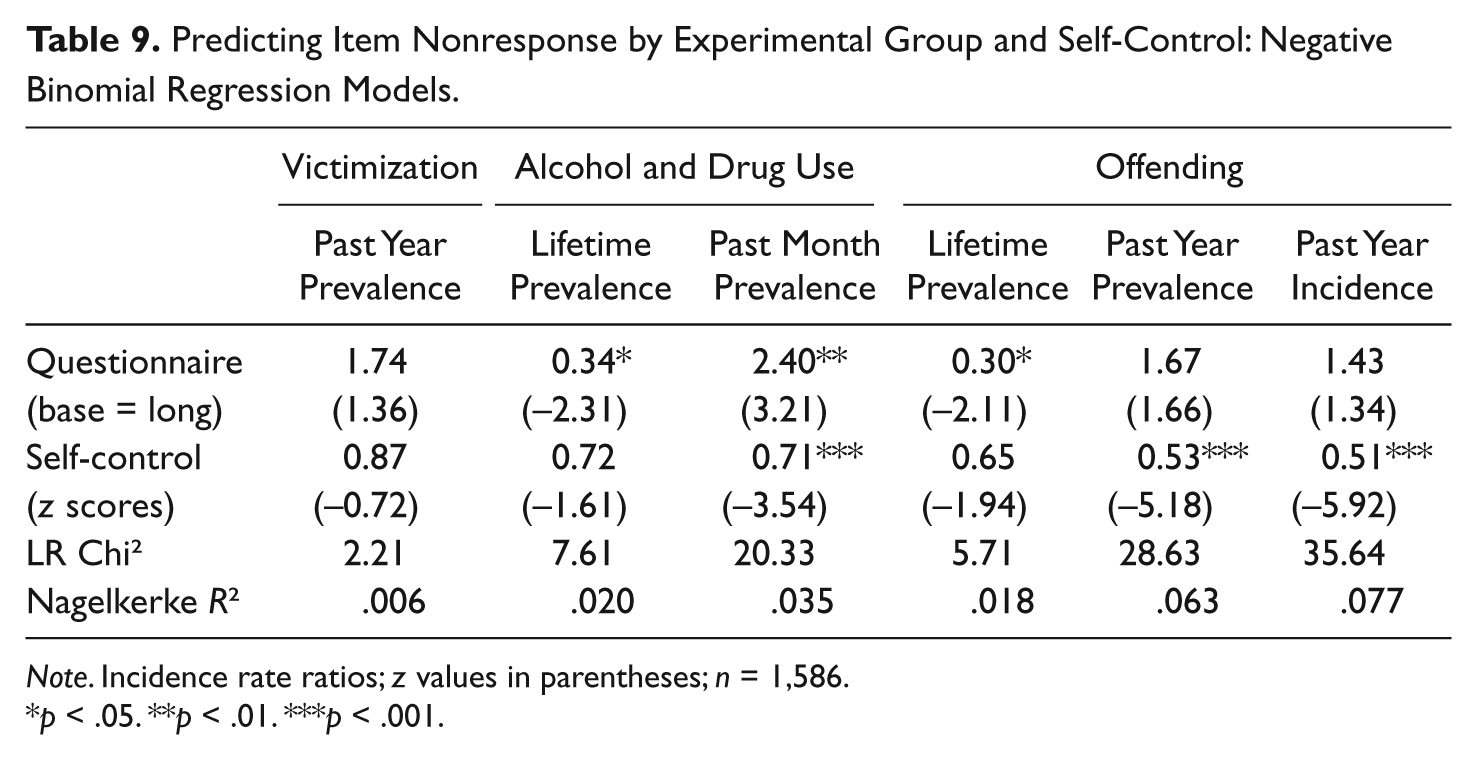
The effects of (low) self-control are especially interesting. Table 9 displays the main effects of the experimental condition (long vs. short version) and self-control on the number of missing items. The design of the long and short versions of the questionnaire does not differ with respect to the victimization items. Therefore, as expected, the number of missing victimization items per person does not differ between the two experimental groups. Also, missingness of the victimization items does not depend on self-control of the respondents.
Predicting Item Nonresponse by Experimental Group and Self-Control: Negative Binomial Regression Models.
Note. Incidence rate ratios; z values in parentheses; n = 1,586.
p < .05. **p < .01. ***p < .001.
However, when comparing the long and short version groups as to the number of missing substance use and offending items, we find strong differences, either depending on the questionnaire design or on the self-control of the respondents, or on both. Concerning the filter questions (lifetime substance use and lifetime offending), the number of missing items is about three times higher in the long version group, and self-control has no effect. In contrast, concerning the follow-up questions (past month prevalence of substance use and past year prevalence and incidence of offending), the number of missing items is higher in the short version group—however, only significantly as to the past month prevalence items of substance use. Remarkably, concerning the follow-up questions, respondents with low self-control generate substantially and significantly more missing answers. The effects of self-control are especially strong as to the past year prevalence and incidence of offending: An increase of 1 standard deviation of self-control reduces the incidence rates of missingness to about a half.
The picture does not change when adding the interaction of experimental condition and self-control to the models in order to test whether (low) self-control buffers (or amplifies) the effect of the questionnaire design: In none of the regression models is the interaction of questionnaire version and self-control significant. To sum up, although self-control explains some of the differences in nonresponse between the two experimental conditions (Table 9), the effect of the questionnaire design does not differ as to the level of self-control of the respondents.
In a last step, additionally to self-control, main and interaction effects of sex, grade, school type, and migration status on the number of missing answers to the last year incidence of offending items were investigated (full model). Results show that none of these variables interact significantly with the experimental condition, indicating that there are no differential effects of the questionnaire design on item nonresponse.
However, and most interestingly, in the full model without the interaction terms, all predictors are significantly related to the number of missing responses; the Nagelkerke pseudo-R2 indicates that this model explains about 15% of the variability of missing responses. Here, the incidence rate of the short version group is significantly higher (incidence rate ratio [IRR] = 1.73, z = 3.06, p = .002). Additionally, the number of missing answers is higher among males (IRR = 2.28, z = 5.25, p < .001), students of Grade 7 classes opposed to Grade 8 or Grade 9 classes (IRR = 0.57 and 0.61, z = −2.56 and −2.21, p = .011 and .027), students of lower level schools opposed to medium/comprehensive or higher level schools (IRR = 0.54 and 0.23, z = −1.96 and −4.19, p = .050 and < .001), and migrants (IRR = 1.80, z = 3.58, p < .001), and it depends strongly on the self-control of the respondents (IRR = 0.56, z = −5.94, p < .001). To illustrate, the estimated number of missing offence incidence items of a seventh grade male migrant attending a lower level school with a self-control score 0.5 standard deviation below the average is by a factor 45.2 higher than the number of missing items of a ninth-grade female native student attending a higher level school (gymnasium) with a self-control score 0.5 standard deviations above the average. If, on top of this, the boy responds to the short version and the girl responds to the long version, this factor will be further increased by 1.73 to a factor of 78.0.
Because we know from other studies that all these variables (probably with the exception of grade) are positively related to delinquency, this is a strong indication of differential underreporting (i.e., underestimation) of delinquency due to item nonresponse. Although the short version produces higher estimates of delinquency (and thus presumably less underreporting) than the long version, it is most likely that its rates still underestimate the prevalence and amount of delinquency—at least with respect to the minor offenses.
Effect Sizes of Variables Predicting Delinquent Behaviors
To explore whether the questionnaire design also affects the effect sizes of variables in etiological models to predict delinquency, three different sets of predictor variables were investigated. Apart from variables to control statistically for confounders (sex, grade, school type, and migration status), the first model (Model 1) uses family factors (completeness of family, family disruption, family bonding, and parental supervision), the second (Model 2) uses neighborhood variables (neighborhood bonding, neighborhood disorganization, and neighborhood integration), and the third (Model 3) uses indicators of the respondents’ lifestyle (self-control, lifestyle composed of different leisure time behaviors [Steketee, 2012], risk behaviors, and delinquency of friends) as predictors. Outcome variables were the past year incidences of shoplifting and vandalism as well as versatility as an aggregate measure of delinquency. In each model, the interaction of each predictor variable with the experimental condition was tested for significance. By employing negative binomial regression models per outcome variable, the effects of sets of predictors of the three models plus the model variance explained (pseudo-R2) were compared between the long and short version groups.
With only a few exceptions, no substantial differences of effect sizes between groups could be observed, although in some instances, significant effects in one group failed to reach the level of significance in the other. If we had no information about the results in the other group, we presumably would interpret the significant effect as a noteworthy result. However, tests of interaction effects showed that virtually none of the effects on the outcome variables differed significantly between the two versions of the questionnaire. 5
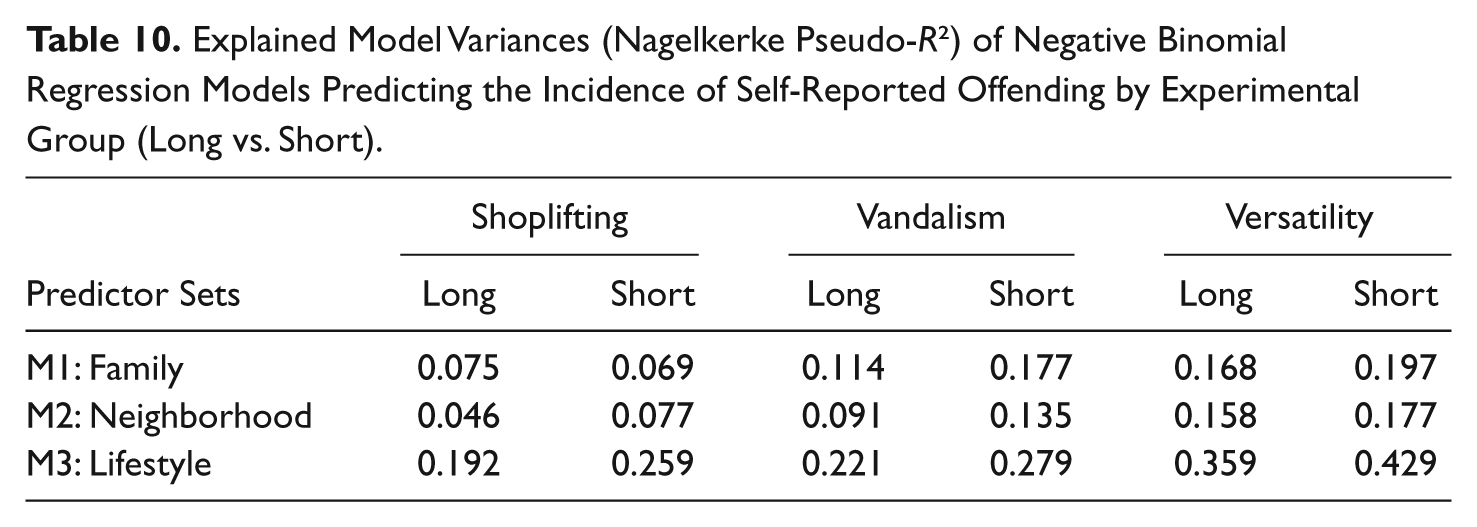
Despite the similarity of the results as to single effect sizes, in the short version group, the predictors explain more variance than in the long version group (Table 10). As to the Model 1 variables, the average pseudo-R2 of the short version group is 1.22 times larger; concerning Model 2, the factor is 1.43 (absolute difference: 3.6%). Again, with respect to Model 3, not much but consistently more variance is explained by data generated with the short version of the questionnaire (the average pseudo-R2 is 1.27 times larger).
Explained Model Variances (Nagelkerke Pseudo-R2) of Negative Binomial Regression Models Predicting the Incidence of Self-Reported Offending by Experimental Group (Long vs. Short).
Discussion
Main Findings
Using an experimental design, this study investigated the effects of modifying the layout of self-reported delinquency questions on the prevalence and incidence rates of delinquent behavior and on the rate of item nonresponse. Additionally, it explored the interaction of person characteristics and questionnaire design and tried to answer the question of whether the size of effects is affected by the design of the delinquency items when trying to explain self-reported offending by various predictor variables.
Results show that a questionnaire with (a) only two questions per offense (lifetime prevalence as filter question and past year incidence as the follow-up question), (b) a sequence of “yes” and “no” response categories of the lifetime prevalence, and (c) a layout that condensed all delinquency items to fit on a single page (the “short version questionnaire”) produces rates of past year prevalences and incidences of minor offenses two times higher than the original ISRD-2 questionnaire. In the original questionnaire, the branching of the “yes” response category from the question about lifetime prevalence to the follow-up question is recognizable much more clearly, the sequence of the response categories of a lifetime prevalence item is reversed to “no” and “yes,” and there are much more follow-up questions per offense—among others, questions about detection by the police and about punishment.
There are several post hoc explanations for the fact that the modified short version questionnaire generates higher rates of delinquency. First, the reversal of the response categories of the lifetime prevalence question may facilitate a positive response. We decided to reverse the order of the “yes” and “no” categories with the intention to counterbalance the threat of underreporting due to social desirable responding by presenting the “most natural answer option” first. Research shows that substantial response order effects of dichotomous items are possible (Hippler, Schwarz, & Noelle-Neumann, 1989) and that in visual presentations such as self-administered questionnaires, primacy effects dominate (Krosnick & Presser, 2010). 6 Second, it is likely that topics of detection by the police and punishment create a context (i.e., create “semantic order effects”; see Krosnick & Presser, 2010) that increases the “criminal loading” and the undesirability of the behaviors described by the questions. Note that questions about detection and punishment occur already as follow-up items when asking about the consumption of beer, breezers, or wine, which is not punishable by law in Germany (and many other European countries) and that these items precede the self-report delinquency items. Third, presenting all delinquency items on a single page might communicate the message that many different delinquent behaviors are possible, thereby increasing the impression that committing some offenses is normal, especially if the offenses are generally minor or frequent such as shoplifting or vandalism. Finally, a downward bias in the estimates of lifetime prevalence in the long version can be caused by the comparatively large number of follow-up questions contingent on an affirmative answer. Wang and Fan (2004) did investigate this phenomenon as a “missing data in disguise” problem: Respondents who learned that answering “no” to a lifetime question helps to shortcut the way to the end of the questionnaire might negate such questions simply to avoid follow-up questions. Several studies show that this actually happens (see Krosnick & Presser, 2010).
The multitude of follow-up items in the long version can also explain the second finding of higher rates of item nonresponse as to the questions of lifetime prevalence when using the long version because item nonresponse can be due to response fatigue (Krosnick & Presser, 2010). In this case, the rate of nonresponse should increase with the number of items already answered. Such a tendency could be observed as to the five lifetime prevalence items of alcohol and drug use (Figure 2). Of course, item nonresponse can also be explained by the factors that increase the impression of undesirability of the behaviors (see above): Respondents might decide to refuse the answer instead of explicitly denying acts they actually did commit. Tourangeau and Yan (2007), however, speculate that survey respondents may prefer misreporting over not answering because the latter might be more revealing. But this is probably more likely in face-to-face interviews.
However, as to the items of past year offending, the nonresponse was partly higher when using the short version, especially concerning high frequency offenses. Before discussing possible explanations for this observation, another important result should be considered: Analyses also showed that low self-control is positively related to the nonresponse of past month substance use as well as past year offending items. Obviously, self-control not only affects the way of answering survey questions in general, as already observed by Piquero, MacIntosh, and Hickman (2000), but also the level of item nonresponse of self-reported delinquency. The effects observed in this study are even stronger than the findings of Watkins and Melde (2007), who report an IRR of 0.77 for self-control (expressed in standard deviations) predicting item nonresponse. Additionally, other person characteristics (male sex, lower level school type, and migrant status), which are positively related to delinquency in many studies, also show substantial effects on the nonresponse of the past year delinquency items. As a consequence, we can expect less accuracy of delinquency measures and a higher level of underreporting of persons with low self-control (and of more crime-prone individuals, in general). It should be mentioned, though, that Pauwels and Svensson (2008) could not find significant effects of self-control on item nonresponse. However, instead of open-response questions to measure delinquent behavior, they used closed-response questions with three to six response alternatives and no filter questions.
Krosnick (1999) argues that underreporting and nonresponse need not be motivated misreporting of socially undesirable behaviors but can instead be the result of satisficing (a way of shortcutting the response process). Satisficing is thought to depend on the subjective difficulty of the question, the motivation to respond, and the respondent’s ability to retrieve the requested information. Therefore, it is very likely that satisficing is positively correlated with low self-control (the problem is exacerbated by the fact that recalling the frequency of more frequent behaviors is more difficult). Additionally, it is conceivable that especially respondents with low self-control might have overlooked that they were expected to indicate the number of delinquent acts committed during the past year when answering “yes” to the respective lifetime prevalence. Such skipping errors were facilitated by the layout of the items because the “no” check box was placed between the “yes” box and the box for filling in the counts (see Appendix 2). Redline and Dillman (2002) could show that the visual design of the branching instruction can substantially affect skipping errors. Taking both arguments together, it is conceivable that the nonresponse of the past year offense items is less affected by the need of respondents to present themselves in a social desirable way but by an inadequate layout of the questionnaire. 7 This points to one remedy of the issue of underreporting and nonresponse of persons with low self-control: If the branching instruction is improved by using better visual cues, shortcutting the response and hence nonresponse will become less likely. Helping respondents with low self-control to better recognize follow-up questions about the frequency of their behavior may help to reduce underreporting especially of frequent offenses.
Although results showed that the original ISRD-2 questionnaire produces more underreporting than the modified version, only few and nonsubstantial differences in effect sizes of predictor variables due to the questionnaire versions were found. Thus, this study could not refute the often voiced assertion that valid etiological models of crime and delinquency are possible despite the problem of underreporting. What is more, the short version of the self-report questionnaire yielded not only higher rates of delinquency but presumably also more reliable measures because in eight of nine cases etiological models to predict delinquency explained more variance when based on short version data. Overall, the variance explained was increased by a factor of 1.30 or (in absolute terms) by 4.2%.
Implications for Self-Report Studies
Overall, the short version of the questionnaire elicits less underreporting and seems to yield more valid and reliable measures of delinquency. However, improvement of the branching instruction from the lifetime prevalence to the past year incidence question is clearly warranted. This will most likely reduce item nonresponse of past year delinquency items and simultaneously further reduce the tendency of underreporting.
To reduce satisficing, one might be tempted to minimize the task difficulty by using closed-response questions about behavior frequencies instead of open-response frequency questions. But this would make things worse: Because respondents confronted with a difficult question will try to seek cues in the wording of the response categories (Krosnick & Presser, 2010), their tendency to satisfice would increase the impact of the response alternatives offered and would thus result in systematic biases. If questions are difficult to answer, probably they will then persist using the once-found answer category when answering subsequent questions. This would affect the measurement of common and frequent offenses in particular because frequent behaviors are especially difficult to retrieve from memory, which forces respondents to use estimation strategies (Schwarz & Sudman, 1994). Closed-response questions will thus stimulate and guide guessing (e.g., through the boundaries of the response categories) more than open-response questions (Schaeffer & Presser, 2003).
Krosnick and Presser (2010) recommend to group multiple screening (filter) items together and ask contingent follow-up questions after having administered all of the screening questions. This suggestion is only applicable for face-to-face interviews or online surveys. They thus caution the reader not to apply this suggestion to filter questions in P&P questionnaires because it might introduce significant skipping errors. If using P&P questionnaires, following these arguments, it seems to be a reasonable compromise to group pairs of lifetime prevalence and past year incidence items together as we did in the short version of the questionnaire, providing that one can dispense with additional follow-up questions and that branching instructions are improved.
Online questionnaires, though, are not affected by the problem of skipping errors due to branching. This mode of surveying is a promising alternative to P&P questionnaires in self-report delinquency studies (Lucia, Herrmann, & Killias, 2011). When using computers in surveys, Krosnick and Presser’s suggestions seem to be preferable. There is a problem, though: Currently, the spread of computer use is still not sufficiently ubiquitous for representative sampling. The results presented show that when planning comparative international self-report studies using self-administered questionnaires (such as the ISRD study), either exclusively P&P questionnaires should be used or—when conducting a mixed mode study—the online and P&P versions must be identical not only with respect to the wording of the items but also concerning the visual layout. For example, if a set of items fits on one page of the P&P questionnaire, the same number of items (and follow-ups) should be visible for the respondent of an online questionnaire. Toepoel, Das, and van Soest (2009) showed that the number of items per screen affects item nonresponse in online surveys. Based on the results of this study we must assume that the level of crime measured cannot be validly compared across modes if the identity of the visual layout of the P&P and the online questionnaire cannot be guaranteed.
The findings of this study confirm the summary statement already made by Schwarz (1999, p. 100) that “retrospective behavioral reports are highly fallible and strongly affected by the specifics of the research instrument used.” Meanwhile, we can do more than simply attach warning labels to the results of self-reported delinquency studies: We know better how big the problems are and where to expect them. This study and a wealth of survey research literature hopefully will help us to avoid them.
Footnotes
Appendix 1
Layout of the Original ISRD-2 Student Questionnaire (Long Version, p. 13 and 16, Translated)
Appendix 2
Layout of the Modified ISRD-2 Student Questionnaire (Short Version, pp. 14-15, Translated)
Declaration of Conflicting Interests
The author declared no potential conflicts of interest with respect to the research, authorship, and/or publication of this article.
Funding
The author disclosed receipt of the following financial support for the research, authorship, and/or publication of this article: The research was funded by the German Federal Ministry for Family Affairs, Senior Citizens, Women and Youth (BMFSFJ) (Grant IIA6-2005-1317-000).