



Abstract
The concept of Low Self-Control (LSC) has been a major focus of criminological theories since the publication of Gottfredson and Hirschi’s work in 1990. Although there is an increasing amount of literature devoted to exploring the precise theoretical construct of LSC, no consensus has been reached on the factorial structure of Grasmick et al.’s LSC measures. The purpose of this study is to investigate the factorial dimensionality of Grasmick et al.’s LSC measures in the Chinese setting. The data for this study come from three distinct samples collected in a Chinese province with a population of 47 million. The three samples represent high school students, troubled teens incarcerated in jail, and adjudicated juvenile offenders in prison in this province. Confirmatory factor analyses are utilized to conduct the factorial structure tests. Results provide strong support for a second-order or hierarchical model of LSC across the three groups. The key findings are discussed in terms of methodological, theoretical, and cultural dimensions.
Keywords
Introduction
In traditional Chinese culture, the concept of self-control, self-discipline, or self-constraint is considered essential to the maintenance of social harmony (Yao, 2000). This personal trait is conceptualized as reflecting placement on a continuum ranging from high to low self-control (LSC). 1 A citizen who demonstrates a high level of personal control is well respected in his or her social circle in Chinese societies. Numerous prominent role models are extolled in the 2,000 years of Chinese history, all of who exercised extraordinary control over their personal desires and over their temper for the sake of promoting the interest of society. 2 On the other side of the continuum, LSC is often viewed as the root cause of both individual failings and many social problems.
Coincidentally, the focus of a primary criminological theory, the general theory of crime (GTC), is directed to self-control, particularly LSC (Gottfredson & Hirschi, 1990). Since its publication more than 27 years ago, an abundance of research has been generated to examine the proposition that LSC is the main cause of many crimes and analogous antisocial behaviors (Arneklev, Grasmick, Tittle, & Bursik, 1993; Cochran, Wood, Sellers, Wilkerson, & Chamlin, 1998; Gibbs, Giever, & Martin, 1998; Gibson, Wright, & Tibbetts, 2000; Marshall & Enzmann, 2012; Wood, Pfefferbaum, & Arneklev, 1993). Chinese scholars have joined their counterparts in the West in testing the utility of GTC. A good number of well-designed and implemented empirical studies carried out by these scholars have used LSC to predict juvenile delinquency in a variety of samples, including school students and troubled teens (e.g., Cheung & Cheung, 2008; Lu, Yu, Ren, & Marshall, 2013; Ren, He, Zhang, & Zhao, 2017; G. T. Wang, Qiao, Hong, & Zhang, 2002).
Although the LSC variable has proven to be a significant predictor of juvenile delinquency in many settings, its theoretical underpinnings have remained contested among scholars. More specifically, the research on the factorial structure(s) of LSC has given rise to considerable debate ever since the introduction of the GTC. Even a cursory review of the literature reveals that there are numerous publications devoted to exploring the precise theoretical construct of LSC, and testing its predictive validity (e.g., Delisi, Hochstetler, & Murphy, 2003; Grasmick, Tittle, Bursik, & Arneklev, 1993; Longshore & Turner, 1998; Piquero & Rosay, 1998; Ward, Nobles, & Fox, 2015; Williams, Fletcher, & Ronan, 2007). According to the GTC, the LSC concept reflects a unidimensional construct; however, empirical findings derived primarily from research conducted in the West have produced three distinct types of summary results on the conceptualization of LSC—namely (a) the one-factor model (e.g., Grasmick et al., 1993; Nagin & Paternoster, 1993; Ward, Gibson, Boman, & Leite, 2010), (b) the multidimensional model (e.g., Romero, Gomez-Fraguela, Luengo, & Sobral, 2003; Vazsonyi, Pickering, Junger, & Hessing, 2001), and (c) the higher order/second-order model (e.g., Arneklev, Grasmick, & Bursik, 1999; Piquero & Rosay, 1998). 3
The purpose of the current study is to investigate whether there is evidence of consistency in the factorial structure of LSC across three independent samples of Chinese high school students, youth in jail, and adjudicated youth serving time in juvenile prisons. Two features of this study contribute to making it an important addition to the existing literature. First, different from previous studies, the research site of the study is in China, a country that features the largest juvenile population in the world. China represents a much different cultural and social setting from that of Western countries, but the concept of self-control is common to both Chinese and Western societies. To the best of our knowledge, this is the first study making use of three distinctive samples to test the dimensionality of LSC in an Eastern nation. The amount of testing the dimensionality of LSC using international samples is very limited among the published studies (Jo, 2015; Vazsonyi et al., 2001). The factorial structure is often taken as a given having been established in prior studies, and all the Chinese-based studies available for review use additive LSC scales without conducting theory-driven confirmatory factor analysis (CFA) to test the appropriateness of the scale(s). Little additional effort is made beyond reporting a satisfactory Cronbach alpha coefficient; none of the published Chinese studies examined the extent to which the conventional LSC measure is conceptually and operationally sound in the Chinese setting.
Second, three distinctive samples collected in a province of 47 million population represent high school students, troubled teens in jails and adjudicated juvenile offenders in prisons. The diversity in samples offers a rare opportunity to test the factorial structure of LSC across various levels of delinquent behavior—an ideal test of LSC suggested by Gottfredson and Hirschi (1990). Arneklev et al. (1999) correctly argued that the demonstration of invariance across different social backgrounds is key to the conceptualization of LSC. Given its centrality, sufficient variation in levels of delinquent behavior across simultaneously collected samples is required to validate a reliable factorial structure of the LSC concept (Williams et al., 2007).
Literature Review
Chinese Culture and Self-Control
Self-control plays a major role in Chinese society in that the ongoing exercise of self-control for a common cause lies at the very core of Confucian philosophy (Yang, Zheng, & Li, 2006). According to Confucianism, a civilized citizen is an individual who observes norms and rituals (Li) that are themselves reflective of a high level of self-control over one’s behaviors as well as one’s outward and inward emotions (Butler, Lee, & Gross, 2007; Dere, Falk, & Ryder, 2012). More specifically, self-control (internalized constraint, personal discipline, moderation of desires) has the following dimensions as it affects people in Chinese societies. First, self-control is not only conceptualized as a personal trait similar to Aristotle’s possession of “habitual good” as an aspect of one’s character, but also serves as the foundation for reaching “Ren” or the quality of benevolence, human-heartedness, and humanity in Confucianism (Berling, 1982; Yao, 2000). Kim (2011) has suggested that a Confucian self is a role-playing social self. An individual with Confucian self-control is an other-regarding citizen who consciously gives up the narrow pursuit of his or her personal interests for the promotion of the collective good. It is believed that a person with such self-control will be regarded as a productive citizen and will win the admiration of his or her peers and superiors alike. Confucian philosophy highlights the crucial link between the exercising of self-control and the accomplishment of a harmonious society (Ke Ji Fu Li; Yao, 2000), and holds that social harmony is essential for the progress of human society. From a theoretical standpoint, it is reasonable to argue that in the Chinese context, self-control is a holistic concept as a Confucian gentleman requires the possession of all elements of self-control.
Next, self-control can be conceptualized as reflecting a position on a continuum ranging from high self-control on the one end and LSC on the other. All six of the dimensions used to measure LSC in the Western literature represent behaviors in which a productive citizen should refrain from engaging. Importantly, these same dimensions of the LSC measure closely fit the definition of a “petty man” (i.e., person of LSC) in Confucianism. A petty man (xiao ren) is an individual who is self-centered, lacking in moral principles, and likely to jump on opportunities that benefit him despite known ill effects on others (Kim, 2011). For example, impulsivity is the first element of the LSC concept (Gottfredson & Hirschi, 1990); it is assumed that a high need for immediate gratification leads to loss of the benefit of rewards coming from delayed gratification in the form of social approval and investment in long-term outcomes. Similarly, while growing up in the Chinese cultural setting, youth are advised repeatedly by their parents, by their school teachers, and later by their supervisors to reject the temptations of speculative risk seeking, self-centeredness, and short temper in dealing with others. Particularly, interesting in this regard is how physicality is treated in this Chinese culture to downplay the use of physical force and place priority upon the use of one’s intellect. Chinese youth are taught continuously to use their intellectual gifts more than their physical strength to make their own personal contribution to their society (Yao, 2000). Making a living by one’s labor is considered to be inferior to making a living by one’s intellectual gifts. In essence, the LSC measure reflects the personal traits of a petty man, although Confucianism stops short of exploring the link between a petty man and engagement in criminal behaviors.
Theoretical and Empirical Research on LSC in the United States
Rooted in the principle of rational choice associated with classical school of economics, Gottfredson and Hirschi (1990) began the construction of the GTC with a basic assumption regarding human nature—namely, pleasure seeking. It is assumed that humans have a survival instinct that leads them to pursue individual-oriented hedonism in the absence of appropriate socialization into pro-social norms and beliefs. The propensity to engage in any crime, delinquency, and “analogous” behaviors (i.e., drinking, smoking, and substance use) is the result of one’s LSC in conjunction with the presence of opportunity. A crime incident is seen as an individual’s spontaneous response to their own self-interested gains driven by LSC.
Gottfredson and Hirschi (1990) claimed that LSC is developed during one’s early childhood because of poor parental rearing and inadequate supervision. According to them, the level of one’s self-control set early in life remains largely unchanged, and an individual carries it for the rest of his or her life course as if it were a biological marker. Six elements or dimensions are identified to be the components of LSC. The first dimension is impulsivity, an inability to defer gratification of desires because of a lack of personal persistence or diligence. Individuals with impulsivity prefer tasks that are simple and easy to accomplish. The next dimension is the preference for activities that are thrilling, adventurous, or risky. Individuals with risk-seeking character tend to emphasize physical activities and place little value on intellectual development and personal aptitude. Different from normal persons, individuals with LSC are often self-centered and insensitive to others’ needs when interacting with others. This dimension reflects the idea of “I have to get what I want.” Volatile temper is the final dimension to differentiate LSC persons from the normal ones. Gottfredson and Hirschi (1990) argued that the six dimensions tend to coalesce into a unitary trait labeled as LSC. 4
Since the publication of the GTC, the robustness of LSC as a popular predictor of crime and analogous behaviors is evidenced, as Pratt and Cullen (2000) concluded in their meta-analysis of 21 empirical studies that “future research that omits self-control from its empirical analyses risks being misspecified” (p. 952). In another major area of research focus, a large body of literature now exists on the testing of the psychometric properties of the LSC measures. 5 Empirical studies on the theoretical construct of self-control have not produced a consensus view on structure, however, due to a variety of reasons. Lack of offender sample, for example, is often considered a major drawback regarding the appropriate testing of the validity of the LSC measure (Delisi et al., 2003; Longshore & Turner, 1998). In addition, reliance on a single sample is highlighted as a potential threat to the proper testing of the LSC measure (Vazsonyi et al., 2001; Williams et al., 2007). A review of the literature suggests that three distinct factorial structures of the LSC measure have been suggested as possibilities in previous research: the one-factor model, the multidimensional factor model, and the second-order factor model. The lack of convergence of the available research on the empirical testing of self-control can have severe consequences for the effective use of the concept of self-control in future research (Piquero & Rosay, 1998).
The most influential study suggesting the possibility of the one-factor model was published in the early 1990s when Grasmick et al. (1993) developed a battery of 24 items to measure the six dimensions of self-control, and then empirically tested it on a random sample of 395 residents of Oklahoma City. The initial results from principal component factor analysis revealed six factors, each with eigenvalue greater than 1.0. The one-factor model conclusion was arrived at based on the logic of the Scree Plot Discontinuity Test. As the drop of eigenvalues from the first factor to the second factor was 2.32, it was reasoned that a single underlying construct was present. In a test of the measure’s predictive power, the composite scale of LSC was found to be a significant predictor of fraud, but not use of physical force (their working definitions of crime; Grasmick et al., 1993). Drawing from a convenience sample of 699 college students at the University of Maryland, Nagin and Paternoster (1993) used the 24-item instrument devised by Grasmick et al. (1993) and conducted another independent series of factor analyses. They reported “Factor analyses of our own data virtually duplicate Grasmick et al.’s results” (p. 478). Similarly, Burton, Cullen, Evans, Alarid, and Dunaway (1998) collected the data from a mail survey of 555 adults residing in Cincinnati and included self-control as an explanatory variable. The factor analysis they conducted likewise did not suggest the existence of separate factors within the trait of self-control, and a composite measure was used for a more parsimonious analysis of their data.
In their study on gender and self-control, Blackwell and Piquero (2005) used an interview sample of 350 residents who resided in Oklahoma City in 1994. As with the other studies, Grasmick et al.’s 24-item instrument was included in their analysis. Factor analyses yielded a one-factor solution, with a .81 alpha level reliability. Using a sample of 436 high school students and a shortened version of Grasmick et al.’s instrument, Gibson and Wright (2001) conducted a principal component factor analysis and found that the self-control measure constituted a unidimensional construct. Finally, using different datasets collected from either students or residents, several studies reached similar conclusions with respect to the idea that self-control is a unidimensional factor (e.g., Gibbs, Giever, & Higgins, 2003; Lagrange & Silverman, 1999; Piquero, Macintosh, & Hickman, 2000; Wood et al., 1993). In their review of the literature, Piquero et al. (2000, p. 900) concluded the following: “In sum, evidence for the unidimensionality and reliability of the Grasmick et al. self-control scale appears relatively strong among a variety of different samples and subgroups within samples.”
Despite the popularity of the one-factor model supposition and the convenience of one composite scale from survey data, there is good reason to believe that self-control may actually be a multidimensional construct reflecting distinct aspects of one’s personal traits. In his theoretically oriented critique, Marcus (2004) pointed out that the concept of self-control and related traits have been the ongoing focus of personality research for several decades. More specifically, he observed that Gottfredson and Hirschi’s (1990) GTC work largely ignored the insights of extensive research findings published in psychology. He argued that going to a Benthamian conceptualization of hideous human nature for their intellectual roots was a great mistake given this foundational work in psychology. Marcus (2004) argued that the framing of self-control as a unidimensional construct is “at odds with decades of research on the structure of personality” (p. 38). Marcus gave the example of the well-known Big Five Traits as a convincing form of evidence that core human personality traits cannot be unidimensional. A further investigation of the considerable empirical evidence in the criminology literature suggests that Marcus’ critique may be justified.
In their study on the factorial structures of LSC, Longshore, Rand, and Stein (1996) used a sample of 623 offenders who were in a program entitled “Treatment Alternative to Street Crime.” They argued that previous studies suggesting a unidimensional structure of self-control had relied either on general adult population with relatively low frequency of law violations or on school students with similar low levels of analogous behavior. They maintained, with good reason, that more diversified samples of criminal behaviors are not only necessary but also required to test the dimensionality of LSC. Using 22 items of Grasmick et al.’s (1993) instrument, Longshore et al. (1996) found that a modified five-factor model of self-control is superior to a single-factor model in predicting criminal behavior. The overall additive scale based on 22 items and five derivative subscales (i.e., risk seeking, impulsiveness/self-centeredness, physical activities, volatile temper, and simple tasks) were all significant predictors of both crimes of fraud and crimes of use of physical force. Similarly, Delisi et al. (2003) applied Grasmick et al.’s (1993) instrument to a sample of 208 male parolees residing in work-release facilities in a Midwestern state and examined the dimensionality of the self-control items. They used CFA to test all three known factorial models in the literature on self-control. The results derived from the goodness-of-fit indices suggested that the single-factor model had the worst fit among the three models tested, followed by the second-order model. Based on the modification indices for the measurement model, Delisi et al. (2003) refined the six-factor model by correlating two pairs of error items and dropping three items for cross-loading. The revised six-factor model stood out to be the best fitting model.
As a natural extension, Williams et al. (2007) tested the dimensionality of self-control using two samples collected in New Zealand; one sample was that of 116 offenders, and the second was that of students. They argued that it is important to test the dimensionality of self-control with two diversified samples of law violations because unidimensionality is one of the most important principles of the GTC. Again, using the Grasmick et al. (1993) scale, Williams et al. (2007) reached remarkably similar conclusions to those of Delisi et al. (2003) and Longshore et al. (1996) regarding the multidimensional nature of self-control. Other studies have featured a variety of survey subjects, including a large survey sample of students in four countries (Vazsonyi et al., 2001), a sample of U.S. college students (Higgins, 2007), and two samples of different student populations in Spain (Romero et al., 2003). Each has reached the same conclusion that self-control is a multidimensional construct.
Studies identifying the possibility of multidimensional models tend to focus on the modification of scale items and the analysis of error items. Possible multicollinearity among factors has not seemed to be a serious concern. Relevant research suggests that when correlations among latent constructs are around .75 or higher, a risk exists that factors may represent the same underlying theoretical construct (Grewal, Cote, & Baumgartner, 2004). Some researchers are more conservative; however, van der Linden, Nijenhuis, and Bakker (2010) have cautioned that the independence of factors is in question when the correlation between any two factors exceeds .45. They suggest that in such a case, the possibility of a second-order model should be explored. Unfortunately, in the previous literature suggesting multidimensional models, the intercorrelations among factors were not reported (e.g., Longshore et al., 1996; Romero et al., 2003). In two studies where intercorrelations were reported, the values of intercorrelations among factors were either extremely low (Delisi et al., 2003) or moderately low (Williams et al., 2007).
The third factorial structure of self-control tested in the literature concerns the second-order model, a conceptualization of LSC which requires two steps for model specification. All the items must load significantly on their respective factors, and then all the individual factors are predicted by one higher order domain. The contribution of each factor can be determined by the number of observed items contributing to the higher order domain (van der Linden et al., 2010). Wolff and Preising (2005) noted in this regard, “Higher order FA is conducted because first-order factors often represent constructs of narrow scope, whereas higher order factors yield constructs of higher generality” (p. 49; also see Musek, 2007). It is important to note that Gottfredson and Hirschi (1990) were silent on this issue of how dimensionality was to be determined, and only suggested that a person of LSC should manifest all six of these dimensions. Accordingly, both a one-factor model and a hierarchical model would be acceptable for their GTC.
However, unresolved issues remain to bedevil the unidimensionality premise of the Gottfredson and Hirschi theory. For example, Arneklev et al. (1999) applied Grasmick et al.’s abbreviated scale (12 items) to a random sample of 394 adults and a convenience sample of 289 college students in a large southwestern city. They concluded from their analysis that a hierarchical model is superior to a one-factor model. They noted that the advantage of a hierarchical model is not only to partition the variation in the 12 indicators into their unique and shared components, but also to facilitate a more subtle and complete test of self-control (Arneklev et al., 1999). This hierarchical test reveals the quite large loading of impulsivity on LSC and the rather weak loading of physicality for both the adult and the student samples. Similarly, in a reanalysis of the offender sample collected by Longshore et al. (1996), Piquero and Rosay (1998) reexamined the factorial structure of self-control. After dropping five items from the original Grasmick et al.’s (1993) instrument, the researchers found that a second-order model fits the data well, concluding that the unidimensional model is in line with the core assumption of Gottfredson and Hirschi. However, two other studies testing the second-order hierarchical model did not find statistical support for it (Delisi et al., 2003; Williams et al., 2007).
Method
Data
A stratified disproportionate (vis-à-vis acts of deviance) sample is required to ensure that sufficient numbers of LSC subjects in the analysis report some form of criminal or analogous behavior (Hirschi & Gottfredson, 1993). In this regard, the inclusion of an offender or delinquent sample is seen as an advantage in the examination of dimensionality of LSC (Delisi et al., 2003; Longshore et al., 1996). In all the studies reviewed, however, only one study included two diverse samples of students and offenders (Williams et al., 2007). Unfortunately, the number of subjects in both of the Williams et al. samples was questionably small for factorial analysis (offender sample = 105 and student sample = 121). In the current study, three distinct large samples are utilized to secure sufficient numbers of LSC subjects in both non-offender and offender categories. Particularly, two male juvenile offender samples (prison and jail) were collected for the analysis because incarcerated juvenile offenders are more serious offenders than their counterparts in jail either awaiting adjudication or serving time for minor offenses. In addition, the data collected includes a sample of male high school students. All three samples were collected in the same province located in Southwestern China. The economy of the province is growing at a modest rate, but the region is not as prosperous as those regions located in the east coast areas. Statistics from the most recently conducted national census show that by the end of 2010, the population of the province was more than 47 million, approximately 38% of whom were ethnic minorities (non-Han Chinese; National Bureau of Statistics of China, 2011).
The first sample was collected from 21 jails in the southern region of the province accounting for about half of the geographic area and population of the province. The local culture of the southern region (seven prefectures) of the province (14 prefectures all together) is different from the northern region given the fact that the region was annexed to the province in the 1950s and 1960s. The local dialects, food, and way of life are distinctive between the northern region and the southern region. Unlike the juvenile prisons run by provincial bureaus of prison, each prefecture and its subsidiary counties set up at least one jail to detain both juvenile and adult suspects either waiting for trial, being newly convicted, or serving a short sentence. There are a total of 12 prefectural jails and 26 county jails located in the southern region. About 7 of 12 prefectural jails and 14 of the 26 county jails were selected at random for data collection. The number of juvenile suspects detained in the jails varied from 8 to 74, depending on the population size of the prefecture and county.
Graduate students visited each jail and conducted face-to-face interviews in secured rooms between May and June, 2013. The members of the research team received an intensive 6-hr training class on the campus of a local university prior to the initiation of the project. The interview included all juvenile suspects available on the days of the interview to minimize sampling bias. The juvenile suspects were fully informed of the voluntary nature of their participation in the interview. The method of face-to-face interviews was preferred over the use of self-administered paper-and-pencil surveys due to concerns over the literacy and reading ability level of the subjects. The average interview time was approximately 45 min, and jail staff were not present during the interviewing. Except for several juveniles who were either ill (n = 5) or were being disciplined in separate cells (n = 4), and 10 juveniles who were unwilling to participate, all other juvenile suspects voluntarily participated in the interview. The face-to-face interviews resulted in 571 completed surveys, reflecting a response rate of 96.9%.
The second sample collected contains juvenile offenders who were serving sentences in the province juvenile prison at the time of the interview. Incarceration in a juvenile prison represents the most severe form of punishment for juvenile offenders in China aged between 14 and 18 years. They are all adjudicated by local juvenile courts after being arrested for committing serious violent or property crimes (G. Zhao, 2001). The provincial prison bureau normally manages only one juvenile prison housing all adjudicated juveniles. Out of the same concern for literacy and reading comprehension as the jail project, the face-to-face interview data collection method was used and interviews were conducted in September 2013. In the prison setting, interviews lasted a bit longer, averaging in the range of 45 min to an hour. Same group of trained graduate students who conducted the jail interviews carried out the prison interviews using a uniform process. All interviews were conducted in a secure, designated private room within the institution where only the researchers and the juvenile offenders were permitted to be present for the entire period of the interview. There were 1,304 male juvenile offenders incarcerated in the institution at the time of the interviews; among them, 377 male offenders were identified as having been newly admitted within the past 6 months. This sample represents essentially the entire population of juvenile offenders in the province who had served less than 6 months at the time of the study; only five ill offenders, three disciplined offenders who were locked up in solitary confinement, and 11 incarcerated youth who declined to take part in the interview were not interviewed. The final sample size of 358 was attained, representing 95.0% response rate.
The third non-offender sample was drawn from high school students in a south prefectural city of the province (city population = 3.8 million). The student data were collected from all 22 high schools (including the only private school) in the city by using a multistage cluster sampling technique. In each school, one class was randomly selected from each grade (10th, 11th, and 12th), except in one newly opened high school (with only Grade 10) and one school that is being closed (with only Grade 11 and Grade 12). Four schools selected through this process declined the request to allow the 12th graders to participate in the survey due to their being in preparation for the highly competitive national college entrance exam. Consequently, one more class in either the 10th grade or the 11th grade in these four schools was randomly selected for study participation. The self-administered survey was conducted between November and December 2012 without the presence of teachers or administrators in all survey completion sessions. The students were informed of the purpose of the study and assured of their anonymity and voluntary participation in the survey. The total sample size achieved was 2,961 respondents, and the response rate attained was 96.9%. Importantly, only male students are included in the current analysis given the nearly exclusively male composition of the jail and prison samples.
Measure of LSC
As discussed previously, Grasmick et al.’s scale is the most frequently used measure in the testing of the dimensionality of the self-control concept (e.g., Delisi et al., 2003; Williams et al., 2007). In this study, we follow suit in using the Grasmick et al. (1993) measure for the investigation of the factorial structures of self-control. The scale is comprised of 24 items, with four items tapping into each of the six specified dimensions of self-control as highlighted by Gottfredson and Hirschi (1990). Each item is rated on a 4-point Likert-type scale ranging from (1) strongly disagree, (2) disagree somewhat, (3) agree somewhat, to (4) strongly agree; higher values indicate lower self-control on each item.
Over the course of the past 10 years, the original English version of Grasmick et al.’s (1993) 24-item scale has been translated into Mandarin Chinese, and this translation has been tested in school-based surveys in a variety of Chinese settings (e.g., Cheung & Cheung, 2008; Cretacci, Rivera, & Ding, 2009; Lu et al., 2013; Ren et al., 2017; G. T. Wang et al., 2002). The Chinese version of the instrument used in the current study was based on the prior translations used in the published studies. These translations were perfected through the conventional double-back iterative process. The translation used in this study was pretested in three groups of potential survey participants (i.e., high school students, juvenile offenders in prisons and jails) to make certain the questionnaire fit the Chinese social, cultural, and language contexts of the province. It is important to note that the identical Chinese version of the self-control measures was used across the three samples.
Analytical Procedure
Tests for the factorial validity of the Grasmick et al. (1993) 24 self-control items across independent samples were conducted within the analytical framework of the CFA model. CFA enables the researchers to assess whether a given factor structure has an adequate fit with the observed data by postulating patterns of relations a priori and testing this hypothesized structure statistically (Byrne, 2012). In this study, analyses are conducted using an Mplus estimation option for maximum likelihood estimation with standard errors and a mean-adjusted chi-square test statistic that are robust to non-normality (L. K. Muthén & Muthén, 1998-2012). 6 As CFA is a theory-driven approach to confirming hypothesized factorial structures, we follow the intellectual footsteps set forth in previous studies to examine three CFA conceptual models for each group separately. These three hypothesized models are portrayed schematically in Figure 1.

Hypothesized CFA models of factorial structure for Grasmick, Tittle, Bursik, and Arneklev’s (1993) LSC measures.
A variety of absolute and relative (or incremental) indices were consulted to assess model fit. The absolute fit index includes chi-square (χ2) statistics, where chi-square is the likelihood ratio statistic used to test whether a given model provides an acceptable fit to relevant observed data. The criteria for χ2/df ratio range from as low as 2.0 (Barrett, 2007; Tabachnick & Fidell, 2007), to 3 (Kline, 2005), to 4 (Hu & Bentler, 1999). Critics of the use of the chi-square measure of model fit properly note that chi-square values are sensitive to sample size, and its use can lead to the rejection of virtually any model derived from a large sample and the masking of multivariate non-normality (Bentler, 2007; Miles & Shevlin, 2007). The most commonly accepted rule among researchers is that χ2/df needs to be below 4. Another absolute fit indicator, “one of the most informative fit indices” according to Diamantopoulos and Siguaw (2000, p. 85), is the root means square error of approximation (RMSEA) index which takes the error of population approximation and degrees of freedom into account, and characterizes the lack of fit of the hypothesized model to the population covariance matrix. In more recent studies, the cutoff points of RMSEA have been set to values at or below .06 (Hu & Bentler, 1999) constituting a good fit.
In addition to absolute indices, two incremental fit indices are commonly used in the interpretation of CFA results. The Comparative Fit Index (CFI) assesses “the fit of a user-specified solution in relation to a more restricted, nested baseline model,” in which the “covariances among all input indicators are fixed to zero” positing no relationship among variables (Brown, 2006, p. 84). The CFI ranges from 0 to 1.00, with values greater than 0.90 indicating a reasonably good fit between the hypothesized model and the empirical data (Hu & Bentler, 1999). The Tucker–Lewis index (TLI or non-normed Fit Index) is the other measure suggested by Jöreskog and Sörbom (1989) for assessing a model’s overall fit based on a ratio of the squared sum of discrepancies to the observed variances. A TLI value around 0.90 or above indicates a good fit (Hu & Bentler, 1999).
Findings
Descriptive Statistics
The demographic characteristics and levels of delinquency reported in the surveys are presented in Table 1. The average age across three samples varies only slightly, ranging from 17.16 in the high school sample, 16.58 in the jail sample, to 16.78 in the prison sample. The educational attainment for both jail and prison inmates is 3.89 and 3.74, respectively, as measured on a 7-point scale ranging from illiteracy (1) to completion of senior high school or technical secondary school (7). These figures represent the completion of primary school, which constitutes the minimum level of formal education for their age. There is a noteworthy difference in ethnic composition across the three groups. Although the ethnic minority accounts for approximately 13% of the high school sample, its proportions increased sharply among the juvenile offenders incarcerated in jail (19.8%) and even more so for juveniles sent to prison (39.7%).
Descriptive Statistics for Demographics and Delinquency Measures Across Three Samples.
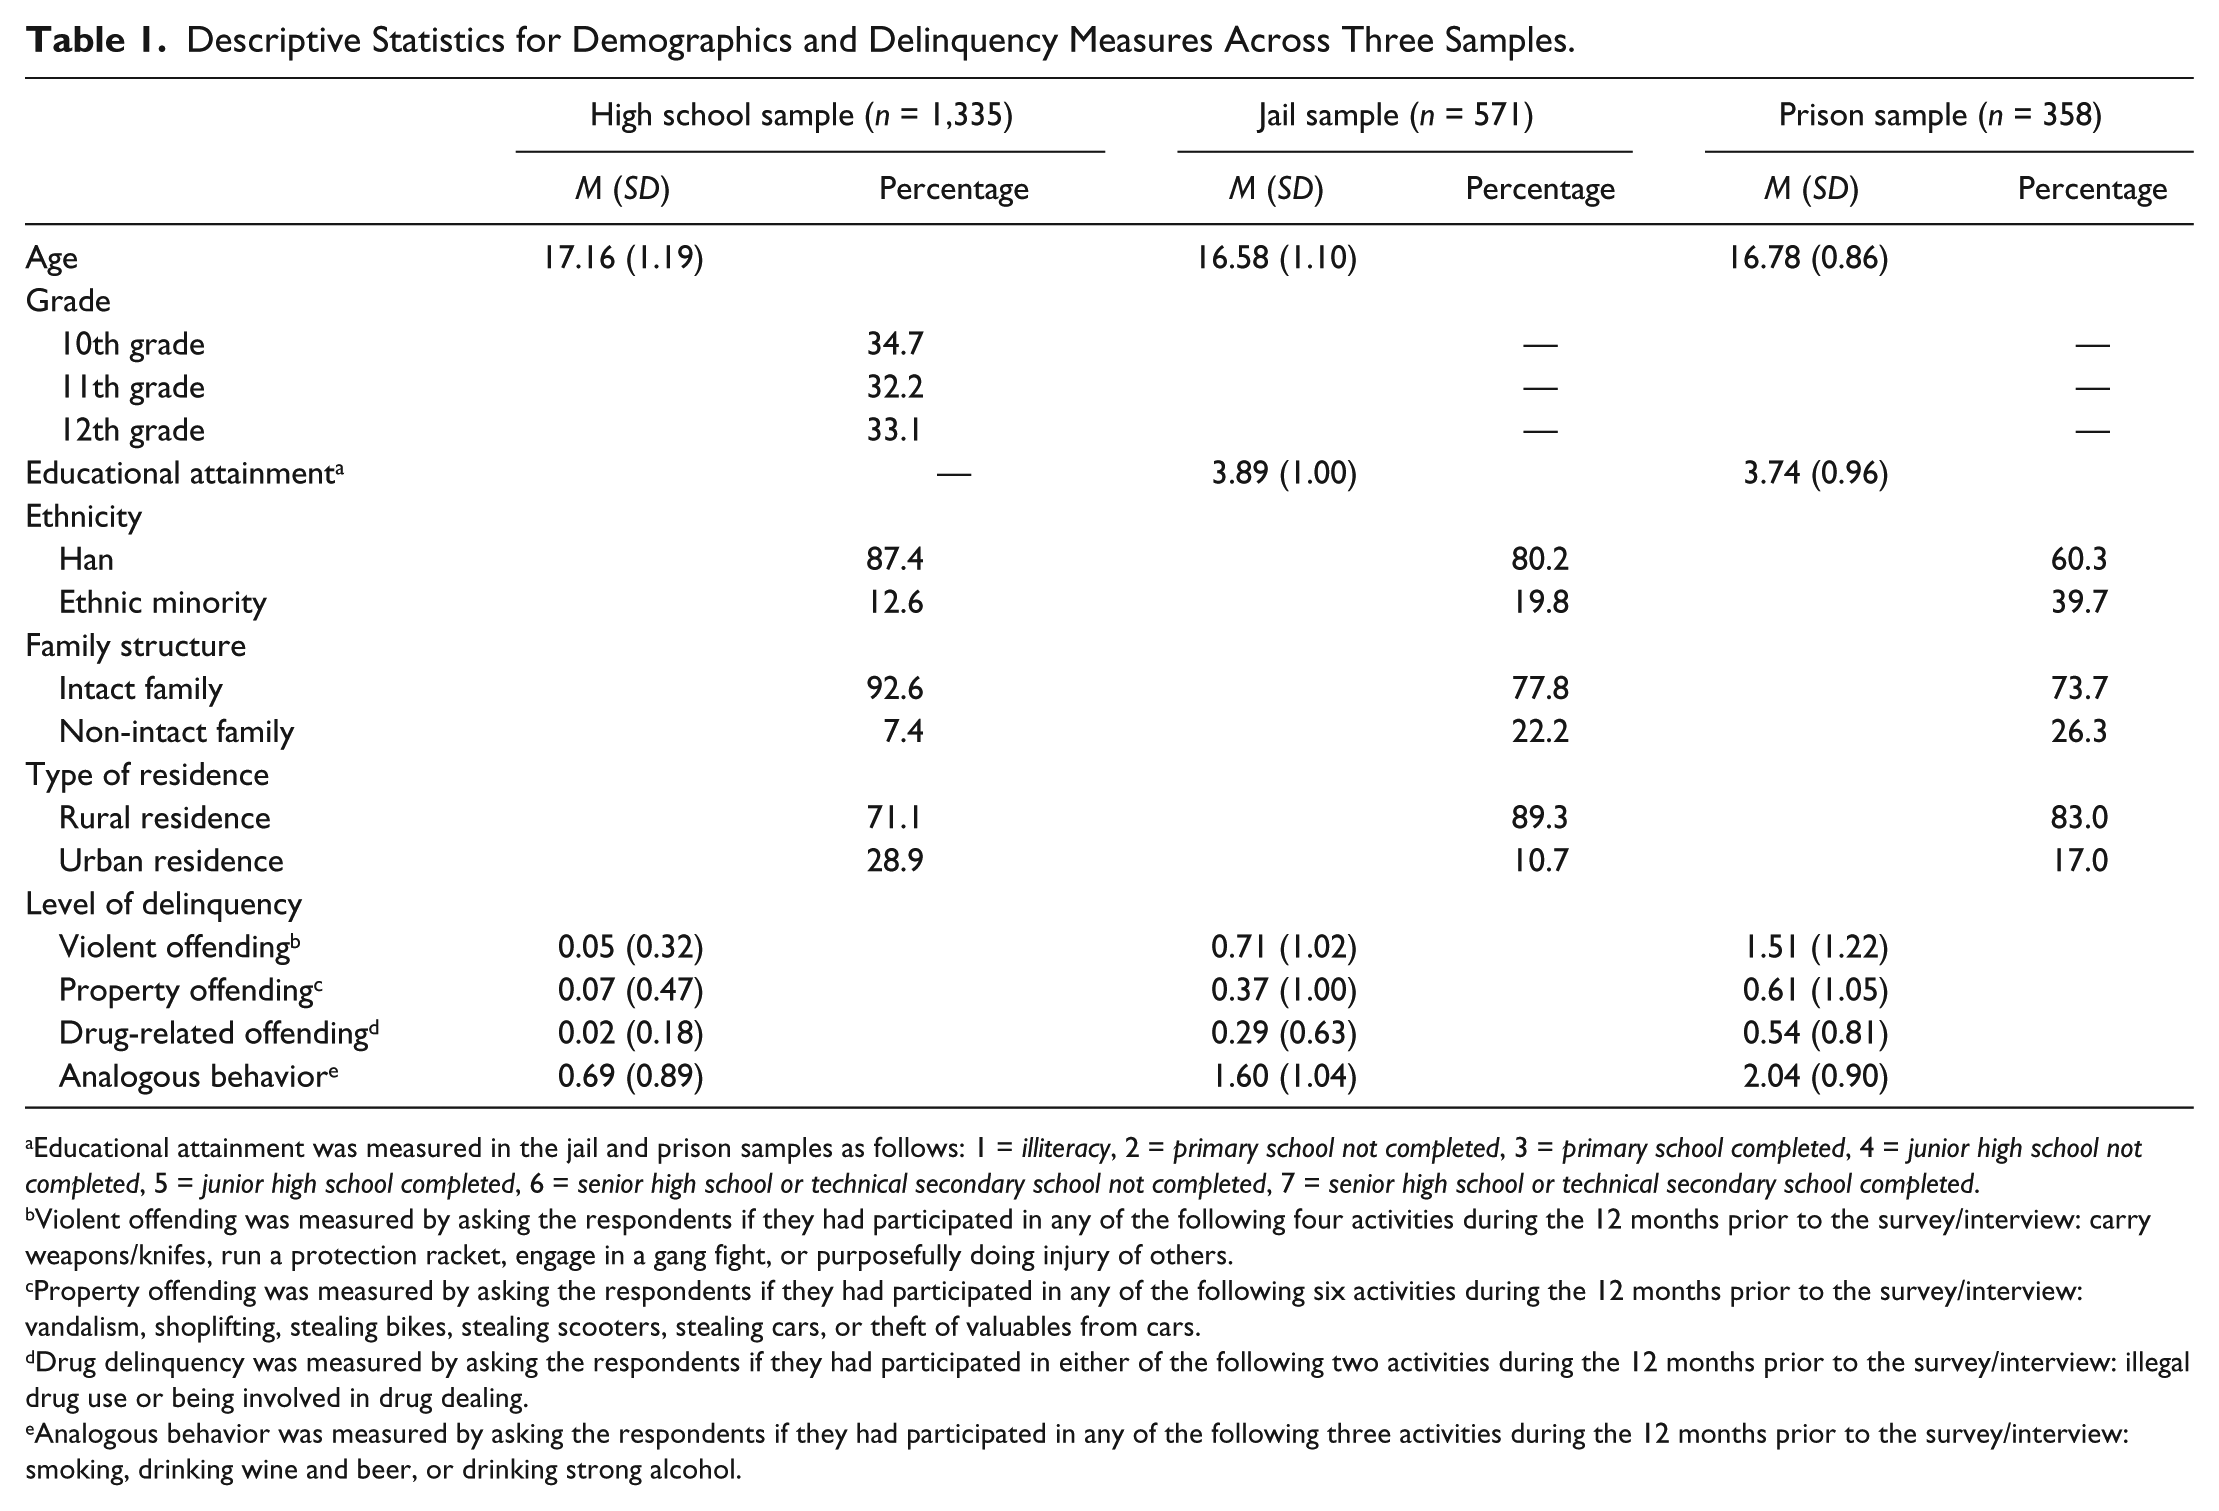
Educational attainment was measured in the jail and prison samples as follows: 1 = illiteracy, 2 = primary school not completed, 3 = primary school completed, 4 = junior high school not completed, 5 = junior high school completed, 6 = senior high school or technical secondary school not completed, 7 = senior high school or technical secondary school completed.
Violent offending was measured by asking the respondents if they had participated in any of the following four activities during the 12 months prior to the survey/interview: carry weapons/knifes, run a protection racket, engage in a gang fight, or purposefully doing injury of others.
Property offending was measured by asking the respondents if they had participated in any of the following six activities during the 12 months prior to the survey/interview: vandalism, shoplifting, stealing bikes, stealing scooters, stealing cars, or theft of valuables from cars.
Drug delinquency was measured by asking the respondents if they had participated in either of the following two activities during the 12 months prior to the survey/interview: illegal drug use or being involved in drug dealing.
Analogous behavior was measured by asking the respondents if they had participated in any of the following three activities during the 12 months prior to the survey/interview: smoking, drinking wine and beer, or drinking strong alcohol.
Similarly, the percentage of youth from non-intact family backgrounds increased from 7.4% in the high school sample to 22.2% in the jail sample, and to 26.3% in the prison sample. Likewise, more juvenile offenders either in jail or prison (89.3% and 83.0%) were from rural background than their high school counterparts (71.1%). The bottom rows listed in Table 1 document self-reported delinquent behavior, and this is where even more dramatic differences are in evidence. Four types of crime-related delinquency and analogous behavior—violent offending, property offending, drug offending, and smoking and drinking—are set forth. Violent offending is at minimum (.05) among the high school students and 14 times (.71) higher among jailed youth. The juvenile inmates in prison committed the highest level of violent delinquency (1.51). Similar patterns of expected disproportionality were found in the self-reported property delinquency and drug-related delinquency survey outcomes. It is interesting to note that the gap across the three samples is narrowed considerably when analogous behaviors such as smoking and drinking are the focus of comparison. The rate of analogous behavior is .69 reported in the high school sample, 1.60 in the jail sample, and 2.04 in the prison sample.
Table 2 presents the results of group comparisons concerning Grasmick et al.’s 24 items measuring LSC. ANOVA tests and post hoc Bonferroni tests were conducted to facilitate more in-depth group comparisons. Overall, statistically significant group differences were observed in all the 24 items across all three groups of juveniles, with the exception of two items of Physicality (i.e., Items 14 and 15) and one item of self-centeredness (i.e., Item 18). Among the 21 items where significant group differences were detected, juveniles in jails and prison demonstrated statistically higher mean values than their high school counterparts, indicating lower levels of self-control. The levels of LSC were quite similarly distributed between the jail sample and the prison sample. The only statistically significant group differences between jail and prison samples existed in four items (i.e., Items 1, 3, 13, and 24). This difference was however marginal in substantive magnitude.
Descriptive Statistics for Grasmick, Tittle, Bursik, and Arneklev’s (1993) LSC Items Across Three Samples.
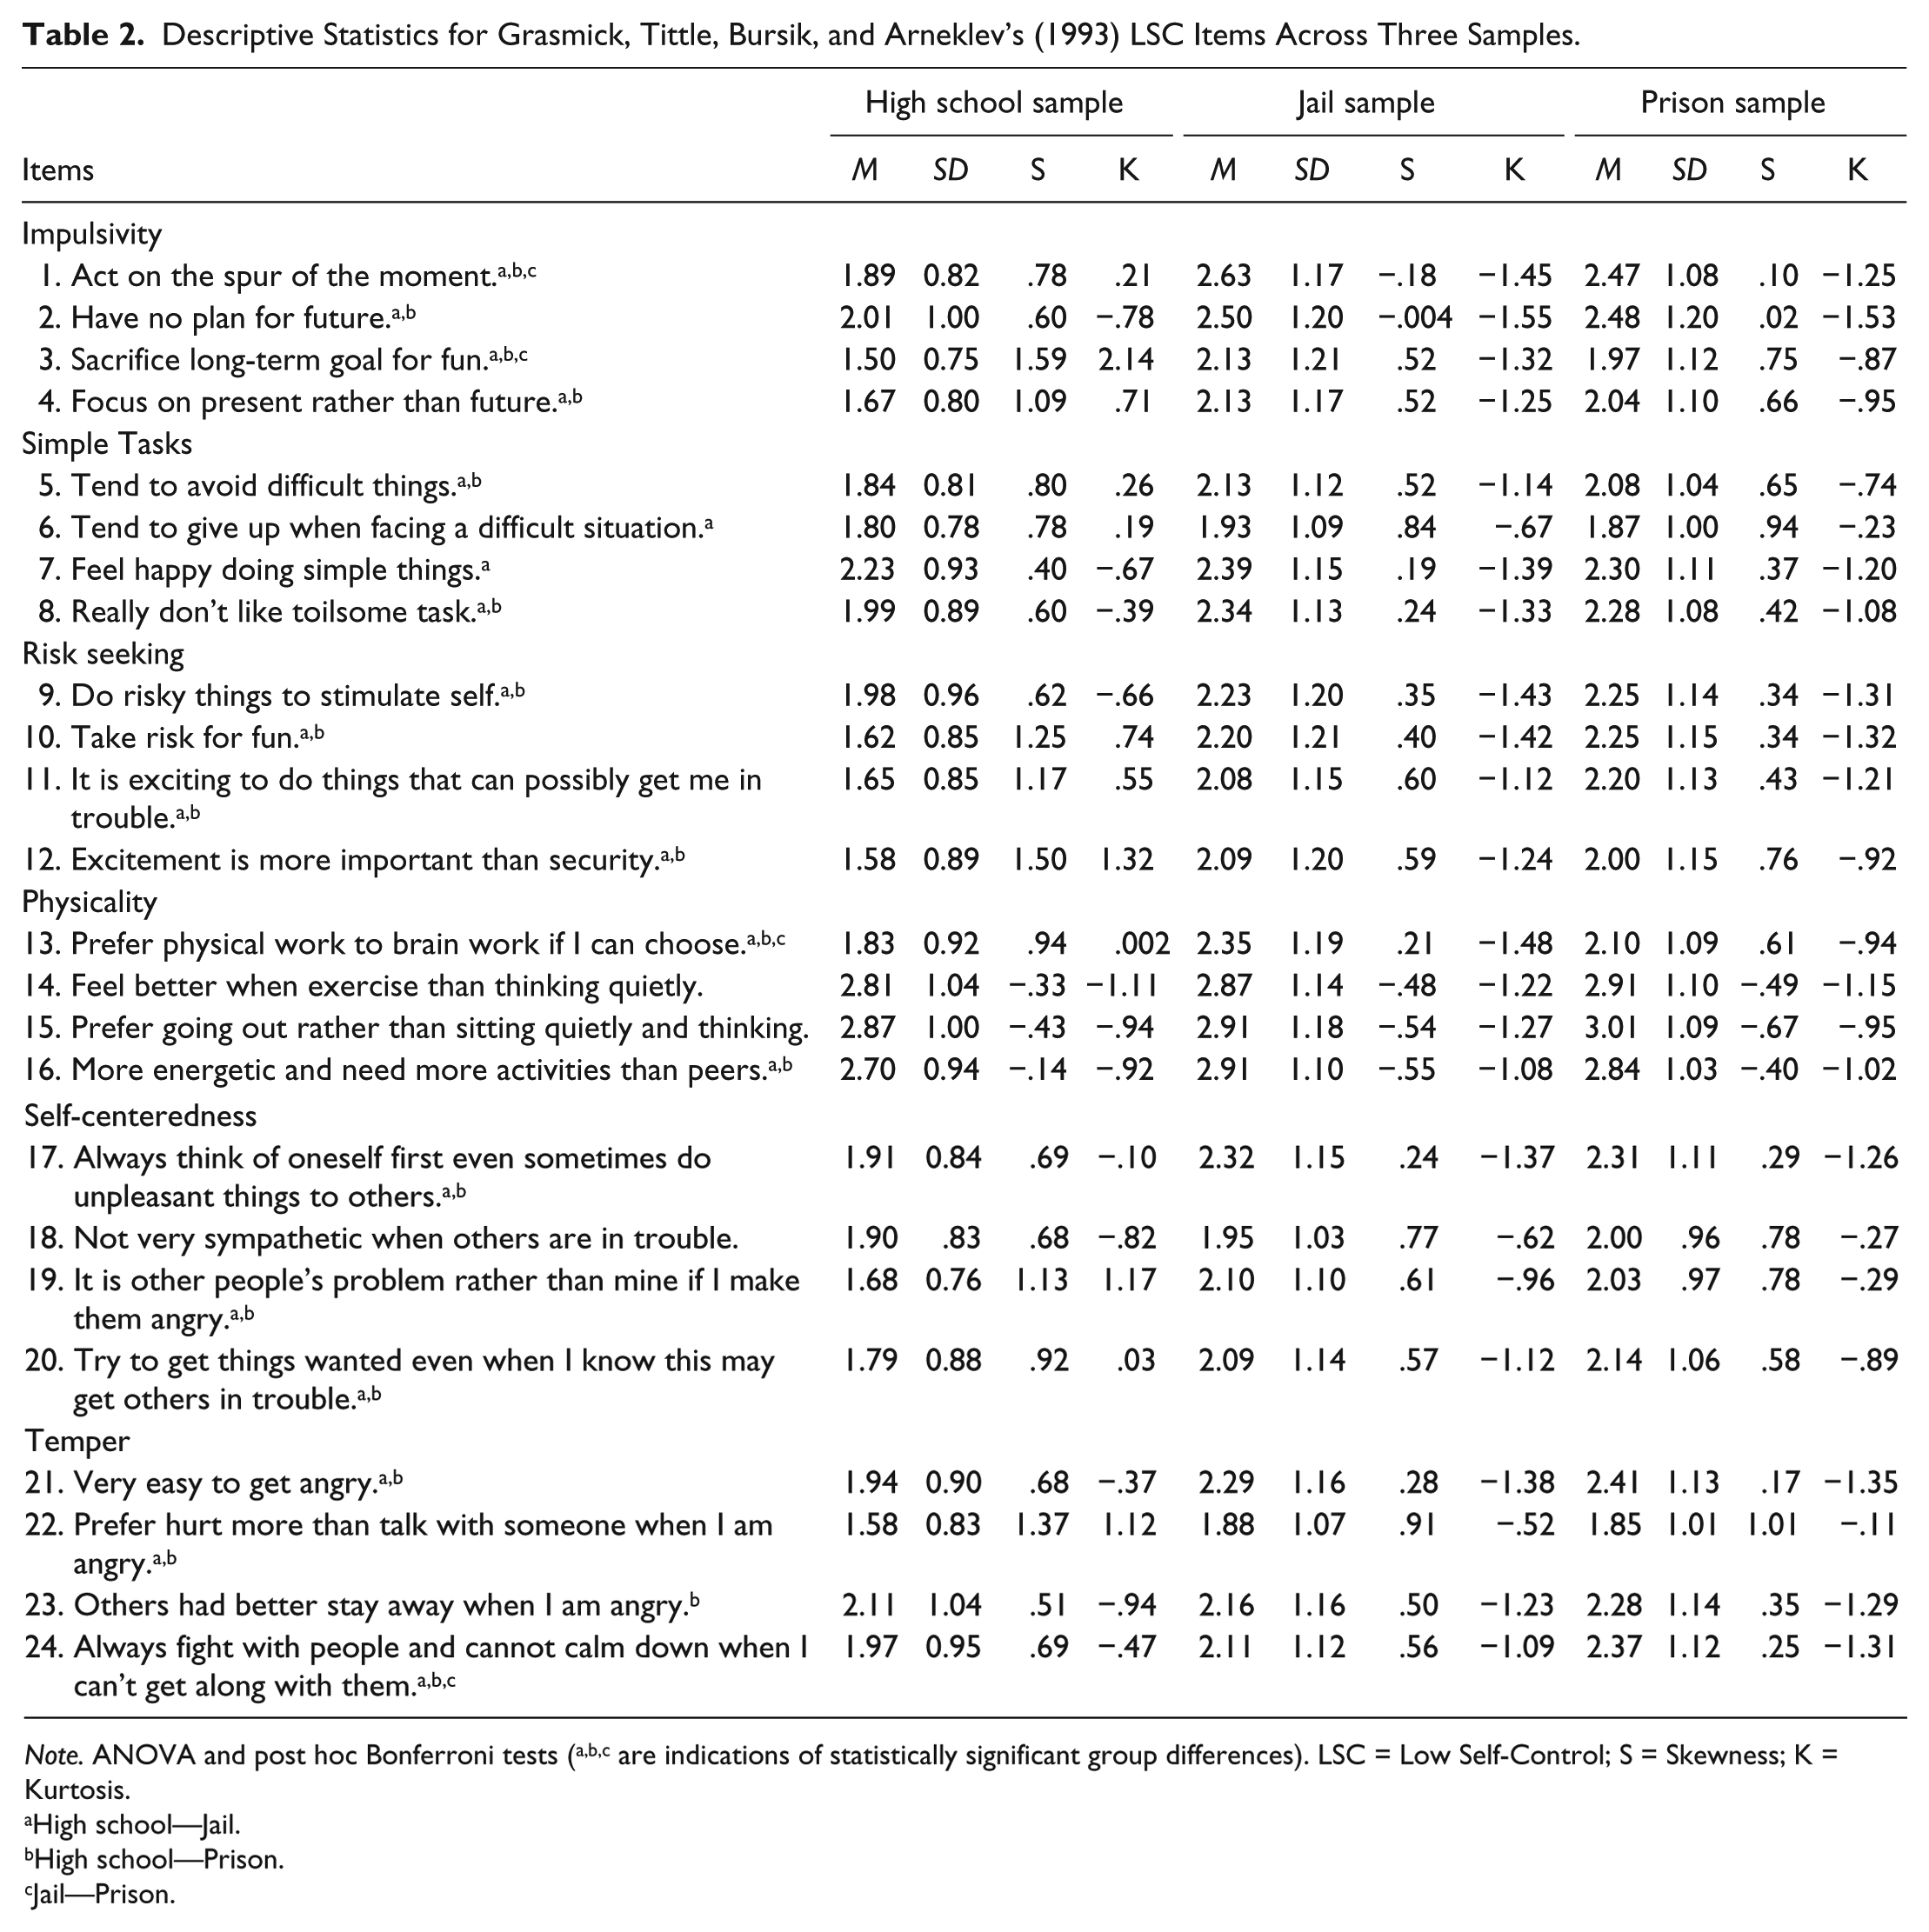
Note. ANOVA and post hoc Bonferroni tests (a,b,c are indications of statistically significant group differences). LSC = Low Self-Control; S = Skewness; K = Kurtosis.
High school—Jail.
High school—Prison.
Jail—Prison.
Tests of the Hypothesized Models
The next step in the analysis is to test three hypothesized models of factorial structure of the Grasmick et al.’s LSC—namely the one-factor model, the six-factor model, and the second-order model (see Figure 1). 7 The results of the three models for each sample are compared based on the Goodness-of-fit indices discussed previously to determine if there is a consistently best fitting model across the three samples. The summary of fit indices for the three models across the three groups is reported in Table 3. The first noteworthy finding derived from a careful examination of Table 3 is that none of the one-factor models is found to be satisfactory across the three groups. The set of fit statistics calculated fail to meet the critical values and indicate a poor fit. For example, χ2/df is 9.568 for the high school sample, and the values of CFI and TLI are below .80. The Goodness-of-fit indices improved in both the jail sample and prison sample, but the CFI and TLI remain around .80 (well below .90) and the values of RMSEA are all substantially above the cutoff point of .06. In addition, a careful review of the loading coefficients reveals that the size of the loadings for the one-factor model tend to be rather small, in fact much smaller than that in either the six-factor model or the second-order model across the three samples. 8 Given these results, the one-factor model tested across three independent groups can be safely rejected without additional consideration.
Summary of Fit Indices for the One-Factor Model, Six-Factor Model, and Second-Order Model in the Three Samples.

Note. CFI = comparative fit index; TLI = Tucker–Lewis index; RMSEA = root means square error of approximation.
The results of the multifactor model suggest that the fit indices are the best across all three samples. The CFI and TLI are both above .90 and all the other fit indices are satisfactory. However, the ANCOVA among the factors identified in the six-factor model indicates that multicollinearity is a serious problem to be resolved. The correlation matrix among factors is shown in Table 4. There are three pairs of factors whose correlations exceed the value of .70, including one pair above .80 (Impulsivity and Simple tasks) in the high school sample; seven pairings of factors out of 15 are above .70, including one pairing more than .80 (Risk seeking and Temper) in the jail sample. A similar pattern of high correlations among factors was detected in the prison sample, with five pairings of factors exceeding .70 correlations. Among these five pairings of factors, the correlations of two pairings exceed .80 (Risk seeking and Self-centeredness; Self-centeredness and Temper).
Covariance in the Six-Factor Models.
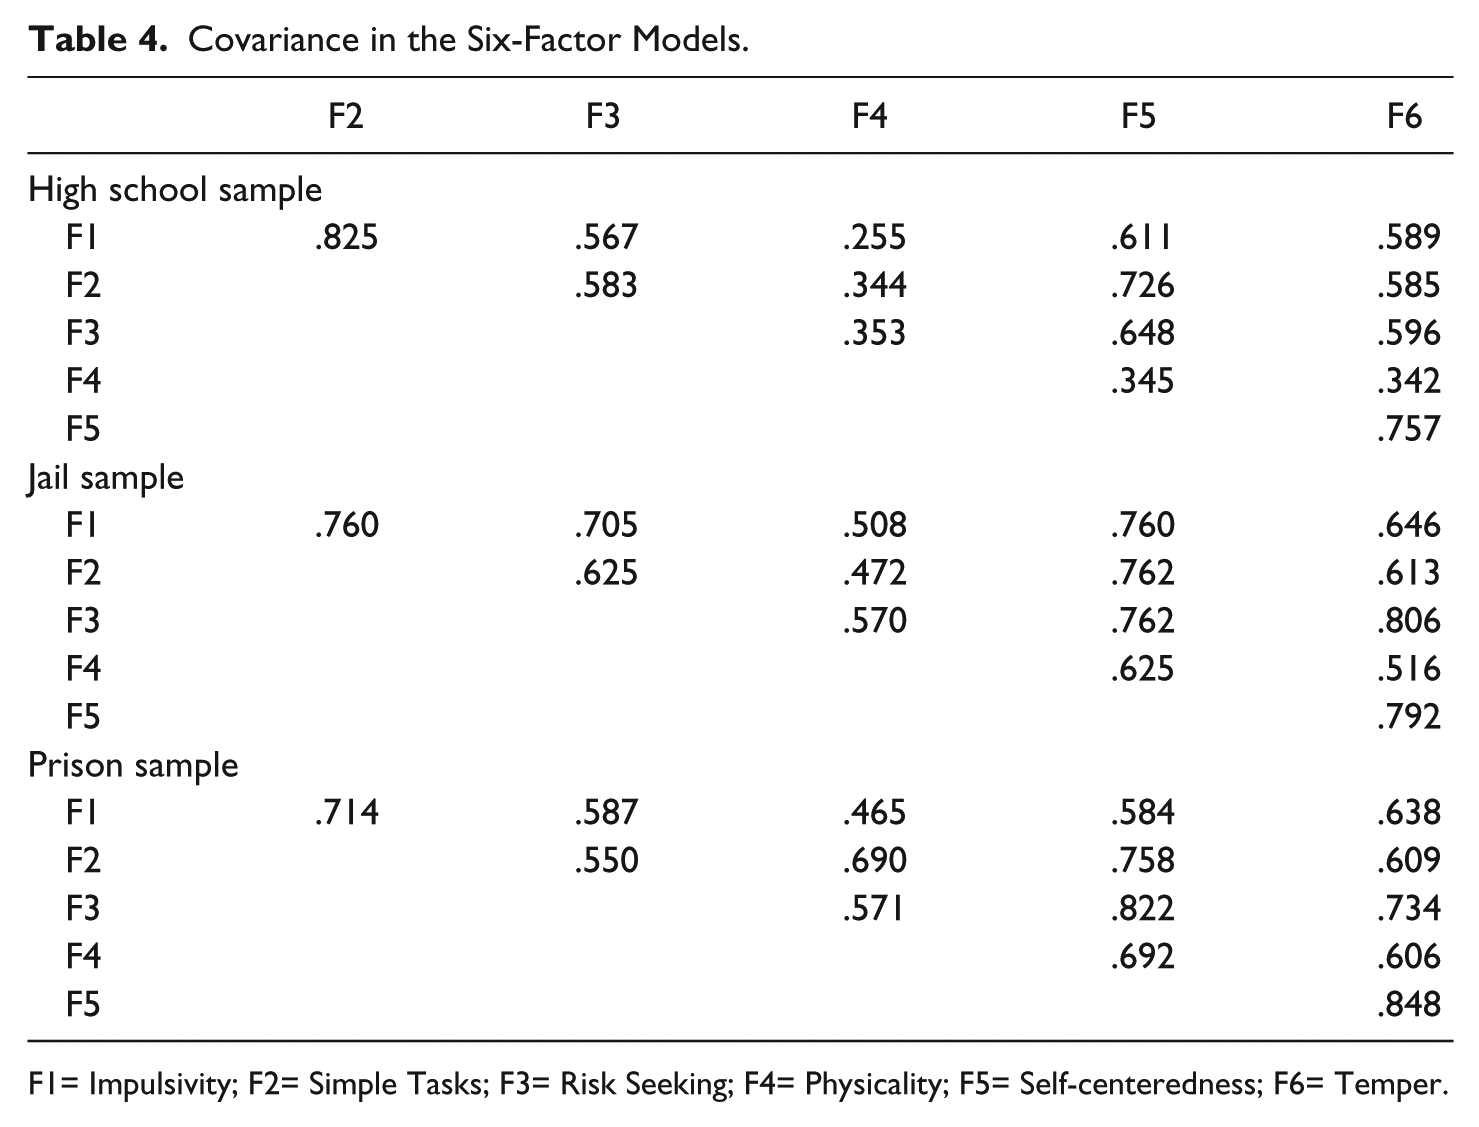
F1= Impulsivity; F2= Simple Tasks; F3= Risk Seeking; F4= Physicality; F5= Self-centeredness; F6= Temper.
As noted earlier, if a correlation between factors is above .70, multicollinearity can be a serious threat in CFA. A direct consequence is that the two highly correlated factors can share the same underlying trait and some items can be cross-loaded on multiple factors. Adding pairs of correlated errors may somewhat reduce the levels of correlation between the two factors, but this “fix” does not solve the problem given the large number of high correlation pairings documented across the three samples. Published studies using CFA in criminal justice research have chosen to avoid selecting a multidimensional model if the correlation between factors is judged to be high (e.g., Gau & Pratt, 2008; J. Zhao & Ren, 2015).
Previous studies on the factorial structure of self-control did not encounter this problem, and reported low or moderate correlations among factors (Williams et al., 2007). For example, Delisi et al. (2003) reported that multicollinearity should not be seen as a threat in the multidimensional model, observing the following: “Each of the six dimensions was correlated with the others. The weakest correlation was Self-centered and Simple task (r = .053) and the strongest was Simple tasks and Temper (r = .084)” (p. 255). It is clear that the correlations among factors witnessed across three independent Chinese samples show a totally different picture, with the values of correlations being nearly 10 times higher than those reported in the Delisi et al. (2003) study. The documented high correlations among LSC factors lead to the rejection of the multidimensional model, strongly suggesting the looming presence of a second-order general factor (Byrne, Baron, Larsson, & Melin, 1995).
The substantial overlap in factor variances suggested that a general factor of LSC was accounting for the six first-order factors. To test this possibility, a second-order solution was tested and the results reveal a second-order six-factor structure to most appropriately and parsimoniously describe the data (see Table 3). The value of χ2/df is 3.83 for the high school sample, 2.03 for the jail sample, and 1.73 for the prison sample. These values are all within the acceptable range of goodness-of-fit. The values of CFI and TLI for both the high school sample and jail sample are more than .90, whereas the prison sample has slightly lower CFI and TLI (.90 and .89, respectively). Overall, the second-order model is better fitting than the first-order model and the multidimensional model across the three samples. The itemized loadings for this second-order model are reported in Table 5. The loadings on the underlying self-control factor are statistically significant and solid in the second-order models across all three samples. It is interesting to note that although the Self-centeredness dimension loads the highest on the second-order factor (i.e., .863 for the high school sample, .925 for the jail sample, and .961 for the prison sample), the lowest loadings are those for Physicality (.408, .637, and .705 for the high school sample, jail sample, and prison sample, respectively).
Itemized Loadings for the Second-Order Model in the Three Samples.
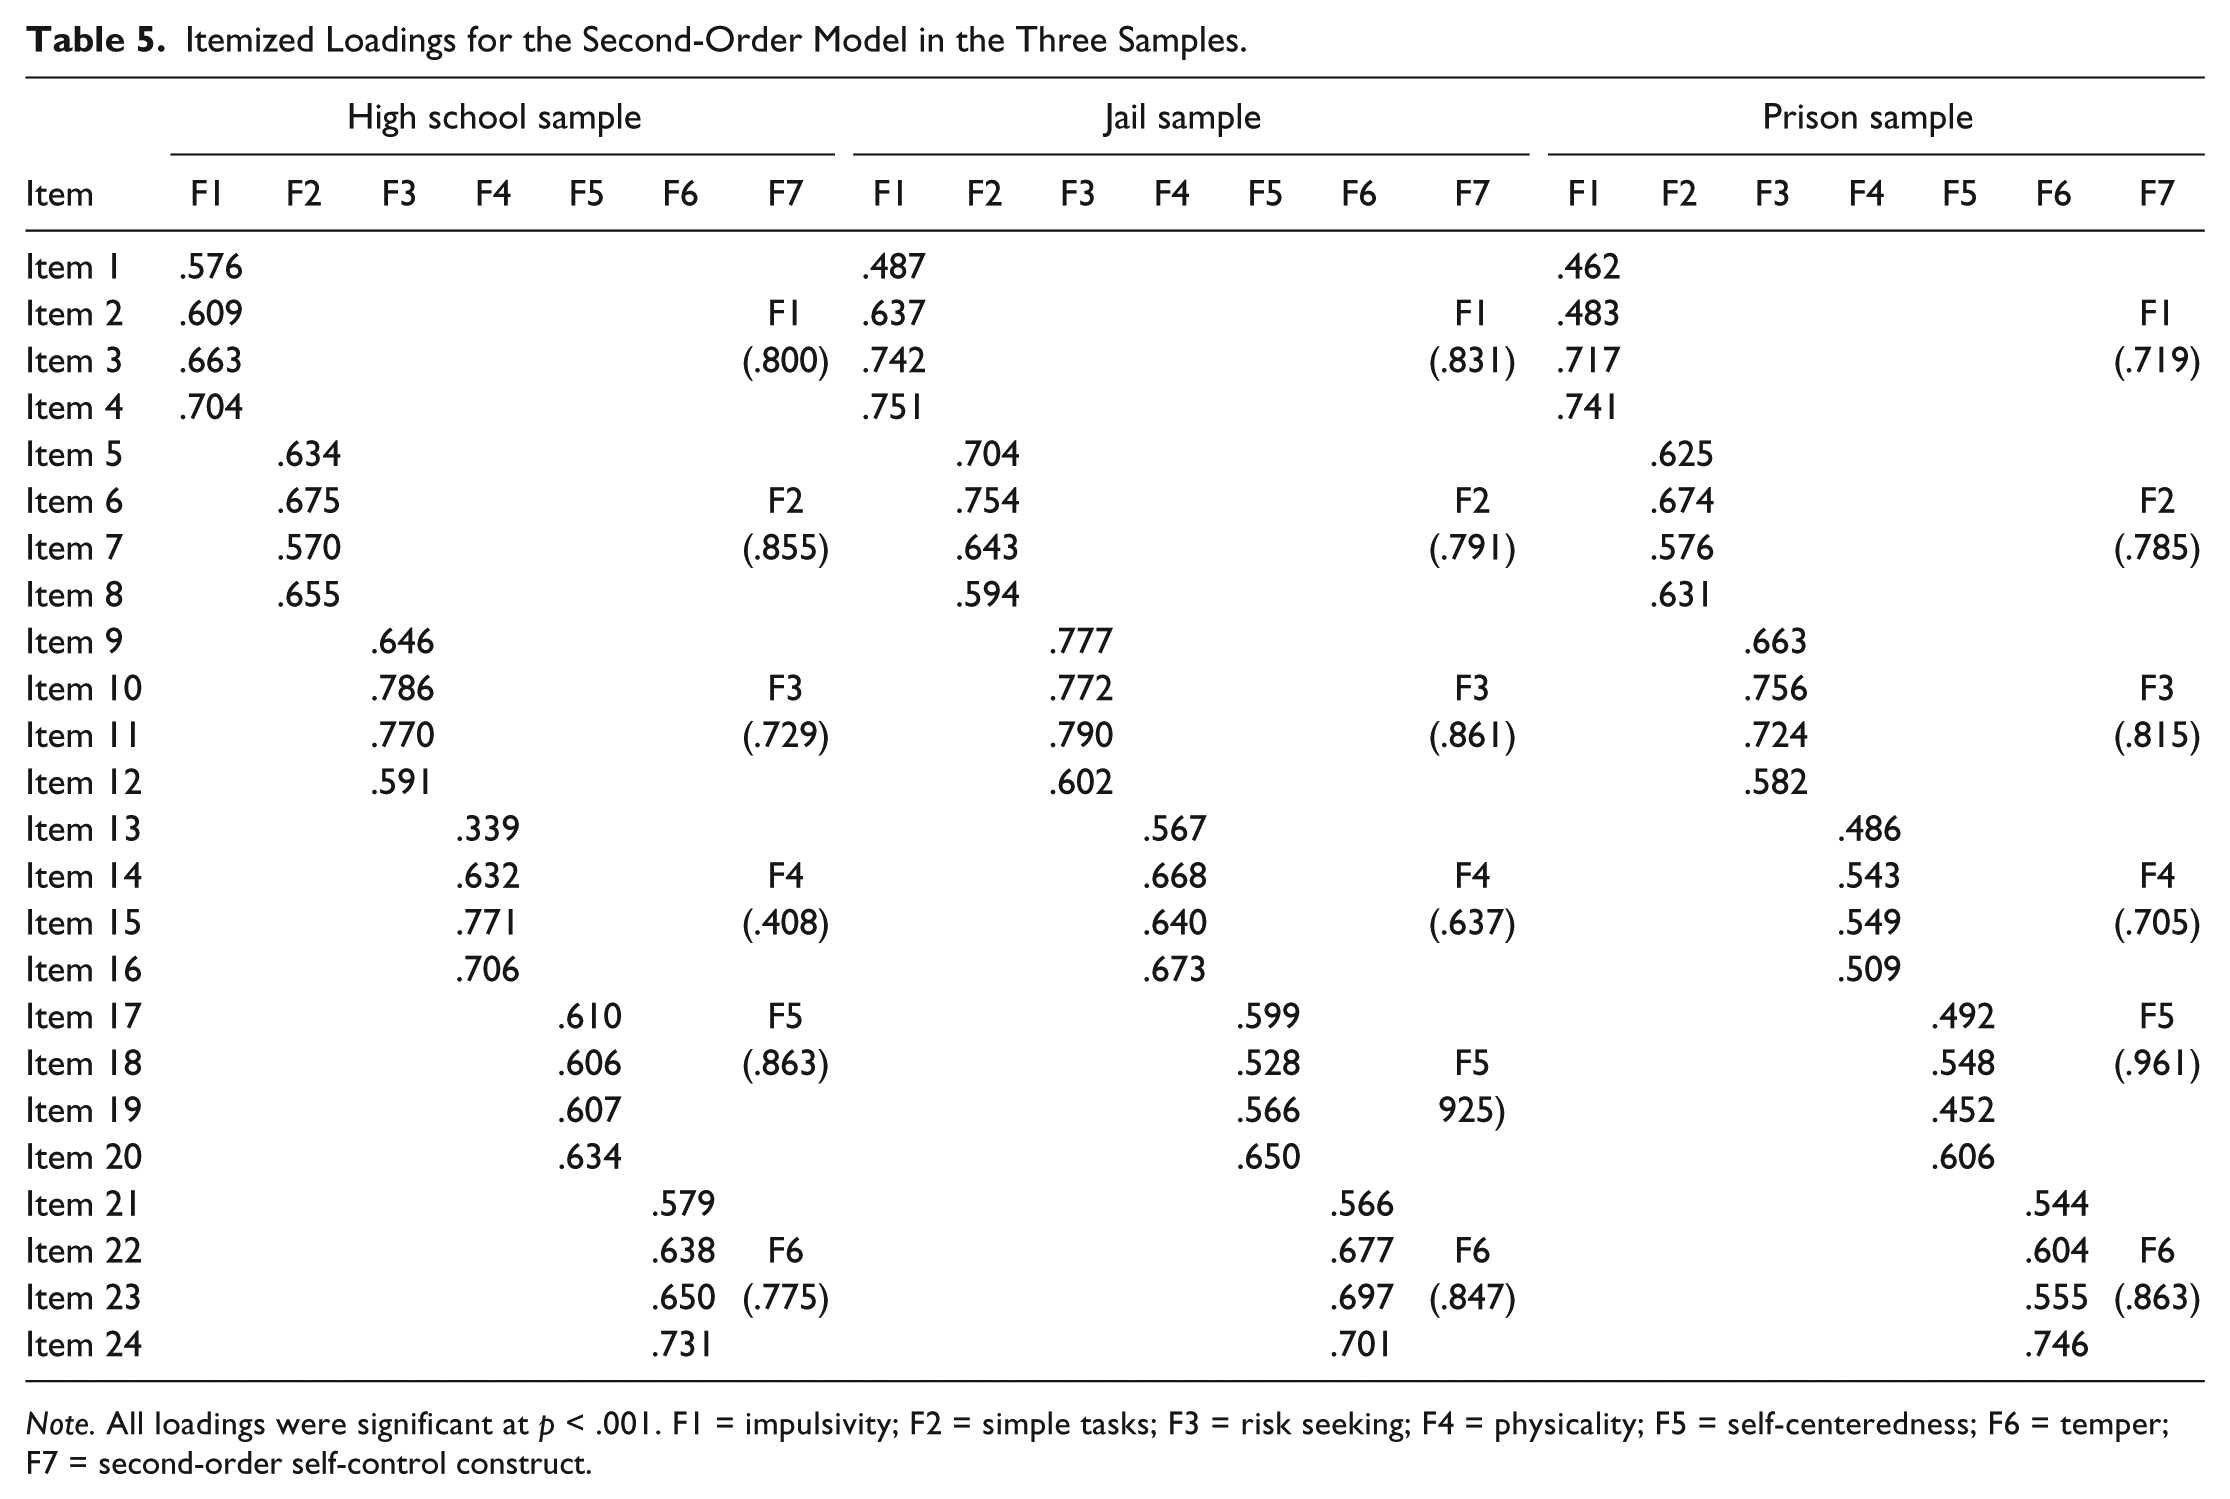
Note. All loadings were significant at p < .001. F1 = impulsivity; F2 = simple tasks; F3 = risk seeking; F4 = physicality; F5 = self-centeredness; F6 = temper; F7 = second-order self-control construct.
Discussion and Conclusion
The purpose of this study was to explore the factorial structure of Grasmick et al.’s self-control items across three independent Chinese samples. The divergent results of the dimensionality of LSC have plagued academics since the inception of the GTC. Gottfredson and Hirschi (1990) noted an ideal test of LSC would entail use of sets of survey respondents who have substantial differences in juvenile offending and analogous behaviors. Subsequent studies on this topic have consistently highlighted the importance of sample diversity in terms of juvenile offending (e.g., Delisi et al., 2003; Williams et al., 2007). The current study employed three distinctive samples reflecting this wide range of variance in deviant behaviors; our sample is from regular high school students who were planning to attend college, and two other samples are from juvenile offenders who were incarcerated in jail or who were adjudicated and sent to prison for the commission of serious crimes. The mean distribution of three crime offenses and analogous behaviors reported in Table 1 confirms the presence of substantial differences in self-reported criminal offending across the three independent samples.
Three observations stemming from the findings reported here deserve to be highlighted. First, it was hypothesized that, based on the centrality of self-discipline in traditional and contemporary Chinese culture, either a one-factor model or a second-order model would prove to fit the survey data collected in the three samples with respect to LSC dimensionality. The findings reported here offer strong support for the second-order factorial structure across the distinctive samples, suggesting the convergence of the six personal traits believed to underlie LSC. The hierarchical factor pattern replicated across the three Chinese samples and the associated parameters are typically stable, and reflect systematic consistency of the factorial structure. Similar to other studies that used CFA to assess dimensionality in the LSC measure, the first-order model was rejected due to the weak goodness-of-fit indices (e.g., Higgins, 2007; Vazsonyi et al., 2001). Moreover, unlike previous studies reporting low to moderate correlations between factors (Delisi et al., 2003; Williams et al., 2007), the Chinese samples consistently showed a pattern of high correlations between first-order factors. This set of findings significantly elevated the risk of being unable to differentiate factors that may have cross-loadings of manifested variables or feature systematic correlations between observed items (Chen, Sousa, & West, 2005; Grewal et al., 2004). The substantive meaning and implications of the second-order model can be discussed in terms of methodological, theoretical, and cultural dimensions.
Methodologically, the second-order model is quite different from a one-factor model in which all the observed variables load on a single factor. Chen et al. (2005) have highlighted several differences between the two which have direct applications to our analyses of LSC. A second-factor model can determine if a higher order structure is able to account for the pattern of interrelationship among first-order factors, taking note of significant loadings of all first-order factors on a higher order factor. Next, a second-factor model is a more parsimonious model featuring fewer parameters capturing the pattern of covariance among the first-order factors (Gustafsson & Balke, 1993). Finally, Chen et al. (2005) observed that “a second-order model separates variance due to specific factors from measurement error, leading to a theoretically error-free estimate of the specific factors” (p. 473).
The difference between the one-factor model and the second-order model is also theoretically significant (Chen et al., 2005). If the one-factor model is the focus, all the observed variables are loaded on a single factor whereas the six elements/dimensions are in fact “pseudo-elements,” neither being directly observed nor being empirically estimated. The six component elements/dimensions are used in a priori conceptualization phase of the development of the self-control survey questionnaire. The Grasmick et al.’s (1993) instrument was derived from the six elements/dimensions, which included 24 items (four per dimension) in total. In contrast, the six elements in the second-order model can be empirically examined as each of them predicts four manifest items and has its empirically documented variance and covariance with other factors. In addition, the meaning of LSC is directly derived from the six factors, not from the 24 observed items. In his critique of the self-control measure proposed by Grasmick et al., Marcus (2004) argued that a single core trait with no component elements is problematic in theory testing given that personality research in psychology suggests strongly that humans nearly always exhibit multidimensionality of personality traits. We believe that the second-order factorial structure of LSC is a more appropriate conceptualization of LSC because this aspect of human personality is comprised of six component traits that are loaded on a higher order factor which can be labeled self-control. In addition, all six dimensions of self-control are associated with manifest variables, and each has their own distinctive meaning.
Culturally, the second-order model of LSC fits well with the heritage and ongoing focus of Chinese culture. Hofstede (1997), the noted organization culture scholar, observed that the contemporary Chinese culture is heavily influenced by Confucianism, and as such is collectively oriented in contrast to the Western culture which is decidedly individualist in its fundamental orientation. Drawing upon the basic assumption of the classical school of economics, Gottfredson and Hirschi argued that human nature is such that pleasure seeking is the dominant driving force of human decision-making and pursuit of self-interest in the maximization of pleasure is the principal social dynamic at play in all human societies. The difference between criminals and noncriminals largely depends on the level of self-control acquired through socialization by one’s parents and other authorities in one’s youth (Gottfredson & Hirschi, 1990). Individuals with LSC have a tendency of making decisions that are for personal pleasure and gains without much delayed gratification and without much regard for the welfare of others. The focus of the analysis in LSC literature is on individuals and their traits, clearly reflecting the Western culture of individualism. In stark contrast, self-control in Confucianism is perceived as a group-oriented norm of conduct (Yao, 2000). Exercising a high level of self-control is not done so for personal gain, but rather for the promotion and maintenance of social harmony (J. Wang, Wang, Ruona, & Rojewski, 2005). Accordingly, an individual’s status as a respected person (civilized individual) depends on the perceptions of others that the person is willing to sacrifice his or her personal interest for the welfare of all (Yang et al., 2006). In sharp contrast, a petty man is seen as an uncivilized person who is self-centered, lacks self-control, and whose selfishness disrupts social harmony. Although the individualistic versus collectivistic orientation of self-control is different in the West and East, a consensus exists in regard to the adverse consequences of LSC for society.
The results of this study also reveal some culturally keyed features that concern the relative contributions of six first-order factors as they load on the higher order factor of LSC. In their tests on the dimensionality of LSC, Arneklev et al. (1999, p. 324) found that individual first-order factors have widely varying loadings on the second-order factor of LSC. Using data collected from a student sample and a citizen sample in the United States, they found the largest factor loading between Impulsivity and LSC (.58), characterizing their result as “the most striking result in the figure.” According to their data, the strength of the relationship between Impulsivity and LSC is much greater than any other factor. Impulsivity is seen as a key, core element of LSC. The tendency to jump into action without much consideration of long-term consequence or consideration of the benefits of delayed gratification is characterized as the core element of LSC. In contrast, the largest factor loading of all three higher order models in the current study conducted in China is self-centeredness (.863 in the high school sample, .925 in the jail sample, and .961 in the prison sample, see Table 5). In Arneklev et al.’s (1999) study, self-centeredness loaded only moderately on the second-order LSC measure (.38). We strongly suspect that this divergence in loadings is rooted in cultural differences. Confucianism emphasizes social harmony and the persistent suppression of individual desires for the goal of group-oriented outcomes—particularly the maintenance of social harmony (Yao, 2000). Actions taken by all individuals in society should take social cohesion into prime consideration, and individual self-interest must be pursued within the social harmony framework. Consequently, the concept of “without myself” (Wu Wo) is a major standard in Chinese thinking about social participation and civic engagement. This conceptual framing of social obligation stands in sharp contrast with Western culture which extolls the virtue of individual rights and liberties.
Relatedly, another interesting point that might be unique to Chinese society is that the loadings of physicality are the lowest across the three samples. As discussed earlier, Confucianism emphasizes mental capability as the primary means of success in life. Not surprisingly, the factor loading of physicality on the second-order model in the high school sample was only .408. Physical appearance in the form of muscularity and the demonstration in excellence in sports does not have much appeal to Chinese high schoolers because their overriding objective is to prepare for the national college entrance exam. Only those who are able to excel during the 3-day exam will be admitted to a key university. There is seldom a varsity soccer team or basketball team in a Chinese high school where physicality would be rewarded. Most Chinese students start their daily routine of study at 7:30 a.m. and call it a day at 9:00 p.m. or even later. As with the high school students, the loadings of Physicality on the LSC measure in the jail sample (.637) and the prison sample (.705) ranked the lowest among first-order factors.
Our findings add importantly to a growing body of research and empirical evidence that argues for a hierarchical factorial structure of the Grasmick et al. (1993) self-control measure. Although the results reported here indeed are noteworthy, the findings set forth need to be considered in light of a clear limitation of data source context. The factorial structure reported here involved data collected from an ethnic autonomous region within China. Subsequent studies can build upon these findings to include youth in other autonomous provinces (e.g., Uighurs and Tibetans) and in the coastal provinces to determine if the findings reported here can be replicated in contemporary Chinese society writ large. Such additional research would be of great value to our understanding of the potential and limitations of the LSC measure and the associated GTC.
Footnotes
Declaration of Conflicting Interests
The author(s) declared no potential conflicts of interest with respect to the research, authorship, and/or publication of this article.
Funding
The author(s) received no financial support for the research, authorship, and/or publication of this article.