
Abstract
This study analyzes data from the 2004 and 2008 panels of the Survey of Income and Program Participation (SIPP) to examine demographic factors among low-income households with children with disabilities that were associated with greater likelihood of receiving Supplemental Security Income (SSI) program, and their rates of material hardship (n = 444), by comparing them to low-income households with children with disabilities who did not receive child SSI (n = 1,942) and other low-income households that did not have children with disabilities (n = 7,533). Results showed household characteristics, such as those headed by individuals who were single women and Black people and those with less than high school education, and the presence of any working-age adult with disability to be significantly associated with greater likelihood of receiving child SSI. The study also found that controlling for selected demographic characteristics, low-income households with children with disabilities, irrespective of whether or not they received child SSI, experienced significant rates of hardships compared to low-income households without children with disabilities. The study found no evidence that receipt of SSI was associated with reduced material hardships in households with children with disabilities. Implications for policy are discussed.
Supplemental Security Income (SSI) is a federal means-tested program that provides cash assistance to low-income families of children with disabilities to compensate parents or other caregivers for the direct and indirect costs of care. Children’s SSI is part of the nation’s family support safety net and is usually considered assistance of last resort (Mashaw, Perrin, & Reno, 1996). To determine SSI eligibility for children, the Social Security Administration (SSA; 2013) defines children’s disability as a physical and/or mental condition that is expected to last for at least a year or result in death, and which markedly limits functioning or activities. Eligibility is determined by proof of disability and financial need. For children, eligibility is determined based on parental income. The maximum monthly SSI payment in 2013 was US$710 (SSA, 2012).
An important rationale for the child SSI program was provided by the U.S. House of Representatives, Committee on Ways and Means (1971) when the program was authorized. The Committee stated that poor children with disabilities were the most disadvantaged and have needs greater than non-disabled children. Therefore, poor children with disabilities require additional assistance to become self-supporting members of the society. In 1994–1995, the National Academy of Social Insurance (NASI) Committee on Childhood Disability (Mashaw et al., 1996) provided further rationale for the child SSI program, including (a) prevention of expensive institutionalization of children with disabilities; (b) helping children meet their basic needs for food, clothing, and shelter; (c) compensating parents for some of the lost wages; and (d) helping families meet some of the additional costs of raising a disabled child. As such, the SSI program aims to make family-centered care a reality for low-income families of children with disabilities.
The first goal of the study is to assess factors associated with participation in the SSI program among low-income households with children with disabilities. It is estimated that as of 2012, 11.1 million children in the United States had disabilities (U.S. Census Bureau, 2013), of whom only 1.3 million received SSI. Thus, participation in SSI has been relatively low. It is therefore important to know the cluster of factors that make some households participate in the SSI program and others to not. There have been a range of studies on the child SSI recipient population. Some have investigated trends in SSI participation following the passage of important policy decisions (Garrett & Glied, 1997), whereas others have assessed trends of SSI receipt among children with varying diagnoses (Koyanagi, 2011). Yet, other studies have focused on describing the child SSI population (Rupp et al., 2005–2006), or have assessed the impact of participation in SSI on household income, or reduction in the probability that a child lives in poverty (Duggan & Kearney, 2007), rate of unmet medical needs, or out-of-pocket medical expenses (DeCesaro & Hemmeter, 2009). To date, Duggan and Kearney’s (2007) study was the only one that explicitly assessed determinants of participation in SSI using the Survey of Income and Program Participation (SIPP). They found that determinants of SSI receipt included number of children living in the household, and being Black or African American. However, Duggan and Kearney (2007) restricted their sample to households with at least one child below age 18, irrespective of household income level or child disability status. In contrast, the current study restricted the sample to children living in low-income families that included a child with disabilities. Focusing specifically on low-income households with children with disabilities enables us to investigate the heterogeneity of factors that determine receipt of children’s SSI among a population with a similar probability of receipt of the income transfer program.
The second goal of the study was to assess the extent of material hardship among low-income families of children with disabilities that receive SSI, and how they compare with that of other low-income families raising children with and without disabilities. Households raising children with disabilities experience higher rates of income poverty compared to their non-disabled peers (Emerson & Hatton, 2009; Fujiura & Yamaki, 2000; Ghosh & Parish, 2013; Parish, Rose, Grinstein-Weiss, Richman, & Andrews, 2008), and there is some evidence that the causal relationship between poverty and disability is bi-directional (Emerson, 2004; Fujiura & Yamaki, 2000). Living in poverty exposes a child to environmental hazards such as harmful toxins, accidents, infections, inadequate health care, and unsafe living environments that increases risks of childhood disability (Brooks-Gunn & Duncan, 1997; Emerson, 2004). And conversely, disability in a child affects family finances in the form of direct and indirect costs that the family has to bear. Direct costs of care include therapies, preventive and emergency care (Perrin, 2002), home modification, special educational services, adaptive equipment and supplies, and respite care (Chen & Newacheck, 2006; Newacheck & Kim, 2005; Parish & Cloud, 2006). These expenses are not fully covered by U.S. public health insurance systems such as Medicaid or the State Children’s Health Insurance Programs, or by private health insurance (General Accounting Office, 2000). As a result, families bear significant financial burdens for out-of-pocket payments. Indirect costs include reduced or foregone employment and lost productivity (Emerson, 2004; Parish, Seltzer, Greenberg, & Floyd, 2004; Porterfield, 2002). Stabile and Allin (2012) estimated the average annual cost per family with children with disabilities to be US$10,830, which included direct monetary costs, and indirect costs, such as a decline in work hours, reduced labor force participation, and reduced future earnings. All of these have deleterious long-term impacts on family finances, including later-life asset accumulation and financial security (Parish et al., 2004).
The U.S. income poverty threshold, however, is an absolute income standard, equivalized for household size, and it fails to account for expenses such as housing, child care, and health care costs, which now constitutes the majority of household expenses (Citro & Michael, 1995; Parish et al., 2004; Porter, 1999). The measure has been widely criticized for its inadequacies in identifying households whose basic needs remain unfulfilled (Boushey, Brocht, Gundersen, & Bernstein, 2001). Other measures of poverty and hardship have been developed to ascertain the nuances of financial well-being, including indicators of material hardship (Boushey et al., 2001). Material hardship indicators directly measure the extent to which households have unmet basic human needs (Ouellette, Burstein, Long, & Beecroft, 2004). The measure is moderately correlated with income and poverty in the United States (Boushey et al., 2001; Mayer & Jencks, 1989), and households with incomes between 1 and 2 times the federal poverty level are more likely to report a variety of material hardships than those with income above twice the income poverty threshold (Boushey et al., 2001; Eamon & Wu, 2011).
Families raising children with disabilities incur greater material hardships than families whose children do not have disabilities (Ghosh & Parish, 2013; Parish et al., 2008). Elevated poverty and material hardships among children with disabilities are troubling as it implies that children with disabilities are living in conditions that have been shown to hinder development in typically developing children (Brooks-Gunn & Duncan, 1997).
A majority of child SSI recipient households have low-income (Davies, Rupp, & Wittenburg, 2009; Rupp et al., 2005–2006). However, the extent to which SSI recipient households are able to fulfill their basic needs, when there is evidence that material hardships and economic deprivation directly or indirectly affect child development, has not been investigated (Blau, 1999; Gershoff, Aber, Raver, & Lennon, 2007). Hardship within the child SSI population is an important issue because enduring exposure to hardship may result in diminished resources needed to become an independent functioning adult and/or increased likelihood of developing comorbidities or preventable secondary health conditions.
Furthermore, we do not know how rates of hardship in SSI households compare with other low-income households with or without children with disabilities. This stems from limitations in the existing literature that have lacked comparison groups. Some studies have exclusively focused on children receiving SSI, using data from the National Survey of SSI Children and Families (e.g., DeCesaro & Hemmeter, 2009; Rupp et al., 2005–2006), whereas other studies included comparison groups but used non-representative samples (Meyers, Lukemeyer, & Smeeding, 1998). Meyers and colleagues exclusively sampled female-headed households in California that received Assistance to Families With Dependent Children, and participants were interviewed prior to the enactment of the Personal Responsibility and Work Opportunity Act. Following its passage, SSI eligibility was tightened considerably (Davies, Iams, & Rupp, 2000) and eventually more than 100,000 children with disabilities were eliminated from SSI rolls (Karoly & Davies, 2004). Furthermore, it is important to know how SSI recipient households compare with similar economically deprived households with children with disabilities who do not receive SSI, if we are to understand the efficacy of the program in helping children and families maintain a decent standard of living. Taken on balance, the existing research suggests that rates of material hardship are relatively high among low-income families raising children with disabilities.
Using data from the SIPP, we addressed the following two research questions:
We hypothesized that low-income household that included children with disabilities are more likely to experience material hardships than low-income households without a child with a disability. We further hypothesized that there would be reduced material hardship among low-income households raising children with disabilities that received SSI in comparison with low-income households of children with disabilities that did not receive SSI. These results will address the extent to which participation may buffer low-income households with SSI recipient children with disabilities from material hardships, after controlling for a range of demographic characteristics.
Method
Data and Measures
We analyzed data using respondents from both the 2004 and 2008 panels of the SIPP, administered by the U.S. Census Bureau (2001), representative of the non-institutionalized U.S. civilian population. Started in 1984, SIPP involved continuous sets of panels each ranging between 2.5 years and 4 years. Each panel consisted of waves, and the number of waves varied depending on the duration of the panel. For example, the 2001 panel included 12 waves and the 2004 panel included 14 waves. Respondents once chosen into a panel are followed through the entire panel length, ending which, a new set of respondents are chosen for the next panel.
The SIPP underwent several redesigning, but the panels used in this study (2004 and 2008) followed the same design. Respondents in the 2004 and 2008 panels were interviewed 3 times per year (also referred to as waves), and information was sought on program participation for the preceding 4 months. Each wave included a set of core questions on sample demographics, program and labor force participation, receipt of cash and non-cash benefits from welfare programs, and asset ownership. The SIPP is being widely used to assess participation in government programs and is the only data source that reliably distinguishes between child and adult SSI recipients (Duggan & Kearney, 2007).
The SIPP also included measures of material hardships and household disability. These were part of topical questions that varied by wave and included questions on assets and liabilities, marital history, work history, disability, and material hardships. The reference period of the topical module varied, depending on the questions asked. Topical data of interest were disability status of children and adults in the household, and measures of material hardships. Disability and material hardships data were obtained from the fourth month of Wave 5, of the 2004 panel, and the fourth month of Wave 6 of the 2008 panel, referred to as focal months. It was essential to match the focal month of the topical module and extract all relevant information such as weights for the month for each respondent from the corresponding core data.
Sample and Measures
The sample included households with at least one child between ages 0 and 17 (n = 24,771). Of these 24,771 households, 4,883 households had at least one child with a disability and 609 (representing 1.8 million of the U.S. households) households reported receiving child SSI during the last reference month of Waves 5 and 6 of the 2004 and 2008 panels, respectively. Households were identified using two variables. First, every respondent above age 15 who was a parent or a guardian of household members less than 21 years of age were asked whether they received any SSI on behalf of the indicated household member during the reference period. Second, respondents between ages 15 and 17 who themselves received SSI, and who had a designated parent or guardian at home, were identified as child SSI recipients.
However, of the 609 households who reported receiving child SSI, 205 did not report having a child with a disability in the household. Prior evidence showed very low rates of under-reporting of SSI participation in the SIPP, in comparison with the Current Population Survey, and that SIPP captured almost 98% of SSI recipients from the SSA data (Meyer, Mok, & Sullivan, 2009). However, child disability status is usually reported by parents, and there is evidence that proxy reporting of disability introduces bias, which may lead to under-reporting, thus affecting estimates (Todorov & Kirchner, 2000). Imputation of child SSI receipt was just 5%. This evidence suggests there is some under-reporting of child disability in the SIPP. Prior research and our sensitivity analyses conducted by analyzing the full data of 609 SSI recipient households and again by analyzing the data after removing the 205 cases, we found no significant difference in demographic and outcome measures. Thus, the 205 households were retained in the sample and categorized as having a child with a disability and also receiving SSI. The total sample included the following: 609 (representing approximately 1.8 million U.S. households) households with disabled children receiving child SSI; 4,266 households with at least one disabled child, but not receiving SSI, which represented 12 million households; and those with non-disabled children (19,896).
The sample was further restricted to households with children and with income below 200% of the federal poverty threshold (n = 9,919). Of the 9,919 households, 7,533 (representing 24 million U.S. households) were low-income households with children, where none of the children had a disability; 1,942 (representing 5.8 million U.S. households) were low-income households with disabled children, but not receiving SSI; and 444 (representing 1.4 million U.S. households) were low-income households with disabled children receiving SSI. SSI households constituted only 13.6% of all low-income households with children with disabilities.
For Aim 1 of the study, the dependent variable was a dichotomous measure of whether households received child SSI versus not receive child SSI. For Aim 2, the dependent variables were measures of material hardships. These included a measure of difficulty paying for utilities such as electricity and or telephone bills; difficulty paying the full amount for rent or mortgage; difficulty meeting essential expenses and not going to a doctor and or a dentist when needed to anytime in the past 12 months; and whether they experienced food insecurity anytime in the past 4 months (National Research Council, 2013).
The independent variables included three household categories—child disabled and receiving SSI; child disabled, not receiving SSI; and households with no disabled children—which resulted in two dummy variables, each comparing households with disabled children (with or without receiving child SSI) with households where none of the children had a disability.
Demographic variables obtained from the core data included the level of education of the reference person or the householder (defined by SIPP as the owner or renter of the household), a dichotomous measure that identified reference persons with education less than or equal to high school and more than high school; racial origin, which was ascertained by asking the reference person what race(s) he or she considers herself or himself to be; and a variable on origin. A new variable “racial origin” was created, which resulted in four categories: (a) White non-Hispanic, (b) Black non-Hispanic, (c) other non-Hispanic, and (d) Hispanic.
Also included was a variable that indicated whether the householder was a single female, aged 18 and above. The reference category was “other” households created using two variables, gender and marital status. Because the total number of households with children headed by single men was few, they were collapsed together with householders who were either married men or women, and categorized into one category referred to as “other.”
We also included a variable that indicated whether the household had at least one working-age adult with a disability and a dichotomous variable showing the panel year. The panel year was controlled for in the analysis, because the 2004 and the 2008 panels covered two economically different time points in the United States (the 2008 panel coincided with the Great Recession, lasting from December 2007 to June 2009).
Finally, we included an indicator of whether the household had at least one working-age adult who was continuously employed in the past 1 year. Material hardship questions had a 12-month reference period, and within the past 12 months, households might have experienced employment shocks that may affect their material well-being, an effect that is independent of the impact that a child with a disability might have on a household’s material well-being. In addition, in this study, we specifically focused on low-income households, primarily headed by single women with children, who in general experience greater job instability (for review, see Holzer & Martinson, 2006). Therefore, to assess job loss, we created a lag variable that assessed transitions out of employment (25% cases underwent job loss). A new variable was created, which categorized households into two: (a) those with at least one working-age adult who was continuously employed in the past 12 months and (b) households with at least one working-age adult who was not continuously employed (included households where at least one working-age adult who underwent job loss, and at least one working-age adult who did not have a job anytime in the past 12 months or had intermittent periods of employment). However, of the 9,919 households, 1,434 households did not have employment data for some of the prior calendar months (most likely to have joined or moved into a different household after the survey began), making it difficult to assess employment patterns over the 12-month period. These households with missing data were categorized as having at least one continuously or not continuously working-age employed adult, based on their most recent monthly employment data available. Analyses with and without the 1,434 cases yielded no significant change and thus, were retained.
Because the SIPP is a stratified multistage probability sample, STATA (Stata Corp., 2011) was used to adjust standard errors and inferential statistics estimates. We used Fay’s method for balanced repeated replication (BRR) to estimate variances (U.S. Census Bureau, 2001). These results are weighted to reflect each respondent’s probability of selection.
For analysis of binary outcomes, chi-square tests compared the three groups on demographic variables and hardship characteristics. To compare the three groups on continuous variables, one-way ANOVA was used. Post hoc comparisons were conducted using logistic regression for binary outcomes and post hoc tests with Bonferroni correction for continuous data. For Research Question 1, we conducted multivariate logistic regression, by limiting the sample to low-income households with children with disabilities and comparing households with disabled children who received SSI, with low-income households with disabled children, but not receiving SSI. For Research Question 2, we conducted multivariate logistic regression for the entire analytic sample of low-income households with children (n = 9,919) controlling for household structure, householder’s race and ethnicity, education, whether the household included at least one employed working-age adult, whether the household had at least one adult with a disability, and the panel year. Income was not included in the regression, because the sample was restricted to low-income households (below 200% of Federal Poverty Level [FPL]), which in itself is a significant determinant of SSI receipt. Although levels of income could have been used to assess the income level at which people have a higher probability of receiving SSI, further stratification of the data was not possible because of the sample size, which could have affected estimates. The goodness-of-fit of the models were reported as F statistics. Although the default goodness-of-fit for logistic regression is Pearson’s chi-square, it is corrected for the survey design in STATA with the second-order correction of Rao and Scott (1984) and is converted into an F statistic to obtain proper p value.
Results
Sample Description
Table 1 describes the total sample of low-income households with children (n = 9,919). As evident from the table, a majority of respondents were high school educated and were non-Hispanic. However, nearly 40% of the SSI sample was Black, in comparison with 20% in the other two groups. In general, low-income households with disabled children, irrespective of whether or not they received child SSI, had significantly greater number of disabled adults living in the household (53% and 50%), compared with low-income households that did not have a disabled child (29%). Children with disabilities receiving child SSI were significantly more likely to live in households that had at least one working-age adult who was not continually employed in the past 12 months (90%), compared with low-income households with disabled children and not receiving SSI (83%) and other low-income households with non-disabled children (80%). Among households receiving child SSI, majority (71%) were headed by single women. This was significantly greater when compared with households with disabled children not receiving SSI (55%) and households that did not have a child with a disability (46%).
Description of Low-Income Households (Income Below 200% of the FPL) With Children.

Note. Weighted percentages for categorical variables and mean (SD) for continuous variables. FPL = Federal Poverty Level; SSI = Supplemental Security Income; HH = household; Reference person = the owner or renter of the household; TANF = Temporary Assistance for Needy Families.
Sig. difference-low-income HH without disabled children and HH with disabled children receiving SSI. b. Sig. difference-low-income HH with disabled children not receiving and low-income HH with disabled children receiving SSI. c. Sig. difference-low-income HH without disabled children and HH with disabled children not receiving SSI. d. Native Americans, Hawaiians, and Pacific Islanders and Asians.
p < .05. **p < .01. ***p < .001.
Table 1 also reports cash and non-cash assistance program participation by low-income households with or without children with disabilities. In households where disabled children received SSI, 33% of the adults in those households also reported receiving adult SSI, rates that were significantly greater compared with low-income households with disabled children (10%) and those with children with no reported disability (5%). Similarly, low-income households that received child SSI had significantly greater rates of food stamp program participation (62%) and Medicaid (67%) in comparison with other households with disabled children and those who did not have a disabled child. Although participation in Temporary Assistance for Needy Families (TANF) and energy assistance programs was low, households with children with disabilities, irrespective of whether they received SSI, reported significantly greater rates of participation in TANF and energy assistance programs in comparison with low-income households where none of the children had a disability.
Table 1 also reported unadjusted rates of material hardships or unmet needs among low-income households with children. The SSI recipient households and those with disabled children that did not receive SSI had significantly greater rates of hardships on all measures compared to low-income households that did not have any children with disabilities.
Determinants of participation in SSI by low-income households with children with disabilities
Among low-income households with children with disabilities, those where the reference person was single and female had higher odds of receiving child SSI (odds ratio [OR] = 1.49, confidence interval [CI] = [1.06, 2.08], p < .05) than households not headed by single women. Households where the reference person was Black reported 2 times greater odds of receiving SSI than when the reference person was White non-Hispanic (OR = 2.10, CI = [1.55, 2.85], p < .000). Households where the householder was less than high school educated had 1.54 times greater odds of receiving SSI than households where the householder was more than high school educated. Among low-income households with children with disabilities, those that had at least one working-age adult with disability were at greater odds of receiving child SSI than households that did not have an adult with a disability (OR = 1.36, CI = [1.04, 1.79], p < .05). Finally, households that had at least one working-age adult who was continuously employed were 1.5 times more likely to receive child SSI than households that did not have at least one working-age adult who was continuously employed (OR = 1.45, CI = [0.93, 2.25], p < .10). In other words, among low-income households, characteristics such as households headed by single females, those who were Black, those with low education, those that do not have at least one working-age adult who was continuously employed in the past 1 year, and households that had working-age adults with disabilities had greater odds of participating in SSI when they had a child with a disability.
Rates of hardship in low-income households by household type
Table 2 shows the adjusted comparison of households with children. After controlling for a range of characteristics, households with children with disabilities who did not receive child SSI had a greater likelihood of not being able to meet their essential expenses (OR = 1.58, CI = [1.39, 1.80], p < .000), not being able to pay the full amount of rent or mortgage (OR = 1.49, CI = [1.27, 1.74], p < .000), not being able to meet regular expenses (OR = 1.55, CI = [1.35, 1.77], p < .000), not seeing a doctor or a dentist when needed (OR = 1.47, CI = [1.28, 1.68], p < .000), and experiencing higher odds of food insecurity (OR = 1.61, CI = [1.44, 1.82], p < .000) in comparison with low-income households that did not have children with disabilities. Low-income households with children with disability who received SSI experienced greater odds of not being able to meet regular expenses (OR = 1.58, CI = [1.23, 2.05], p < .000), and are 1.81 times more likely to have not met utility expenses, and greater odds of experiencing food insecurity (OR = 1.51, CI = [1.18, 1.94], p < .000) compared with low-income households that did not have children with disabilities. These findings confirmed our first hypothesis that households with children with disabilities are more likely to experience hardships than low-income households with children without disabilities.
Odds of Material Hardships in Low-Income Households With Disabled Children (Receiving or Not Receiving Child SSI) Compared to Households With Children, but None With a Disability.
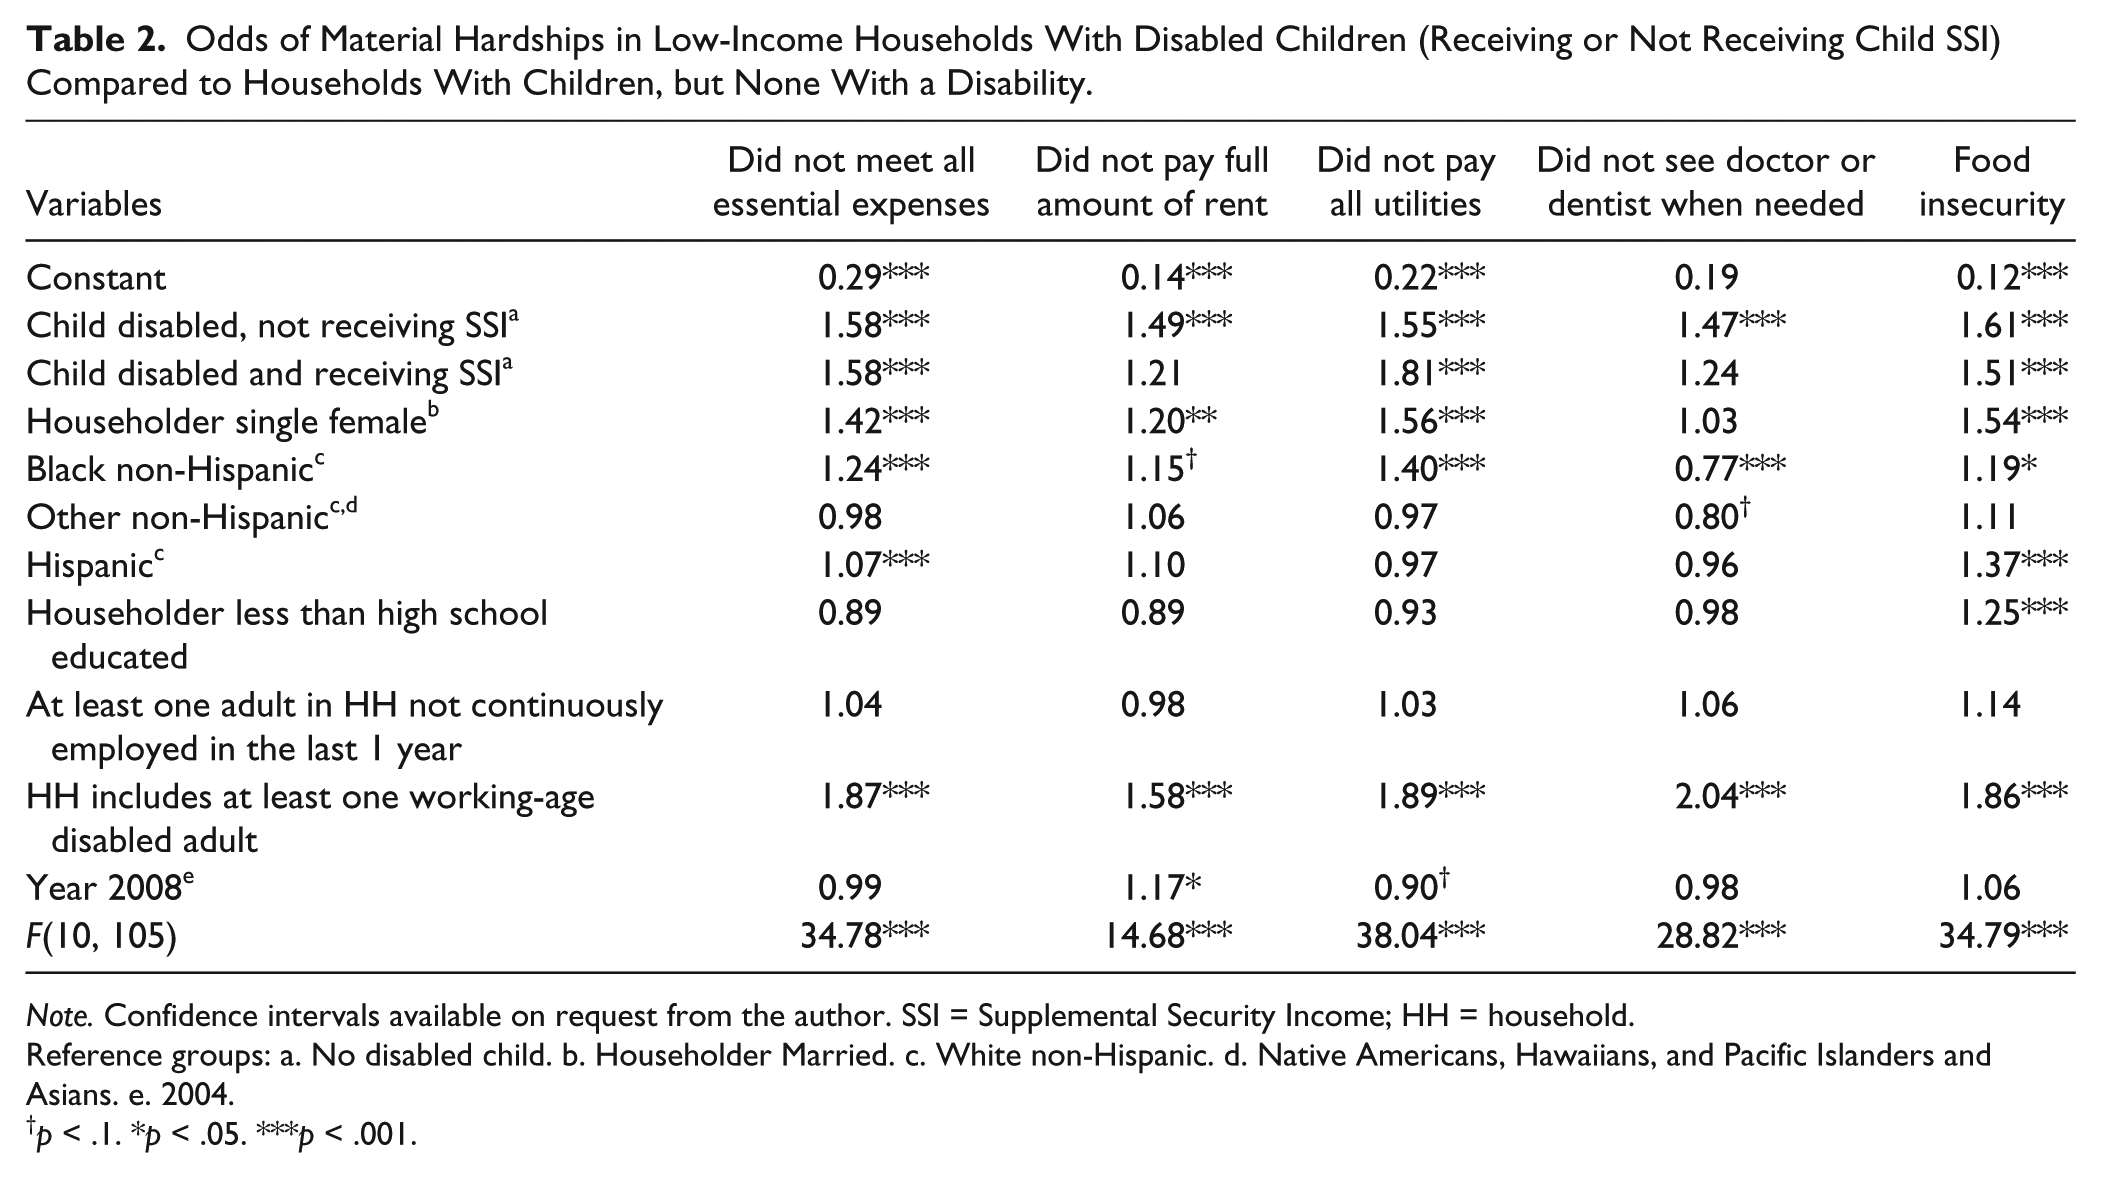
Note. Confidence intervals available on request from the author. SSI = Supplemental Security Income; HH = household.
Reference groups: a. No disabled child. b. Householder Married. c. White non-Hispanic. d. Native Americans, Hawaiians, and Pacific Islanders and Asians. e. 2004.
p < .1. *p < .05. ***p < .001.
A follow-up analysis (see Table 3) compared the situation of low-income households that included children with disabilities who did receive child SSI with those who did not receive child SSI. Differences were not statistically significant. In other words, low-income households with children with disabilities experienced similar levels of hardships irrespective of whether they did or did not receive child SSI. This finding was in contrary to our second hypothesis where we had hypothesized that low-income household with disabled children receiving child SSI would experience reduced material hardships than low-income households with disabled children and not receiving child SSI. Of the factors controlled for, compared with others, households headed by single females, individuals who were Black, and had at least one working-age adult had a disability and higher odds of not meeting regular expenses, utility needs, rent, and not seeking medical or dental care when needed.
Odds of Material Hardships in Low-Income Households With Children Receiving Child SSI Compared to Households With Disabled Children but None Receiving SSI.

Note. Confidence intervals available on request. SSI = Supplemental Security Income; HH = household.
Reference groups = a. Child disabled, no SSI. b. Householder Married. c. White non-Hispanic. d. Native Americans, Hawaiians, and Pacific Islanders and Asians. e. 2004.
p < .1. *p < .05. ***p < .001.
Discussion
To our knowledge, this article is the first to empirically assess determinants of SSI participation in low-income households with children with disabilities and to assess material hardships among households that receive child SSI. We investigated this issue by comparing SSI recipient households with low-income households with children with disabilities who did not receive SSI and with other low-income households where none of the children had a disability. In general, low-income households of children with disabilities experienced greater hardships than low-income households with non-disabled children, a finding that concurs with prior research (Parish et al., 2008). The child SSI recipient households were most likely to be headed by single females and Black people, and these households also had higher rates of working-age adults with disabilities, a finding reported in prior studies (Duggan & Kearney, 2007; Meyers et al., 1998; Rupp et al., 2005–2006). A descriptive finding of interest was relatively higher rates of participation in other non-cash assistance programs by low-income households that received child SSI compared with the other two groups of households. Low-income households that received child SSI also reported significant relatively higher rates of adult SSI receipt, which corresponds to the fact that they also have higher percentage of adults with disabilities, who may themselves be eligible for SSI. They also had higher rates of receipt of food stamps and Medicaid compared with other low-income households, which was expected, as enrollment in SSI confers immediate eligibility for Medicaid in most states. Previous research found almost half of SSI recipients receive food stamps (Trenkamp & Wiseman, 2007).
An important new contribution of the current study was the identification of specific factors within low-income households of children with disabilities that were associated with elevated SSI participation rates. Results showed household characteristics such as those headed by individuals who were single women, by Black people, by those with less than high school education, and by the presence of any adults with disabilities to be significantly associated with greater likelihood of receiving child SSI. Contrary to our expectations, having at least one working-age adult in the household who was not continuously employed was not a significant predictor (only at the trend level) of SSI receipt, nor was it associated with greater odds of material hardship. This finding could be attributed to the assumptions made in variable construction. Households that reported not having one adult continuously employed included those who went through a job loss, or who were not working anytime in the past 12 months or had intermittent employment spells. These three categories likely capture different types of economic stress on households. However, such sub-categorization was not possible as it would have reduced sample size and affected estimates. Future studies should address this limitation.
Finally, the study found similar rates of hardships in households with children with disabilities, irrespective of whether they received child SSI, after controlling for demographic characteristics. Thus, there was lack of evidence that SSI effectively prevented material hardships experienced by households with children with disabilities. Furthermore, Table 1 showed low-income households with children with disabilities, irrespective of whether they received SSI, using a range of other mean tested programs such as SNAP, Medicaid, and TANF at greater rates than the low-income households without children with disability. It might indicate an overall inability of the various welfare programs to reduce hardships in low-income households that experience additional financial burden brought on by a child’s disability.
Limitations
The study’s limitations warrant discussion. First, this is a cross-sectional study and causality cannot be inferred. Second, the material hardship questions in the SIPP have a 12-month reference period and were asked once during the entire panel. We do not have prior measures of hardships to know whether households that received SSI were doing worse prior to receipt of SSI compared with other households with disabled children. Therefore, we do not know whether receipt of SSI equivalized their hardships with levels of other low-income households with disabled children who did not receive SSI. To address this limitation, future studies with more frequent material hardship data need to be collected, and ideally, longitudinal analysis would be used. Third, although severity of a child’s disability is an important criterion for participation in SSI, it could not be conclusively ascertained with the SIPP. Fourth, the child SSI variable did not specifically ask which child received SSI. The number of children with disabilities in a household ranged between 1 and 6. In the absence of data on condition severity, it is possible that the 609 households that received child SSI included children with very severe and chronic conditions, and that their condition is expected to last more than 12 months to qualify for SSI receipt. Fifth, we could not control for total household assets, as it is an important determinant of SSI qualification. Furthermore, not all types of assets are included in the calculation of SSI amount because asset and material hardship questions were not asked in the same waves of the SIPP. Further studies should assess asset deprivation among SSI recipient households by comparing them with similar low-income households with children with disabilities, to understand whether difference in assets is one of the contributing factors why some low-income households with children with disabilities do not participate or qualify for child SSI. Sixth, there could be a potential endogeneity between SSI receipt and material hardship. Households that received SSI reported high rates of material hardships. However, it may be that these households’ experiences of material hardships induce them to seek SSI for their children. Future studies should explore this further. Next, this study could not explore the situation of institutionalized children with disabilities, because such children are excluded from the SIPP. Finally, a key limitation is selection bias. There may be unmeasured but important differences between households that received SSI and eligible households that did not receive SSI.
Despite these limitations, the SIPP offered important advantages. First, it is a nationally representative study of the U.S. civilian population, designed specifically to assess participation in programs such as the SSI. Second, the SIPP over-sampled low-income households (U.S. Census Bureau, 2001). Third, the SIPP is the only national survey that measured indicators of material hardship and also reliably distinguished between child and adult SSI recipient households (Duggan & Kearney, 2007). Finally, because SIPP is a longitudinal study, we could use the longitudinal nature of the data to control for variability in employment patterns among low-income working-age households. This approach permitted us to disentangle the impact of job instability and child disability status on household material hardships.
The study findings have potentially important policy implications. The SSI program is meant to help parents meet the basic needs of their children with disabilities. Yet these results suggest a majority of the child recipients live in households that have significant difficulty meeting expenses, paying for utilities and/or rent, and obtaining medical or dental care. The study in fact did not find evidence that SSI buffers families from material hardship. This in turn suggests the SSI payment level is inadequate and does not permit families to maintain a decent standard of living. High rates of material hardship signal potentially high costs to public health and social welfare systems. Vulnerable children with disabilities who forego basic necessities may acquire co-morbid conditions, may perform poorly in academics, are unable to develop social competency, and are less likely to become self-supporting members of the society.
The study found a high incidence of households where in addition to a child with a disability, at least one working-age adult in the household also had disabilities. The presence of a working-age adult with a disability was associated with an increased likelihood of material hardship. Having an adult with a disability could be an added burden for low-income households. It is known that disability in working-age adults limits their employability and they are more likely to live in poverty (Houtenville, Stapleton, Weathers, & Burkhauser, 2009). Our findings indicate that when both a child and an adult have disabilities, households struggle to meet their basic needs. Emerging research shows that households with multiple disabled members experience significantly greater financial strain and material hardships irrespective of the household income poverty level (Ghosh & Parish, 2013). Children are not independent entities but are dependent on their parents for care. Therefore, if children are to be adequately cared for in their community, their households should be adequately protected, so as to reduce costly institutionalization and prevent long-term welfare dependence. SSI currently takes into consideration only age, income, assets, and disability of the child to determine eligibility, and does not account for the number of household members with disabilities. The findings therefore call into question the uniformity of eligibility criteria that are not likely to be appropriate to adequately compensate households for extra burden of care, so that they are able to maintain an adequate standard of living. Policymakers interested in providing adequate support to this highly vulnerable population should reframe program eligibility and benefit levels to address the population’s needs.
Conclusion
The study compares child SSI recipient households with low-income households with disabled children who do not receive child SSI and other low-income households with children, but none with disabilities on rates of material hardships. It also provided evidence of the high rates of material hardship among households with children with disabilities in general and found no evidence that receipt of SSI was associated with reduced material hardship. The study also offers compelling evidence that the amount of cash assistance provided by the child SSI program is perhaps not adequate; families that receive SSI are often unable to meet their basic needs.
Footnotes
Declaration of Conflicting Interests
The author(s) declared no potential conflicts of interest with respect to the research, authorship, and/or publication of this article.
Funding
The author(s) received no financial support for the research, authorship, and/or publication of this article.