




Abstract
Focused on 3,305 students who self-reported frequent bullying victimization, this study compared the use and effectiveness of responses to address bullying victimization among students in special education, as compared with students in general education. Students in special education were less likely to make a joke, but more likely to tell the aggressor how they felt, hit the aggressor, and tell an adult at school and home, according to self-report. Furthermore, students in special education were significantly more likely to report that “things got worse” after using each response. Implications for educational policy and future research are discussed.
Correction notice for ‘Responding to Bullying Victimization: Comparative Analysis of Victimized Students in General and Special Education’ by Michael T. Hartley, Sheri Bauman, Charisse L. Nixon, and Stan Davis, published in the Journal of Disability Policy Studies, 2017, Vol. 28(2) 77–89, DOI 10.1177/1044207317710700
This article reviews data from the Youth Voice Project national study of U.S. students in Grades 5 through 12 (Davis & Nixon, youthviolenceproject.com). The authors also referred to data from the Youth Voice Project in their article titled ‘Comparative Study of Bullying Victimization Among Students in General and Special Education’ by Hartley, Bauman, Nixon, and Davis, published in Exceptional Children, 2015, Vol. 81(2) 176–193, DOI: 10.1177/0014402914551741 (the “2015 Article”), which examined victimization of special education students and general education students by bullies. Accordingly, this article includes similar themes, scholarship, and methods as their 2015 Article. Several sections of the Article reproduce unattributed excerpts that were originally published in the 2015 Article, including portions of Table 1 and text in the sections with headings Introduction, Method, Results, and Limitations, particularly as the sections pertain to the demographic data reported and analyzed. Notwithstanding these similarities, the data analysis in this article differs from the analysis in the 2015 Article. Whereas the 2015 Article examines victimization variables, this article reports specific data about how students address bullying victimization.
Peer aggression and victimization by bullying are persistent problems for students receiving special education services for their disabilities (Blake et al., 2014; Rose, Monda-Amaya, & Espelage, 2011). Historically, societies tended to segregate and isolate individuals with disabilities. In the United States, for instance, students with disabilities were traditionally educated in disability-specific schools and special education classrooms rather than with siblings and neighbors (Yell, Rogers, & Lodge-Rogers, 1998). Separate schools and classrooms were viewed as an acceptable environment for the education of students with disabilities until the 1970’s disability rights movement (Longmore & Umansky, 2001). Today, inclusive education has been the main policy initiative since the Individuals With Disabilities Education Act (IDEA; formerly the Education of All Handicapped Children Act) became law in 1975 (Yell et al., 1998).
When possible, IDEA mandates that students with disabilities be educated in the least restrictive environment with all other students in age-appropriate, general education classrooms (Yell et al., 1998). In addition to improving academic achievement (Salend & Duhaney, 1999), inclusive education has reduced negative stereotypes and increased participation of people with disabilities in society (Ruijs & Peetsma, 2009); however, if students receiving special education are not fully integrated into peer groups, “inclusive education may maintain or exacerbate victimization” by bullying (Rose et al., 2011, p. 123). Importantly, victimization by bullying affects the social and academic integration of students in special education.
Research has found that victimized students are more likely to have school-related problems including absenteeism and dropping out (Reschly & Christenson, 2006). Furthermore, students who experience bullying are at risk to have physical health and emotional problems (Nixon, Linkie, Coleman, & Fitch, 2011). Numerous studies have shown that children who are frequent targets of bullying are at risk of a variety of adjustment problems, including childhood depression, loneliness, anxiety, peer rejection, and low self-esteem (Hawker & Boulton, 2000). In fact, research has shown that chronic victimization increases the risk of suicide, though most youth who have been bullied do not commit suicide (Hinduja & Patchin, 2010). Garnering national attention with bullying a public health problem, research on bullying integrates education with emerging research in children’s mental health services (Arseneault, Bowes, & Shakoor, 2010).
Today, 95% of students who participate in special instruction for their disability are educated in regular education classrooms with two thirds spending more than 80% of the day with nondisabled peers; more than three quarters of these students have high-incidence disabilities, such as learning disabilities, intellectual disabilities, emotional disabilities, and speech-language impairments (U.S. Department of Education, 2014). Researchers have found that students in special education are twice as likely to be the target of bullying as their nondisabled peers (Carter & Spencer, 2006; Van Cleave & Davis, 2006). Indeed, Rose et al. (2011) concluded that more than 50% of students in special education are bullied compared with 20% to 30% of students in general education. McNamara (2013) noted that victimization rates for students with autism are as high as 80%.
While unfortunate and problematic, it is perhaps not surprising that disability is associated with more bullying. At its core, bullying is a form of aggression predicated on an imbalance of power, whereby an individual with more power targets an individual considered intellectually, socially, or physically weaker (Davis & Nixon, 2014). Youth who bully tend to target the least popular students because there is less chance of retaliation, and students with disabilities have the highest rates of rejection and unpopularity among peers (Nabuzoka, 2003). Thus, students with disabilities may be more vulnerable to emotional harm due to having fewer friends and lower self-esteem (Mishna, 2003). Furthermore, once victimized, low social and communication skills may make it challenging to respond in ways that stop the bullying (McLaughlin, Byers, & Vaughn, 2010). In a study of 3,305 students who reported frequent victimization, Hartley, Bauman, Nixon, and Davis (2015) found that students in special education reported significantly higher levels of psychological distress: 17.5% of students in special education compared with 5.3% of students in general education reported the most severe distress to the point of feeling unsafe. Rose et al. (2011) speculated that, due to more frequent and severe victimization, students in special education may be more likely to retaliate to protect themselves, becoming bullies themselves.
Policies to Address Bullying Victimization
Educational policies and practices addressing bullying prevention and response programming for students in special education are limited. Although many schools have implemented universal bullying prevention and response programming, most are not designed to meet the needs of students in special education (Sutherland, Sutherland, Farrell, & Taylor, 2015). Furthermore, the most rigorous meta-analysis (Ttfoi & Farrington, 2011) found that universal programming, on average, decreases bullying perpetration by 20% to 23% and victimization by 17% to 20%; however, none of the meta-analyses examined special education students as a subgroup.
Emerging research suggests that social-emotional learning (SEL) programs promoting emotional self-regulation, communication, and interpersonal problem solving may reduce bullying victimization among students receiving special education (Durlak, Weissberg, Dymnicki, Taylor, & Schellinger, 2011; Espelage, Rose, & Polanin, 2015). However, there continues to be a need for special education policy reform to address school-based behavior and academics (Reddy, Newman, De Thomas, & Chun, 2009). In many ways, students in special education may be uniquely vulnerable to being targeted for bullying because they are less powerful, less able to defend themselves when attacked, may have less sophisticated social skills that lead them to misinterpret social cues, and employ responses that are ineffective. To improve the effectiveness of SEL programs, there is a need to better understand the current use and effectiveness of responses to address bullying victimization among students in special education.
Much of the prior research on responses to address bullying victimization has used categorizations initially proposed by Causey and Dubow (1992): support seeking, self-reliance, problem solving, distancing, internalizing, and externalizing. Relatedly, other studies have used the categories of passive, aggressive, and assertive (Sharp, 1995). According to the transactional model, responses are based on the complex person–environment interaction (Lazarus & Folkman, 1984). Hence, responses are situation-specific appraisals of whether or not the “student feels they can stop a peer from being aggressive toward them” (Hunter & Boyle, 2004, p. 84). For instance, while assertiveness and seeking support are considered to be the most effective responses, avoidance is the most common response (Hunter & Boyle, 2004). Over two decades of research have shown that students use a variety of responses, often varying by individual factors (e.g., gender) as well as contextual factors (e.g., type of bullying; Craig, Pepler, & Blais, 2007; Kochenderfer-Ladd & Skinner, 2004; Kristensen & Smith, 2003; Shelley & Craig, 2010).
Factors related to successful responses for students in special education are likely to be similar to those of their nondisabled peers; however, it may be noteworthy that students in special education are overrepresented by boys who have been physically bullied (Hartley et al., 2015). Researchers have found that boys and girls do not respond the same way to bullying: Girls are more likely to use assertiveness and seek social support, whereas boys are more likely to use aggression and humor (Craig et al., 2007; Shelley & Craig, 2010). In addition, Kochenderfer-Ladd and Skinner (2004) found that seeking social support served as a protective factor for girls, but not for boys. In addition, researchers have found that response to address bullying typically vary by type of bullying: Students who are physically bullied are more likely to respond with support seeking and aggression, although aggression often escalates the victimization (Kochenderfer-Ladd and Skinner, 2004; Kristensen & Smith, 2003). Despite a growing body of research on responses to address bullying, research examining students in special education is limited.
In line with inclusive education, research on bullying is an avenue for understanding the social integration of students with disabilities in special education with students in general education. The present study compared responses with bullying victimization between students in general and special education, all of whom reported frequent victimization, defined by Olweus (1993, 1997) as 2 to 3 times per month or more. The research questions were as follows:
Method
As part of the Youth Voice Project (Davis & Nixon, 2014), data were collected on a national sample of United States students in Grades 5 to 12. Designed as a partnership with schools to reduce bullying and the negative outcomes of bullying, the goal of the project was to survey the entire population of participating schools and provide data that each school could use to improve the effectiveness of prevention and intervention efforts (Davis & Nixon, 2014). Data from all schools were used in the present study to examine responses to victimization.
Participants and Procedure
Data were collected from 31 public schools in 12 states during the 2009–2010 academic year (Davis & Nixon, 2014). Cooperating schools represented a stratified convenience sample of schools in the Northeast, Midwest, South, and West. Of the 31 schools, 28 were public and three were private, varying in size from 100 to 3,247 students, with a mean enrollment of 740 students (SD = 667). Almost all of the students (94.6%) in the schools completed the online questionnaire. A total of 13,177 completed the questionnaire, and 3,305 (25.0%) reported frequent peer victimization of 2 times a month or more. Of the frequently bullied students, 361 (10.9%) received services in special education, a higher proportion than in the population (8.4%; U.S. Department of Education, 2014). In the present study, special education status was measured by asking participants to respond to the prompt “do you receive any help from special education”; information on type or severity of impairment and academic accommodations was not collected.
All students who participated in the study completed an extensive survey as part of the Youth Voice Project, as described by Davis and Nixon (2014) in Students Voice Project. Building upon the work of Olweus (1993, 1997), Davis and Nixon designed the survey to measure the prevalence of victimization as well as the ways in which youth responded to victimization after obtaining input from students via online focus groups. To ensure that the survey was administered in the same way across schools, the survey was delivered in a web-based form (Granello & Wheaton, 2004). Students who participated in the study completed the web-based survey at school, and a disclaimer was used to gain informed consent.
Variables
Due to the difficulty of obtaining external validation of victimization experiences, self-report was used. Self-report has the advantage of “including events that might not be observed by others,” and even flawed perceptions are important (Bauman, 2008b, p. 100). In optimal conditions, external validation of self-report adds information (Cornell & Brockenbrough, 2004); however, it is hard to include external validation in online surveys of geographically diverse samples, such as the one in this study (Crick & Bigbee, 1998). Consistent with past research, the single items used in this study asked students about specific bullying events, but did not include definitions of bullying, so each student responded according to his or her personal perception (Ross, 2003). Although some experts might see the absence of a definition of bullying as a limitation, others have argued that the assumption that a clear definition is necessary “has little empirically established basis” (Ross, 2003, p. 25).
Demographics
A self-report questionnaire requested the following demographic information: (a) age, (b) grade level, (c) gender, (d) racial/ethnic cultural background, (e) received special education services, (f) reduced or free hot lunches at school, and (g) parents who immigrated to the United States within the past 2 years.
Frequency of victimization
Frequency of victimization was assessed by two parallel questions asking students to report the frequency with which they were hurt physically and emotionally. The first question asked “In the last month, how often have students at your school hurt you emotionally or excluded you?” and the second question asked “In the last month, how often have students at your school threatened to hurt you or hurt you physically?” Response options were coded from 0 to 4 as “never,” “1 time,” “2/3 times per month,” “weekly,” and “daily” (Davis & Nixon, 2014). Students were included in the present study if they reported emotional or physical harm 2 times or more in the last month (Olweus, 1993, 1997).
Responses to address victimization
Participants were asked to read a list of strategies that some people use to respond to bullying and then indicate whether or not they used these strategies in response to being bullied in the last 30 days. Because there is no gold standard with respect to assessment instruments, the following responses were derived from the content of online focus groups as part of the Students Voice Project (Davis & Nixon, 2014): (a) “pretended that it did not bother me,” (b) “walked away,” (c) “reminded myself that what they are doing is not my fault,” (d) “told a friend,” (e) “told adult at school,” (f) “told an adult at home,” (g) “told the aggressor to stop,” (h) “made a joke,” (i) “told the aggressor how I felt; (j) “made plans to get back at the aggressor,” and (k) “hit or fought the aggressor.” When a particular response was used, participants were asked to report if “things got worse,” “nothing changed,” or “things got better.”
Data Analysis
Using SPSS v. 21.0, the groups were compared on demographic characteristics using t tests for continuous variables and chi-square tests for categorical variables (Fienberg, 2007). Due to the non-normal distribution of dependent variables, chi-square tests of independence were used to test for differences in the response outcomes (Sulkowski, Bauman, Dinner, Nixon, & Davis, 2013). Cramer’s V effect sizes were calculated to illustrate the magnitude of the difference. Logit modeling, a multivariate statistical procedure appropriate for binary dichotomous dependent variables (Fienberg, 2007), was used to examine the use and outcome of responses across multiple categorical independent variables, such as special education, gender, and physical bullying. Using backward elimination, interactions between the independent variables and the dependent variables were tested, nonsignificant interactions were removed, and the most parsimonious and best fitting models were reported. Whenever a difference was found, separate chi-square tests were performed to break down the effects. A focused comparison of the odds ratio was used to measure effect size. An a priori power analysis was conducted to ensure that the expected frequency of each cell was five or more. An alpha level of .05 was set for all analyses.
Results
Demographics
The groups were compared on demographics (see Table 1). Overall, students in general and special education were similar in age, F(1, 3179) = 1.62, p = .203; however, there were differences by grade, χ2(2, 3220) = 34.54, p < .001. Although statistical differences were found by grade, the difference between one group consisting of 1,615 (56.5%) middle school children and the other consisting of 195 (54.2%) middle school children should not confound the results because both groups were overly represented by middle school children, where the highest rate of victimization occurs (Nansel et al., 2001). Consistent with U.S. Department of Education (2011) statistics, students in special education were a higher percentage of recent immigrants, χ2(1, N = 3,202) = 242.19, p < .001; eligible for free lunch, χ2(1, N = 3,167) = 63.81, p < .001; ethnic minorities, χ2(1, N = 3,203) = 10.16, p < .001; and male, χ2(1, N = 3,120) = 16.08, p < .001. Students in special education reported higher rates of physical bullying, χ2(1, N = 3,235) = 7.40, p = .007.
Demographic Information.
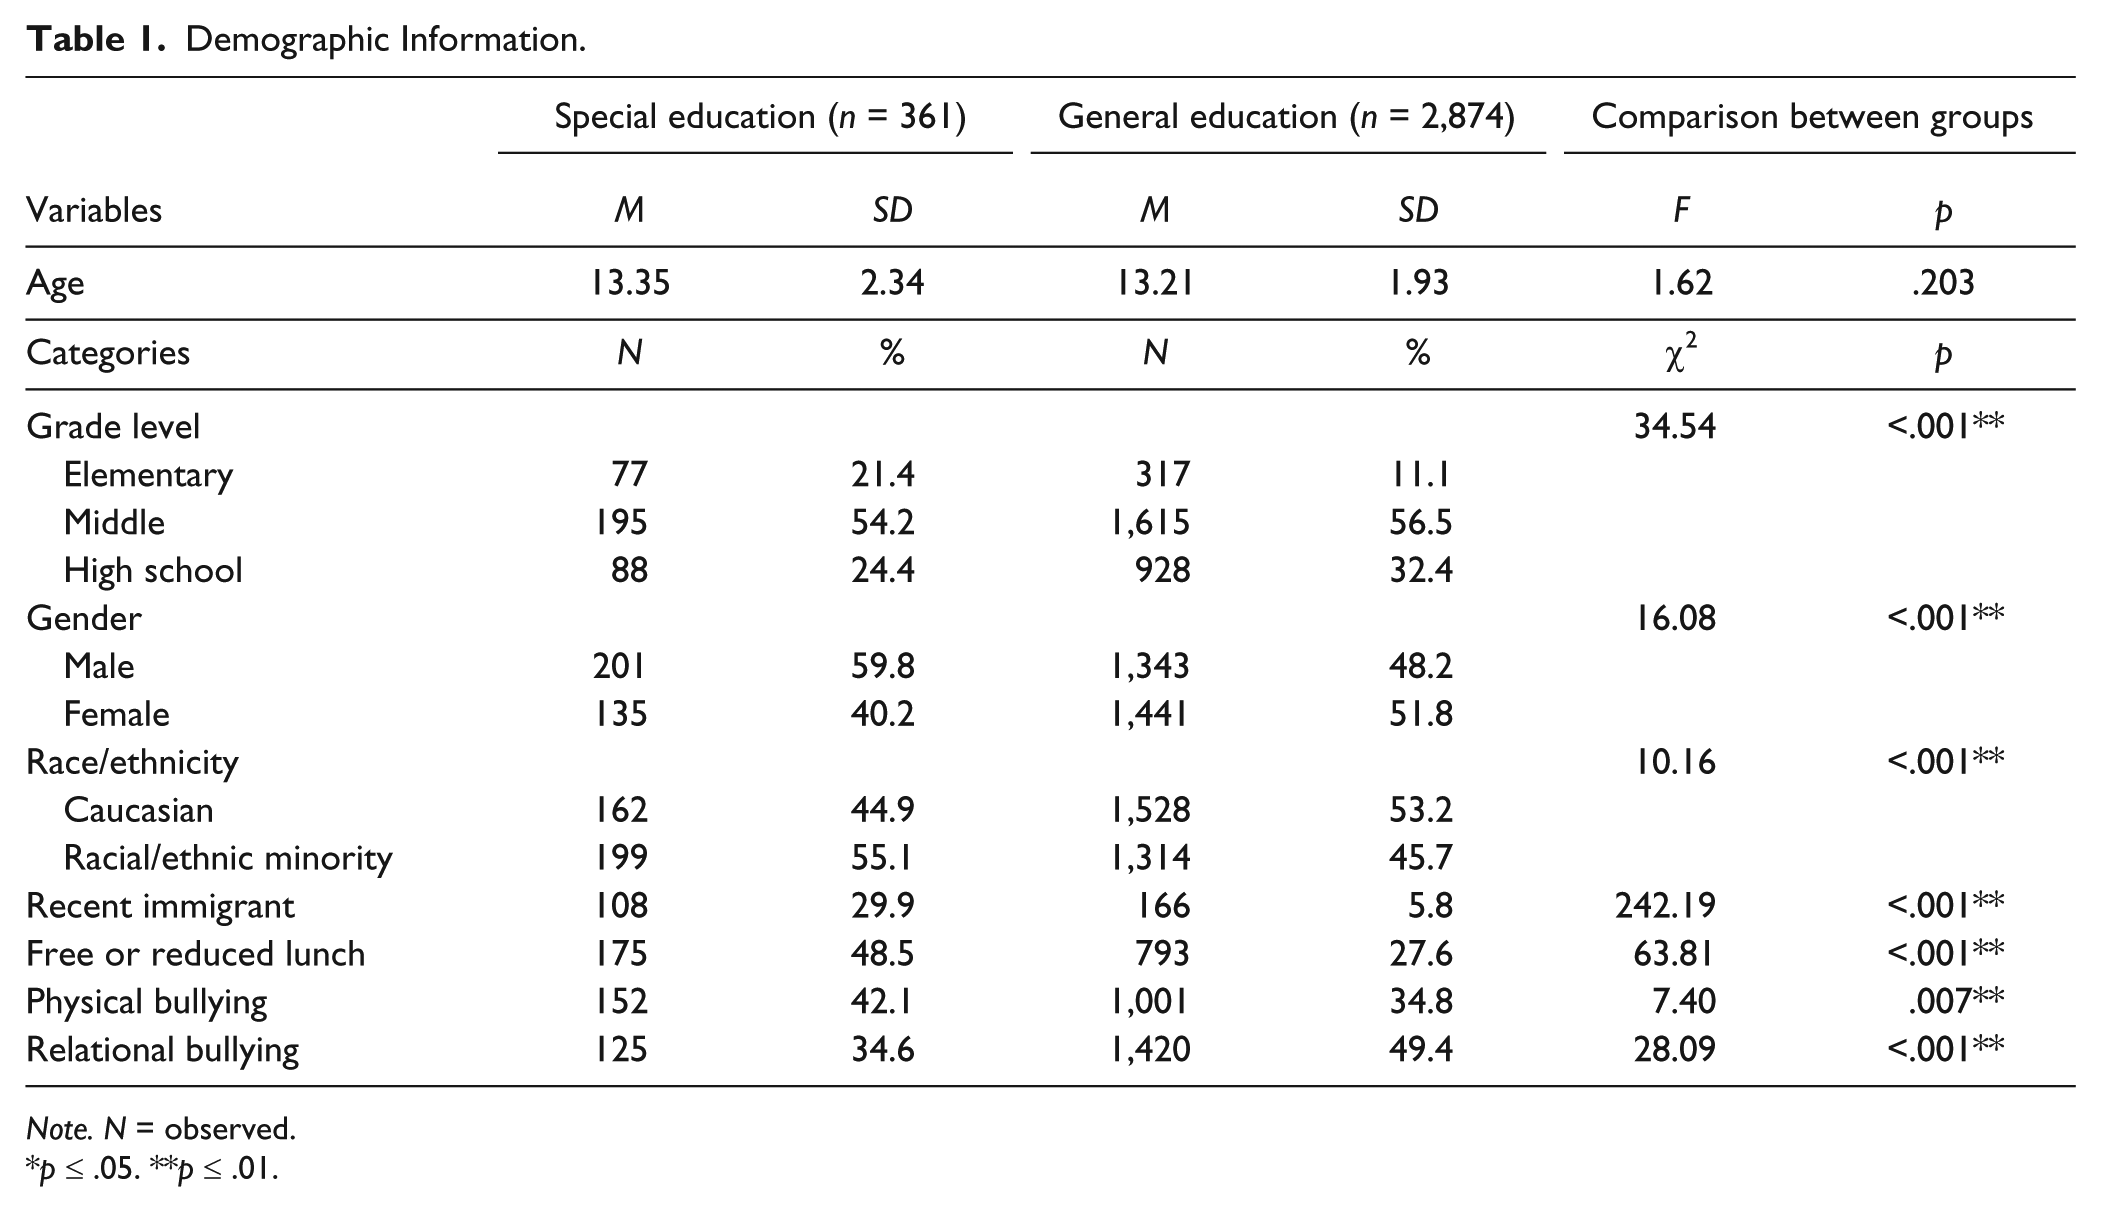
Note. N = observed.
p ≤ .05. **p ≤ .01.
Responses to Address Bullying Victimization
A comparison of the average number of responses used by each individual student within the last month revealed no statistically significant group difference, t(3,233) = 1.87, p = .061, between students in general education (M = 4.49, SD = 2.83) and in special education (M = 4.18, SD = 3.44). Both groups used an average of four different responses to peer mistreatment in the last 30 days; however, it was not possible to determine if multiple responses to bullying victimization were used to address a single bullying incident or if the responses were used more than once in the last month. Each response was therefore examined independently in terms of use (see Table 2). Overall, students in special education were less likely to make a joke, but more likely to tell the aggressor how they felt, hit the aggressor, and tell an adult at school and home.
Differences Between Youth in General and Special Education in How They Respond to Being Victimized by Bullying.

Note. V = Cramer’s V measure of effect size.
p ≤ .05. **p ≤ .01.
When a particular response was used, students were then asked to report what happened afterward (i.e., outcome): “things got worse,” “nothing changed,” or “things got better” (see Table 2). Across the responses, there was no statistically significant difference in the outcome “things got better” between students in general and special education; however, students in special education were more likely to report that “things got worse.” To account for group differences in gender and type of bullying, logit modeling examined the probability of the use of each particular response as well as the outcome “things got worse” (Fienberg, 2007). Based on previous research (Causey & Dubow, 1992; Sharp, 1995), particular responses were examined individually, but categorized as avoidance, support seeking, assertiveness, or aggression.
Avoidance
As a strategy to manage one’s own cognitions, emotions, and behaviors, avoidance responses involve changing one’s own reaction rather than confronting the aggressor. As a category, the avoidance responses included the following: “pretended that it did not bother me,” “walked away,” and “reminded myself that what they are doing is not my fault.”
Pretended it did not bother me
As the most common response in the entire sample, 2,090 (73.9%) participants “pretended it did not bother me,” and the logit model, χ2(6, N = 2,675) = 9.42, p = .052, retained gender only. Girls were 1.41 and 1.96 times more likely than boys to use the response in general, χ2(1, N = 2,415) = 13.23, p < .001, and in special education, χ2(1, N = 260) = 5.21, p = .024, respectively. As for what happened afterward, the reduced model, χ2(19, N = 191) = 9.19, p = .393, retained special education and physical bullying. Of those who used the response, students in special education were 2.25 times more likely to report “things got worse,” χ2(1, N = 2,050) = 27.07, p < .001. Furthermore, students who had been physically bullied were 1.65 times and 2.08 times more likely than those not physically bullied to report “things got worse” in general, χ2(1, N = 1,855) = 18.60, p < .001, and in special education, χ2(1, N = 195) = 5.90, p = .018, respectively.
Walked away
A total of 1,800 (66.2%) participants “walked away,” and the logit model, χ2(4, N = 2,577) = 9.64, p = .052, retained gender only. Girls were 1.35 times more likely than boys to use the response in general, χ2(1, N = 2,328) = 11.43, p < .001, but there was no gender effect in special education, χ2(1, N = 249) = 0.23, p = .683. As for what happened afterward, the reduced logit model, χ2(5, N = 1,713) = 7.97, p = .158, retained special education and physical bullying. Of those who used the response, students in special education were 2.12 times more likely to report “things got worse” χ2(1, N = 1,794) = 15.25, p < .000. Furthermore, students who had been physically bullied were 1.88 and 2.00 times more likely than those not physically bullied to report “things got worse” in general, χ2(1, N = 1,589) = 27.95, p < .001, and in special education, χ2(1, N = 172) = 4.90, p = .030.
Reminded myself it is not my fault
A total of 1,599 (58.3%) participants “reminded myself it is not my fault,” and the logit model, χ2(1, N = 2,594) = 5.65, p = .464, retained gender. Girls were 1.32 times more likely than boys to use the response in general, χ2(1, N = 2,340) = 11.00, p < .001, but there was no effect in special education, χ2(1, N = 254) = 0.13, p = .797. As for what happened afterward, the logit model, χ2(5, N = 1,517) = 7.80, p = .168, retained special education and physical bullying. Of those who used the response, students in special education were 2.81 times more likely to report “things got worse,” χ2(1, N = 1,761) = 33.03, p < .001. Furthermore, students who were physically bullied were 1.63 times more likely than those not physically bullied to report “things got worse” in general, χ2(1, N = 1,414) = 10.95, p < .001, but there was no effect by physical bullying among students in special education, χ2(1, N = 153) = 0.72, p = .495.
Support seeking
As a strategy to reach out to others for support and assistance, support-seeking responses involve telling another person about the situation. The support-seeking responses included “told a friend,” “told adult at school,” and “told an adult at home.”
Told a friend
A total of 1,832 (67.5%) participants “told a friend,” and the logit model, χ2(6, N = 2,572) = 12.25, p = .057, retained gender only. Girls were 2.31 times more likely than boys to use the response in general, χ2(1, N = 2,327) = 84.76, p < .001, but there was no gender effect in special education, χ2(1, N = 245) = 0.64, p = .503. As for what happened afterward, the logit model, χ2(5, N = 1,744) = 9.34, p = .096, retained special education and physical bullying. Of those who used the response, students in special education were 2.12 times more likely to report “things got worse,” χ2(1, N = 1,794) = 15.25, p < .000. Furthermore, students who had been physically bullied were 1.87 times more likely than those not physically bullied to report “things got worse” in general, χ2(1, N = 1,637) = 17.00, p < .001, but there was no effect in special education, χ2(1, N = 157) = 2.86, p = .102.
Told an adult at home
A total of 1,314 (48.4%) participants “told an adult at home,” and the logit model, χ2(4, N = 2,570) = 8.97, p = .062, retained all of the variables. Compared with general education, students in special education were 1.43 times more likely to use the response, χ2(1, N = 2,661) = 7.42, p = .007. As for gender, girls were 1.67 times more likely than boys to use the response in general, χ2(1, N = 2,322) = 37.14, p < .001, but there was no gender effect in special education, χ2(1, N = 248) = 0.05, p = .896. In addition, students who had been physically bullied were 1.37 times more likely than those not physically bullied to use the response in general, χ2(1, N = 2,396) = 13.99, p < .001, but there was no effect in special education, χ2(1, N = 265) = 1.96, p = .195. As for what happened afterward, the logit model, χ2(6, N = 1,246) = 3.50 p = .744, retained physical bullying. Of those who used the response, students who had been physically bullied were 2.10 times and 2.64 times more likely than those not physically bullied to report “things got worse” in general, χ2(1, N = 1,136) = 19.74, p < .001, and in special education, χ2(1, N = 149) = 5.04, p = .028.
Told an adult at school
A total of 862 (32.0%) participants “told an adult at school,” and the logit model, χ2(5, N = 2,575) = 0.73, p = .982, retained special education and physical bullying. Compared with general education, students in special education were 2.47 times more likely to use the response, χ2(1, N = 2,665) = 50.00, p < .001. In addition, students who had been physically bullied were 1.81 times and 1.67 times more likely than those not physically bullied to use the response in general, χ2(1, N = 2,376) = 43.08, p < .001, and in special education, χ2(1, N = 264) = 4.36, p = .049, respectively. As for what happened afterward, the logit model, χ2(5, N = 812) = 4.47, p = .484, retained special education and physical bullying. Of those who used the response, students in special education were 2.14 times more likely to report “things got worse,” χ2(1, N = 1,842) = 15.40, p < .001. Furthermore, students who were physically bullied were 1.77 times more likely than those not physically bullied to report “things got worse” in general, χ2(1, N = 707) = 10.15, p < .001, but there was no effect by physical bullying in special education, χ2(1, N = 135) = 2.22, p = .158.
Assertiveness
Without provoking or submitting to the bully, assertiveness responses involve an attempt to redirect the aggressor. The assertive responses included “told the aggressor to stop,” “made a joke,” and “told the aggressor how I felt.”
Told the aggressor to stop
A total of 1,817 (66.3%) participants “told the person to stop,” and the logit model, χ2(6, N = 2,598) = 3.23, p = .779, retained physical bullying. Students who were physically bullied were 1.39 times more likely than those not physically bullied to use the response in general, χ2(1, N = 2,417) = 13.18, p < .001, but there was no effect in special education, χ2(1, N = 268) = 0.05, p = .897. As for what happened afterward, the logit model, χ2(6, N = 1,719) = 10.90, p = .09, retained physical bullying. Overall, students who had been physically bullied were 1.27 and 2.19 times more likely than those not physically bullied to report that “things got worse” in general, χ2(1, N = 1,599) = 26.21, p < .001, and special education, χ2(1, N = 179) = 6.47, p = .015, respectively.
Made a joke
A total of 1,129 (41.6%) participants “made a joke,” and the logit model, χ2(5, N = 2,577) = 7.06, p = .217, retained special education and gender. Students in special education were 0.67 times less likely to use the response than students in general, χ2(1, N = 1,002) = 8.38, p = .004. Boys were 1.47 times more likely than girls make a joke in general, χ2(1, N = 2,320) = 21.62, p < .001, but there was no effect in special education, χ2(1, N = 250) = 0.01, p = .956. As for what happened afterward, the logit model, χ2(5, N = 1,065) = 3.16, p = .675, retained special education and physical bullying. Overall, students in special education were 2.81 times more likely to report “things got worse,” χ2(1, N = 1,002) = 5.78, p = .019. Furthermore, students who had been physically bullied were 1.94 times more likely than those not physically bullied to report “things got worse” in general, χ2(1, N = 1,018) = 14.74, p < .001, but there was no effect in special education, χ2(1, N = 89) = 1.08, p = .354.
Told the aggressor how I felt
A total of 1,026 (37.3%) participants “told the person how I felt,” and the logit model, χ2(5, N = 2,577) = 7.06, p = .217, retained special education and gender. Students in special education were 1.40 times more likely than students in general to “tell the person how they felt,” χ2(1, N = 2,577) = 5.64, p = .018. Girls were 1.67 times more likely than boys to use the response in general, χ2(1, N = 2,329) = 15.08, p < .001, but there was no effect in special education, χ2(1, N = 248) = 0.50, p = .517. As for what happened afterward, the logit model, χ2(4, N = 1,246) = 9.92, p = .052, retained all of the variables. Of those who used the response, students in special education were 2.81 times more likely to report “things got worse,” χ2(1, N = 1,002) = 5.78, p = .019. There was no gender effect in the general education, χ2(1, N = 855) = 2.02, p = .174, but boys were 1.20 times more likely than girls to report “things got worse” in special education, χ2(1, N = 109) = 6.29, p = .018. Finally, students who had been physically bullied were 1.95 times more likely than those not physically bullied to report “things got worse” in general, χ2(1, N = 855) = 20.54, p < .001, but there was no effect in special education, χ2(1, N = 117) = 1.07, p = .348.
Aggression
As a form of retribution, aggressive responses involve hostile, injurious, or destructive behavior toward the aggressor. The aggressive responses included “made plans to get back at the aggressor” and “hit or fought the aggressor.”
Made plans to get back
A total of 738 (26.7%) participants “made plans to get back,” and the logit model, χ2(4, N = 2,575) = 7.676, p = .104, retained gender and physical bullying. Boys were 1.98 times more likely than girls to use the response in general, χ2(1, N = 2,362) = 51.64, p < .001, there was no gender effect in special education, χ2(1, N = 257) = 2.84, p = .103. Furthermore, students who had been physically bullied were 2.41 times and 1.94 times more likely to use the response than those not physically bullied in general, χ2(1, N = 2,436) = 89.04, p < .001, and in special education, χ2(1, N = 274) = 6.55, p = .015. As for what happened afterward, the logit model, χ2(5, N = 812) = 4.47, p = .484, retained physical bullying. Overall, students who were physically bullied were 1.77 times more likely than those not physically bullied to report “things got worse” in general, χ2(1, N = 707) = 10.15, p < .001, but there was no effect in special education, χ2(1, N = 135) = 2.22, p = .158.
“Hit or fought the aggressor.”
A total of 525 (19.3%) participants “hit or fought the aggressor,” and the logit model, χ2(4, N = 2,575) = 7.676, p = .104, retained all of the variables. Compared with those in general education, students in special education were 1.76 times more likely to “hit [the aggressor],” χ2(1, N = 2,664) = 15.10, p < .001. Boys were 3.16 times and 2.35 times more likely than girls to “hit the aggressor” in general, χ2(1, N = 2,326) = 97.86, p < .001, and in special education, χ2(1, N = 249) = 6.80, p = .012, respectively. Furthermore, students who had been physically bullied were 2.74 times and 3.02 times more likely than those not physically bullied to “hit [the aggressor]” in general, χ2(1, N = 2,401) = 89.92, p < .001, and in special education, χ2(1, N = 263) = 15.04, p < .001, respectively. As for what happened afterward, the logit model, χ2(7, N = 474) = 11.38, p = .123, retained none of the variables. Thus, there was no difference in the outcome “things got worse” across special education, gender, and physical bullying.
Discussion
Focused on 3,305 students who self-reported victimization of 2 times a month or more, this study compared the use and effectiveness of four empirically validated categories of responses to address bullying among students in special education, as compared with students in general education: avoidance, support seeking, assertiveness, and aggression (Causey & Dubow, 1992; Sharp, 1995). Overall, there were significant differences across all three research questions: First, students in special education were less likely to use humor, but more likely to tell the aggressor how they felt, hit the aggressor, and tell an adult at school and home, according to self-report. Second, based on the percentage of students who found a particular response helpful in comparison with the total percentage that used the response, students in special education were more likely to report that “things got worse.” Third, the effects by gender and physical bullying differed between the two groups. Discussion of the results is explored in the following sections.
Avoidance Responses
Based on student self-report, the results of the present study add evidence that avoidance is the most common response to address peer aggression (Hunter & Boyle, 2004). Approximately three quarters of the victim sample used each of the three avoidance responses: “pretended it didn’t bother me,” “walked away,” and “reminded myself it was not my fault” with no significant group difference between students in general and special education. Similar to the use of denial following trauma, avoidance may be a defense mechanism to insulate students from the negative feelings associated with trauma (Craig et al., 2007). According to the transactional theory, avoidance may be an initial response, accompanied by a more effective secondary response, such as support seeking (Hunter & Boyle, 2004; Lazarus & Folkman, 1984). More research is needed to examine the use of denial as an initial response in combination with a secondary response.
The three avoidance responses were not particularly effective, with students in general and special education reporting that things improved less than a third of the time after using the three avoidance responses. In addition, students in special education were 2 to 3 times more likely to report that things got worse after using the three avoidance responses, as compared with students in general education. One interpretation is that students in special education may already feel marginalized due the stigma of disability, and avoidance may further contribute to “having fewer friends, demonstrating lower self-esteem, being rejected by peers, being dependent on others, having observable differences, or possessing weaker social skills” (Rose et al., 2011, p. 119). As bullying is a form of aggression predicated on an imbalance of power, it is possible that avoidance may fail to address the fundamental power differential between bully and victim.
Support-Seeking Responses
Support seeking was the second most common response; however, students in general and special education differed in whom they sought support from. Although students in special education were less likely to have “told a friend,” the difference was nonsignificant when accounting for gender. Put simply, girls were more likely to tell a friend, and there were fewer girls in special education. However, students in special education were more likely to have “told an adult at home” and “told an adult at school,” even when accounting for gender. While telling an adult is a recommended strategy, there is a need to better understand the reasons that students in special education were more likely to tell an adult. It is possible that students in special education are socialized to ask for help more often and may be more dependent on adults within the school for protection (Olkin, 1999). Alternatively, it is also possible that because youth in special education typically have a case manager, they may develop a more trusting relationship with this adult, whereas students in general education may not have a designated adult advocate.
Of the students in special education who “told an adult at school,” a third reported that it made things better, while a third reported that it made things worse. Furthermore, students in special education who told an adult were 2 to 3 times more likely to report that things got worse compared with students in general education. Given that students in special education are twice as likely to be the target of bullying as their nondisabled peers (Carter & Spencer, 2006; Van Cleave & Davis, 2006), adults may become socially desensitized, viewing bullying toward students in special education as simply more common within the structure of the school (Holzbauer, 2008). Even if adults provide support, it is possible that students do not perceive their support as particularly helpful. Even well-intentioned teachers can inadvertently marginalize students receiving special education due to cultural messages about people with disabilities as victims who need to be rescued. Importantly, there is a need to carefully examine the support offered to students in special education who reported that telling an adult made things better versus worse.
Assertive Response
Assertiveness was the next most common, with significant group differences in the use and effectiveness of the three assertiveness responses. Compared with students in general education, students in special education were more likely to have “told the aggressor how they felt,” but less likely to have “told a joke.” A contributing factor may be that many students in special education have intellectual and language disabilities, which are associated with below-average social skills (Carter & Spencer, 2006). Due to limited social and communication skills, it may be harder for students receiving special education to use the assertive responses. As espoused by the transactional theory, there is a distinction between the expression of primary emotions, such as sadness and pain, and secondary emotions, such as shame and resentment (Lazarus & Folkman, 1984). Similarly, forms of humor may vary, and Klein and Kuiper (2006) noted that affiliative and self-enhancing humor may be more effective than humor that is overly self-disparaging of self and others. So far, research has not examined humor as a strategy for students in special education.
In the entire victim data set, the response “told a joke” was rated as the most effective, while “told the aggressor to stop” and “told the aggressor how I felt” were less effective. However, compared with students in general education, students in special education who “told a joke” and “told the aggressor how I felt” were 2 to 3 times more likely to report that it made things worse. One interpretation is that students in special education may lack the social skills to implement the assertiveness responses effectively, struggling to accurately read and respond to verbal and nonverbal communication (Mishna, 2003). However, if students with disabilities are treated as the problem, then there is no reason to look at problematic social structures. Bullying is a result of the complex interactions between the student and environment. Unless the stigma of disability is addressed, students in special education may continue to be stigmatized and the use of assertive responses may fail to challenge the power differential, further perpetuating victimization.
Aggressive Responses
The aggressive responses were the least common. Compared with students in general education, a higher percentage of students in special education “made plans to get back”; however, the effect was nonsignificant when accounting for gender and physical bullying. In contrast, students in special education were more likely to have “hit or fought the person,” when accounting for gender and physical bullying. One interpretation is that students in special education may be more likely to may view externalization (e.g., violence toward others) as a more desirable response than internalization (e.g., depression, anxiety). Thus, it is possible that students in special education may be socialized to retaliate, contributing to a cycle of violence (Rose et al., 2011). Alternatively, the school climate may not be safe or welcoming to students in special education and impairments in the ability to communicate and the stigma of disability may contribute to students with disabilities being viewed hostile and dangerous when simply trying to communicate.
Responding to physical bullying with aggression was more likely to make the situation worse rather than better for both students in general and special education. Specifically, 50.0% of students in special education versus 36.6% of students in general education who used physical violence reported that it made things worse. At the same time, it is important to note that 36.5% of students in special education and 37.8% of students in general education who used physical violence reported that it made things better. The present study was limited to 1 month, and what students viewed as beneficial in the short term may become problematic over time; however, with heightened concerns around physical violence in schools, there is a need to better understand students’ perceptions about what made physical violence an effective response.
Gender Effects
Gender effects were inconsistent. Among students in general education, girls were more likely to use the avoidance and support-seeking responses as well as share feelings, while boys were more likely to use aggression and humor (Shelley & Craig, 2010). However, gender effects were nonsignificant among students in special education (Blake et al., 2014). While inconsistent gender effects may be a result of the overrepresentation of boys in special education, it is possible that disability is more salient than gender with respect to responses to address bullying.
Physical-Bullying Effects
Effects by physical bullying were inconsistent as well. Among students in general education who reported that when faced with physical bullying, things became worse regardless of the response. In contrast, while physical bullying was associated with things becoming worse for the avoidance and aggression responses, the effectiveness of the support-seeking and assertiveness responses were nonsignificant for students in special education. Regardless of whether the bullying was physical or relational, the use and effectiveness of support seeking and assertiveness were the same for students in special education, but not for students in general education.
Implications
In line with educating students in the “least restrictive environment” (Mastropieri & Scruggs, 2010, p. 3), the results of the present study can be used to promote inclusion and improve academic outcomes for students with disabilities. Full inclusion is generally the best approach to promote social integration; however, students with disabilities have reported feeling “ostracized” in inclusive education settings (Carter & Spencer, 2006, p. 15). In fact, Blake et al. (2016) argued that while inclusion may create “greater opportunities for students with disabilities to interact with peers” (p. 2), it does not guarantee that the interactions will be supportive and positive (Kalymon, Gettinger, & Hanley-Maxwell, 2010). Importantly, the results of the present study may inform SEL programming as a part of educational policies and practices.
Overall, the results of the study suggest that students in special education might benefit from tailored, antibullying prevention and response programming (Durlak et al., 2011; Espelage et al., 2015). In the present study, students in special education were significantly more likely to report that “things got worse” after using each response, compared with students in general education. However, it is important to note that while the situation may actually have worsened, it is also possible that students in special education were more likely to report the situation as worsening due to socialization and marginalization (Mishna, 2003; Olkin, 1999). Regardless of the reason, however, it would appear that interventions for students in special education may need to be individually tailored to that population, potentially requiring differing intervention intensity, duration, or sequence (e.g., intensifying the interventions for nonresponders; Sutherland et al., 2015). Furthermore, based on student perception, the results suggest a need for ongoing research on SEL programming to further assist students in special education to feel “safer and more connected to school and academics, build work habits in addition to social skills and build stronger relationships with peers and teachers” (Espelage, Rose, & Polanin, 2015, p. 3). Responses to bullying are not innate, but rather learned behaviors (Hunter & Boyle, 2004). Hence, it is critical that schools incorporate the results of the present study in ways that assist students to believe they can stop the bullying.
In terms of school-wide interventions, it is not enough to place students with disabilities in the same physical classrooms as their nondisabled peers, but rather, the present study suggests the need to further define and support the social integration of students with disabilities within the broader social structure of the school. The identification of disability as a social construct may explain why some students in special education differed in the use and effectiveness of responses to address bullying. Mental health professionals, such as school counselors and psychologists, are well equipped to provide training for school staff, students, and parents about bullying, including “what constitutes bullying, the extent of bullying, signs of bullying, causes of bullying behavior, and preventative strategies” (Bauman, 2008a, p. 370). Yet, the structure of the school must be responsive to the unique and varied perspectives of all students, and school-wide interventions need to include an awareness of differences in social and communication preferences (McLaughlin et al., 2010; Mishna, 2003). Therefore, the results of the present study can be used to promote school-wide positive behavioral support (SWPBS) interventions to foster positive interactions between students with and without disabilities (Gage, Sugai, Lewis, & Brzozowy, 2015).
Finally, schools can play an important role in promoting childhood mental health. Although many children are able to recover and cope effectively on their own, victimization by bullying can be a significant source of trauma for other students (Hinduja & Patchin, 2010). Through cross-training and interdisciplinary collaborations with mental health providers, schools can train adults in the school to recognize the signs of trauma, including “interventions to detect youths who are experience more than transient traumatic stress reactions and to help them acquire coping strategies and positive peer and parent support” (Ko et al., 2008, p. 398). The promotion of self-advocacy skills may be particularly important for students in special education (Roberts, Ju, & Zhang, 2016). Addressing the behavioral and mental health of students in special education may promote lifelong coping (Arseneault et al., 2010).
Limitations
There were limitations to this study, which may restrict the interpretation, but do not negate the findings. First, the sampling introduced two types of sampling error: (a) sampling bias and (b) sampling variance (Groves et al., 2004). Not all students had an equal chance to participate in this study and the sample statistics may not reflect the true population. In particular, students with the most significant disabilities were less likely to be taught in general classrooms and therefore less likely to have been sampled in this study. Second, not enough information was gathered on disability-specific variables. Thus, while students self-reported that they had “received special education,” the present study did not assess the diagnostic category, degree of impairment, academic functioning, or educational placements (e.g., mainstreamed versus. self-contained). In addition, it was not possible to determine if multiple responses to bullying victimization were used to address a single bullying incident or if the responses were used more than once in the last month. Finally, self-report was a limitation. Previous research has found a lack of congruence between self-reports of being bullied and peer nomination of someone being bullied (Cornell & Brockenbrough, 2004), and there was no external validation of students’ experiences.
Conclusion
Bullying is a barrier to social integration for students with disabilities. The results of the present study are significant in terms of exposing the unique and varied responses to bullying among students in special education. Moving forward, the results of the present study can inform the development of SEL programs to teach emotional self-regulation, communication, and interpersonal problem solving among students in special education.
Footnotes
Acknowledgements
The authors wish to thank the students who participated in the Youth Voice Project as well as the colleagues who provided feedback on the manuscript.
Declaration of Conflicting Interests
The author(s) declared no potential conflicts of interest with respect to the research, authorship, and/or publication of this article.
Funding
The author(s) received no financial support for the research, authorship, and/or publication of this article.