
Abstract
Introduction:
A variety of rating scales are currently being used to assess symptom severity and quantify symptoms change in attention-deficit/hyperactivity disorder (ADHD) research and clinical practice. This poses difficulties in interpreting scores from different scales in clinical practice and synthesizing data from studies using different scales. We aimed to develop algorithms for converting scores across the ADHD scales most often used in randomized controlled trials (RCTs) of ADHD medications in children/adolescents and adults, and to develop an online tool for implementing the algorithms.
Methods:
We analyzed individual participant data from RCTs of ADHD medications (32 RCTs in children/adolescents, 21 in adults), with data on at least two scales per participant at the same timepoint. We applied a series of competing models, that is, univariable and multivariable regression, random forests, and an equipercentile linkage approach, to link pairs of scales. To assess the error of the linking procedure and identify the optimal model, we calculated the median absolute error and
Results:
We linked six commonly used ADHD scales, such as the ADHD Rating Scale (ADHD-RS-IV; investigator-rated) and the Conners’ Parent Rating Scale (CPRS-R:S). Spline models most frequently yielded the lowest prediction error, outperforming alternative conversion algorithms for absolute scores in 6 out of 12 univariable models and 8 out of 12 multivariable models. The tool for scores conversion is available at ADHD_Scale_Conversion_Tool.
Conclusions:
Our linkage algorithms enable the comparison and harmonization of findings across studies using different ADHD rating scales. Translating scores across scales improves the interpretability of research findings, facilitates future evidence synthesis across studies, and may support clinical practice. Our online tool supports the practical uptake of our results.
Introduction
Attention-deficit/hyperactivity disorder (ADHD) is the most common neurodevelopmental disorder, affecting at least 5% of school-aged children and persisting in adulthood in up to 70% of cases (Cortese et al., 2023; Faraone et al., 2024). It is marked by levels of inattention and/or hyperactivity-impulsivity that are persistent, pervasive, inconsistent with the developmental stage, and that interfere with everyday functioning (American Psychiatric Association, 2022).
ADHD management strategies include pharmacological and nonpharmacological interventions. FDA-approved medications comprise stimulants, including methylphenidate and amphetamines, and nonstimulants, such as atomoxetine, clonidine, guanfacine, and viloxazine (Cortese, 2020).
Randomized controlled trials (RCTs) are considered the gold standard for assessing treatment efficacy and tolerability. Rating scales of symptom severity are used in RCTs to measure symptom severity and estimate treatment-related changes. They are also used in daily clinical practice to monitor symptom severity over time. Some of the most commonly used rating scales to assess core symptoms in RCTs of ADHD treatments include the ADHD Rating Scale based on DSM-IV criteria (ADHD-RS-IV) Investigator rated, the Conner’s Parent Rating Scale-Revised (CPRS-R:S), Conner’s Teacher Rating Scale-Revised (CTRS-R:S), Adult ADHD Investigator Symptom Rating Scale (AISRS) and the Conner’s Adult ADHD Rating scale (CAARS) (Conners et al., 1999; Conners et al., 1997,1998; Cortese et al., 2018; Zhang et al., 2005).
The Clinical Global Impression (CGI) scale is also widely used in RCTs of ADHD medications, assessing the overall clinical severity rather than the severity of specific ADHD symptoms (Busner and Targum, 2007). It includes the CGI-Severity (CGI-S), which assesses the current severity of the condition, and the CGI-Improvement (CGI-I), which evaluates the change relative to the start of treatment (Busner and Targum, 2007).
The use of different ADHD rating scales makes it difficult to compare scores in clinical practice and hampers the interpretation of findings across studies. In clinical practice, the severity of ADHD symptoms may be assessed using different tools during a patient’s care trajectory over time, either because different health care providers use different assessment instruments or because health care institutions adopt different tools across periods of care. Consequently, evaluating symptom progression longitudinally can be challenging. Establishing a systematic method for converting scores across different assessment tools may therefore facilitate the evaluation of symptom evolution over time and communication among professionals and patients.
From a research standpoint, mapping scores across several ADHD rating instruments would allow heterogeneous measurements of the same underlying construct to be used interchangeably across research datasets. As a result of this harmonization, data from diverse sources (e.g., RCTs and observational registries where different rating instruments are often used) can be integrated. This would facilitate future individual patient data meta-analyses in the field, translating different rating scales onto a metric of interest, allowing symptom scores to be harmonized across RCTs and observational registries, improving model applicability.
Equipercentile linking has been previously employed to map scores across different rating scales (Brennan and Kolen, 2014). This method has been applied to scales for major depressive disorder (Furukawa et al., 2019; Leucht et al., 2018), Alzheimer’s disease (Levine et al., 2021), quality of life (Furukawa et al., 2021), functioning (Samara et al., 2014; Samara et al., 2023), and OCD (Cohen et al., 2024), among others. However, to the best of our knowledge, no study to date has linked rating scales for ADHD. An alternative approach for mapping rating scales involves the use of statistical models or machine learning algorithms. Those models can be either univariable (i.e., having as their only input the score in one scale, and as output the score in a target scale) or multivariable (by including as input additional predictors, such as demographics).
In this study, we applied a range of alternative competing methods and models to link the various scales for ADHD and assessed the performance of each method to choose the best one. Finally, we implemented the identified optimal approach in an open-access online tool.
Methods
Search and data collection
This study was based on a preregistered protocol (https://osf.io/dqcsk/overview). To identify eligible RCTs, we relied on the MED-ADHD database (https://med-adhd.org/), a living repository of double-blind RCTs of ADHD medications, originally developed for a network meta-analysis of ADHD medications (Cortese et al., 2018), and updated yearly. The database includes RCTs retrieved from comprehensive searches of 12 bibliographic databases (including PubMed, Embase, CENTRAL, Web of Sciences, among others), trial registries, and gray literature sources (e.g., clinical trial registry platforms, dissertations and theses), with no language restrictions. The last update of MED-ADHD was conducted on 20 January 2026. Details on search terms/syntax inclusion/exclusion criteria of MED-ADHD, and studies included and excluded from MED-ADHD are reported in the Supplementary Data (Supplementary Appendix SA1).
For the present study, we used the individual participant data (IPD) that we collected as part of our project PATIENCE (Individual Patient dATa network meta-analysIs of the Efficacy aNd aCceptability of ADHD mEdication). Within the framework of PATIENCE, we gathered IPD from RCTs sponsored by pharmaceutical companies, accessed via direct contact or via clinical trial data-sharing platforms (Vivli, the YODA Project, CSDR), which provide controlled access to pseudo-anonymized individual participant data. We also collected IPD from RCTs not sponsored by pharmaceutical companies, by contacting individual corresponding authors. To be included in the present analyses, RCTs had to contribute with IPD in which the same participants were assessed at the same timepoint with at least two of the scales targeted for linking in children/adolescents or adults, namely: CPRS-R:S, AISRS, CTRS-R:S, CGI-S, ADHD-RS-IV, and CAARS. We included these scales because they were the most commonly reported across the RCTs in MED-ADHD, being used in at least five RCTs, in line with previous work (Furukawa et al., 2021; Furukawa et al., 2019; Leucht et al., 2018; Levine et al., 2021; Yoshimatsu et al., 2023), thereby ensuring sufficient data for the analyses.
Furthermore, to be eligible for analyses, IPD had to be hosted on the same platform, as datasets hosted on different platforms (i.e., separate secure environments) cannot be merged for one-stage IPD analyses. For this project, we selected the platform containing the largest number of eligible trials and excluded the remaining trials. We report results of the analyses in children/adolescents and adults separately.
Scales
We provide here a short description of the included scales.
The ADHD-RS-IV includes 18 items corresponding to the 18 symptoms listed in the DSM-IV for the diagnosis of ADHD. Each item is scored on a 0–3 scale according to frequency, providing a total score as well as separate scores for inattentive and hyperactive/impulsive symptoms (Zhang et al., 2005). It is often adopted as the primary outcome measure in RCTs measuring treatment efficacy in children/adolescents and adults. In our analysis, we included the ADHD-RS-IV investigator-rated version, considering as “investigator-rated” also cases where the investigator scored the items based on parent, teacher, or participant (adult) interviews. We only considered the total ADHD-RS-IV score for our analyses. The CPRS-R:S is a tool frequently used for obtaining parental reports of a child’s behavioral concerns in the context of ADHD and associated conditions. It was originally adapted from the 93-item CPRS to include 57 items across 7 domains: hyperactivity/impulsivity, oppositionality, anxiety, perfectionism, social problems, and psychosomatic symptoms (Conners et al., 1997,1998). Shorter forms have also been developed, aiming to obtain quick parent ratings of symptoms, where each symptom is rated on a 0–3 scale according to frequency (Deb et al., 2008). In our analysis, we used the version of CPRS-R:S that includes 27 items and considered the subscale “ADHD index”, which refers to ADHD core symptoms related behaviors. The CAARS includes investigator ratings for a multimodal assessment of ADHD symptoms in adults. The commonly used short form incorporates 30 items, each rated on a 0–3 scale according to frequency (Smyth and Meier, 2019). In our analyses, we considered the sum of the subscales on inattention and hyperactivity–impulsivity. The AISRS is a clinician-administered instrument widely used to assess the severity of ADHD symptoms in adults. The scale includes 18 items corresponding to the DSM-IV criteria for ADHD, with each item rated on a 0–3 scale according to symptom severity or frequency (Spencer et al., 2010). It provides a total score as well as domain scores for inattentive and hyperactive/impulsive symptoms. In our analyses, we considered the clinician-rated version of the AISRS and used the total score as the outcome measure. The CTRS-R:S is a teacher-report measure designed to assess ADHD-related behaviors and associated difficulties in children within the school setting. The revised short form includes 28 items rated on a 0–3 scale according to the frequency of observed behaviors (Conners, 1997). The scale provides several subscales, including an ADHD Index reflecting core ADHD symptoms. In our analyses, we used the CTRS-R:S ADHD Index score as the outcome measure. The CGI-S is a one-item 7-point Likert scale used to provide an overall rating of an individual’s overall clinical presentation. It is often used in RCTs because it provides a brief, stand-alone assessment of the clinician’s view of an individual, including aspects that may not be fully captured by individual symptom scales (Busner and Targum, 2007).
Statistical analysis
We combined IPD across all studies, treating participants as belonging to a single pooled dataset. In this unified sample, we calculated the Spearman’s correlation coefficients between each pair of scales targeted for linking. The correlation was calculated for the baseline, endpoint, and overall (simultaneously keeping endpoint and baseline) scores, as well as for the change from the baseline (CFB). We also calculated the correlation within each treatment and trial separately, to evaluate the consistency of associations across trials and treatments.
We used correlation thresholds to make decisions about the appropriateness of linking. We considered Spearman’s correlations above 0.50 as appropriate and linked pairs of scales only if their correlation was above this threshold (Choi et al., 2014). Correlations with ranges between 0.50 and 0.70 were retained but flagged, to indicate moderate strength. Correlations exceeding the 0.70 threshold were considered strong and associated with greater confidence about the linking.
We then applied the equipercentile linking procedure to map pairs of scales. This method works by aligning scores of each scale to the same percentile in their respective distributions. In addition, we developed three complementary conversion algorithms to evaluate alternative scale mapping with increasing levels of flexibility. To this end, we used as conversion algorithms a linear regression model, a linear regression with natural cubic splines to allow for nonlinear effects for age and linking scale (with four knots each, placed at the equipercentiles), and a random forest, which is a nonparametric machine-learning approach.
We used univariable and multivariable models. The former only included as input one scale, and as output the other scale of each pair. The latter also included gender, age, ADHD presentation/subtype, and BMI as additional predictors. Those predictors were chosen a priori based on a systematic review of candidate predictors and moderators of efficacy and tolerability in the MED-ADHD databases (article currently under review; protocol registered on the Open Science Framework [OSF] https://doi.org/10.17605/OSF.IO/SH429) and their availability across the included trials. This was based on the hypothesis that the mapping between scales may be affected by personal characteristics.
We evaluated the performance of all models using a 10-fold cross-validation by comparing predicted values of the target score (obtained using the model) to the true observed values in the RCT. To quantify performance, we calculated the Median Absolute Error (MAE) and the coefficient of determination (
We applied the linkage procedure described above for the combination of the scales CGI-S, CPRS-R:S, and ADHD-RS-IV for the children/adolescents. Subsequently, we performed linking between CGI-S and the scales ADHD-RS-IV, CAARS Investigator-rated and AISRS for adults. For each pair we calculated both ways of transformation [e.g., for pair CGI-S to CPRS-R:S, we calculated both linkage of CGI-S to CPRS-R:S and vice versa (CPRS-R:S to CGI-S)].
In contrast to previous studies (e.g., Furukawa et al., 2021), we pooled measurements across time points (before and after randomization). This approach was adopted since we expected that treatment effects would not impact on how one score translates into another. By analyzing baseline and endpoint jointly, we increased the available sample size and avoided an unnecessary division of the data. In addition to increasing sample size, including endpoint observations allowed us to capture a wider range of symptom severity as compared to using baseline alone. This is because inclusion criteria often impose a minimum threshold for symptom severity at entry, whereas endpoint data reflect the full spectrum of treatment response (from full remission to nonresponse).
In multivariable models, when observations from the stacked dataset were missing, we excluded the patients from the dataset (i.e., we did a complete case analysis). Missing data were most commonly observed for the endpoint outcome. As a result, the univariable models (including equipercentile linking) and the multivariable models were fitted on slightly different datasets. While this limits direct comparability between these approaches, both univariable and multivariable models are presented to allow flexibility in our tool. Restricting the univariable analyses to the complete case dataset was considered but not pursued, as this would have unnecessarily reduced the available sample size. All analyses were conducted in R (Version 4.4.0), using the equate and caret packages (Albano, 2016; Kuhn, 2008). We made the code freely available in our online GitHub repository.
Tool development
To facilitate the implementation and dissemination of the proposed methodology, we developed a web-based application in R, using the Shiny framework. This application provides an interactive interface where users can input the prespecified patient characteristics and the scores of the scale they want to transform, to compute the scores in the corresponding scale.
Results
Of the 166 RCTs included in the latest MED-ADHD update, we were able to obtain IPD for 89 for the present project. Since most of the trials (56 out of 89) were made available through the Vivli platform (trials from the YODA Project are also included in Vivli), we used this platform for the whole study. Three studies were excluded because they did not include any pair of the predefined scales. They either reported only one of the target scales or used alternative scales as outcome. Of those 53 studies, 32 trials included 7918 children/adolescents and 21 included 6904 adults.
We had to exclude several scales from the analysis as they were used in fewer than five studies, (e.g., Conners’ Adult ADHD Rating Scale Self-Report [CAARS-Self], Wender–Reimherr Adult Attention Deficit Disorder Scale [WRAADS], and Swanson, Nolan, and Pelham Rating Scale [SNAP-IV]).
Our decision to combine baseline and endpoint was supported by the correlation matrices presented in the Supplementary Appendix SA2 (Supplementary Tables S2, S3, S4, S5, S6, S7, and S8), which showed comparable patterns across time points. Differences observed between baseline and endpoint correlations are consistent with prior literature (Furukawa et al., 2021; Furukawa et al., 2019).
Table 1 reports an overview of the linked scales across age groups, with number of studies, number of all available observations from the stacked dataset, number of available observations from the complete case dataset (i.e., the stacked dataset after removing patients with missing predictor or outcome data), and correlations for each pair of scales.
Number of Studies, Total Number of Participants, Available Observations (Stacked Data; Meaning Each Participant in the RCT Provides Measurement at Baseline and, If Not Dropped out, Another One at the Endpoint), Available Observations from Stacked Dataset with Nonmissing Predictor Data (Used by Multivariable Models), and Spearman Correlation (
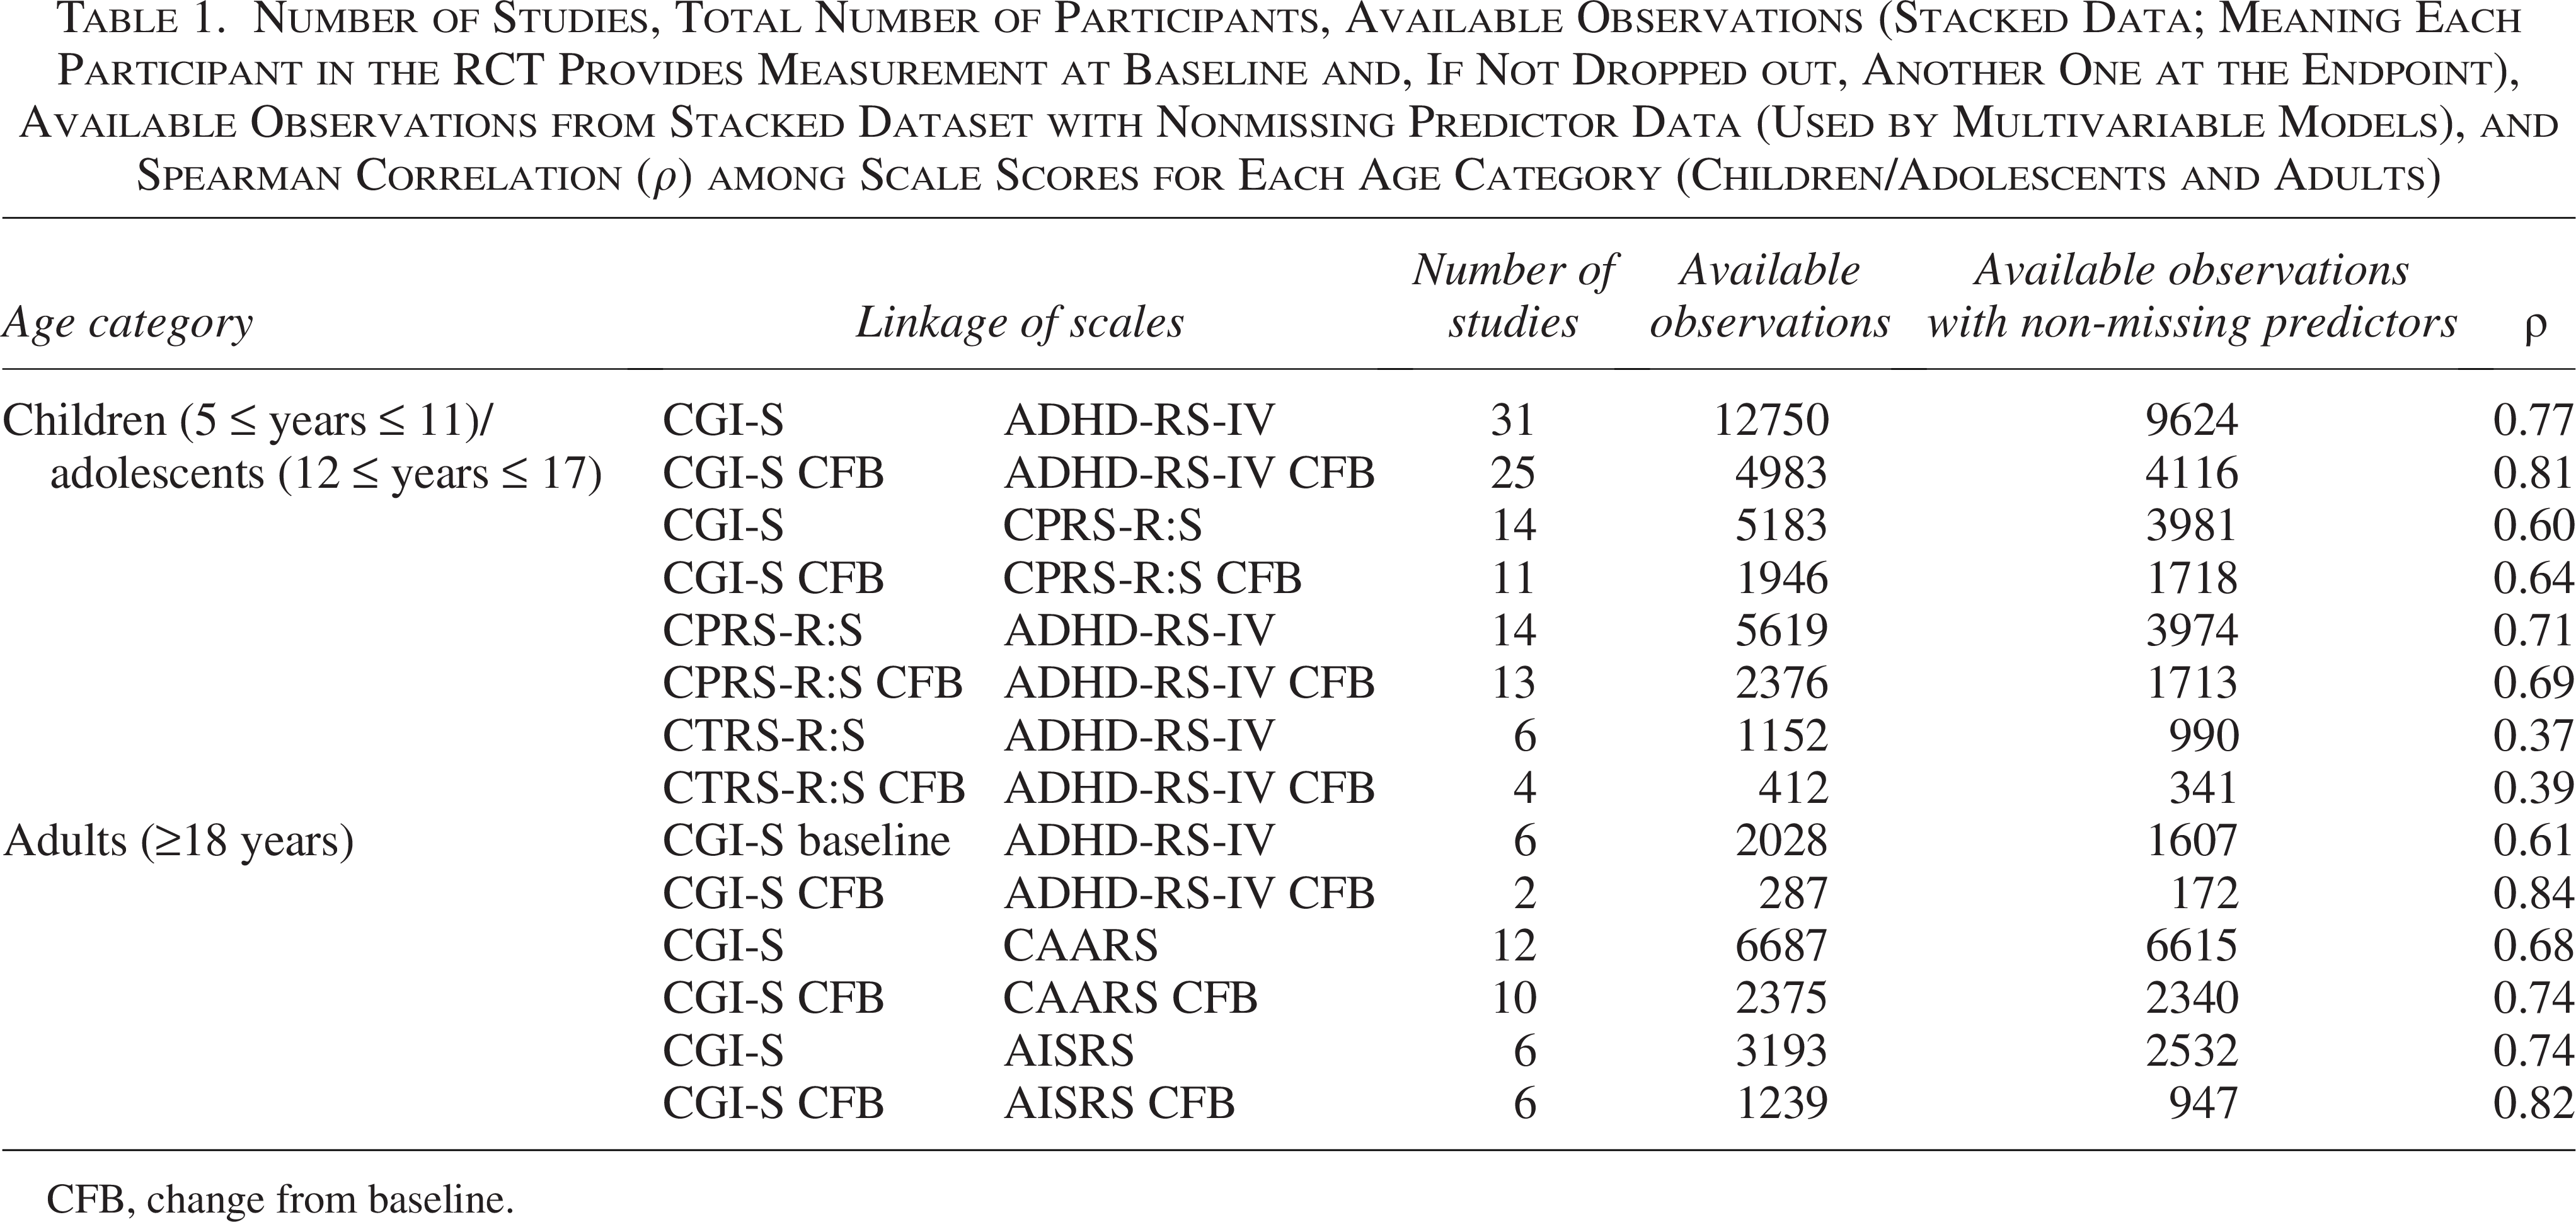
CFB, change from baseline.
For the linking of CGI-S to ADHD-RS-IV, we relied on 31 RCTs for children/adolescents and 6 studies for adults. 14 studies provided data for both CPRS-R:S to ADHD-RS-IV and CGI-S to CPRS-R:S linking, 11 for the CGI-S to CAARS linking, and 6 for the CTRS-R:S to ADHD-RS-IV linking. As shown in Table 1, all between-scale correlations were above the predefined thresholds, except for the CTRS-R:S to ADHD-RS-IV pair, which we therefore excluded from both absolute score and CFB analyses. From the remaining pairs (absolute score and CFB), five were retained but flagged as moderate according to our threshold (0.50–0.70 correlation), while seven were considered strong and linked with confidence (>0.70 correlation) (Table 1).
Linking between scales for children/adolescents
We performed linking in three pairs. The first pair was ADHD-RS-IV rated and CGI-S (31 studies). Across these studies, 12750 participants provided data at the same timepoint on both scales. When adjusting for availability of predictor data, the sample size reduced to 9624 as some participants had missing values on their predictors. Table 2 shows the conversion based on the best univariable models for each scale transformation.
Linkage of Absolute Score CGI-S to Each Scale for Each Age Category. The Conversion Was Based on the Univariable Model Demonstrating the Highest Predictive Performance
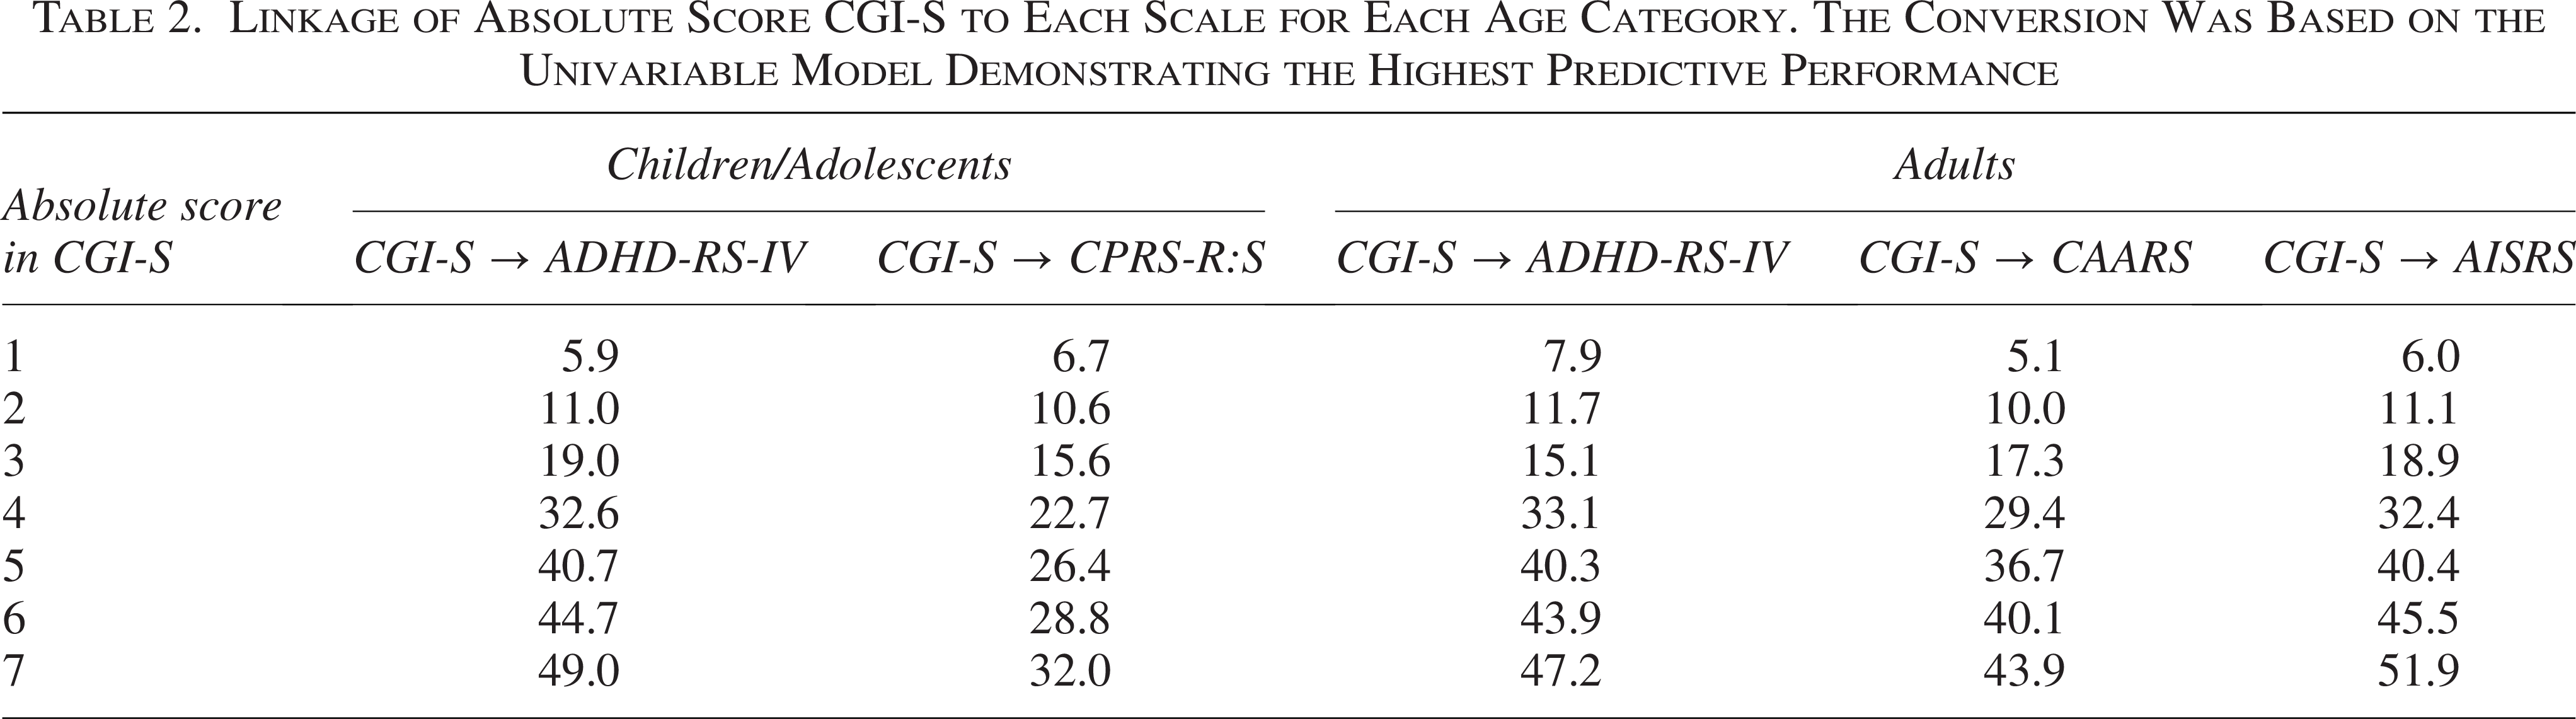
Table 3 summarizes the performance measures of the seven models fitted to link the CGI-S to the ADHD-RS-IV scale. Among unadjusted models, random forest performed best; among the multivariable models, the regression with splines showed the best performance. For CFB, the univariable spline model outperformed other unadjusted models, while the multivariable spline model achieved the best performance in the adjusted models. The MAE in the best univariable model for absolute score was 4.74, indicating that half of the predictions had an error smaller than 4.74. This corresponds to approximately 9% of the total scale range (0–54), suggesting that the prediction error is relatively small in magnitude.
Performance Measures of All Linkage Methods we Explored for the Transformation of the Scale of CGI-S to ADHD-RS-IV Investigator Rated for Children/Adolescents
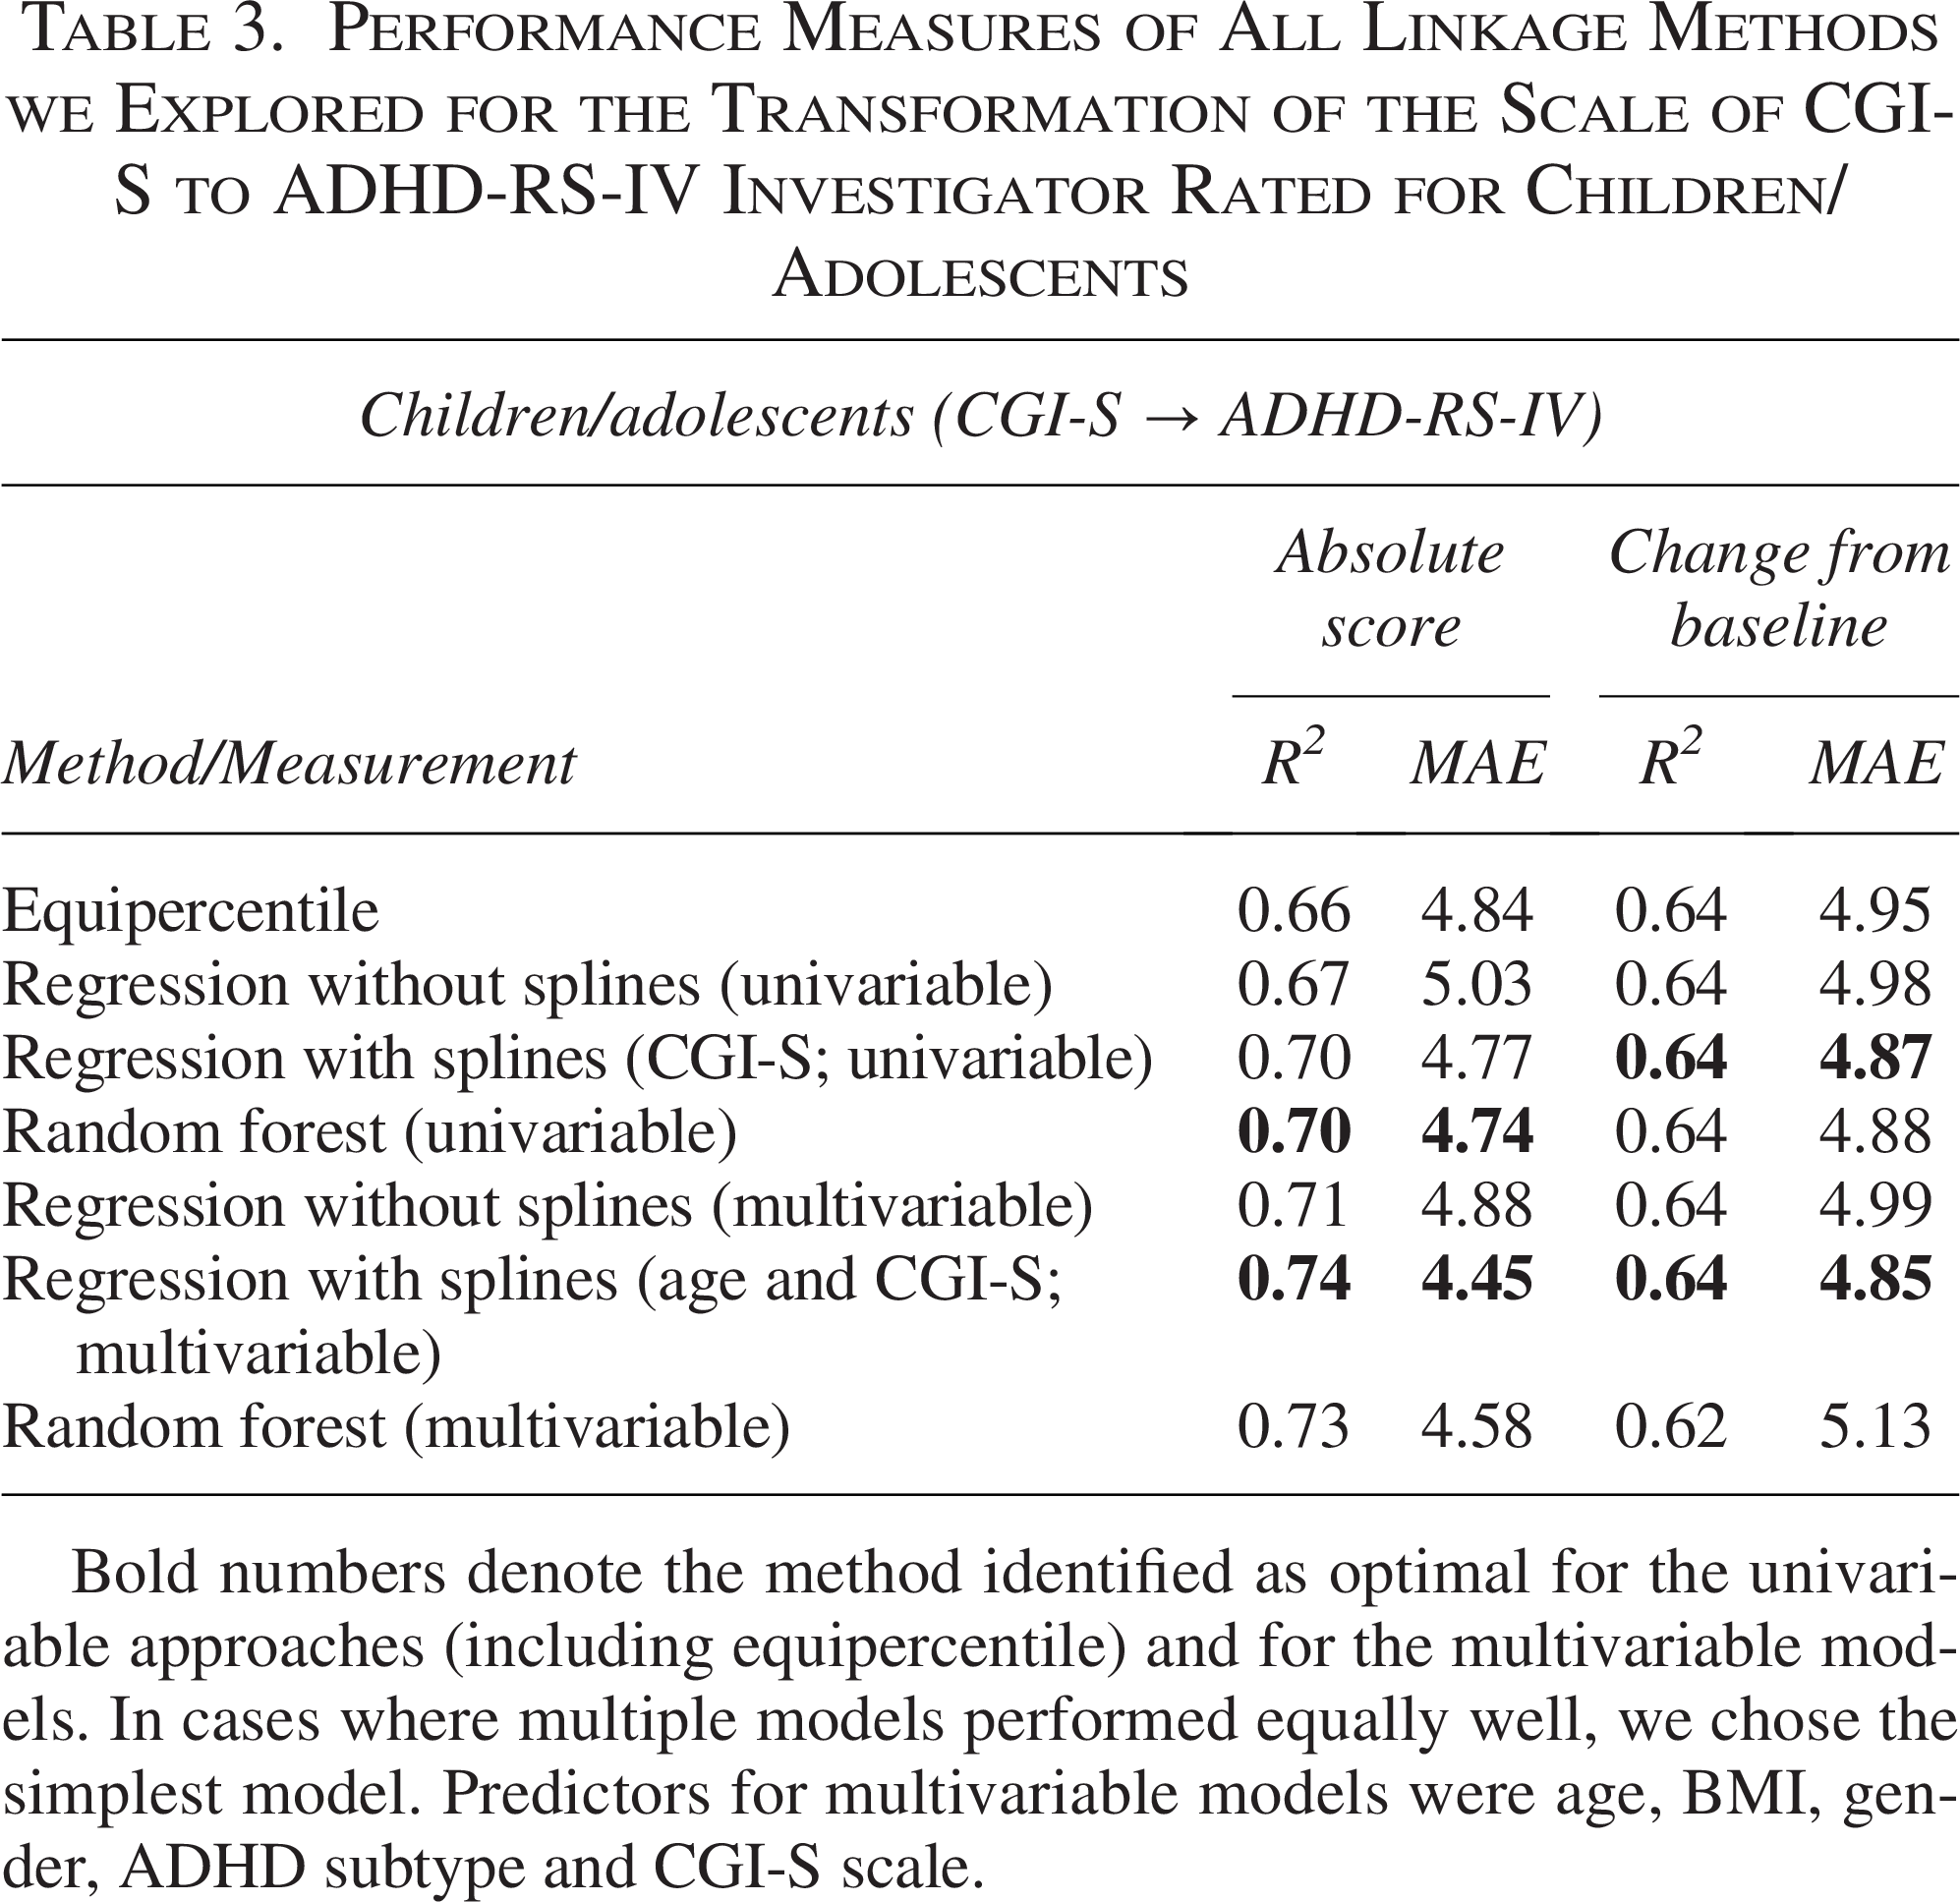
Bold numbers denote the method identified as optimal for the univariable approaches (including equipercentile) and for the multivariable models. In cases where multiple models performed equally well, we chose the simplest model. Predictors for multivariable models were age, BMI, gender, ADHD subtype and CGI-S scale.
The result of all pairwise linkages can be seen in Table 2 and Supplementary Appendix SA2 (Supplementary Table S9) for the absolute score, while for CFB, the results can be found in the Supplementary Appendix SA2 (Supplementary Tables S10–S11).
For the transformation of CGI-S to CPRS-R:S, univariable random forest model was the best in terms of performance measures for absolute scores, while splines was the best-performed model for the multivariable setting. For CFB, simple regression was superior for the multivariable setting (Supplementary Table S12). Equipercentile was superior in absolute scores in unadjusted model, and splines model was better in terms of CFB for both unadjusted and adjusted models in the mapping of CPRS-R:S to ADHD-RS-IV (Supplementary Table S13). Although the univariable linear regression model for absolute scores had a lower RMSE than the equipercentile approach, we selected the equipercentile algorithm as the preferred method because it achieved a lower MAE, a metric that is more interpretable and less sensitive to outliers. For all scale transformations mentioned above, we also provide the performance measures of the reverse algorithms in the Supplementary Appendix SA2 (Supplementary Tables S14, S15, and S16).
Linking between scales for adults
We were able to perform linking in three pairs. The pair with the most trials was CGI-S to CAARS Investigator rated (12 trials). The sample size in this linkage was 6687, reduced to 6615 for models including additional predictors. Table 4 summarizes the performance measures of the seven models fitted to link the CGI-S to the CAARS investigator-rated scale. Regression with splines was the best model based on the performance metrics, among both unadjusted and adjusted models. For linking CFB, regression with splines had the best overall performance for univariable setting, while linear regression had the best performance in the multivariable setting.
Performance Measures of All Linkage Methods We Explored for the Transformation of the Scale of CGI-S to CAARS Investigator-Rated for Adults
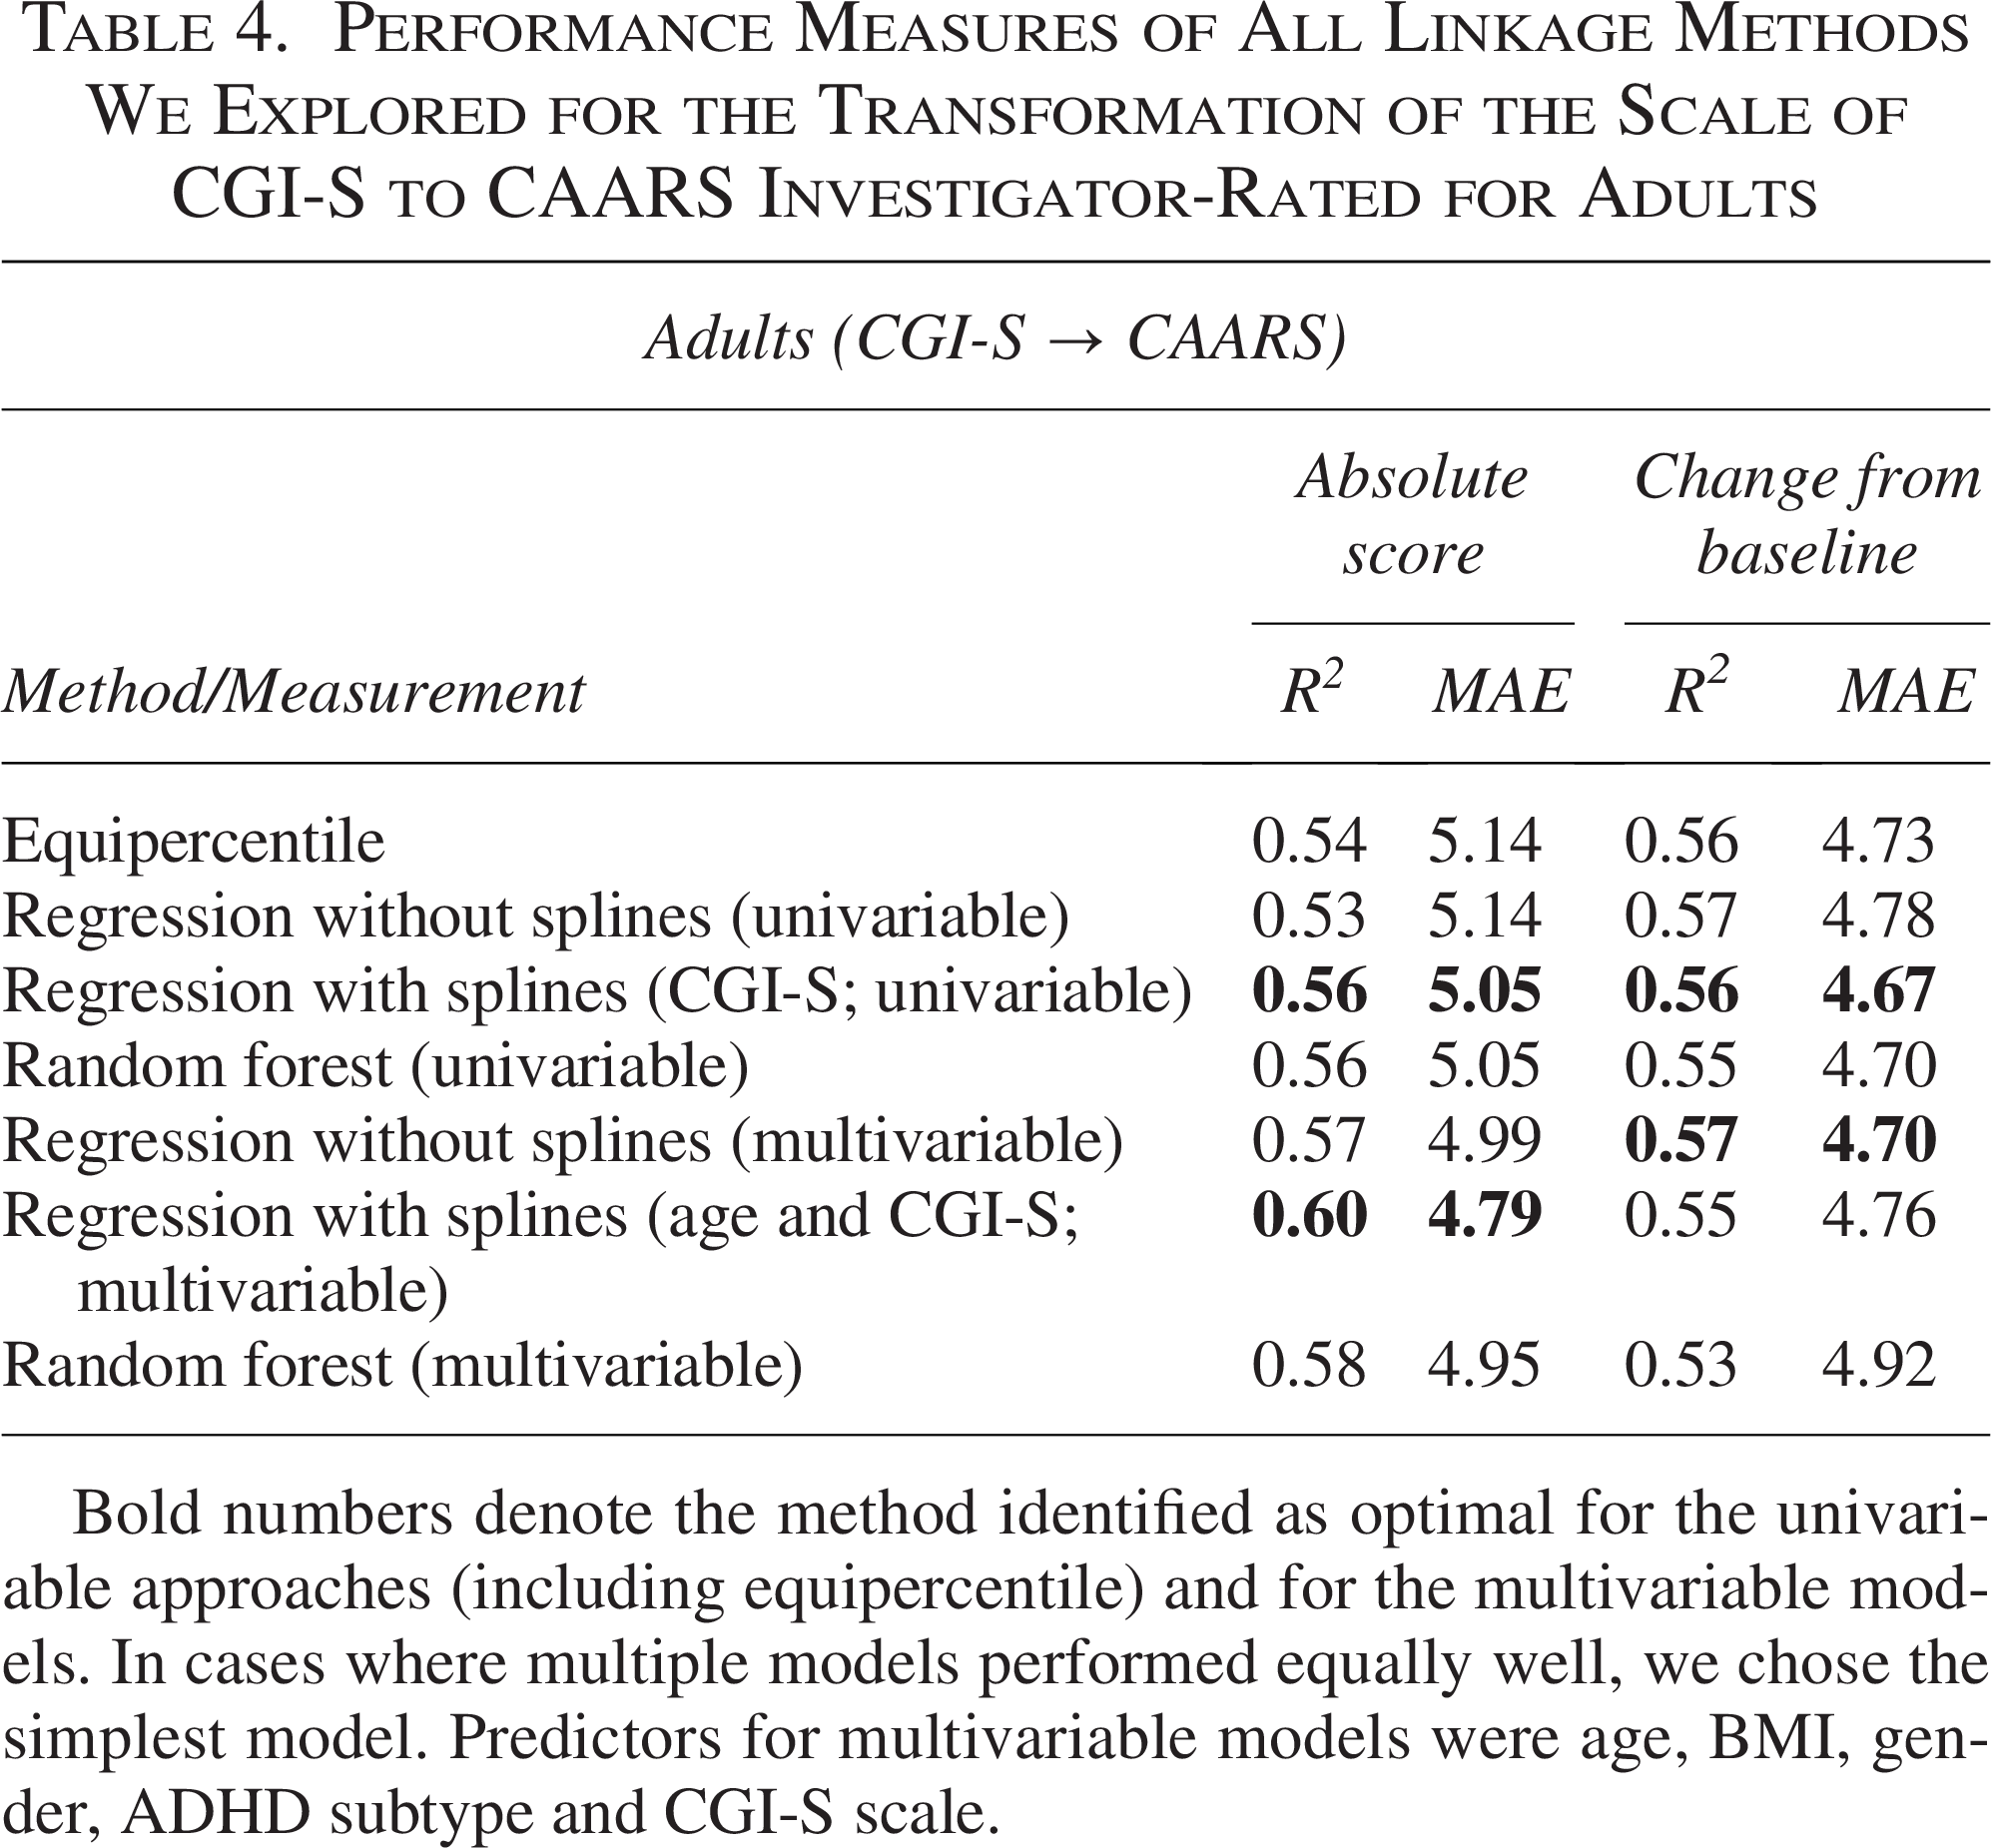
Bold numbers denote the method identified as optimal for the univariable approaches (including equipercentile) and for the multivariable models. In cases where multiple models performed equally well, we chose the simplest model. Predictors for multivariable models were age, BMI, gender, ADHD subtype and CGI-S scale.
For the transformation of CGI-S to AISRS, random forest had the best performance in the univariable case, while spline models were best in multivariable case for the absolute scores transformation, but for CFB, the linear regression had the best results in both univariable and multivariable settings (Supplementary Table S17). The best models for the mapping of CGI-S to AISRS are aligned with the ones for the mapping of CGI-S to ADHD-RS-IV (Supplementary Table S18). For those three scale transformations in adults, we also provide their vice versa performance measures in the Supplementary Appendix SA2 (Supplementary Tables S19, S20, and S21).
The mapping of scales can be seen in Table 4 and Supplementary Appendix SA2 (Supplementary Table S9) for the absolute score, while for CFB, the results can be found in the Supplementary Appendix SA2 (Supplementary Tables S10, and S11).
Figure 1 illustrates the relationship between observed and predicted values for the most common mapping scales in the two age groups. These visual distributions complement the quantitative results of model’s performance in Tables 3–4.
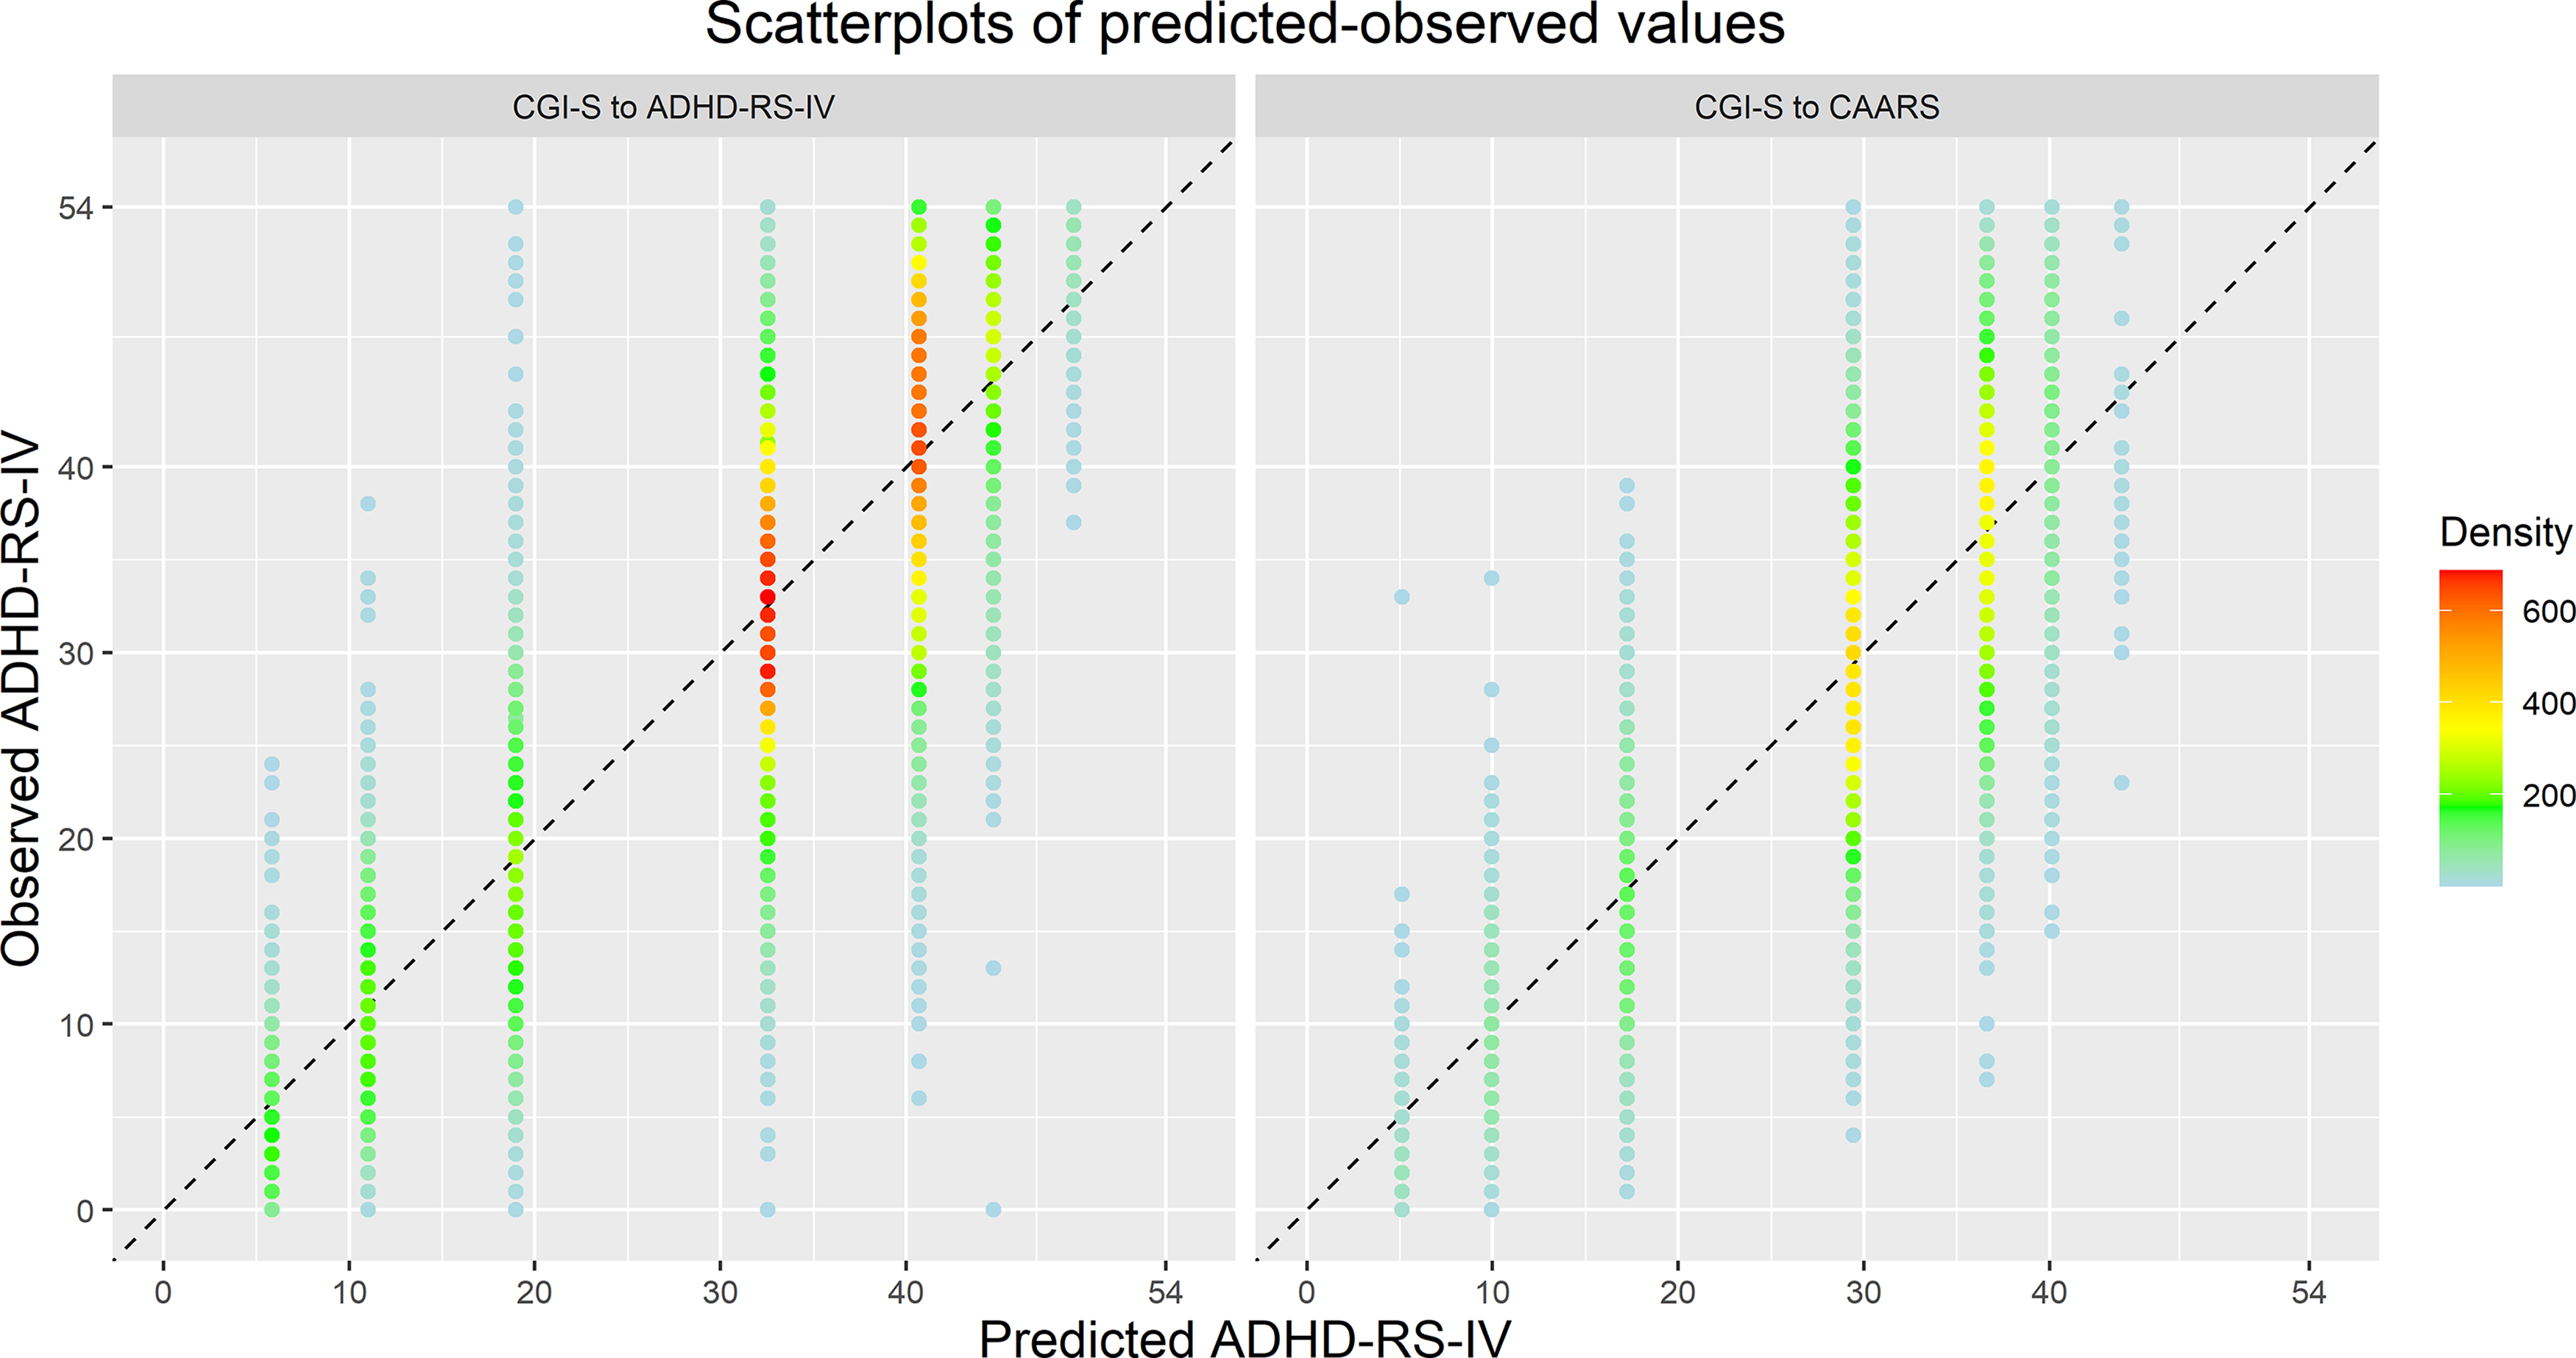
Scatterplot of the observed versus predicted values in the absolute scores mapping of CGI-S to ADHD-RS-IV for children/adolescents in the left panel, and CGI-S to CAARS for adults in the right panel. Colors indicate density. In each case, we utilized the spline models that demonstrated superior performance in their respective univariate evaluations.
Online tool
The online tool provides the option to use either the unadjusted model or the adjusted model, maintaining a “user-preference” approach, allowing researchers to select the model complexity they deem most appropriate for their specific population. Also, the unadjusted models allow flexibility in settings where certain predictors may be challenging to collect (Fig. 2) (ADHD_Scale_Conversion_Tool).
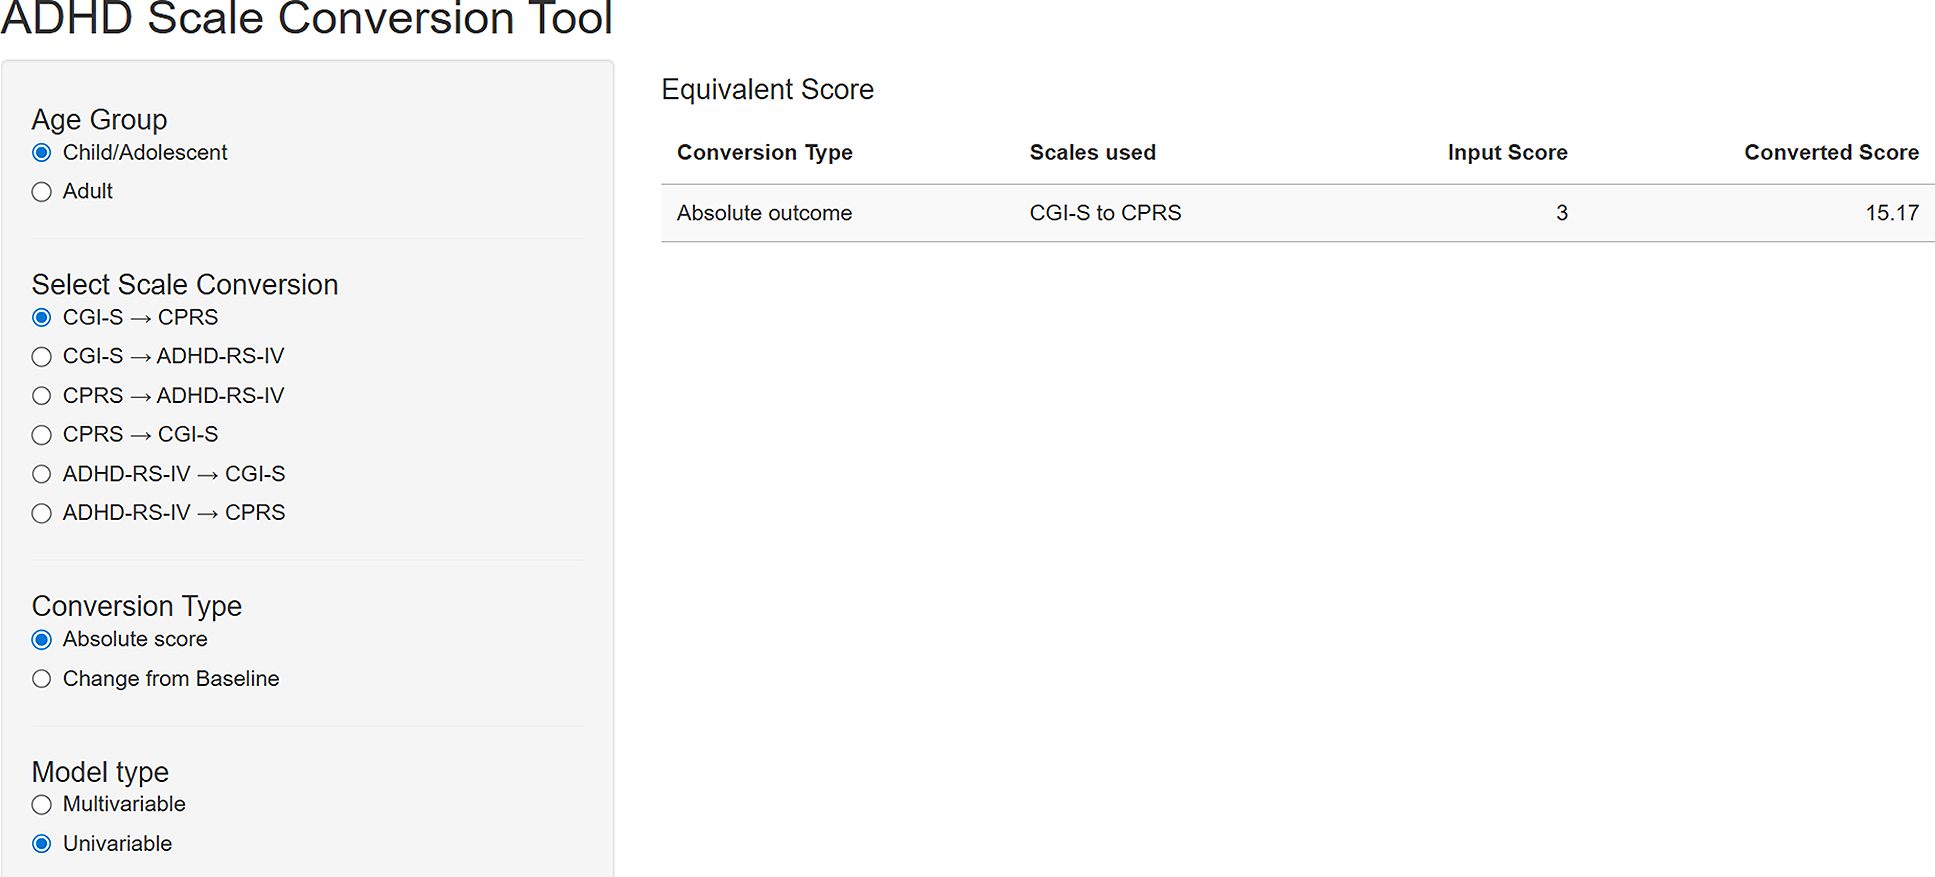
Open access online tool for mapping ADHD rating scales.
Additionally, the tool offers a wide range of options. Users can choose which age group to map, which scales to use, whether mapping will be done as an absolute score or as a CFB, and variables available for the adjusted model. Since no access was granted for extracting the multivariable random forest models, we restricted ourselves in multivariable linear regressions. In the two instances (out of twelve) where random forest outperformed linear models, the second-best linear alternative was used. For the sake of completeness, we provide the model performance of all multivariable models (including random forest) in this article for research validity.
Discussion
To the best of our knowledge, this is the first study to link rating scales commonly used for assessing the severity of ADHD symptoms in children/adolescents and adults, and to provide a user-friendly web application that can be consulted by clinicians in their daily practice.
From a clinical standpoint, the results of our study enhance clinical interpretation of rating scales commonly used to monitor the severity of ADHD symptoms over time. Using a rating scale to systematically track symptom severity in routine clinical practice has been endorsed in a recent International Delphi consensus (Mulraney et al., 2024), which recommended the systematic use of rating scales measuring ADHD core symptoms (such as SNAP-IV, ADHD-RS-IV, or CADRS) in routine clinical practice. However, the systematic use of outcome-based measures is not implemented within clinical practice for ADHD. A previous systematic review of 103 studies based on electronic health records (EHRs) identified only a limited number of EHRs that included measures of ADHD symptom severity at baseline (before treatment) and/or during treatment (Roy et al., 2025). More specifically, nine EHRs included standardized symptom questionnaires only at baseline, three both before and after treatment initiation and two only after treatment was started. The limited uptake of rating scales in clinical practice may be due to poor confidence in their use or interpretation as well as the perception that they may be time-consuming for already busy clinicians. Elucidating how scores of different scales link to each other could help clinicians in routinely implementing and benefitting from rating scales in their clinical practice, to deliver better evidence-based care. Our online tool can help you easily navigate through rating scales. Our work should also enhance continuity of care and improve the longitudinal monitoring of clinical symptoms across different care providers. Furthermore, our mapping/conversion across scales has the potential to enhance clearer communication among clinicians, patients, and caregivers, particularly when care is transferred across settings or providers who rely on different assessment tools. In turn, a unified metric supports may enhance the quality of clinical assessment and enable more informed, collaborative decision-making. Moreover, the standardization of outcome measurements creates a foundation for the future development and implementation of clinical decision support tools that depend on comparable and interoperable data. Such tools could include digital monitoring platforms and evidence-based treatment algorithms, ultimately supporting a more systematic and measurement-based approach to ADHD care.
From a research standpoint, the guidance provided here may help interpret findings across different trials, beyond the inconsistent definitions of remission. Another important aspect of our work is that it facilitates future individual patient data meta-analyses in the field. Researchers could thus avoid using standardized mean difference (SMD) as effect size and avoid possible methodological errors when combining endpoint and change from baseline data such as calculating SMD using standard error instead of standard deviation, failing to orient all the scales in the same direction (e.g., high score means better), or mixing SD and mean of endpoint and change scores (Gallardo‐Gómez et al., 2024; Hopkins and Rowlands, 2024; Jung and Aloe, 2025; Ostinelli et al., 2024).
Our work has some limitations. While correlations of linked scales were generally strong for endpoints and change-from-baseline scores, correlations at baseline were lower. This may reflect study design factors, such as minimum ADHD severity criteria for enrolment, which reduces variability. Additionally, all trials were analyzed jointly without accounting for their unique characteristics, such as variations in PICO (Population, Intervention, Comparison, Outcome) criteria. Moreover, we only included scales reported in at least five studies, which was our predefined threshold, aiming to ensure sufficient data. This criterion did not allow us to include other scales, such as the SNAP-IV, which has been endorsed in the above-mentioned Delphi consensus (Mulraney et al, 2024).
A major strength of our analysis is the large number of trials that were used in our analysis. This is not only the first study that links scales for ADHD, but also one of the largest linkage studies across all neurologic and psychiatric conditions. For example, the number of studies analyzed in previous linkage studies was 4 (Yoshimatsu et al., 2023), 5 (Levine et al., 2021), 5 (Furukawa et al., 2021), 14 (Furukawa et al., 2019), and 31 (Leucht et al., 2018); in our study it was 53. Also, by analyzing baseline and endpoint jointly, we increased the available sample size and avoided an unnecessary division of the data. Another strength of our work is the use of multiple models to identify the most appropriate linking method. We also reported measures of predictive performance (RMSE, MAE, and R2) for our models, enhancing the transparency and reliability of our findings. Additionally, linking parent- and clinician-reported ADHD symptom scales onto a common scale allows for the integration of complementary perspectives and facilitates clearer interpretation of discrepancies between informants, which can enhance communication and support more informed, shared decision-making with families. Finally, to our knowledge, ours is the first open-access tool that enables a unified and rapid conversion of scores across ADHD rating scales.
Conclusion
In this study, we developed and tested algorithms and provided an open-access tool to convert scores across the most commonly used ADHD rating scales for children, adolescents, and adults. We hope that these findings, alongside the open-access tool, will support future evidence synthesis and improve the interpretation of research findings in daily clinical practice. In addition, they may enable more consistent tracking of ADHD symptom severity across the patient care trajectory in healthcare systems, thereby improving the evaluation of symptom progression and facilitating clearer communication between clinicians and patients.
Footnotes
Acknowledgments
This publication is based on research using data from data contributors AbbVie, Lilly, Takeda and Janssen that has been made available through Vivli, Inc. Vivli has not contributed to or approved, and is not in any way responsible for, the contents of this publication.
This study, carried out under YODA Project #2022-4930 used data obtained from the Yale University Open Data Access Project, which has an agreement with JANSSEN RESEARCH & DEVELOPMENT, L.L.C. The interpretation and reporting of research using this data are solely the responsibility of the authors and does not necessarily represent the official views of the Yale University Open Data Access Project or JANSSEN RESEARCH & DEVELOPMENT, L.L.C. The original proposal can be found: ![]() .
.
Author Disclosure Statement
S.C. has declared reimbursement for travel and accommodation expenses from the Association for Child and Adolescent Central Health (ACAMH) in relation to lectures delivered for ACAMH, the Canadian AADHD Alliance Resource, the British Association of Psychopharmacology, Healthcare Convention and the CCM Group team for educational activity on ADHD and has received honoraria from Medice.
E.G.O. has received research and consultancy fees from Angelini Pharma.
A.C. has received research, educational and consultancy fees from INCiPiT (Italian Network for Pediatric Trials), CARIPLO Foundation, Lundbeck, Teva and Angelini Pharma.
A.T. has received research, educational, and consultancy fees from Angelini Pharma, and lecture fees from Takeda, outside the submitted work. She also acts as a clinical advisor for Akrivia Health.
Supplemental Material
References
Supplementary Material
Please find the following supplemental material available below.
For Open Access articles published under a Creative Commons License, all supplemental material carries the same license as the article it is associated with.
For non-Open Access articles published, all supplemental material carries a non-exclusive license, and permission requests for re-use of supplemental material or any part of supplemental material shall be sent directly to the copyright owner as specified in the copyright notice associated with the article.