
Abstract
In this study we present a process model of team planning that distinguishes between four specific processes: exploration, strategic planning, detailed planning, and prognosis. From this model, we developed and validated a 16-item multidimensional long-form scale, a 4-item one-dimensional short-form scale, and a single-item scale. Results from three samples (total N = 536) with varying populations and settings provide support for the multidimensionality of the planning construct and the theorized structure of the scales and, also, demonstrate discriminant and convergent validity and predictive validity in terms of team performance.
The importance of planning for team outcomes and results has been highlighted in both theory (e.g., Hacker, 2005; Mumford et al., 2015; West, 2000) and research (e.g., Fisher, 2014; Mehta et al., 2009; Weingart, 1992). Team planning is often used to describe a set of team processes that are based on goal-oriented behavior (e.g., Marks et al., 2001; Smith et al., 1990). Nevertheless, team planning has often been conceptualized as a broad and one-dimensional construct (e.g., Mehta et al., 2009; Weldon et al., 1991). This approach is beneficial in terms of simplicity and applicability, but one-dimensional scales might suffer from limited content validity and predictive power (Fisher, 2014). Research has therefore begun to use multidimensional scales to uncover the multifaceted nature of team (DeChurch & Haas, 2008; Fisher, 2014).
However, it is striking that the existing multidimensional scales do not take into account team planning processes that are often discussed in theory. For example, most planning models assume that planning begins with elaborating goals (Dörner, 2016) or scanning the environment (Mumford et al., 2001), but none of these processes are included in existing team planning scales. Consequently, there is no clear and unified understanding of the team planning process with its various elements and their antecedents and consequences.
A possible reason for the lack of understanding of the team planning process is that there is currently no theory that focuses exclusively on the conscious goal-oriented behavioral processes (e.g., activities; Volpert, 1982) involved and their different functions in terms of achieving goals. Many of existing theories on planning either do not refer explicitly or exclusively to the team level (e.g., Dörner, 2016; Mumford et al., 2015) or are characterized by a focus on cognitive rather than goal-oriented behavioral processes (e.g., Mumford et al., 2015). Other theories focus on content-related aspects, such as the timing of planning processes (Marks et al., 2001), or on what is being planned (Fisher, 2014). In addition, some theories (Dörner, 2016; Hacker, 2005) include elements that are generally thought of as team actions rather than processes (Marks et al., 2001).
The main goal of the present research is to advance a process model of team planning that depicts the planning processes in a comprehensive and differentiated way. Based on this model, we develop and validate a multidimensional scale to assess these team planning processes. However, time and cost are key considerations in practice and may prevent the use of long scales (e.g., Crawford et al., 2001; Woods & Hampson, 2005). As existing one-dimensional scales have often not been carefully validated (e.g., Mehta et al., 2009; Smith et al., 1990), another goal of this study is to develop and validate two short-form scales to capture team planning.
Theoretical Background
Definitions of Team Planning
Previous research has provided several definitions of team planning, which vary in terms of the scope and focus of the construct (e.g., DeChurch & Haas, 2008; Hackman & Morris, 1975; Mumford et al., 2001). In this research we conceptualize planning as a team-level process that can be distinguished from other team processes of coordination or goal setting (Marks et al., 2001; McGrath, 1984). Team members interact purposefully to determine what actions they could and will take to achieve their goal (Marks et al., 2001; McGrath, 1984). We therefore define team planning as a deliberate and interactive process of generating, selecting, and elaborating future courses of action to achieve task goals. In addition, we conceptualize team planning as a shared construct that reflects a team characteristic stemming from the isomorphic assessments of individual team members. However, because we also assume that the assessments made by individual team members are subject to individual influences, we conceptualize team planning on a theoretical level as a shared and configural construct (see Stapleton et al., 2016, for more details).
A Process Model of Team Planning
Researchers have already begun to differentiate between various sub-processes within the team planning process (e.g., Marks et al., 2001; Mumford et al., 2015). However, there is still no process-oriented theory of team planning that focuses exclusively on the goal-oriented behavioral processes involved and their different functions in terms of achieving goals. It is therefore difficult to gain a deep understanding of the team planning process. To develop a process model of team planning, we reviewed the literature, paying attention to theoretical models of planning, particularly those of Mumford et al. (2001), Dörner (2016), and Hacker (2005).
Mumford et al. (2015) link a multitude of cognitive processes to various elements in the planning process. Because of its cognitive orientation and the fact that it is designed to be used at the individual, team, and organizational level, the model integrates processes in the planning phase that are relevant at the individual level, for example, but not at the behavioral level of team processes (e.g., case activation). In action regulation theory (Hacker, 2005), consideration is given to basic cognitive processes (e.g., perception, planning, and thinking) and behavioral processes (i.e., actions and movements) that occur during goal-oriented behavior (for a review, see Zacher & Frese, 2018). The theory is not only limited to the planning process but also reflects the general regulation of goal-directed behavior and has been used at the team level (e.g., von Cranach, 1996). Dörner (2016) presents a similar phase model for complex problem solving. His model identifies five phases within the planning process but also includes processes that go beyond planning, such as controlled action. In addition, it does not refer directly to teams.
Because an extensive review would fall outside the scope, in the discussion that follows we focus on the similarities between these models and include some assumptions in the literature. This enables us to develop our model of team planning, which sets out the various goal-oriented behavioral processes involved and their different functions. Also, by choosing a descriptive approach, we are able to delineate the various elements or sub-processes that make up team planning. In addition, we do not assume sequential dependencies between the sub-processes, and we consider the entire planning process in terms of all observable actions by team members that are part of this process. We have identified four relevant team planning processes that occur independently of each other, namely exploration, strategic planning, detailed planning, and prognosis.
First, we define exploration as the collection of information relevant to the task to be tackled. Exploration includes examining what is needed to achieve the particular goal and involves searching for information on the relevant boundary conditions that define the scope of the action. The process of exploration is based on what Hacker (2005) described as an orientation phase, which involves familiarizing oneself with the task, identifying possible ways of executing it, and determining the boundary conditions for achieving one’s goals. Similarly, Dörner (2016) describes phases of elaborating goals and scanning the situation, while Mumford et al. (2015) also refer to scanning the situation as part of the team planning process. We deliberately do not include goal development in our model, as it is understood to be a separate team process and is therefore conceptually distinct from the planning process (McGrath, 1984).
Second, we distinguish strategic planning from detailed planning. We define strategic planning as the generation and weighing up of different strategies and alternative actions to meet one’s objectives. The aim of this process is to establish a basic direction before a plan is refined and developed further. Detailed planning refers to the detailed elaboration and refinement of at least one strategy or course of action. This involves concrete and binding agreements on how various aspects of the task should be distributed, how the available time should be used, and, if necessary, how additional resources should be allocated. Detailed planning also includes the development of ‘if-then’ plans for specific situations. We have derived these two processes from several observations. Hacker (2005) argued that the generating of a plan or action program and the decision on the actual method of execution could be regarded as relevant planning processes. Similarly, Dörner (2016) highlights a planning and decision-making phase in which concrete action plans are conceived of as a combination of actions. Mumford et al. (2015) also refer to the identification and sequencing of concrete action steps and the formulation of back-up plans. While Hacker (2005) distinguishes between a general plan and the detailed steps needed to execute it, this distinction is not evident in the other models, which refer directly to the detailed level. However, the development of a broad action strategy and the detailed steps needed for execution are also explicitly discussed by Frese et al. (2007), and this is also the case in the cognitive model of planning (Hayes-Roth & Hayes-Roth, 1979).
Finally, we define prognosis as the process of examining whether the chosen course of action is likely to prove feasible, effective, and efficient. Prognosis is often referred to as mental simulation, mental anticipation, or forecasting (e.g., Frese et al., 2007; Mumford et al., 2015) that forms part of the planning process. It involves going over the plan in one’s mind and checking for possible obstacles and consequences. Depending on the results, this process may lead to multiple revisions of the plan and can thus trigger strategic or detailed planning.
In summary, we establish a process-oriented model that describes team planning in terms of observable actions undertaken by the team to meet the overall goal of the particular task. The advantage of this model is that the individual processes can be clearly distinguished from each other based on their different functions in the planning process. In contrast to other models, our model describes the different planning processes and does not specify any serial dependencies between the processes. We thus assume that the four processes can occur and take place independently of each other. Accordingly, a team may, for example, plan in a particularly strategic way but without exhibiting the behaviors involved in exploration and prognosis.
Measuring Team Planning
Factorial validity and psychometric properties
In accordance with our process model, we developed a multidimensional long-form team planning scale. Besides having good psychometric properties, it is essential for any scale to be correlated with other theoretically related measures and to show factorial validity (DeVellis, 2017; Hinkin, 1998). We therefore hypothesized that:
In addition to a multidimensional long-form scale, we developed two short one-dimensional versions. There were three reasons why we did this. First, time and cost play a major role in practice and can lead to more extensive instruments being used only partially or inventories for team diagnostics not being used at all (e.g., Crawford et al., 2001; Woods & Hampson, 2005). Also, in such cases, it is often not the individual planning processes that are of interest, but team planning as a general construct, which is not captured in the multidimensional long-form scale that is being developed. Second, short surveys are more acceptable to employees than long ones and help to reduce item and unit non-response (Rogelberg & Stanton, 2007). Finally, studies on the emergence of team processes and their dynamics require a high density of data (Kozlowski & Chao, 2018). In the context of intensive longitudinal studies, short scales are essential to minimize the workload for participants (Ohly et al., 2010). Research in the domains of organizational behavior (Fisher et al., 2016) and management (Bergkvist & Rossiter, 2007) has even demonstrated that single-item scales do not necessarily have less content, construct, and predictive validity than multiple-item scales. Thus, the practical relevance of short scales to capture team planning is more than given. However, existing one-dimensional scales are hardly validated (e.g., Mehta et al., 2009; Smith et al., 1990). With regard to our process model of team planning, the question therefore arises whether it is at all possible to validly capture “general team planning,” which was explicitly not postulated as a superordinate factor in the model due to the independence of the individual team planning processes. Only if this is possible, a differentiated assessment of the team planning process can be dispensed with in favor of cost-effectiveness and practicality. We therefore formulated the following research questions:
Convergent and predictive validity
To determine construct validity, we used a nomological network (Cronbach & Meehl, 1955) of constructs. On a theoretical level, these constructs should be correlated (convergent validity) with team planning. Although our planning model differs from other models and scales, it will overlap with previous measures of team planning. To examine this, we used the measure developed by DeChurch and Haas (2008), which is based on the taxonomy of team processes devised by Marks et al. (2001) and is well validated and broad in scope. In this measure, team planning is divided into the dimensions of deliberate planning, contingency planning, and reactive adjustment. Positive correlations are expected between all dimensions.
To further examine the convergent validity, we used psychological constructs in the team context that were closely related to team planning, including reflexivity. Reflexivity is the extent to which teams reflect on and adapt their strategies, behavior, and environment (West, 2000). West (2000) conceptualized team reflexivity as a continuous circle of reflection, planning, and adaptation in which reflection can be defined as a series of behaviors that involve accumulating and evaluating information through observation of oneself, one’s team, and the environment (Konradt et al., 2016). Although teams do not always have to go through this cycle in its entirety (West, 2000), there is likely a positive relationship between planning and reflexivity and reflection. For example, team planning is often seen as essential for implementing the changes that have been decided upon through reflection, as it then focuses team members’ attention on possible courses of action and mobilizes them to achieve their goal. In this respect, reflection should ideally lead to planning (West, 2000). We therefore hypothesized that planning will be positively related to reflexivity and reflection:
Information sharing refers to the extent to which information within a team is exchanged between members (De Dreu, 2007). Mumford et al. (2015) assumed that the exchange of information has a positive influence on team planning. Accordingly, team members should strive to share task-related information so that they can plan with each other based on that information. Empirical evidence shows there is a positive correlation between information sharing and reflexivity and reflection (De Dreu, 2007; Otte et al., 2016). Because both planning and reflection are defined as being part of reflexivity (West, 2000), we hypothesized that planning will also be positively related to the exchange of information:
Regarding predictive validity, a positive relationship between team planning and team performance is assumed in several theories (e.g., Hacker, 2005; Mumford et al., 2015; West, 2000). Team performance is the result of team members’ joint efforts to achieve a common goal (LePine, 2003), and empirical studies have demonstrated moderate to high positive correlations between the two (e.g., Fisher, 2014; Mehta et al., 2009; Weingart, 1992). Consequently, we expect there to be a positive correlation between team planning and team performance:
Scale Development
Following the guidelines established by Hinkin (1998) and DeVellis (2017), we used a systematic multi-step approach to develop the three scales for team planning. We first generated an item pool and presented a promising set of items to two different, consecutive samples to examine the psychometric properties of the new scales (Research Questions 1 and 2). We then reduced the number of items, conducted confirmatory factor analyses (CFA) to investigate the construct validity (Hypothesis 1), and examined the convergent validity (Hypotheses 2–5). We also checked the predictive validity of the new scales using an additional sample (Hypothesis 6).
Study 1: Item Generation, Construct Validity, and the Nomological Network
Three experts in the field of team planning (including one of the authors) initially generated items independently. For the long-form scale these were developed based on the definition of the four planning dimensions, and for the two short scales they were based on the existing definitions of team planning (83 items). 1 The experts also systematically reviewed the existing scales for team planning to reassign items where possible, either to the proposed four factors of the long-form scale (24 items) or to a global planning construct for the one-dimensional scale (7 items). To complement this procedure, 12 explorative interviews were conducted with master students and employees, who were asked to formulate questions that could be used to examine team planning. The experts assigned items to the planning dimension (97 items) or to the global planning construct (15 items). Subsequently, six experts (including the authors) rated, reduced, and adapted the set of items to eliminate duplication and ensure they were intelligible and captured the specific dimension adequately. Consistent with suggestions made by van Mierlo et al. (2009), we used a referent-shift consensus model (Chan, 1998). This procedure resulted in a set of 29 items for the long-form scale, 5 items for the short-form scale, and 1 item for the single-item scale. The experts also developed and agreed upon short descriptions of each construct (see Table 1). The response format was a 5-point Likert scale ranging from 1 (not at all) to 5 (to a very great extent). Finally, we used semi-structured cognitive interviews (Fisher & Geiselman, 1992) with 20 masters students and employees to examine whether the items and response format were clearly worded and unambiguous. Any ambiguous items were subsequently reformulated by the team of experts. 2
Standardized Item Loadings of the Team Planning Scales, with Standard Errors in Parentheses (Separate CFAs for the Long-Form and Short-Form Scales).
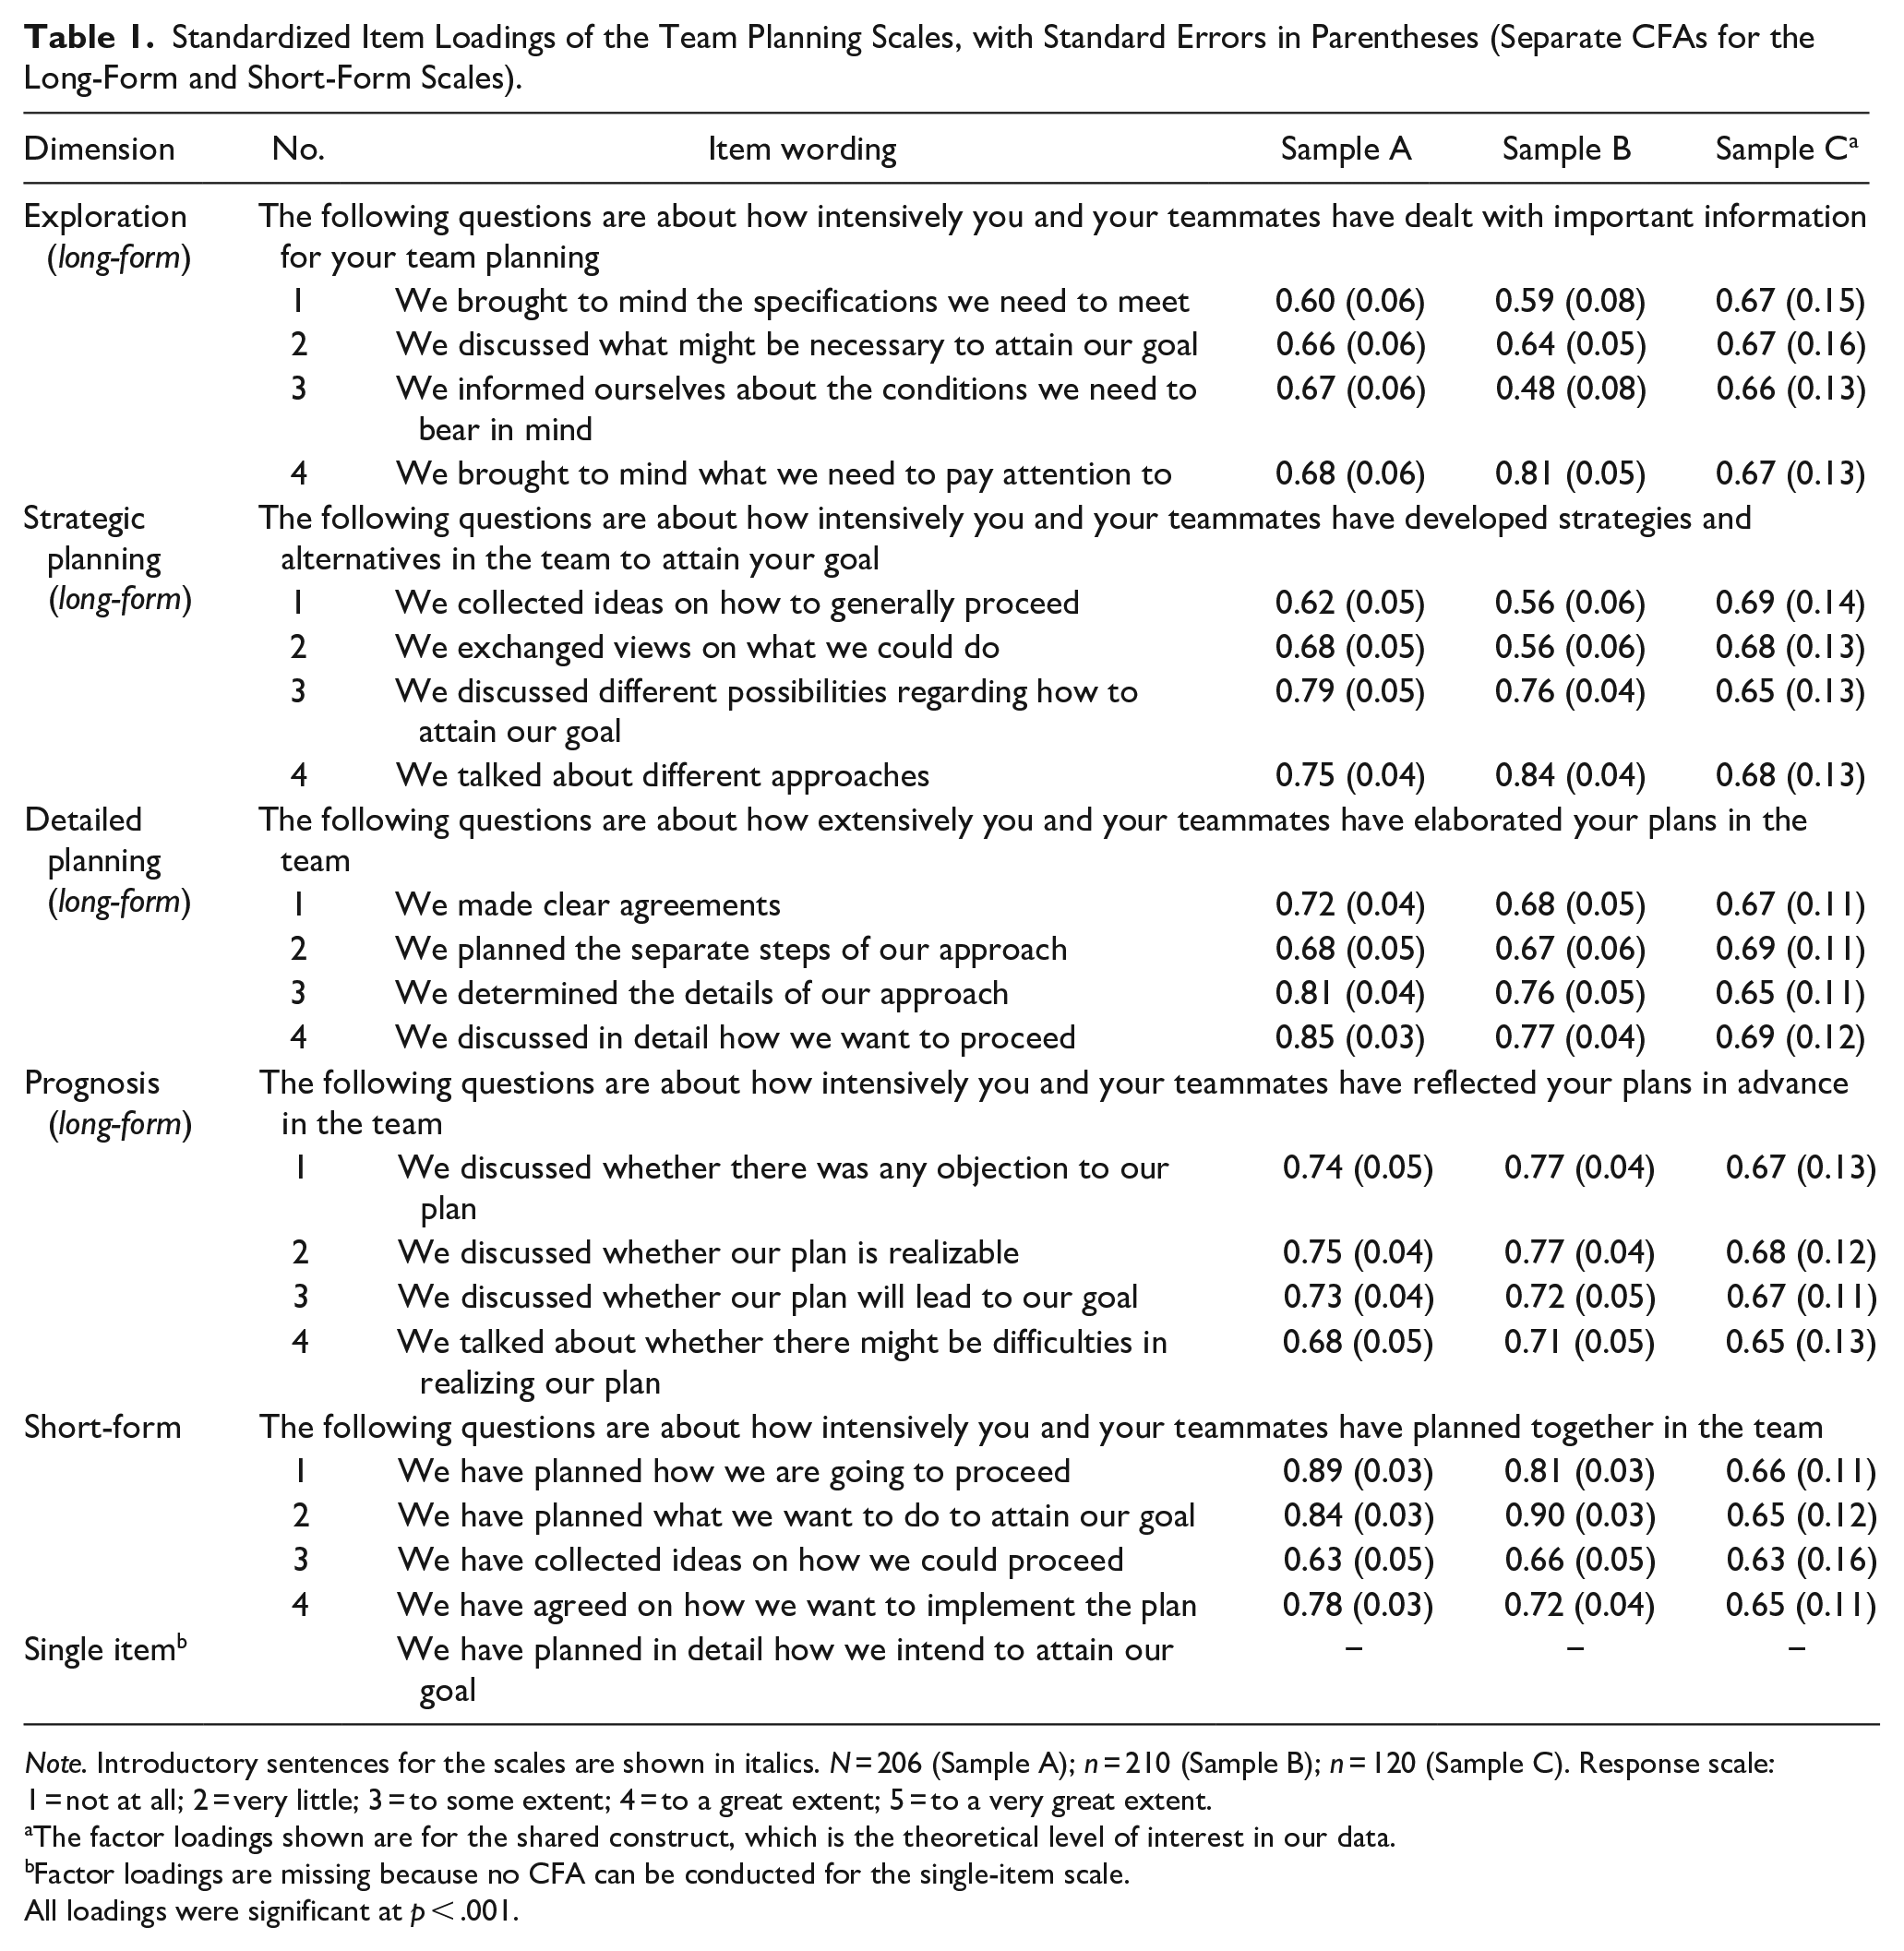
Note. Introductory sentences for the scales are shown in italics. N = 206 (Sample A); n = 210 (Sample B); n = 120 (Sample C). Response scale: 1 = not at all; 2 = very little; 3 = to some extent; 4 = to a great extent; 5 = to a very great extent.
The factor loadings shown are for the shared construct, which is the theoretical level of interest in our data.
Factor loadings are missing because no CFA can be conducted for the single-item scale.
All loadings were significant at p < .001.
Method
Participants and procedure
To examine the construct and convergent validity, we recruited 206 undergraduate students (Sample A: Mage = 23.30, SD = 5.24, 73.66% female, 42.93% psychology students) from a large public university in the North of Germany. In addition, snowball sampling technique was applied to recruit a second sample of 210 employees (Sample B: Mage = 38.19, SD = 13.80, 61.90% female) from different occupations (e.g., teacher, pharmacist, and banker). Participants either received a course credit (Sample A) or had the opportunity to win a 20 Euro voucher (Sample B). Data were gathered using a 20-minute online questionnaire in which participants first recalled an instance of teamwork undertaken by the team they currently worked in or had previously worked in. Participants were asked to rate the items on each scale.
Measures
Team planning
Team planning was assessed using the long-form scale (29 items for Sample A and 17 items for Sample B), the short-form scale (five items for Samples A and B), and the single-item scale. The number of items used with each of the two samples differed due to the consecutive procedure of item reduction (see below). For the multidimensional long-form scale and short-form scale, participants were given short descriptions of the underlying constructs to make it easier for participants to comprehend them (see Table 1).
Also, the 9-item scale developed by DeChurch and Haas (2008) was used to assess team planning. This scale measures three dimensions of team planning: deliberate planning, contingency planning, and reactive adjustment. Internal consistency was sufficient (Cronbach’s α ≥ .64), except for the dimension of reactive adjustment (α = .45 for sample A; α = .40 for sample B), which was below the acceptable limits for reliability (Nunnally & Bernstein, 1994). As there are limited grounds for using such heuristic guidelines (Albers et al., 2009) and the low level of consistency can be attributed to the small number of items (Cortina, 1993), we did not eliminate them. The response format used for all the planning scales was a 5-point Likert scale ranging from 1 (not at all) to 5 (to a very great extent).
Team reflexivity
Team reflexivity was measured by Van Dick and West’s (2005) German adaptation of West’s (2000) team reflexivity scale and a 5-point Likert scale was used, ranging from 1 (strongly disagree) to 5 (strongly agree). The internal consistency of the 8-item scale was very good for both samples (Cronbach’s α > .80).
Team reflection
The 16-item scale by Otte et al. (2016) was employed to measure team reflection, using a 5-point Likert scale ranging from 1 (strongly disagree) to 5 (strongly agree). The scale included quality and quantity aspects of information seeking and information evaluation. Reliability for all dimensions in both samples was from respectable to very good (all Cronbach’s α > .79).
Information sharing
Information sharing was measured using the German adaptation by Otte et al. (2016) of De Dreu’s (2007) 5-item information sharing scale; a 5-point Likert scale was used, ranging from 1 (rarely) to 5 (very often). Reliability was respectable, with Cronbach α values being above .69.
Data analysis
For both samples and each scale, we undertook a stepwise analysis (see DeVellis, 2017; Hinkin, 1998). To reduce the item pool of the long-form and short-form scales, we initially evaluated each item based on Sample A. We used Sample B to re-evaluate the remaining items and replicate our findings. We performed Kolmogorov–Smirnoff (KS) tests to check whether the scores for each item were normally distributed (Wilcox, 1997). We then considered the degree of separation and the item difficulty and excluded items with values that varied widely from the suggested limits (Hogan, 2013). Separate CFAs were conducted for each of the four dimensions of the long-form scale and for the short-form scale using MPlus 8.3 (Muthén & Muthén, 1998–2017). Items with factor loadings below 0.5, or with noticeable modification indices that could not be explained by theoretical assumptions (see MacCallum, 1986) were deleted. We maximized content validity by keeping as much variance as possible in the content of the items.
To check the construct validity of the long-form and short-form scales, we first ran a multigroup CFA across both samples with unconstrained parameters using the robust mean-adjusted maximum likelihood test estimator (Satorra & Bentler, 1994), as indicated by a significant KS test. For the long-form scale, the hypothesized four-factor model was compared to a three-factor model (i.e., exploration, planning, and prognosis) and a one-factor model. To evaluate structural equation models, we followed the guidelines provided by Hu and Bentler (1999) using the Comparative Fit Index (CFI; ≥0.95 good, ≥0.90 acceptable), the Tucker–Lewis index (TLI; ≥0.95 good, ≥0.90 acceptable), the standardized root-mean-square residual (SRMR; ≥0.08 good), and the root-mean-square error of approximation (RMSEA; ≤0.06 good). However, following the advice of Kenny et al. (2015), we chose not to calculate the RMSEA for models with small degrees of freedom (i.e., models for the one-dimensional short-form scale). Kenny et al. (2015) were able to show in a Monte Carlo simulation that this fit value is problematic and potentially misleading for models with small degrees of freedom. To compare the goodness of fit of the nested models, we used the scaled difference chi-square test statistic (Bryant & Satorra, 2012). Standardized factor loadings were interpreted using Comrey and Lee’s (1992) recommendations (λ > .71 = excellent; λ > .63 = very good; λ > .55 = good; λ > .45 = fair; λ < .32 = poor). Factor correlations were used to examine discriminant validity between each dimension of the scale, which should not be greater than .85 (Cohen et al., 2003). In addition, we checked for measurement invariance to ensure that the long-form and short-form scales were measuring the same construct across both samples, which provides further evidence of validity (Putnick & Bornstein, 2016). Specifically, we followed the guidelines of Widaman and Reise (1997) and compared the fit values of the nested configural models, the metric models, and the scalar models.
To check the internal consistencies of each scale, we used Cronbach’s alpha. The reliability of the single-item scale was calculated using the correction for attenuation formula and using the communality of the single-item scale obtained in a multiple-item factor analysis (Wanous & Reichers, 1996). 3 The communality of the single-item scale was determined by correlating this scale with the long-form scale (Dolbier et al., 2005).
We checked the convergent validity of each scale using bivariate correlation coefficients. For this purpose, we aggregated the two samples. This was only possible because the test for measurement invariance showed metric invariance, which means that the regression coefficients of sample A and B were comparable. 4
Results and discussion
The process of item reduction resulted in a final set of 16 items for the long-form and four items for the short-form scale. Summary statistics are presented in Table 2. The results of the multigroup CFA regarding construct validity are shown in Table 3. Hypothesis 1, which predicted that the long-form team planning scale would be best conceptualized by having four processes, was supported. The results of the CFA indicated that the four-factor model fitted the data reasonably well (χ2 = 155.14, RMSEA = 0.04, SRMR = 0.05, CFI = 0.97, TLI = 0.96), compared to the three-factor and the one-factor model, where the fit was, in each case, well outside the acceptable range. For the long-form scale, the factor loadings in both samples ranged from 0.48 (fair) to 0.85 (excellent). Factor correlations between all dimensions of the long-form scale indicated satisfactory discriminant validity ranging between .18 and .58, which is below the critical limit of .85 (Cohen et al., 2003). For the short-form scale, the goodness-of-fit indices indicated that the one-factor model fit the data reasonably well (χ2 = 41.86, SRMR = 0.05, CFI = 0.96, TLI = 0.93; Research Question 1). Factor loadings in both samples ranged between 0.63 (good) and 0.90 (excellent). The results for measurement invariance indicate metric invariance for both the long-form scale and short-form scale (see Table 3).
Correlations and Descriptive Statistics for Study Variables using Aggregated Data of Samples A and B.
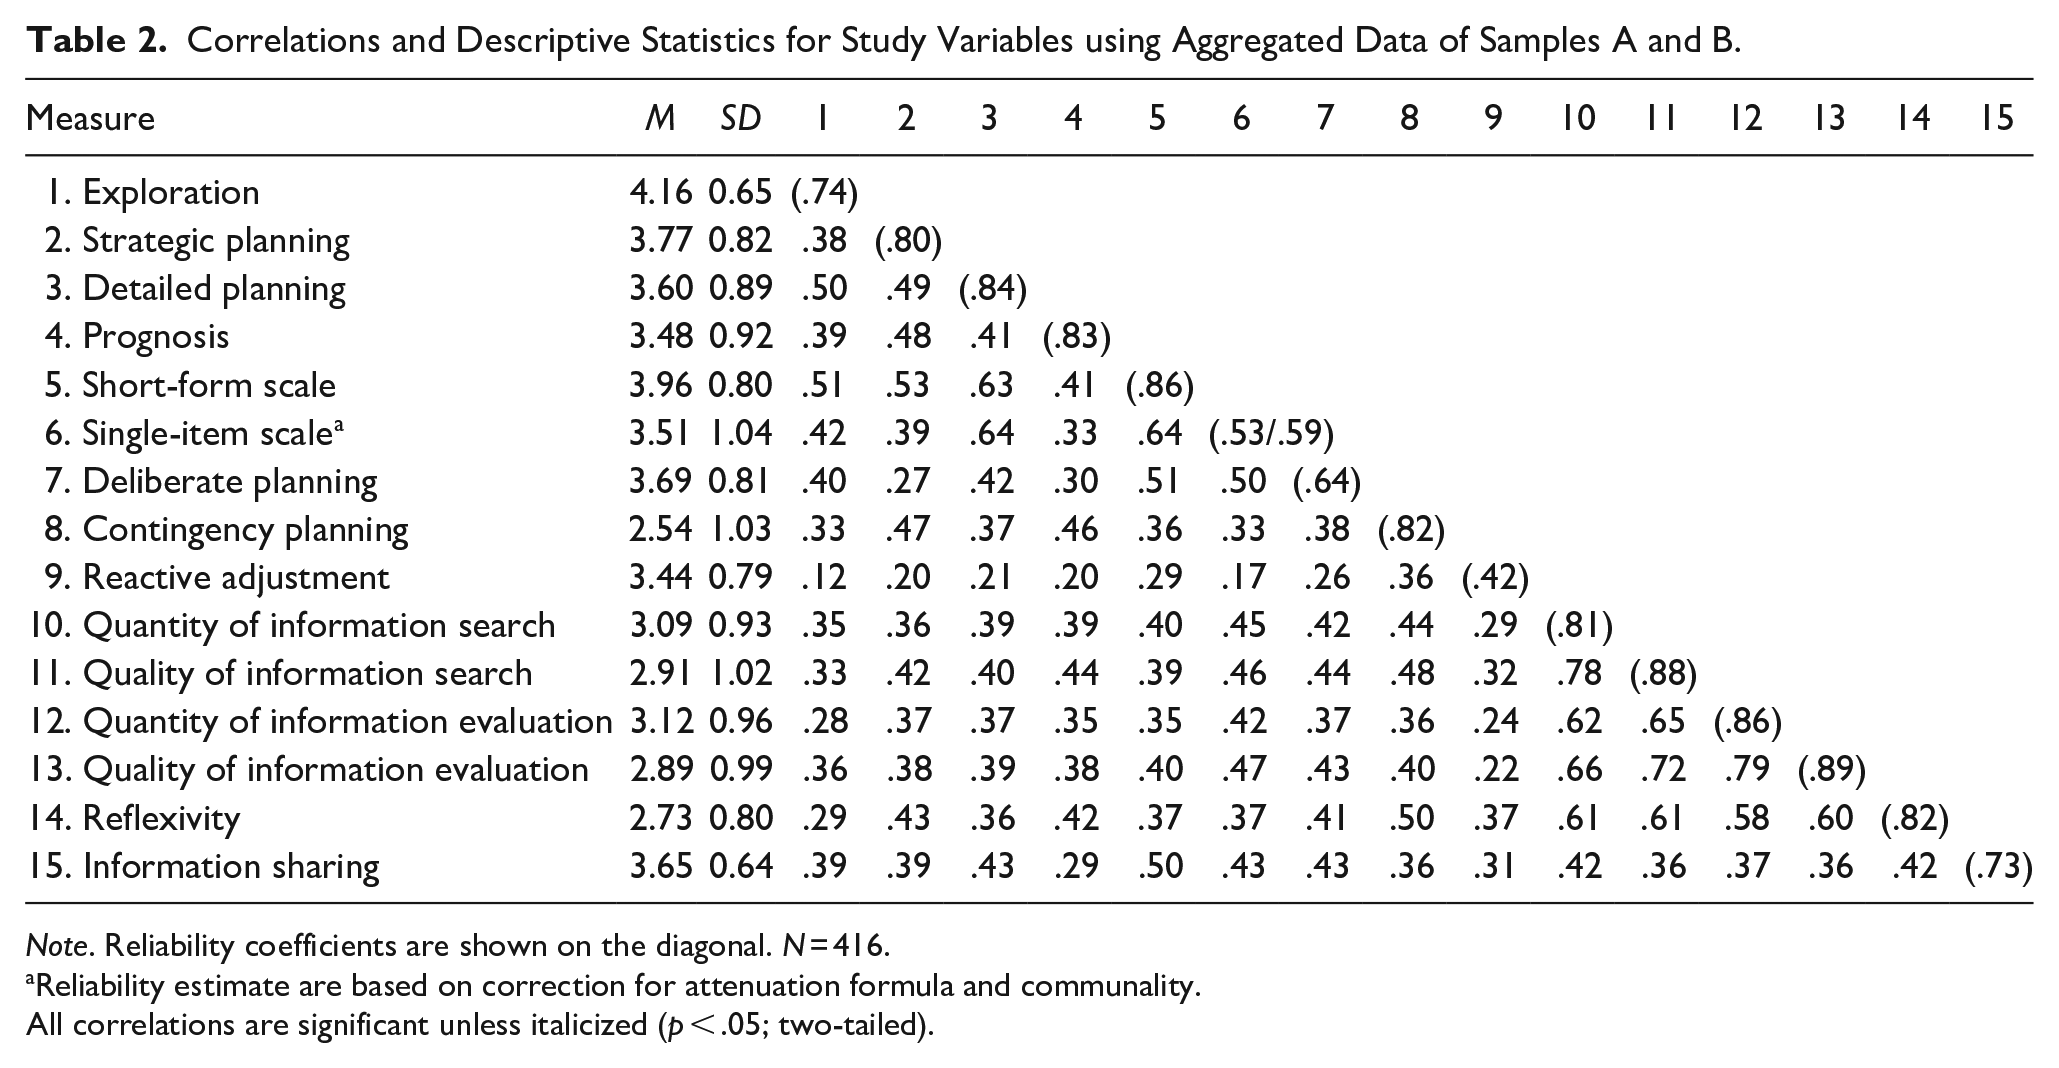
Note. Reliability coefficients are shown on the diagonal. N = 416.
Reliability estimate are based on correction for attenuation formula and communality.
All correlations are significant unless italicized (p < .05; two-tailed).
Model Fit Indices From the Long-Form and Short-Form Scales Using Aggregated Data from Samples A and B.
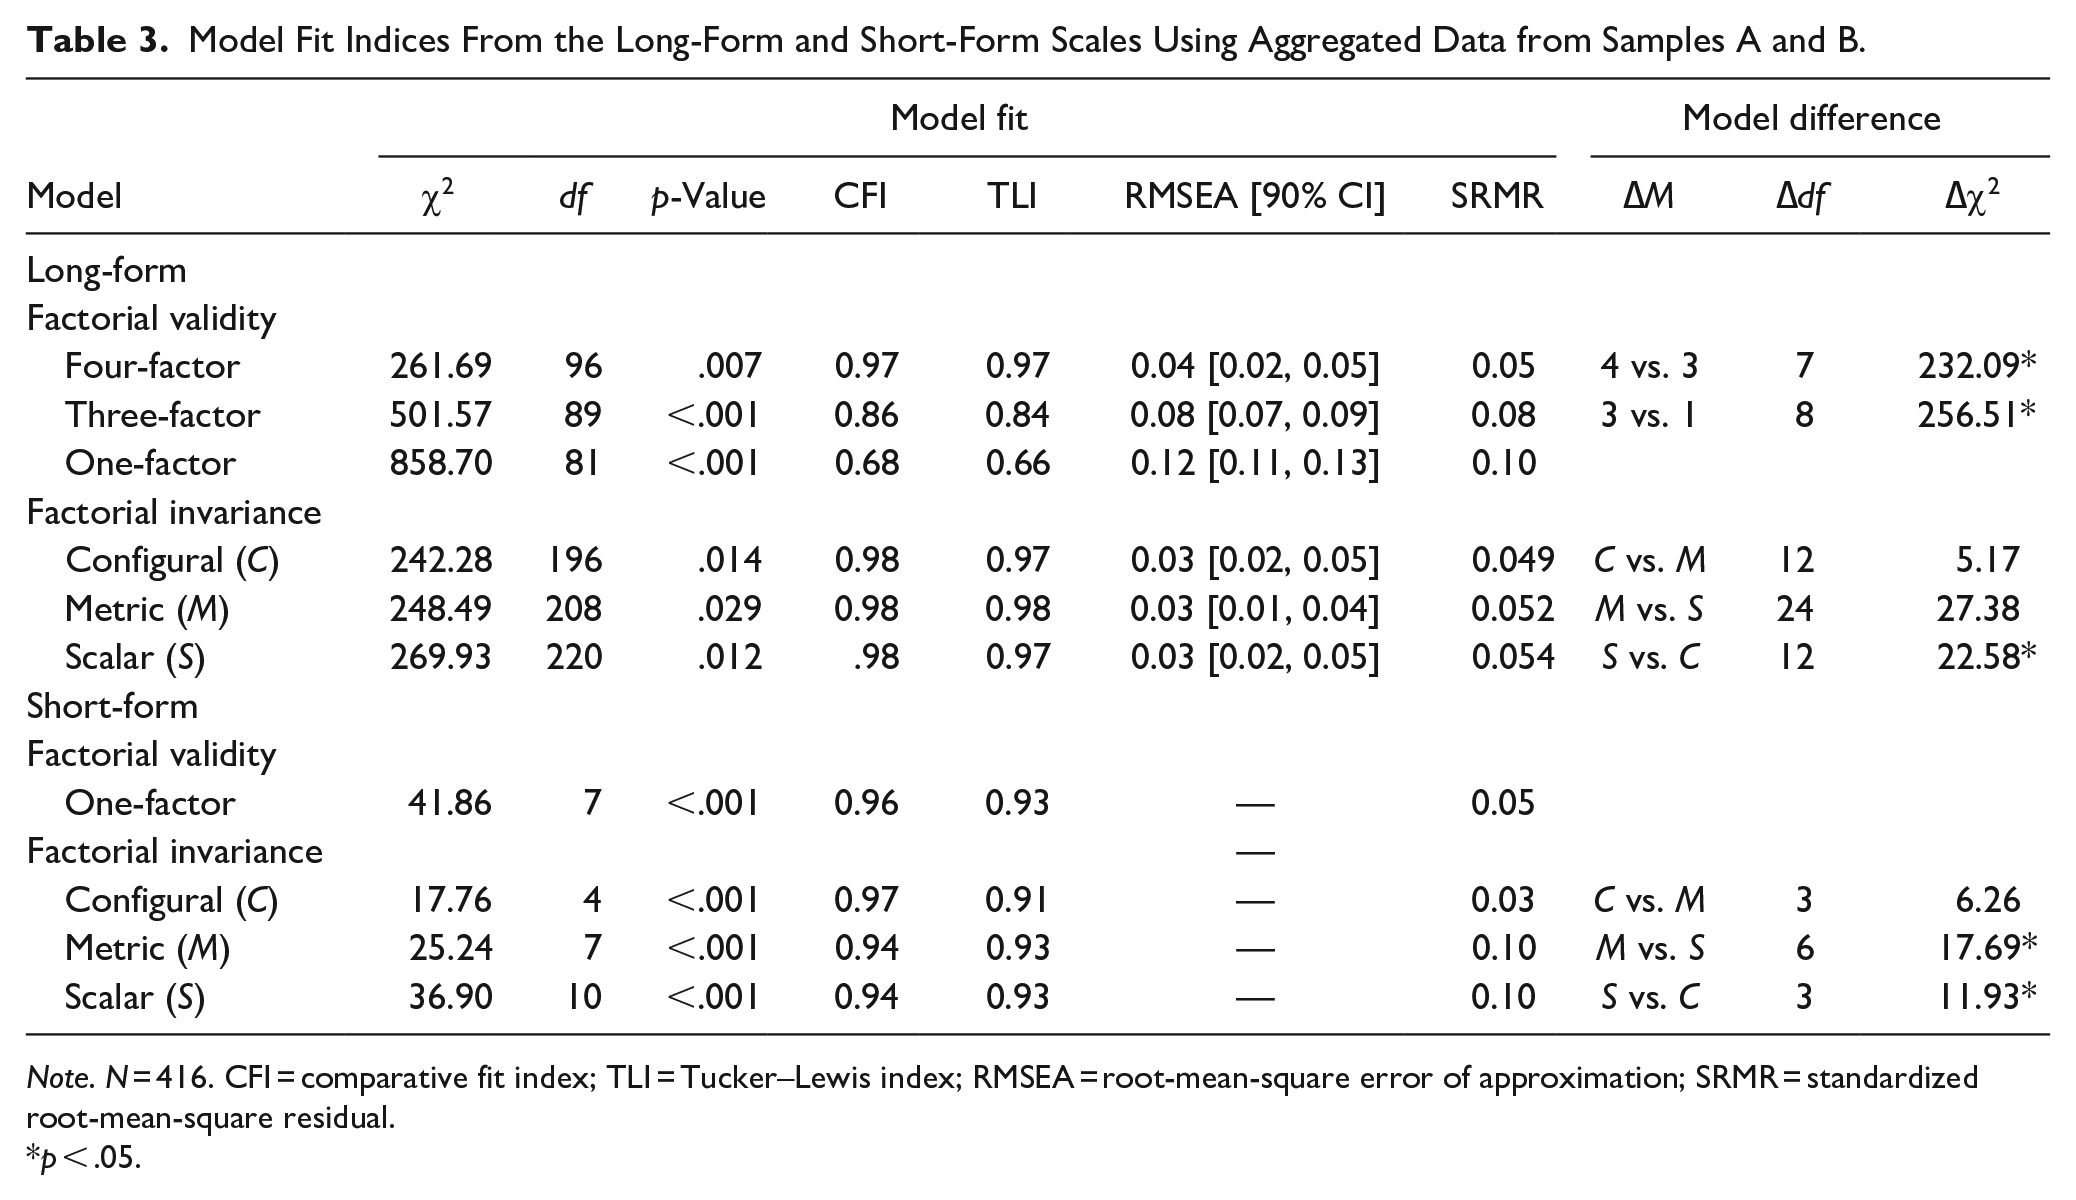
Note. N = 416. CFI = comparative fit index; TLI = Tucker–Lewis index; RMSEA = root-mean-square error of approximation; SRMR = standardized root-mean-square residual.
p < .05.
Regarding Research Question 1 (whether the new short-form scale has good enough psychometric characteristics), the internal consistency estimates were from respectable to very good for both samples for the short-form scale (α = .86). However, regarding Research Question 2 (whether the psychometric characteristics of the single-item scale are adequate), the reliability estimates of the single-item scale ranged from .39 to .66, below the level normally considered acceptable (Nunnally & Bernstein, 1994).
The results for convergent validity (Hypotheses 2–6) are displayed in Table 2. Hypotheses 2a to 2c, which predicted that there would be a positive relationship between the new team planning scales and the three dimensions of DeChurch and Haas’s (2008) team planning scale, were supported. All correlations for the long-form scale were statistically significant and positive (exploration: r = .12–.40; strategic planning: r = .20–.47; detailed planning: r = .21–.42; prognosis: r = .20–. 46). For the short-form scale, correlations ranged between .29 for reactive adjustment and .51 for deliberate planning. For the single-item scale, correlations ranged between .17 for reactive adjustment and .50 for deliberate planning (all p < .05). Hypotheses 3a to 3c predicted there would be a positive relationship between the three planning scales and West’s reflexivity scale (2000). Supporting Hypotheses 3a to 3c, correlations for the long-form scale ranged from .29 to .42; for the short-form scale they were .37 and for the single-item scale .37 (all p < .001). Hypotheses 4a to 4c predicted that there would be a positive relationship between the new team planning scales and reflection, and this is supported by our data. All correlations for the long-form scale were significant and positive (exploration: r = .28–.36; strategic planning: r = .36–.42; detailed planning: r = .37–.40; prognosis: r = .38–.44). For the short-form scale, correlations ranged between .35 (quantity of information evaluation) and .40 (quality of information evaluation). For the single-item scale, correlations ranged between .42 (quantity of information evaluation) and .47 (quality of information evaluation) (all p < .001). Consistent with Hypotheses 5a to 5c, positive relationships were found between the new team planning scales and information sharing. Moderate positive correlations were found for the long-form scale (r = .29–.43); the correlations for the short-form scale and the single-item scale were .50 and .43, respectively (all p < .01).
Conclusively, the internal consistency and the CFA results observed for the long-form and short-form team planning scales provide clear evidence that both scales are psychometrically sound. Moreover, these results are robust across different samples, which is an important requirement for use in a broad range of applications. Although the results for the single-item scale indicate unacceptable reliability according to conventional criteria (Nunnally & Bernstein, 1994), researchers (e.g., Fleeson, 2001; Nunnally, 1978) have argued that reliabilities above .50 are still meaningful and can be sufficient at an early stage of research. Similarly, Fisher et al. (2016) claimed that a reliability coefficient above .50 indicates more signal than noise, because it represents the proportion of the total variance that can be attributed to the true score rather than to error. Therefore, we deem the reliability of the single-item scale to be acceptable at this stage in the research. Furthermore, we established that there was metric measurement invariance for the long- and short-form scales, which indicates that each item contributes to the latent construct to a similar degree across the different samples. Importantly, the moderate positive factor correlations for the dimensions of the long-form scale indicate that it has sufficient divergent validity. This corroborates the theoretical assumptions about the structure and multidimensional nature of team planning proposed by our model. All the hypotheses relating to the nomological network were supported empirically, indicating good convergent validity. Admittedly, we relied exclusively on self-reported data, which may lead to common method bias. However, the use of well-validated scales and the experimental design we used (i.e. randomized presentation of the scales and instruction to respondents that there is no right answer) were intended to prevent this form of bias (Podsakoff et al., 2003).
Study 2: Team Planning and Predictive Validity
The purpose of Study 2 was to extend the findings of Study 1 (except those relating to convergent validity) using a different context and team sample. In addition, we examined the relationship between team planning and team performance (Hypotheses 6a–6c). For this purpose, we used a randomized controlled laboratory study to provide an objective assessment of team performance and to address possible concerns over common method bias, while also controlling for other factors that might affect planning behavior.
Method
Participants and procedure
We used mailing lists, social networks, notice boards, and personal contacts to recruit 120 undergraduate students from various programs at a large public university in the North of Germany (Sample C: Mage = 21.16, SD = 2.99, 81% female), whom we randomly assigned to 40 three-person teams. The teams took part in a modified version of the tower-building task (Goldberg & Maccoby, 1965), which allowed us to investigate their planning behavior and performance. This task has been used successfully in group experiments (e.g., Dirks, 1999), and we piloted it on five dyadic teams for validity purposes.
At the beginning, the teams were given written instructions describing the task. They were asked to work together to build the tallest tower they could with the materials provided and to do so in the shortest possible time. The teams had money at their disposal to buy various materials (e.g., paper, building blocks, and straws) to construct the tower. To make the paradigm more realistic, they had to consider various other factors (e.g., certain materials had to be used and the quantity of other materials was limited). We warned the teams that penalty points could be incurred for non-compliance with the rules. The construction time was limited to 7 minutes, which was found in the pre-study to be sufficient for high-fidelity towers to be built. The test room was divided into two zones: a meeting zone (for planning) and a construction zone (for assembling—no communication allowed), and this was clearly indicated by a line on the floor. Participants were instructed that as soon as a team member entered the construction zone, the 7-minute timer would start to count down, but that it would stop when no team member was in that zone. The team members were able to enter the construction zone as many times as needed. The experiment ended when the team had finished the tower or time had expired. Participants then completed the questionnaire, as described in the following section.
Measures
Team planning
To measure team planning we used the 16-item long-form scale, the 4-item short-form scale, and the single-item scale. As shown in Table 4, the interrater agreement r*wg (j) values (Lindell et al., 1999) were above the required threshold (Smith-Crowe et al., 2014), which allowed us to aggregate responses to the team level. The long-form scale showed a respectable to very good internal consistency, with Cronbach’s α ranging between .79 and .90. The short-form scale showed an internal consistency of .91, and the estimation of reliability for the single-item scale ranged between .53 (for attenuation formula) and .58 (for communality)—see Table 4.
Means, Standard Deviations (SD), r*wg (j) Agreement Indices, and Correlations for Study 2.
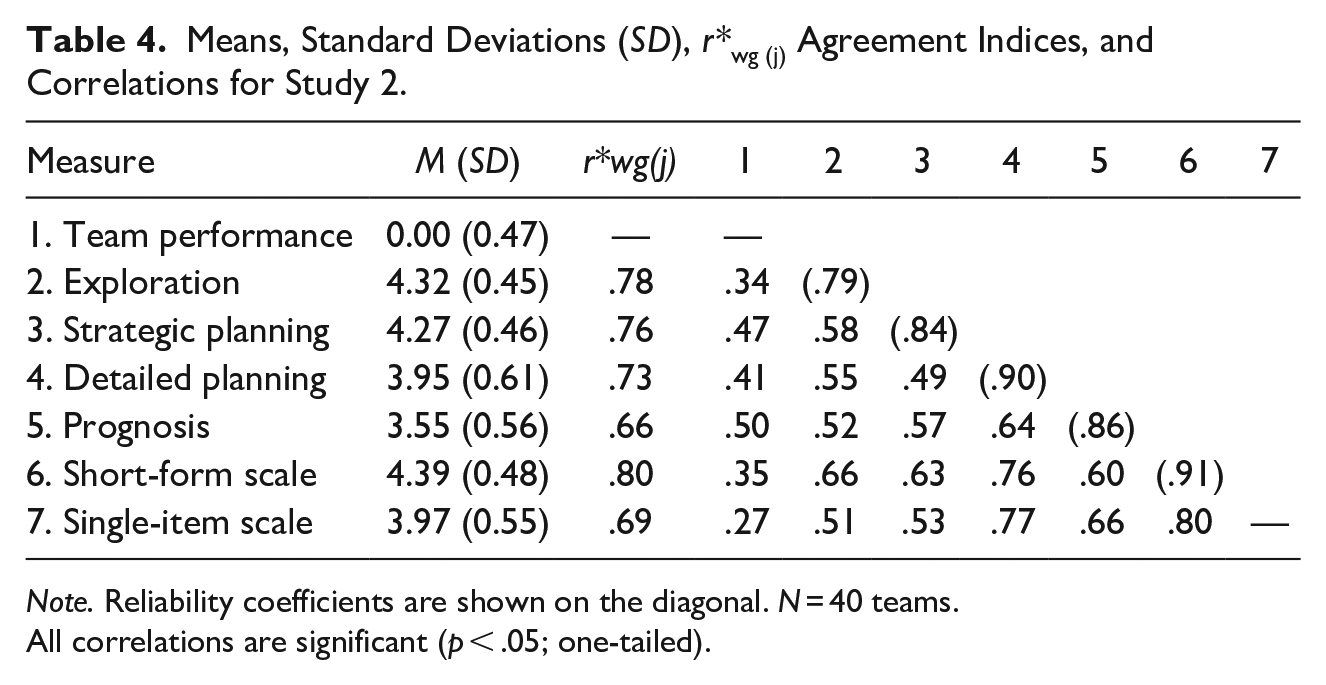
Note. Reliability coefficients are shown on the diagonal. N = 40 teams.
All correlations are significant (p < .05; one-tailed).
Team performance
We assessed team performance using four indicators: tower height, tower stability, time taken, and penalty points incurred. Tower height was measured in centimeters (M = 70.33, SD = 36.84), tower stability was the maximum force in grams with which the tower could be stressed without falling over when pulled at vertically (M = 708.88, SD = 941.65), and time taken was measured in seconds (M = 2,129.20, SD = 637.63). Penalty points for rule violations were assessed by the experimenter (M = 16.51, SD = 23.86). All indicators were z-standardized (time and penalty points were reversed) and then averaged to give a team performance score (SD = 0.47, range: −1.03 to 1.32).
Data analysis
Before testing the hypotheses, we re-examined the factorial validity of the long- and short-form scales using Bayesian multilevel CFA. For a more appropriate evaluation of the validity of the cluster-level shared construct (Stapleton et al., 2016; Stapleton & Johnson, 2019), we relaxed our assumptions by adding the confounding of within-cluster and between-cluster constructs at Level 1 and 2, respectively (for details, see Stapleton et al., 2016). Large values of intraclass correlation coefficients (ICC) indicated that multilevel analyses were appropriate (long-form scale: ICC = .04–.34; short-form scale: ICC = .00–.39; LeBreton & Senter, 2008). As recommended, when using small samples (Smid et al., 2020), we specified priors. We used informative normal priors for factor loadings (i.e., N (0.07, 0.05)) based on statistical recommendations for the quality of factor loadings (Hair et al., 2010), informative normal priors with a small variance (.001) for the cross loadings (Asparouhov et al., 2015), informative inverse Gamma (IG) priors for the residual covariances at Level 2 (i.e., IG (.001, .001); Smid & Winter, 2020), and informative inverse Wishart priors (dD, d) for the residual covariances at Level 1. For the latter, the starting value d was set to 10 because of the small sample size, and for the D values the residual variances estimated in a model without priors for residual covariances were used (see Asparouhov et al., 2015). All estimations were run with four independent Markov chain Monte Carlo chains, using the Gibbs sampler and 20,000 iterations. Model fit was judged using the posterior predictive p-value (PPP) and the posterior predictive checking 95% credibility interval (PPC CI). PPP values greater than .05 indicate an acceptable fit and values of around .5 indicate an excellent fit (Zyphur & Oswald, 2015). A PPC CI that includes a negative lower limit and a positive upper limit (Zyphur & Oswald, 2015) indicates a good fit. The stability of the models was evaluated by increasing the number of iterations.
Results and discussion
For the long-form scale, the four-factor model yielded a good fit to the data, as indicated by the PPP of .05 and the PPC 95% CI [−12.108, 145.368]. We found strong support for the shared construct, which is the theoretical level of interest in our data. For the hypothetical factor structure, all indicators (items) loaded correctly to the corresponding constructs with very good and significant factor loadings (see Table 1). The results did not change when the number of iterations was altered, and this provides further validation of the factor structure.
For the short-form scale, the proposed model also showed a good fit to the data, as indicated by the PPP of .182 and the PPC 95% CI [−12.041, 36.537]. We found strong support for the shared construct for the hypothetical factor structure, with all items loading correctly to the corresponding constructs with very good and significant factor loadings (see Table 1). Again, the results did not change when we altered the number of iterations. The means, standard deviations, interrater agreement, reliability values, and bivariate correlations for all the planning scales are shown in Table 4. Hypotheses 6a to 6c predicted that all three team planning scales would be positively related to team performance; the results (r = .34–.50, p < .05; r = .35, p < .05; and r = .27, p < .05) for the long-form, short-form, and single-item scale, respectively, support these hypotheses, and the correlations coefficients did not decline significantly with scale length. 5
Conclusively, the results provide clear support for the psychometric quality of the long-form and short-form scales and indicate that the theoretically assumed cluster-level shared construct exists. Again, the analyses for the single-item scale show that the internal consistency was below .70 but above .50, thus indicating meaningful reliability (Fleeson, 2001). Moreover, all the planning scales were predictive of team performance. However, team members’ self-reported planning data may have been influenced by their performance, as teams that knew they had performed well may have indicated that they had undertaken more planning (Frese et al., 2007). However, this explanation may not hold, since the teams did not receive feedback on their performance (i.e., height of tower, stability, and penalty points) until after they had completed the questionnaires and they were at no time able to compare their performance with that of other teams. Nevertheless, future research should seek to expand on the current findings by providing more convincing evidence regarding predictive and causal relationships.
General Discussion
The present study extends previous research on team planning in four meaningful ways. First, we proposed a process model of team planning that can be applied to a variety of contexts. Second, we developed a multidimensional scale that captures four function-oriented processes of team planning and that was shown to be reliable and valid across three different samples and contexts. Third, we developed short-form and single-item scales of team planning, which showed good to adequate psychometric quality in terms of reliability and construct validity. Fourth, we provided evidence that each scale was predictive of team performance.
Drawing on existing theories (Dörner, 2016; Hacker, 2005; Mumford et al., 2015), we developed a theoretical model of team planning that identifies four distinct processes: exploration, strategic planning, detailed planning, and prognosis. The results of our study corroborate our theoretical assumptions about the structure of team planning. Our model allows team planning processes to be described in more detail than was possible using previous approaches (e.g., Mumford et al., 2015) and enables focal points and patterns of team planning to be identified (Kennedy & McComb, 2014; Otte et al., 2018). A team’s focus on planning can be determined by analyzing the characteristics and duration of the individual planning processes (e.g., the extent of exploration), whereas its pattern of planning can be described as a sequence of different planning processes, each of a different intensity and duration (Marks et al., 2001). Thus, each team might have its own planning profile, which enables it to be distinguished more clearly from other teams and allows more accurate diagnosis and targeted interventions to be made.
Our model can also be integrated into other established theories of teamwork, thereby enhancing theory and allowing the development of more elaborate hypotheses. For example, West’s work on reflexivity (2000) would benefit from a detailed representation and modeling of the different team planning processes. Differentiating between these processes allows one to identify various types of reflexive behavior, which may be more or less beneficial for team performance (Konradt et al., 2016; 2021). It then becomes possible to make a more differentiated diagnosis of teams and to identify those that have not derived any benefits from reflexivity or that may even have experienced adverse effects (e.g., De Dreu, 2007).
The results of this study also demonstrated that the long-form scale of team planning was psychometrically sound in terms of its reliability, factorial validity, and convergent validity. These findings were robust across three different samples, an important requirement if the scale is to be suitable for use in a broad range of applications (Hinkin, 1998). The moderate factor correlations between the planning dimensions of the long-form scale also indicate that they have sufficient discriminant validity, and this provides general support for the notion that team planning is multidimensional. This enabled us to show that there is indeed a shared construct, as common characteristic of a team. The results from a recently conducted experimental study by Oldeweme et al. (2021) provide additional evidence of validation. The authors used the long-form scale to examine the effects of situational factors on team planning in two policy-capturing studies with undergraduates and employees and demonstrated additional positive findings regarding reliability and factorial validity, as well as moderate factor correlations.
The findings of the current study also extend previous research by providing two short-form scales to capture team planning, designed to improve cost-effectiveness and practicality (Woods & Hampson, 2005). Our findings suggest that both of our short-form scales have sufficient construct and predictive validity. The multiple-item short-form scale showed very good reliability across all three samples. It allows team planning to be studied in contexts where it is not practicable to use the long-form scale because, for example, it requires too much work of participants. Furthermore, the internal consistency of our 1-item scale is sufficient, at least at an early stage of research (Fleeson, 2001; Nunnally, 1978). Thus, we deem the single-item scale to be acceptable, especially considering the findings regarding its convergent and predictive validity. Nevertheless, a lack of reliability may reduce the power of statistical tests and may lead to lower estimates of effect sizes, making the scale less effective at predicting certain important outcomes (Nunnally & Bernstein, 1994).
Finally, consistent with previous theoretical assumptions (e.g., Mumford et al., 2015; West, 2000), each of our three scales predicted team performance. Predictive validity is important in terms of showing that the scales will have practical utility, that is, will be effective in predicting relevant behaviors and outcomes (DeVellis, 2017). This opens up a wide range of possible applications for our scales, including team diagnosis and team development (e.g., Van Dick & West, 2005). For example, managers could use the scales to assess whether increased team planning will predict team performance in a given context and could then provide valuable feedback to teams on their planning behavior.
In terms of practical implications, laboratory studies (Thürmer et al., 2015) have already shown that simple interventions that seek to encourage team planning, such as the collective “implementation intention” (p. 101), can have positive effects. However, our process model allows more specific and tailored interventions to be devised because it enables the planning behavior of poorly performing teams (e.g., how much time they spend on prognosis) to be analyzed in more detail. Based on this, targeted interventions can be made. The goal should not be to stimulate as much planning as possible, due to the time- and resource-intensive nature of planning. Rather, it should be to stimulate behavior that is appropriate for the context, and this can be determined through comparison with high-performing teams.
Limitations and Future Research
There are, admittedly, some limitations to the current study that should be addressed in future research. In terms of the methods, using individual team members to derive team assessments (Samples A and B) and student teams (Samples A and C) may limit the external validity of our results. Student samples may differ in their planning behavior from other non-academic populations because of socioeconomic differences. However, Belot et al. (2015) found that effects in experimental settings are similar for both student and non-student samples. Therefore, we assume that the use of student samples was not a serious concern. In addition, the sample size and the laboratory setting in Study 2 might limit the robustness of the inferences to be drawn from this study and its external validity. However, the small sample size may simply suggest that the test of our hypotheses is somewhat conservative, as we lack the statistical power to detect true effects, and results found in laboratory studies are often found also in field settings (Dipboye, 1990). Further research using larger samples and examining our hypotheses across different teams and organizations and for longer periods would help to address these limitations.
It might also seem to be a limitation that our scales focus on the quantity of the teams’ planning without considering the quality. Research has demonstrated that it is the quality of team processes, rather than the quantity, that predicts team outcomes (Otte et al., 2018; Smith et al., 1990). Future research should thus include data on the quality of team planning. Furthermore, the quality of a planning process could also be captured and assessed by examining patterns of behavior and interaction (Bales, 1985; Farley et al., 2018; Oldeweme et al., 2021).
Conclusion
The present study presents a process model of team planning, in which team planning is split into the four processes of exploration, strategic planning, detailed planning, and prognosis. This model provides the methodological basis for developing and validating a long-form scale, a short-form scale, and a single-item scale that enable valid and reliable assessments of team planning to be made. In sum, our work provides a solid foundation for more elaborate theories of team planning processes and offers valid and reliable scales for investigating these processes.
Footnotes
Acknowledgements
We are thankful to Mara Santer, Alice Wang, Patrick Hattenberg, and Kevin Hattenberg for their collaboration in the data collection process.
Data Availability
The data that support the findings of this study are available from the corresponding author upon reasonable request.
Declaration of Conflicting Interests
The author(s) declared no potential conflicts of interest with respect to the research, authorship, and/or publication of this article.
Funding
The author(s) received no financial support for the research, authorship, and/or publication of this article.