




Abstract
Background.
Aim. The key research questions are as follows: Can
Method. A case study is used to
Results. This
Conclusions. The results affirm the game’s effectiveness as an educational tool for
Recommendation. This research suggests that properly incorporating policy games into the curriculum can enhance students’ learning in transportation planning and settlement structure.
Keywords
Settlement, transportation, and society are related in complex, varied, and context-specific ways. This research represents an attempt to use the expert simulation game Human Settlement and Transport, HST, to educate and train transportation students and professionals with the transportation modeling software VISUM. The researchers attempt to determine if transportation models can be used as a didactic tool for teaching causal chains in land use and transportation, and to understand how transportation modeling enhances students’ understanding of transportation planning and settlement structure.
In order to evaluate the game’s ability to simulate the complexity of actual human settlement and transportation, the researchers focused on self-reported learning and how the HST expert game encourages students to cultivate knowledge. HST successfully replicated complex and context-specific scenarios that actual urban planning committees might face, and participants reported discovering interrelations between settlement, transportation, and society similar to those found in the relevant academic literature. The results affirm the game’s effectiveness as an educational tool for transportation engineering, urban planning, and transportation modeling students and professionals. As a result, the researchers summarize that properly incorporating policy games into educational curriculum may enhance students’ ability to grasp the intricacies of transportation planning and settlement structure.
Background
Since the 1950s, the Swiss population has nearly doubled in size, reaching a total of 8.1 million citizens as of 2013. Based on a forecast of the Swiss Federal Office for Statistics, in the year 2060, Switzerland will have 9 million inhabitants. 1 From 1994 to 2010 the distance traveled daily has increased by 25% (BFS/ARE, 2012). In Switzerland, urban sprawl has more than doubled between 1935 and 2002 (Schwick, Jaeger, Bertiller, & Kinast, 2010). Urban sprawl in Switzerland is a continuing phenomenon. One-fourth of Switzerland’s building area is outside of the official construction zone. Infrastructure costs in Switzerland are rising. In 2010, the cost of constructing and maintaining roads and rails was 9.5 billion Swiss francs (CHF) (ARE, 2012). These figures correspond with recent discussions regarding overcrowded trains, congested highways, the billions of Swiss francs invested in transportation infrastructure, and mobility pricing in Switzerland. They also reveal the relevance of the study of the interaction between human settlements, transportation, and society.
Urban sprawl, growing land use, and compressed settlement patterns make the interconnections of settlement, transportation, and society extremely varied, complex, and context-specific (Priemus, Nijkamp, & Banister, 2001). The School of Business at the Lucerne University of Applied Sciences and Arts, together with PTV Group Karlsruhe, developed the expert game HST to provide experts and students with insight into these interactions. This policy game is ideal for transportation students and professionals in training and continuing education settings. Players slip into the role of a planning committee tasked with jointly developing an implementation strategy for human settlement and transportation infrastructure. The objective of this game is to optimize the system according to the three dimensions of sustainable development, with a particular focus on traffic-coordinated spatial planning and space-coordinated transportation planning.
Transportation modeling is an expert field practiced by trained professionals. In this research, the authors adopted transportation modeling as an educational tool in training courses and continuing education classes, using the transportation modeling software VISUM. The authors accomplish this goal using an expert game that allows participants to apply and experience transportation modeling software without prior experience in complex transport modeling.
The field of transportation studies rarely uses simulation and computer-based game models (for an overview see Raghothama & Meijer, 2014). Moreover, games based on transportation modeling software have not been systematically applied and rigorously studied. This area of research is almost non-existent, and to the authors’ knowledge, no systematic published material discussing the topic exists. As a result, this article presents a discussion of the game framework. The authors’ working hypothesis is that players can discover interdependencies between settlement structure and transportation.
The key research questions are as follows:
Can transportation models be used as didactic tools to improve the teaching of causal chains between land use and transport?
Why and how does transportation modeling enhance students’ learning in transportation planning and settlement structure?
What are the self-reported learnings and how do they vary from conventional didactic tools, such as chalk-and-talk teaching, case studies, closed exercises, and desk research?
The authors first discuss the literature of policy games and their ability to address the interconnections of human settlement, transport, and society. Following this discussion, they describe the HST expert game. The authors then present a case study of this expert game’s use as a didactic tool during a one-day seminar with six participants. All seminar participants are employees of a Swiss rail company. Participants split into two teams of three players for the simulation game exercise. The results of each team’s simulations are examined in the section entitled Case Study: Implementation of the expert game with two groups. The authors compare the respective decisions made by each team and provide conclusions based on the research questions in the Discussion and Outlook section.
Literature Review
In transportation research, urban spatial density is very important to the discussion of travel. According to Cervero and Kockelman (1997), the dimensions of density, diversity, and design are the main drivers of the spatial environment that influence travel. The urban form indicator that has received the most attention is urban density. Various kinds of density have been used to measure the effect of exogenous variables and their influence on travel. Chatman (2008) found that housing density is strongly related to activity frequency and Vehicular Miles Traveled (VMT). Su (2010) found that population density and urban congestion have a negative impact on travel. According to Peng and Lu (2007), the number of trips increases with employment density. Insights such as these make transportation modeling an important research and decision-making resource for transportation professionals and politicians (see Axhausen & Gärling, 1992; Ortúzar & Willumsen, 2009; Schnabel & Lohse, 2011). The interrelation of human settlement and transportation also gathers high interest in modeling (see Felsenstein, Axhausen, & Waddell, 2010; Löchl, Bürgle, & Axhausen, 2012). For the case of Switzerland, the analysis of the interdependencies between transportation infrastructure and spatial development is a growing research field (Tschopp & Axhausen, 2007; Vrtic, Weis, & Froehlich, 2013).
Expert game planning and expert games are potentially effective didactic and methodical learning tools for policy making. 2 Both have a long history of use in educational settings (see Adams, 1998, for teaching and learning with SimCity 2000, Starke, 2010). Currently, expert games exist for an extensive range of topics in very different academic disciplines, albeit often with an economic focus (Faria, Hutchinson, Wellington, & Gold, 2009; Lean et al., 2006; Schwägele & Zürn, 2012).
In the field of transportation, several land use planning and policy making games were developed in the last decade (for an overview see Raghothama & Meijer, 2014). Van den Hoogen and Meijer (2014) explore the advantages and disadvantages of ProRail (the Dutch railway infrastructure manager) for the innovation of creating processes. They found that gaming simulation is an appropriate tool for planning a concerted transition in a multi-actor setting. Huang and Levinson (2012, p. 141) observed that board games improve “students’ understanding of the planning process, network deployment, and practical issues, and their ability to form opinions about transportation planning.” Watcharasukarn, Krumdiek, Green, and Dantas (2011) describe a virtual reality role-playing game that was developed as a survey tool to collect travel behavior data and explore and monitor travel behavior adaptation. Johansson and Küller (2002) describe intermediate stages in the development of Traffic Jam, a computerized gaming simulation for children and adolescents. Mayer, Bockstael-Blok, and Valentin (2004) assume that simulation modules can enhance complex decision making between stakeholders in infrastructure planning and design. Mayer’s (2009) article examines the foundations of gaming and related concepts, such as policy exercises and serious gaming, in a public policy-making context. Duke (2011) provides an observer’s perspective on the evolution of policy simulations. Kopainsky, Pedercini, Davidsen, and Alessi (2010) shows that simulation models provide decision support to long-term planning processes. Torres and Macedo (2000) show how the card game LEARNING SUSTAINABLE DEVELOPMENT is intended to create awareness of and explore attitudes toward environmental conservation and urban development.
Scientists and practitioners in the fields of transportation engineering, transportation planning, and urban development face multiple challenges. They are required to assess the impact of new transportation infrastructure on space, society, and the environment, among other tasks (Banister & Berechman, 2001; Givoni, 2007). These interactions and their possible consequences are often very complex, and some are only recognizable years later. This complexity makes it difficult for experts to predict the corresponding developments in a region. The idea of the HST expert game is to convey such complex processes in a comprehensible and playful manner during a simulation.
Simulation Games as a Didactic Tool
Simulation games are often used to replicate idealized versions of real processes (Crookall, Oxford, & Saunders, 1987; Hitzler, Zürn, & Trautwein, 2012). They show a simplified picture of reality but address an authentic and complex problem. Such games should realistically simulate processes that would take too long or that are otherwise impossible or undesirable (worst-case scenarios).
The implementation of a simulation game is an experiential form of learning (Preusser, 2007). The player actively processes real phenomena; he or she makes a decision of how to proceed and, as a result, faces the consequences of their choices. Thanks to the error-friendliness of simulations, planners can explore the possible consequences and impact of alternative forms of action without direct risks to the general population or the game’s players. The playful component increases the participants’ levels of intrinsic motivation and interest in the underlying subject. This experience-based learning starts with the action and culminates in the generalization of the results and their relevance to reality. Realistic games impose practical constraints that may include a shortage of resources such as time and money, a conflict of interest held by people in multiple roles, and limited information. They create a situation in which players must achieve their set objectives through a chain of decisions. Following this logic, an expert game is roughly divided into four different phases:
Participants learn about the initial problem facing their fictitious country, as well as their objectives and roles. Knowledge of the subject matter is beneficial, but players can learn during or immediately prior to play if necessary.
Participants identify with their intended roles and familiarize themselves with the functionality of the game as well as the relevant scenarios in the model.
Participants develop a strategy and possible measures for achieving their objectives. The players determine which measures are potentially purposeful or beneficial and implement them at this stage.
The results are analyzed, visually documented, and placed into a realistic context. The knowledge gained from players’ reflections at this stage is used later in the game to make corrections and optimize performance.
The final phase in the HST, which is central to participants’ learning, is termed as debriefing. This period of reflection entails more than recounting gameplay. Debriefing requires comments and critique from other participants or moderators.
The Expert Game HUMAN SETTLEMENT AND TRANSPORT (HST)
The researchers designed HST for players who already have some experience with the nexus of human settlement, transportation, and society. In the game, various scenarios can be reenacted for different applications according to the target audience’s requirements. The players participate in a planning committee whose decisions have direct consequences on traffic demand, settlement dynamics, and other socio-economic developments. The participants analyze the problems of the fictional world and assume the role of transportation and settlement planners. Among other tasks, they may develop transportation infrastructure; provide new residential, commercial, and recreational areas; or invest in better pedestrian and cyclist networks in the city center.
Each round, the game supervisor determines how the game should develop, by way of political assignments. These tasks can include increasing the share of public transit on the modal split or equity ratio of trains and buses. The overall target system always serves the sustainability triangle, which combines the dimensions of the economy, society, and the environment.
In transportation economics, the term economic sustainability refers to the provision of an efficient transportation infrastructure. In the discussion of state finances, it implies effective provision of services and the promotion of competition, the economic viability of transportation including external costs, and the optimal use of existing infrastructure. Social sustainability describes a national public service that considers the needs of those who have difficulty in gaining access to transportation. Additionally, the term describes the protection of the health and well-being of people, a reduction in the number of accidents, and socially acceptable behavior of transportation companies. Environmental sustainability means the reduction of various environmental stresses on a long-term level and the reduction of energy consumption, especially non-renewable energies. According to each play session’s objectives, participants independently define the indicators for the sustainability dimensions.
Players attempt to achieve their objectives via their game strategy. For example, they must determine whether they want to develop the metropolis or the peripheral region. If they opt to strengthen the metropolis, problems with congestion may occur – as they do in the real world. The player must then decide how to deal with motorized personal transportation and public transit. Do they want to provide an expensive yet well-developed public transit system or relieve congested roads by building new highways? The participants must also make settlement-specific decisions; is it better to mix residential, commercial, and recreational areas or follow the more lucrative principle of separation? The principle of separation implies the concentration of industrial and business areas with good transportation links on the one hand and compacting residential areas with shopping and recreational centers on the other.
In a realistically modeled world, the HST expert game provides insight into the transportation and space planning options that shape the development of traffic and the quality of life of an area. Players have the ability to leave their everyday roles in transportation planning and spatial development, transportation companies, politics, or academia to assume another function or to argue from a different perspective. Players are granted this opportunity in a protected setting. For example, in the game, a participant who normally advocates in favor of strong public service was commissioned to increase the cost recovery of rail and bus systems. The game’s design allows the players to step outside of their actual career roles to assume new positions within the game.
The expert design of the game allows the game supervisor to vary the situation as they wish for different applications such as for rail companies, city authorities, or federal offices. Possible scenarios include a development setting without significant rail traffic but with high accident rates, a low life expectancy, and high rate of fertility. Conversely, a highly developed industrial region with a low birth rate, a well-developed rail system, and high public debt due to the expensive infrastructure, as well as high traffic volume, can also be implemented.
Game Design and Structure
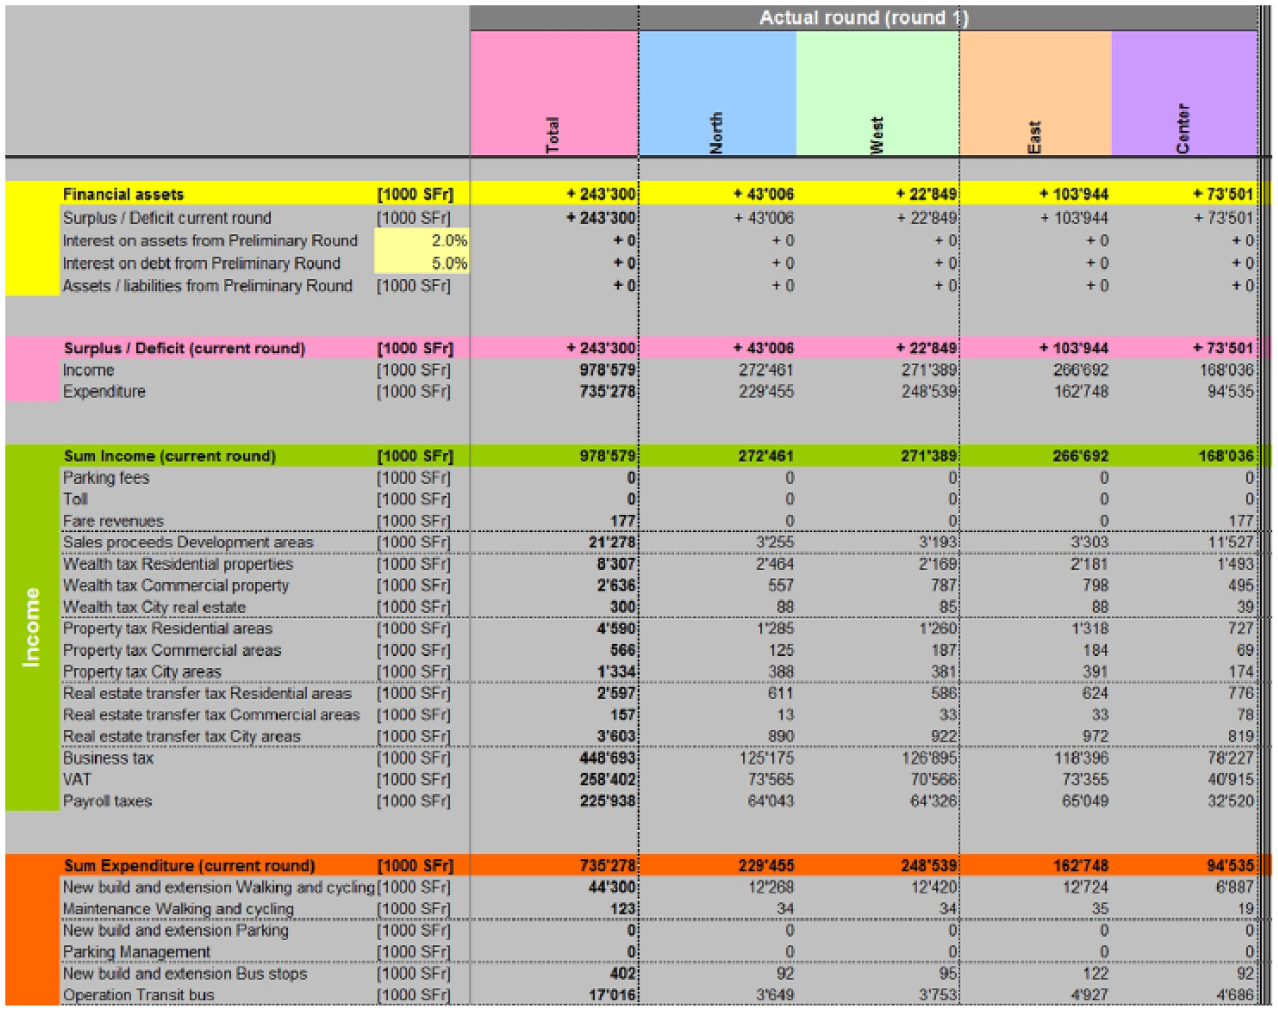
The expert game HST is a model world with 28 communities, also called ‘traffic zones.’ In the game, zones are divided amongst provinces, each with a large capital. The game consists of a Microsoft Excel workbook (See Figures 1 and 2) that is linked by Visual Basic for Applications to VISUM, a leading software package for modeling transportation (See Figure 3). The players plan highways, regional roads, railways, bicycle paths, and/or subway lines and enter these directly into VISUM.

Screen shot of actual gameplay in HST.
Screen shot of an actual Excel file used during the game (Extraction).
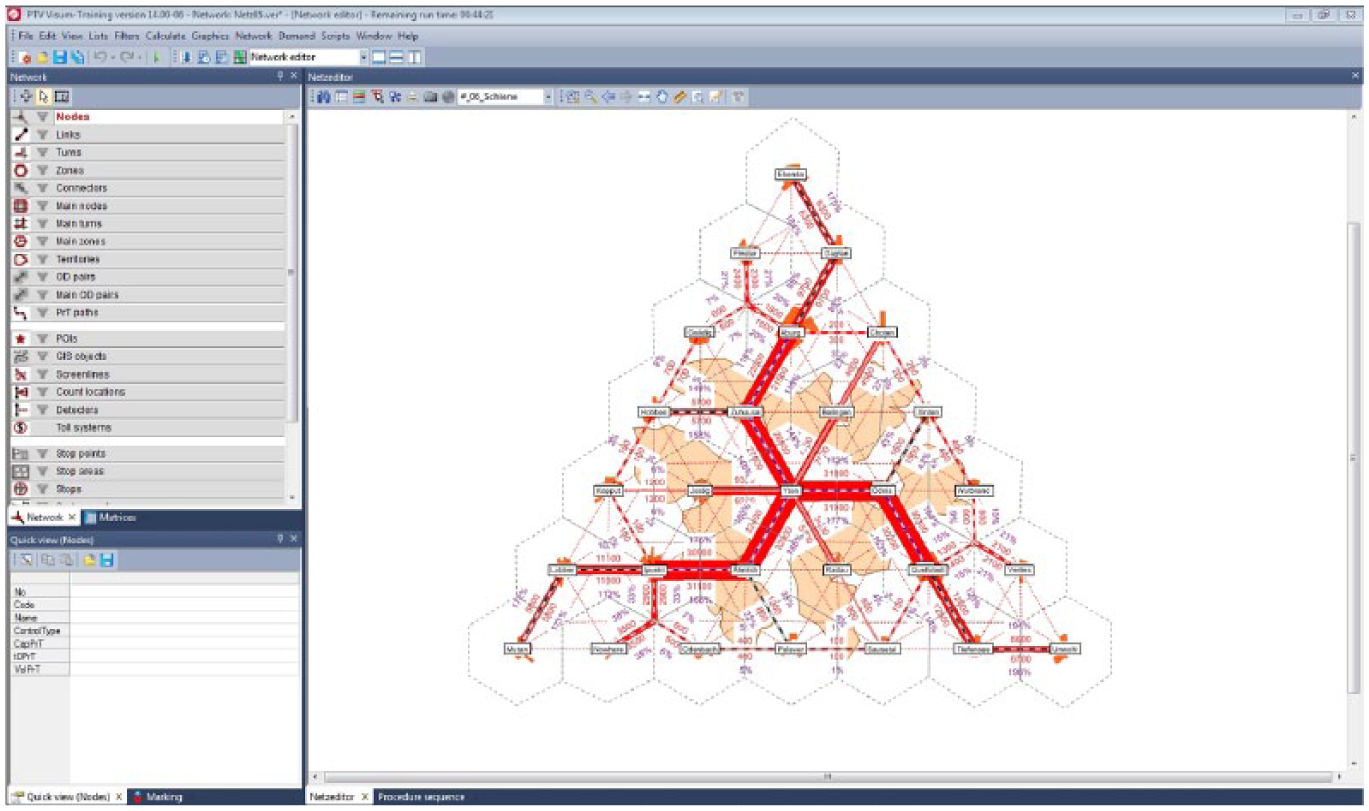
Screenshot of the VISUM interface.
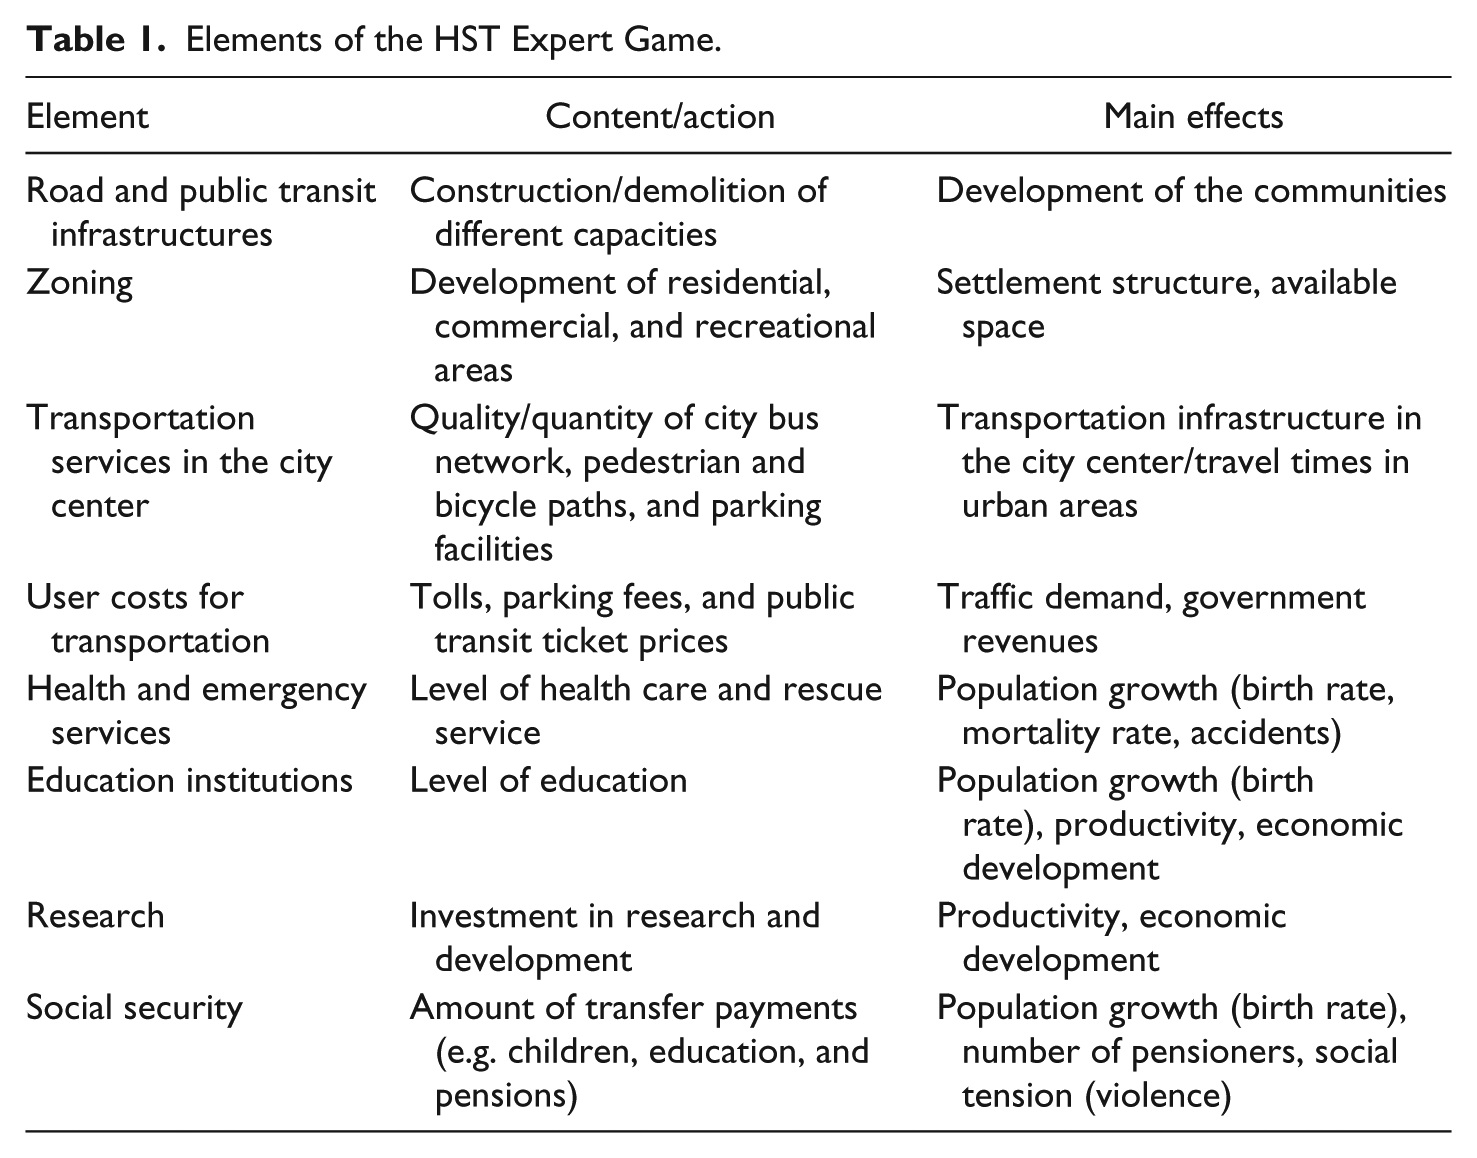
Users can determine additional properties of the transportation system in the Excel file. Examples of these properties include urban transportation services like walking and bicycle paths, city buses, and parking spots, as well as the amount of tolls and user charges for roads and public transit.The determination of these properties can help to influence the attractiveness of individual vehicles and involve road users in sharing the costs. The game identifies residential, commercial, and recreational areas as spatial planning measures, which can also contribute to the development of the simulated locale. Players can change additional economic, social, and environmental parameters. These include investment in education, health, and emergency services, social security, or research and development, amongst others. The variables affect the population structure, the attractiveness of towns, and the economic potential. As a result of changes affecting these variables, traffic flows and settlement development are also altered (See Table 1).
Elements of the HST Expert Game.
The design of the game is based on actual demand for public transit, non-motorized traffic, and personal transportation, as well as principles of the gravity approach (see Ortúzar & Willumsen, 2009; Schnabel & Lohse, 2011 for further information). The calculation of demand accounts for the structural data of the settlements (inhabitants, jobs, and recreational facilities) as well as for existing transportation services, utilization, and user costs (ticket prices and tolls). In the transportation network of VISUM, the calculated demand is transferred to the individual routes. This results in the traffic load and/or the utilization of existing capacity and average speeds in the overburdened network.
Background Calculations and Modeling
Transport model
PTV VISUM includes a model for the calculation of travel demand. 3 The calculation of demand for road and public transportation (buses and trains) and non-motorized traffic (pedestrians and cyclists) uses structural data. These data include population, jobs, and shopping and leisure facilities, as well as the existing roads, buses, and railways. User costs, including fares, tolls, or fuel taxes, are also taken into account. Excel and PTV VISUM run numerous realistic background calculations.
25 types of routes, representing different roads and railway – from bike paths to motorways, and from tram rails to express train lines – illustrate the transportation network. Speeds, capacities, and services, as well as costs of construction, maintenance, and operation, are adopted and calculated as is usual in traffic planning.
The transportation network allocates the calculated demand. This calculation allows the participants to analyze the effects of traffic load, utilization of capacity, average speeds, transfer passengers within public transportation, and traffic relations.
The game calculates the number of accidents based on the traffic load, route type, and location (urban /overland). The consequences of accidents (deaths, injuries, property damage) depend on the speed and the quality of health and emergency services.
Within the game, calculating traffic demand follows the same procedure as creating a real traffic model for traffic planning projects (Rickborn, 2012). The research team automated the steps to speed up game play. A four-step model is the basis of the traffic calculation (see Ortúzar & Willumsen, 2009).
First, the resistance between all locations is calculated. The resistance is total travel time, consisting of the actual time on the road and entering/exiting traffic. The calculation of resistance includes transfer time for public transportation. Additionally, traffic volume is calculated and classified for the population. Workers, students, and pensioners all have different habits when it comes to their destinations and preferred means of transportation (trip generation).
Second, destinations for the trip model are chosen. Each group is assigned a destination. For example, students go to schools and workers go to their jobs (trip distribution).
Third, the traffic flows are divided among the various modes of transport (mode choice).
In the fourth and final step (route assignment), the traffic flows in the transportation network are adjusted, and alternative routes are tested and accordingly loaded. This procedure is repeated several times until the traffic load is balanced.
Finally, the state budget is mapped with revenues from taxes and vehicle fees and expenditures on transportation infrastructure, development, education, and healthcare. These calculations produce the results of the game.
Migration model
A migration model takes into account the attractiveness of settlements (availability, educational and health institutions, and traffic) as well as the life cycles of the model population. Population growth is calculated using realistic parameters for birth and death rates. The migration model in this game simulates residential location decisions at three different times in the life of the population:
On reaching 20 years of age (starting a family, studying)
On reaching the age of 40 (professional and social advancement)
On reaching the age of 60 (retirement)
The game calculates net migration between locations. Since a round covers a period of 3 years, on average about 10% of the population reaches one of the three decision points in each round. The remaining sections of the population are assumed to be sedentary.
The game calculates potential departures for each location. Departures are determined using the population in each age group and the reciprocal value of the attractiveness factor of the location. The less attractive a location is, the greater the proportion of people who want to move away. A pool is formed for each of the three age groups. The people from this pool are distributed according to the attractiveness of the location. The game assesses a location’s attractiveness based on the quality of housing, transportation accessibility, and education system, as well as the location’s absorption capacity (new housing). In addition to the residential population, the game takes schools, workplaces, shopping, services and leisure sectors into account. All structures are subject to constant change. The implemented migration model also makes allowance for the different attractiveness of these places. Infrastructure and accessibility determine the attractiveness of a location via different means of transportation, as well as real estate availability, inner-city traffic, educational and health facilities, skills of employees, and purchasing power.
Environmental model
The environmental model calculates the energy consumption for all means of transport (fuel or electricity) and the resulting CO2 emissions.
Settlement model
The settlement model calculates space requirements, the density of use (floor space index), land prices, and the age and value of real estate. Criteria such as accessibility and the quality of the developments are of supreme importance to these calculations. The sum of all the structural data of a location makes it possible to calculate the floor space requirements for residential, commercial, shopping/leisure, and public developments.
Economic model
Economic performance, productivity, and wages come from an economic model (see Boland, 2014, for further details, Banister & Berechman, 2001). Each round, the game records revenue and expenditure. Revenues include different taxes on real estate, wages, trade income, turnover, user fees, and the sale proceeds from housing developments. Expenditures include the acquisition of land, construction, maintenance, and operation of the transportation network, as well as the development of new housing areas. Further expenses include the development and operation of health care and education facilities, as well as the social system (transfer payments for children, apprentices, the unemployed and the elderly), and research promotion.
Didactic Concept
The inspiration for the didactic concept of this game includes the research of experts on the typical sequence of game simulations, as mentioned in the opening sections of this article (see Section Simulation Games as a Didactic Tool). In the first phase, the participants receive an introduction to the topics of space, traffic, and traffic modeling and become familiar with the technical capabilities of the expert game. After this introductory period, group or role assignment occurs, and the players are assigned a predefined objective. The players identify with their assigned roles as closely as possible and then put their strategies and corresponding measures in writing. The participants then play the first round of the game, which corresponds to a fictional time frame of 3.3 years (3 rounds equals ten years). The game records the key results in an Excel worksheet (See Figure 2).
In the debriefing phase, the most valuable learning element, strategies, measures, and the preliminary outcomes are presented and justified in a plenary setting. A major challenge lies in focusing on the most important variables and indicators (i.e., modal split, equity ratio, economic growth, and life expectancy). As is seen in reality, players are confronted with a wealth of information and data, which vary considerably with respect to their relevance to the issue. The groups reflect their findings – particularly concerning the ties to reality – and derive preliminary conclusions (complexity reduction). The plenary and the game supervisor are then able to ask critical questions in the form of a press conference. They then move on to play further rounds. At the conclusion of the game or following a prolonged phase, for example, three rounds or 10 years, the results from the entire game play are contemplated and compared between groups. Players then reflect upon and summarize the lessons learned.
Case Study: Implementation of the Expert Game With Two Groups
The authors use a case study to evaluate the game’s ability to simulate the complexity of actual human settlement and transportation. They focus on self-reported learning and how the expert game encourages students to discover knowledge. The authors hypothesize that the game can improve students’ understanding of extremely varied, complex, and context-specific interconnections of settlement, transportation, and society by providing hands-on game experience as transport network builders and settlement planners.
During a one-day seminar with six participants who work for a large Swiss railway company, game participants split into two teams of three players each. The game supervisor then briefed them on the initial simulated scenario.
Initial Scenario and Assignments
In the fictional triangle-shaped country (‘Triangle Country’) described in the game, the rudimentary road structure is overloaded in some places (See Figure 4). All places in the Triangle Country are also accessible by bus. The buses are actively used, especially by students and the unemployed. As a result, the bus system is starting to reach capacity limits. The quality of life is declining because of exhaust gasses and noise. The roads are heavily congested, especially around the three regional centers (cities), which are approximately the same size. The population is projected to experience continued growth, but not as strongly as in the past decades. The treasury has sufficient funds to invest due to the country’s improving economic situation. The amount of public debt will allow for additional investments, albeit not endless. The connections between the communities are often inconvenient and slow. The experts of a planning committee will be asked for their advice, taking into account that in the long term, the government wishes to promote a more efficient transportation system.
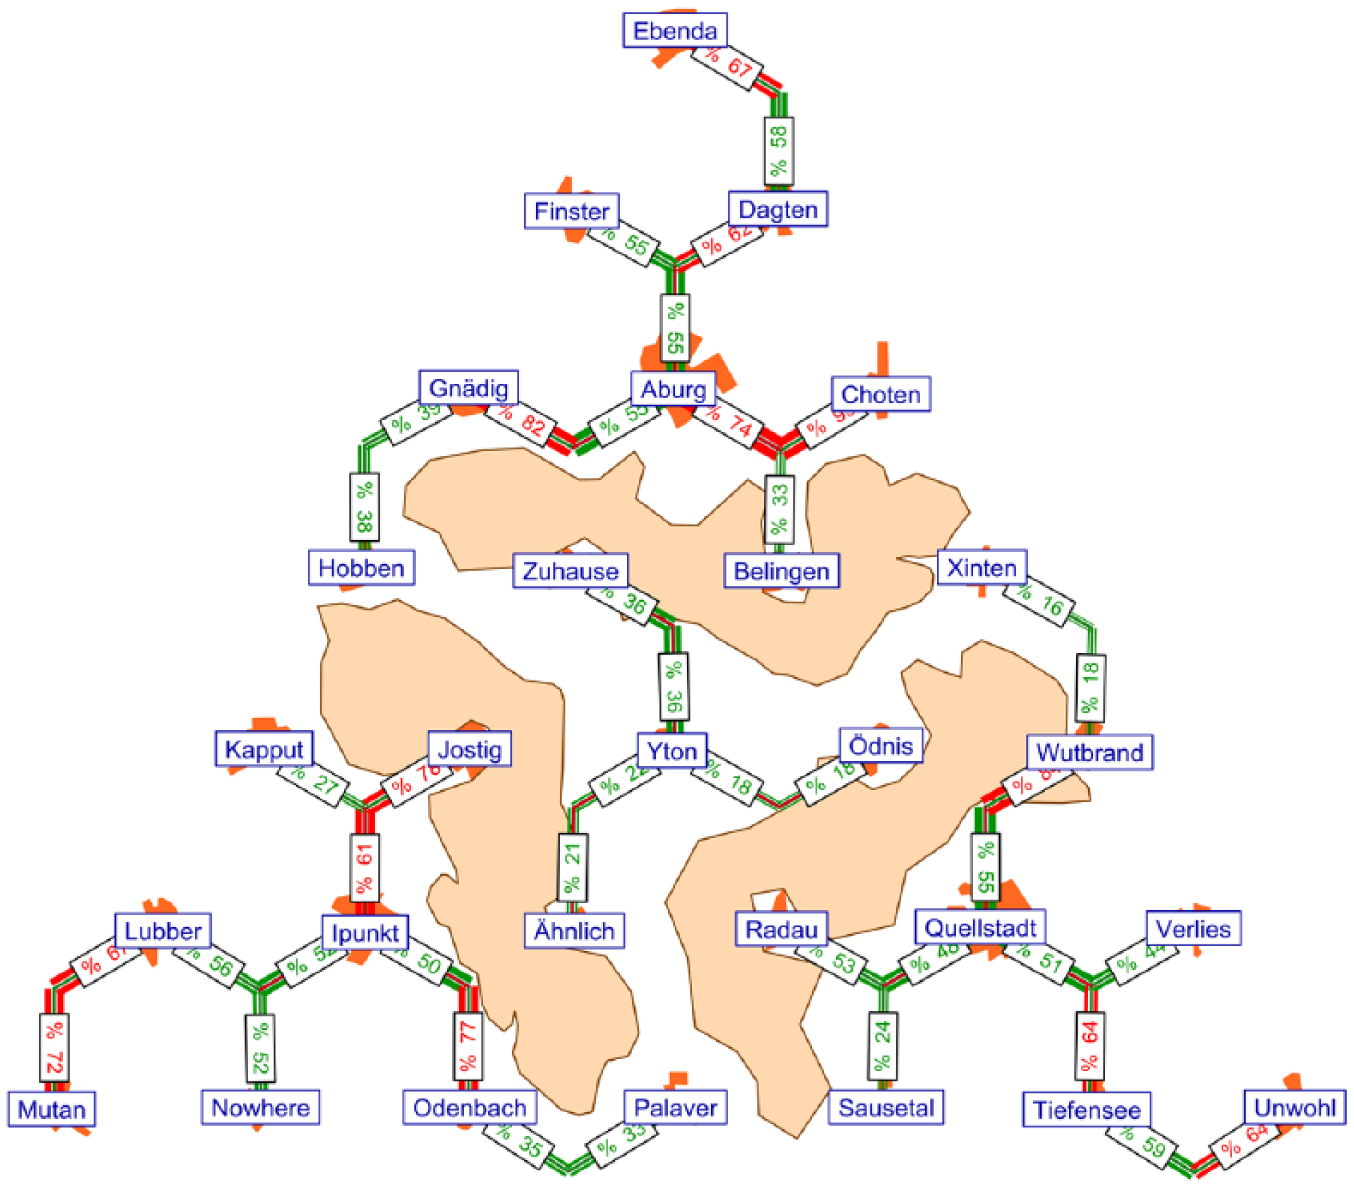
The fictitious triangle-shaped country as a playing field. Mountain ranges are beige colored, and settlements are orange. Between each of the communities, transportation links are represented by colored lines with the corresponding load. In this case, is a road network. On red lines, capacity overload is an obvious problem. The traveling speeds are patches of traffic jams or slow-moving traffic exist.
The teams were asked to make basic decisions: Should they improve individual transportation, or should public transit be expanded? Alternatively, is it better to try and integrate personal and public transportation? The government is predominantly interested in adapting the transportation planning to the space and vice versa. The planning committee teams must develop the Triangle Country while following the policy requirements of the government.
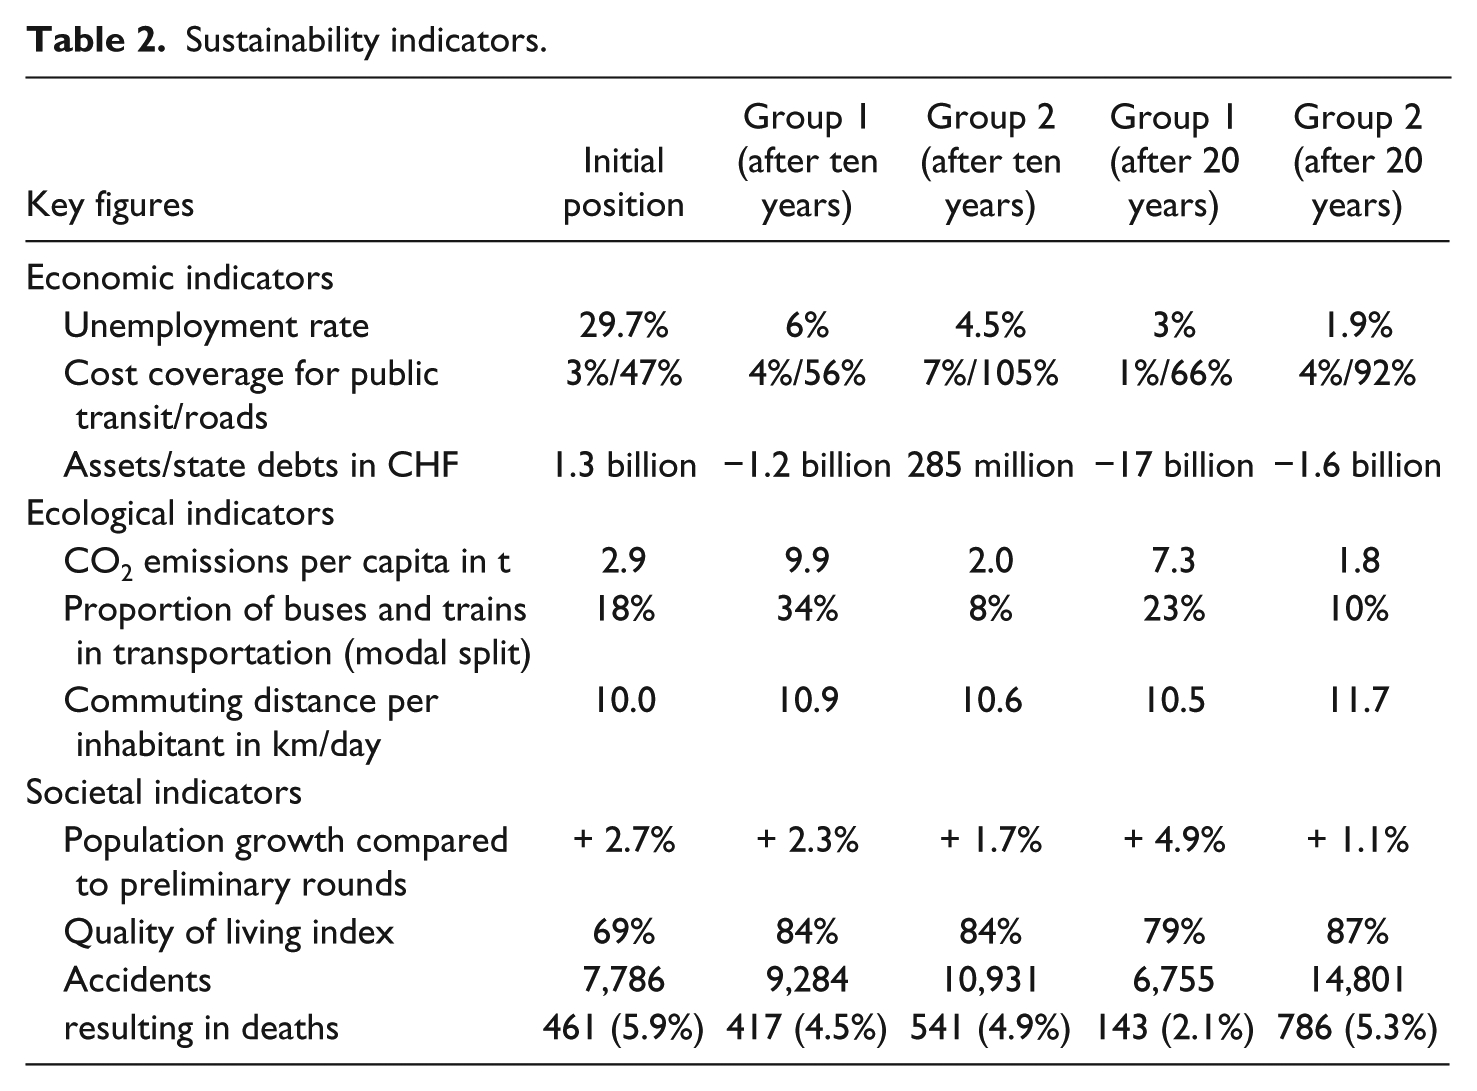
Planning Committee 1 must develop a centralized spatial structure for each region. Specifically, the three metropolises, Quellstadt, Aburg, and Ipunkt, should be strengthened as production, service, and recreational areas, while development in the surrounding communities should focus on increasing residential areas. The planners should handle the traffic expected to result from such a structure as smoothly as possible. Accordingly, an attractive suburban and regional transportation service should be established. Planning Committee 2 was assigned to promote polycentric regional settlement development. In addition to the existing metropolises, additional communities in the peripheral locations should be strengthened. Strengthening peripheral locations entails the joint development of residential, commercial, and recreational areas in the same community. Where necessary, the appropriate traffic capacity shall be provided. Otherwise, it is important to keep the traffic volume as low as possible and to encourage the use of public transit and non-motorized vehicles. The groups themselves specified other objectives, such as the reduction of accidents, the stabilization of CO2 emissions, and the promotion/enhancement of economic growth. After each round, players recorded a variety of sustainability indicators in a controlling sheet (See Table 2).
Sustainability indicators.
The expert game offers planning bodies various possibilities on which they can base their strategies and plan the steps necessary to meet their objectives. In the following section, the authors describe the measures implemented by the two planning commitees and the consequences that resulted.
Planning Committee 1
Measures implemented
In the three major cities of Aburg, Quellstadt, and Ipunkt, industrial and recreational areas were approved to position the three large metropolises as regional commercial and recreational centers. Conversely, residential areas were increasingly promoted in the surrounding rural settings. The slogan Live in the periphery, work in the centers was employed.
A star-shaped transportation network, such as the ones often found in French cities, was built in the three urban areas. Express trains running every 30 minutes should effectively bring the three centers closer to each other. Planning Commitee 1 decided to invest continuously in the urban bicycle path and bus network in all three centers to improve commuter access to express trains. The players strengthened public transportation infrastructure, and traffic congestion decreased when they substantially increased parking fees and introduced a toll within congested traffic zones. In order to reduce the security risk to users, road infrastructure was built to high standards, and the players installed features such as signaling systems, noise prevention, and safety fences. In the suburbs, the players chose a different strategy. They removed central parking and the road network between suburban municipalities. However, public transit to the settlements was neglected. The planning committee also accounted for centralized spatial structure from an economic and social perspective; in contrast to the suburbs, in the three centers, substantial investments were made in education, research, and social services.
After ten years, the traffic route between Quellstadt and Aburg was heavily congested. The planning committee therefore decided to build an expensive motorway connection. As a result of the large flow of commuters, the original tram connection between Quellstadt and the suburban community of Wutbrand was expanded to a commuter train with a 20 minute cycle.
Results
After 20 years, the results are as follows. At CHF 89,701.00, the per capita gross domestic product (GDP) is relatively high, and the unemployment rate dropped to 3%. This economic recovery is most likely attributable to high government spending. In 20 years, the government has invested over CHF 4 billion in transportation infrastructure. However, the maintenance and operating costs for the public transit network devoured more than CHF 20 billion each year; the CHF 200 million in fare revenue does not even come close to covering this expenditure. The government’s excessive spending led to a budget deficit of nearly CHF 17 billion, or approximately CHF 51,000 per capita. The resulting deficits would likely lead to national bankruptcy.
Public transportation accounted for 23% of all traffic after 20 years, which roughly corresponds to the Swiss value. Thanks to the high level of investment, the planners achieved an increase of the modal split in favor of public transit. The proportion of non-motorized vehicles was 40%, which is likely attributable to significant investment in the bicycle network in the center of each of the three main cities.
The parallel highway and express connection between the Quellstadt and Aburg turned out to be a bad investment. The realization led to significant losses, as the existing express connection entailed high costs to passengers (See Figures 5 and 6), and the newly built road connection was too large. The planning committee would have been better off if they had done away with this parallel structure.
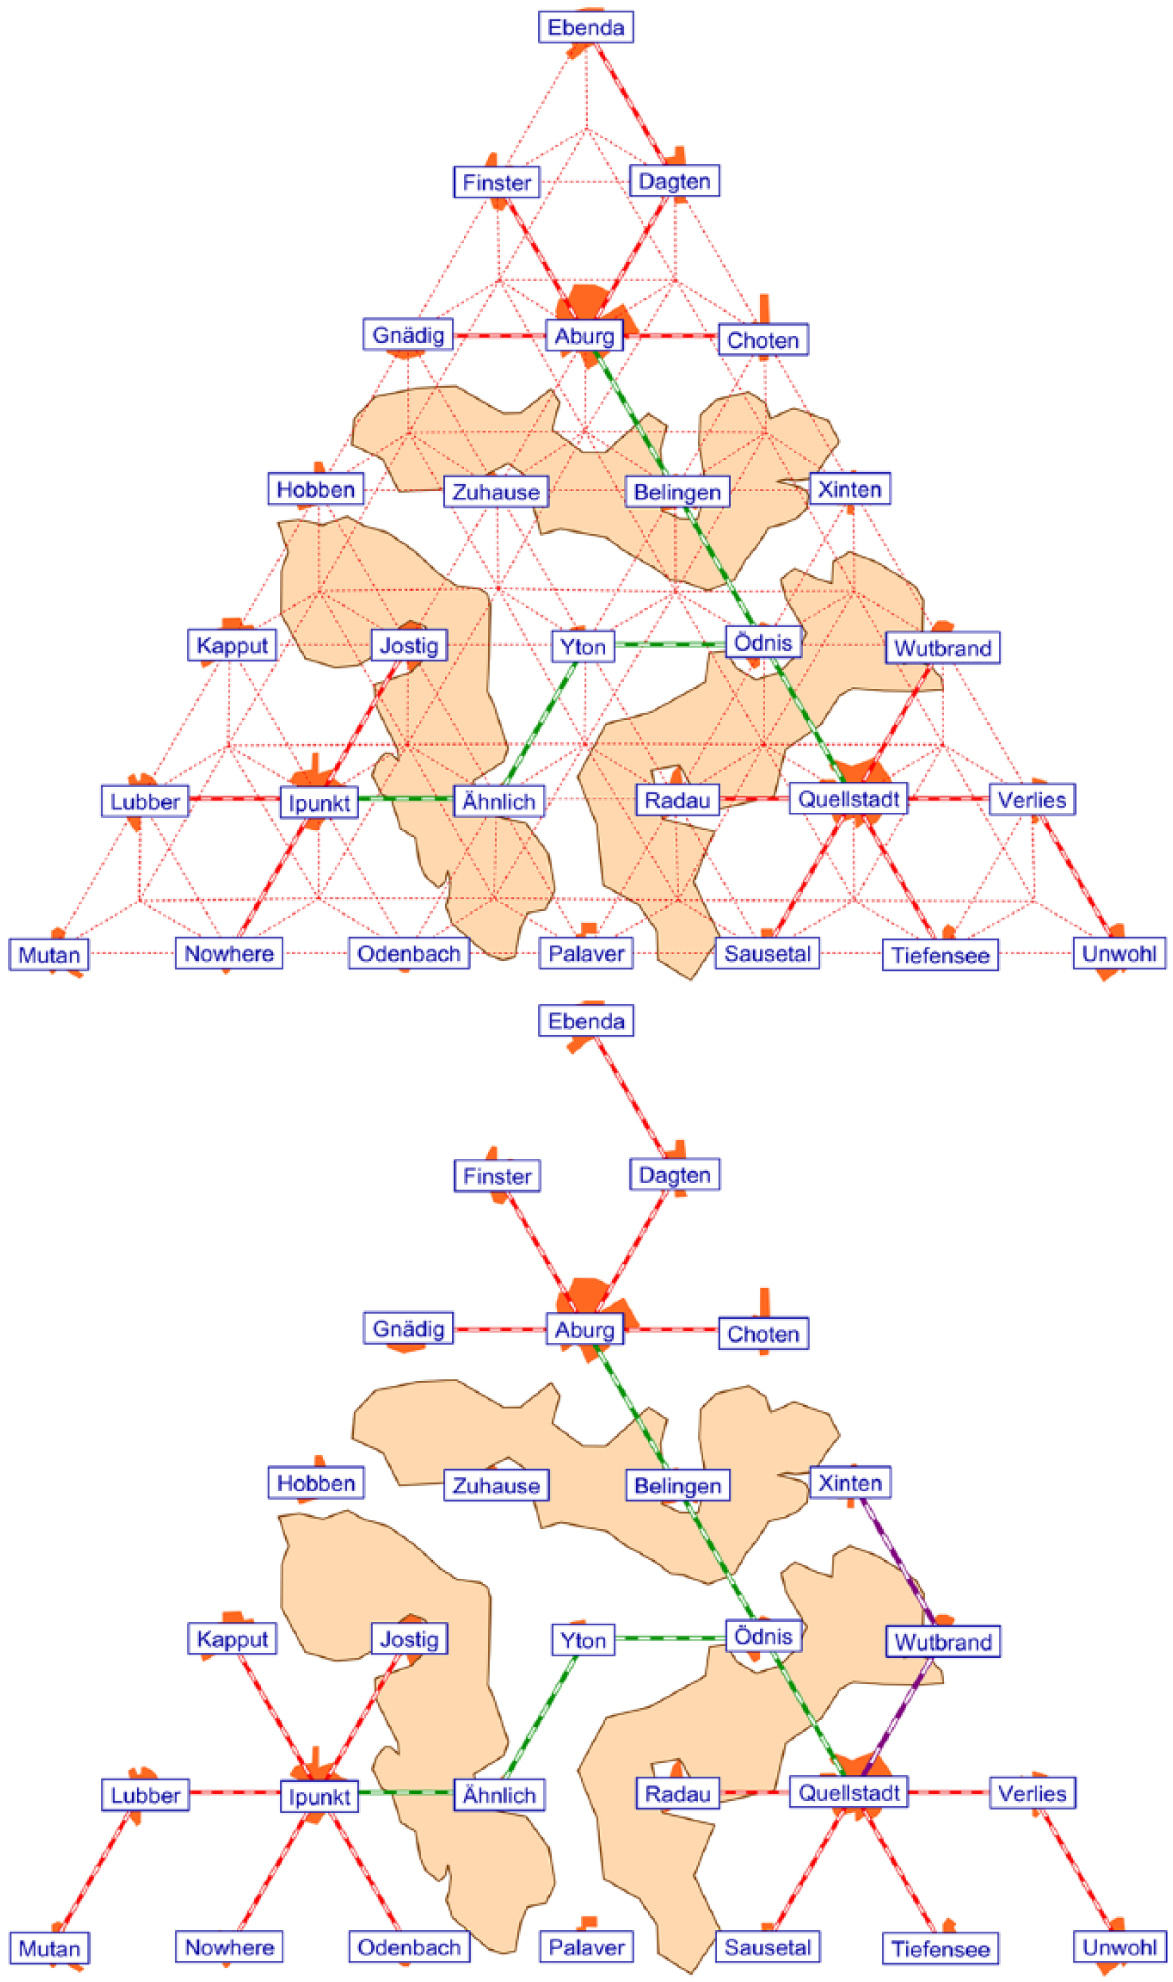
Public transit network after 10 (at the top) and 20 years with the utilization of routes. Tram lines are red and white, commuter train routes are purple and white, and fast train connections are green and white. The dotted lines show possible links to build on (rail).
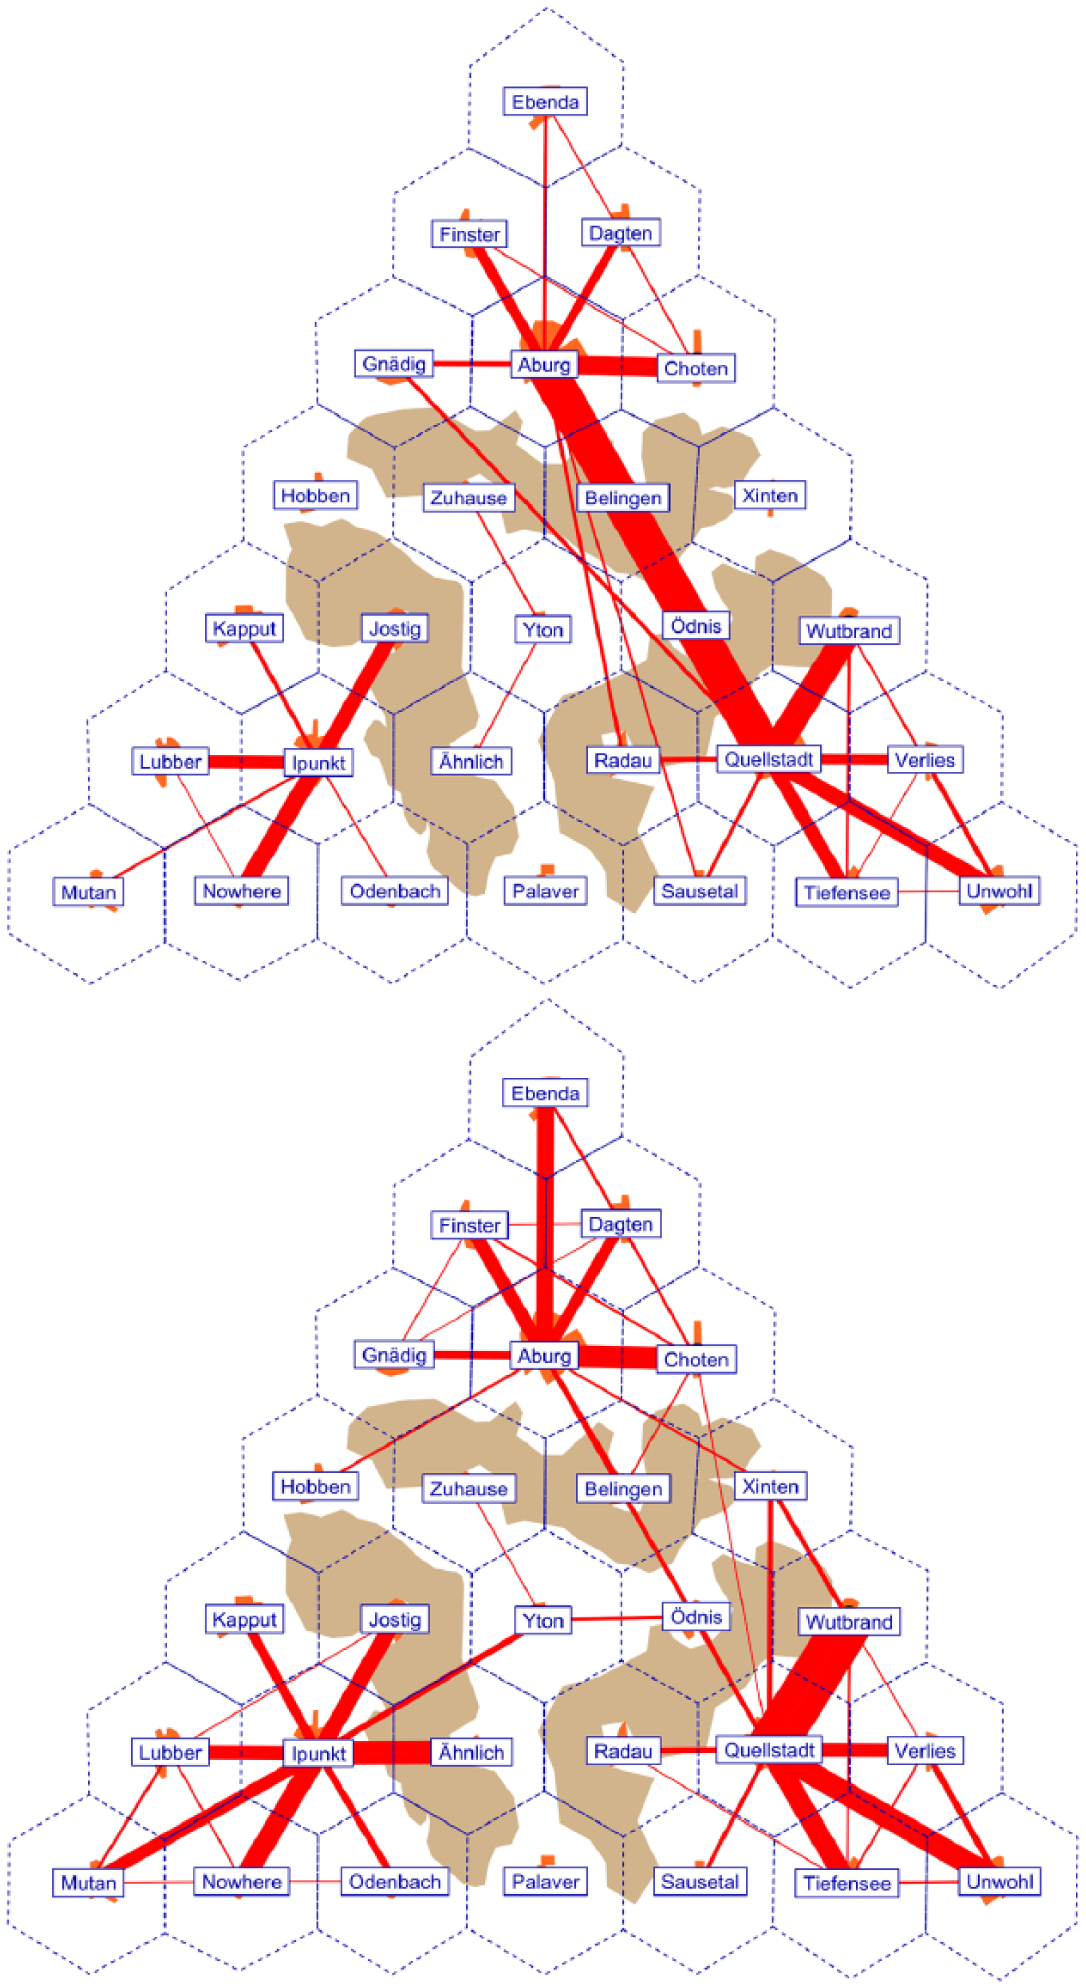
The public transit relationships after 10 (at the top) and 20 years. The red lines show how the population moves between the various communities with the help of commuter public transportation.
Despite the centralized space concept with the separation of residential and commercial areas, only a slight increase in the per capita commuting distance resulted, from 10 to 10.5 km. However, the CO2 emissions increased significantly, from 2.9 to 7.3 t per capita. For reference, in 2010, the per capita rates were 5 t and 9 t for Switzerland and Germany, respectively. 3
In the cities, high levels of education, research, and social work were achieved thanks to considerable investment. The well-developed public transportation system and social benefits led to an influx of senior citizens in the three centers, which in turn led to increased government spending in the area of pensions. The declining birth rate in the centers, attributed to the higher level of education, was offset by a relatively high birth rate in the suburban communities. Over the years, the population experienced steady growth of 4.9%, on par with that of a developing country. Significant investment in road safety reduced the total number of accidents to 6,755, including 143 deaths.
Planning Committee 2
Measures implemented
In all communities around the centers, but especially in those situated in the periphery of the playing field, large-scale residential, commercial, and recreational areas were separated. In the metropolises, however, the usable area was reduced. In the regional communities, evenly distributed growth of residential, commercial, and recreational areas should thereby have been facilitated.
In all locations, the planners invested equally in education, social services, and research. Comparatively fewer state funds went into the health and rescue sectors and road safety. The government’s decreased investment resulted from the expectation that fewer motorized vehicles would be on the road, as a result of spatial planning measures and the simultaneous promotion of slow moving vehicles.
The planners expanded roads as needed, and gave priority to public transportation. However, the costs were continuously monitored. Thus, in one example, an expensive express route was forgone in favor of expanding an existing road and introducing a good bus system. The planners also attempted to avoid costly parallel structures between public transportation and roads as much as possible. For example, if a well-developed tram line between two locations already existed, only low capacity cross-country roads without bus service were built. In some places, this led to the deconstruction of infrastructure.
The planners dispensed with major investments with only one exception. Thus, between the centers, neither direct express train connections nor motorways were constructed. The only large project that the planners realized was an express train connection through the mountains between Wutbrand and Xinten in the eastern part of the country (See Figures 7 and 8). This project resulted from the large flow of public transportation that led to an overloaded bus line in this region. The planners continually increased transportation prices over the years as a traffic control measure, especially where the capacity had reached its limits. In order to promote the use of public transit, road tolls and parking fees were set higher than ticket prices.
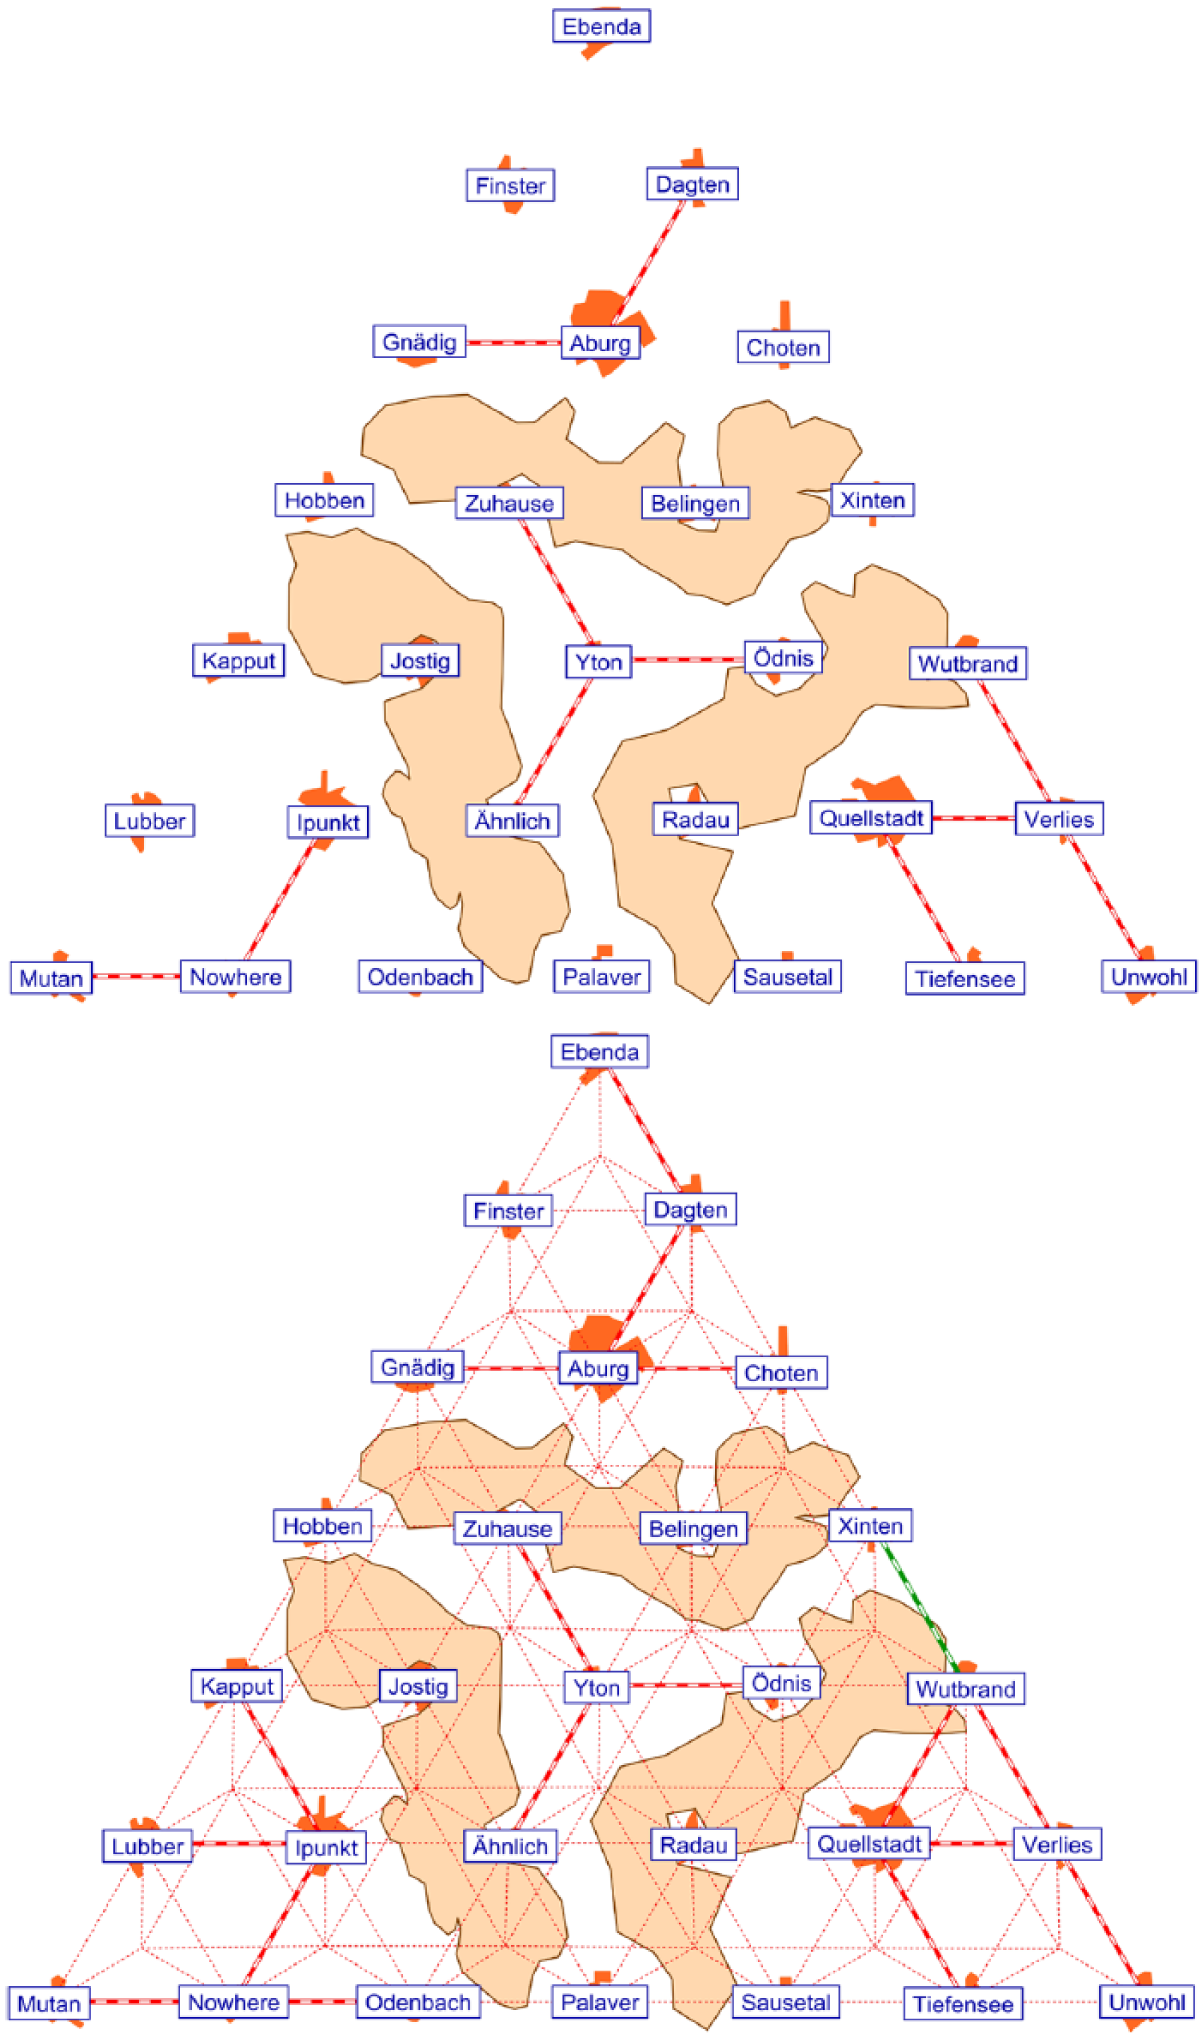
Public transportation network of Planning Committee 2 after 10 (at the top) and 20 years. The dotted lines show possible links to build on (rail).
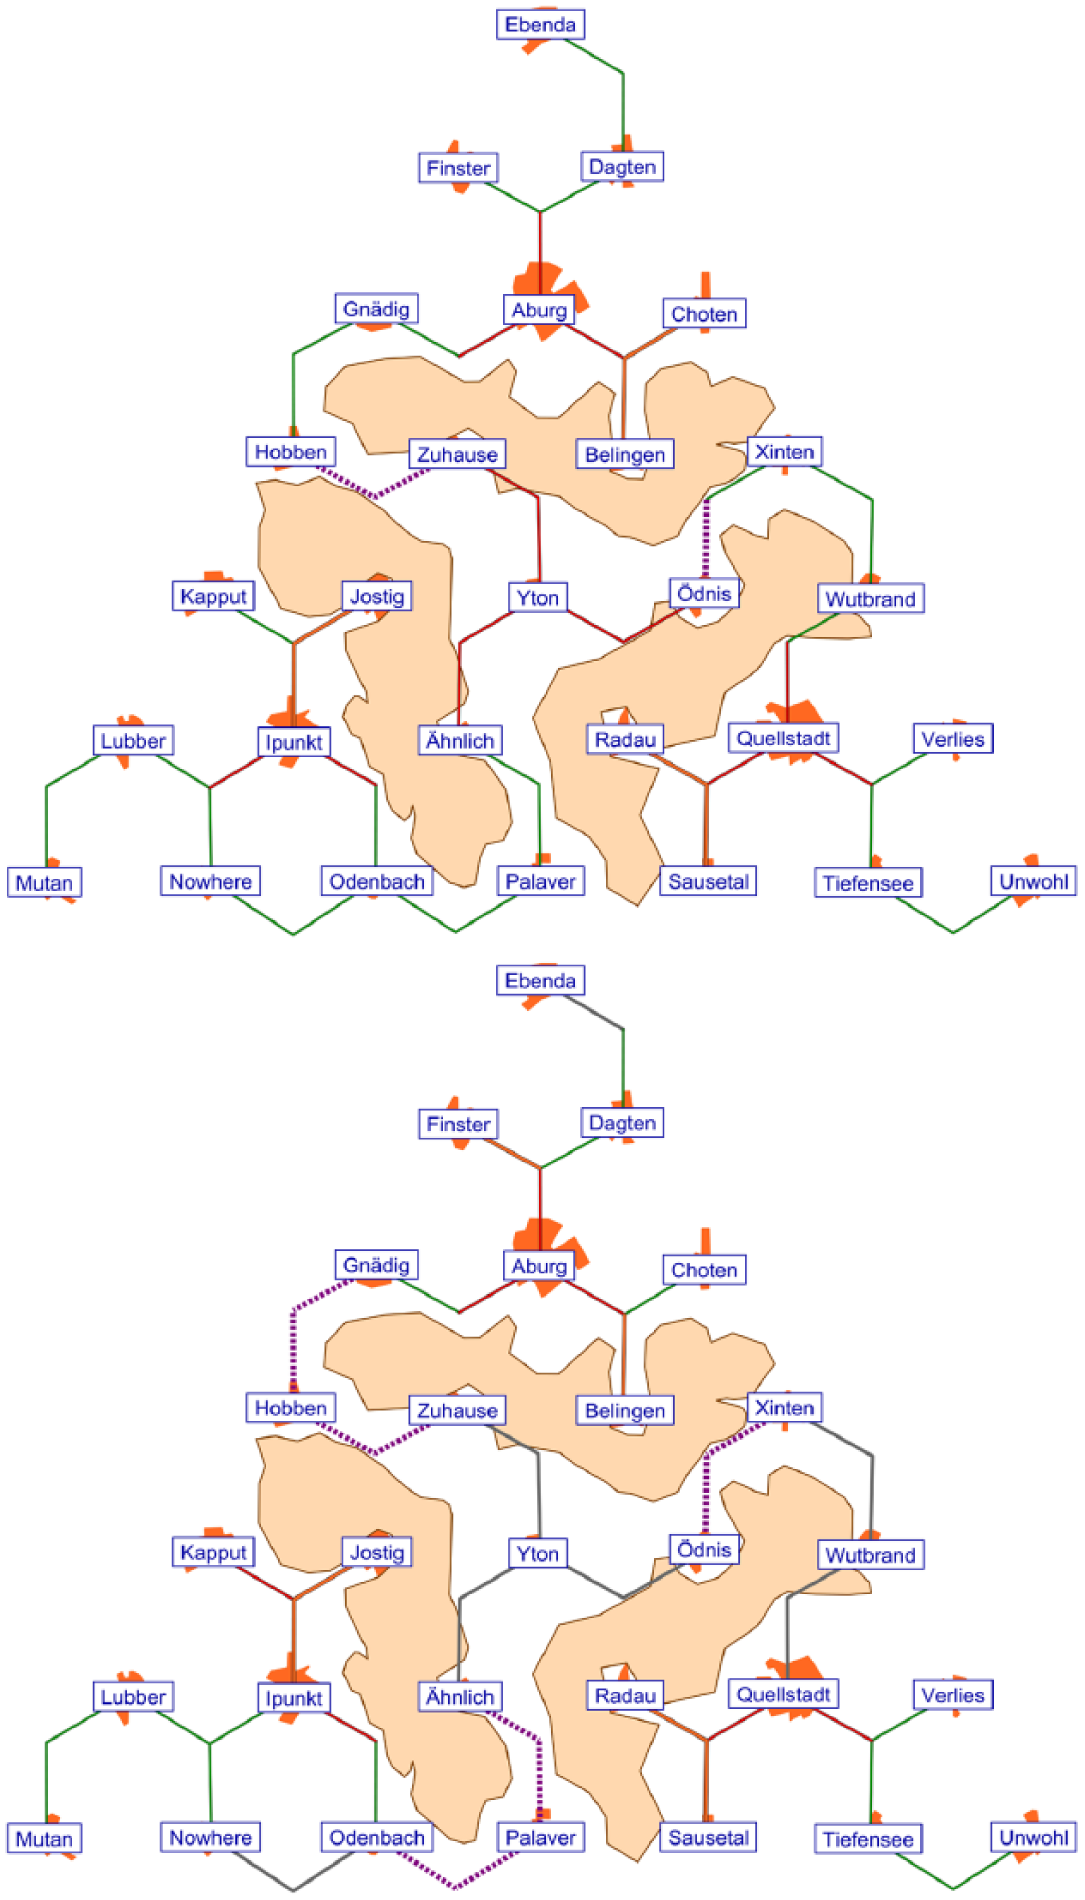
Road network of Planning Committee 2 after 10 (at the top) and 20 years. Cross-country roads without bus lines are gray, cross-country roads with bus lines are green, orange, red, or violet, depending on the frequency of the buses and construction standard of the roads.
Results
The economy of Triangle Country developed magnificently. After 20 years, per-capital GDP was CHF 105,360, and the unemployment rate decreased to 1.9%. However, as a result of investments in education, research, and social services, the state repeatedly operated in the red and accumulated CHF 1.7 billion in debt, which corresponds to CHF 5,000 per resident.
Public transportation accounted for 10% of the total traffic volume, while slow traffic accounted for 57%. In Germany, share of public transportation on total traffic was approximately 14% in 2009. In Switzerland, it was approximately 23% in 2010. The latter is certainly a consequence of promoting slow traffic on one the hand and the settlement structure (i.e., living and working in the same location) on the other. After initial partial success, the only express train route the planning committee realized proved to be a bad investment, as the commuting pattern had substantially changed over the years. The high component of slow traffic and the ability to nearly decouple economic and per-capita traffic performance roughly corresponds to Indonesia’s values for 2010. 4 The same can be said regarding the fact that the traffic performance per resident only experienced moderate increases. 4 These results correspondent with the fact that per-capita CO2 emissions had fallen by more than one-third, to 1.8 t per resident.
Over the years, population growth continued to decline. At 1.1%, it was on par with the Swiss figures from 2012. Despite low traffic volume, 14,680 road accidents occurred, of which 768 were fatal. This unflattering indicator is a result of a lack of investment in emergency services and road safety. For comparison, in 2012, Switzerland reported 18,148 accidents, of which 301 were fatal. 1
Comparison of the Two Planning Committees and Debriefing
Table 2 shows the development of several important indicators of the three dimensions of sustainability as required from the planning committees in the context of the game. For comparison, Planning Committee 1 & 2’s values are listed.
A clear determination of which group performed better was not possible and is not the objective of the game. Depending on interpretation and political preferences, the changes in the economic, societal, and environmental dimensions can be evaluated differently. However, the following differences were noted: Planning Committee 1 invested much more in transportation infrastructure than Planning Committee 2, what is reflected by the CO2 emissions, among other things. On the other hand, in Planning Region 1, the higher safety standards of the road infrastructure led to significantly fewer accidents with fewer deaths. Moreover, the results illustrate the varied interactions between land use and transportation. The construction of a new road or railway line often results in a variety of downstream positive and negative effects on different levels.
Debriefing: Justified planning and press conference
One main lesson for the participants is the importance of justified planning instead of arbitrary development in a country. Their assignment is to plan and develop traffic-coordinated spatial planning and space-coordinated transportation planning in six steps.
In step one, players analyze and define their objectives and tasks for each round according to the overall goal. For example, they may examine the increase of the modal split in favor of public transportation and reducing CO2 emissions or promoting public service in rural areas.
The second step is a demand and structural analysis of the actual transportation and economic situation.
The third step contains an actual vulnerability analysis, such as determining where traffic congestion occurs.
The fourth step is to identify effective relationships and develop possible measures.
The fifth step is the implementation of land use and infrastructure measures.
The sixth step aims to assess and verify the effectiveness of the measures taken per round and after ten years (three rounds) or more.
After each round, the participants have to prepare a press conference and highlight what has changed since the previous round. The main questions are: What has changed and why? What are the key figures/how are these connected to the decisions? Have the objectives been achieved?
Once the team has finished their presentation, they are required to answer the journalists’ critical questions. Journalists are supervisors and players of the other team, who must critically reflect on the decisions and outcome of their counterparts. The participants have to find answers to the basic questions: How has the new transportation infrastructure influenced space and the environment? As a lesson, within the interrogation mutual interdependencies are revealed, such as how the use of space affects traffic and vice versa. In accordance with real scenarios, each case of planning is different and players cannot rely on automatisms; the relevance of the actors involved is apparent. Participants in the highlighted case study discovered various overlapping chains of cause and effect between transportation, space, environment, economy, and society, and the inertia of the systems. The game masters collected various possible effects caused by the game players’ actions. The following examples illustrate some of our observations:
The participants carve out how population growth and the growth of living space per capita/single-person households leads to the growth of settlements and transportation infrastructure.
Moreover, they discover how traffic increases lead to adverse effects on housing quality, energy consumption, landscape, and quality of life.
Tunneling increases accessibility to a valley. Increased accessibility manifests itself in increased construction activity and influx. Daily tourism benefits.
Improving transport routes results in saving time and thus an enlargement of the catchment area of a region.
Settlement development (population growth, setting up companies) benefits from the opening up of a tramway.
Restrictive parking policies (higher price and lower capacity) increase the share of public transport in a city.
Bicycle traffic decreases in areas with hilly topography.
A fuller treasury leads to more investment in social infrastructure that will, for example, change the population structure and potentially the volume of traffic.
Urban sprawl leads to high infrastructure costs (water, sewage, cabling, flood protection, and of course transport infrastructure).
Short distance city planning promotes resource efficiency (better environmental indicators).
In the press conference, participants of the case study detect how urban sprawl is tantamount to high infrastructure costs. They examine the relationship between high infrastructure costs and urban sprawl as related to drinking water supply, wastewater, cabling, flood protection, and transportation infrastructure, among other things. For example, governments have to organize mobility needs in a spatially and environmentally-friendly manner. Moreover, participants find out that resource-efficient mobility is linked to spatial planning of short distances. Players also learn about the importance of a functional mix of residential, commercial, and recreational aspects.
Discussion and Outlook
The HST expert game aims to produce realistic results to give transportation students and professionals in training and continuing education settings a feeling for the magnitudes of the indicator values. Each model is a simplified representation of reality. However, the experiences to date have shown that the expert game is suitable for realistically simulating the interactions between land use, transportation, and other sectors of society. Starting from arbitrary initial situations, the game allows participants to play out various scenarios and thereby gain valuable insight into underlying dynamics and interactions. Within the debriefing phase, participants’ feedback revealed that they unearthed interrelations between settlement, transportation, and society similar to those the scientific literature on the topic describes. This lesson is the main didactic and contextual aim of the game. Participant confirmation of its effectiveness testifies to the game’s potential as an educational tool. One problem for the players is that a great deal of effort is required to obtain an overview of the large number of data and then work out interactions. Participants must first learn the correct use of the functions in Excel and VISUM. In the case of VISUM, this is to be regarded as independent learning since basic understanding of software-based traffic modeling is imparted during its use. The problems above manifest themselves in the fact that, at the beginning of the game, a round lasts more than 45 minutes. An evaluation sheet that automatically creates important graphics that the team would then have to interpret could improve this situation. Game masters could automatically compare the results between the teams over a network connection.
The expert game offers several advantages compared to other methods of learning, such as using case studies (for example, Spatial effects of the Zurich S-Bahn, ARE, 2004), closed exercises, land-use transport feedback cycle (e.g., spatial effect on traffic and traffic effects on space, see Wegener & Fürst, 1999, p. 6; Tripod-effect model, ARE, 2004), space-regulatory policy goals of governments, reflections on academic literature, and chalk-and-talk-settings. In the expert game, the players are actors who make decisions about land use and transport. As in professional life, they are confronted with statistics that they need to understand in context, particularly surrounding research questions related to housing and transport. Consistent with problem-based learning, the characteristic feature is that the learners should independently find a solution to a given problem. One can rate the attractiveness of a location using a fictitious region: What are land prices? How big is the catchment area for recruiting workers? In contrast to alternative forms of learning, learners are much more active; a fact that is taken into account from the start.
In the expert game, it is important to identify and use or influence the possible links and context-specific relationships between settlement and transport. Thus, participants also learn that the impact of their plans is less than expected. This is related to the inertia of systems of highly complex interactions and the difficulty in finding isolated causal effects therein. No magic formula for causal chains between land use and transport exists. Planning evaluations must consider that. Research shows that each planning case is different and that no one-dimensional, linear correlation effects occur for traffic and space. Automation of interactions is rare and depends on the relevance of the stakeholders involved. Determinism between land use and transport does not exist in the game, but the game considers a situational context. The respective and potential stakeholders as well as traffic effects are observed. Only then, through interactions, can possible spatial effects be explained. As in real life, no panacea exists for the problems present in the chain of cause and effect surrounding human settlement and transportation.
The selected sequence of events and the press conferences contributed to participants’ lessons because participants are required to reflect upon and defend the measures they adopted and the results they obtained in front of a critical audience. Most importantly, the game takes place in a casual and playful context, which motivates the players and supervisors to deal with the complex interactions between land use and transportation.
Although this game would ideally incorporate real traffic models, their computational time requirements make them unfeasible for expert games at present. To play one round, a real Swiss government model would have to compute for 8 hours before arriving at a solution. Our model for the expert game computes for only 5 minutes, allowing players to see the results of their decisions and changes immediately.
Overall, the case study results corroborate the authors’ hypotheses about using transportation modeling software in teaching. This article documents new efforts in teaching transportation and human settlement planning using transportation modeling software. The results illustrate that the expert game can serve as a useful tool in transportation education. Finally, this research suggests that properly incorporating policy games into the curriculum can enhance students learning in transportation planning and settlement structure.
Footnotes
Acknowledgements
The authors wish to thank three anonymous reviewers for excellent comments, valuable suggestions and constructive critiques that substantially improved our article, as well as the editor, David Crookall, for taking time to provide such thoughtful input.
Author Contributions
All authors contributed to this article, in content and in form. TO wrote the manuscript and embedded HST into the body of literature and research. WA, JF, and PW developed and wrote the didactic concept and organised the case study. NS programmed HST and wrote the technical description.
Declaration of Conflicting Interests
The authors declared no conflicts of interest with respect to the authorship and/or publication of this article.
Funding
The authors disclosed receipt of the following financial support for the research, authorship, and/or publication of this article: We are grateful for financial support by the Lucerne University of Applied Sciences and Arts – Business.
Notes
Author Biographies
Contact:
Contact:
Contact:
Contact:
Contact: