
Abstract
A threshold Heat Index (HI) can serve as the basis for advising the civilian workforce about the risk of heat-related illnesses. We conducted a systematic review and compiled reports of work-related fatalities from heat-related illnesses. We calculated the HI for each fatality. Our objective was to expand upon the military’s concept of a “heat death line” and identify an HI alert threshold for the civilian workforce. We identified 14 publications totaling 570 heat-related deaths. In the meta-analysis, the median HI was 101 with a range of 62 to 137. Almost all deaths (96 percent and 99 percent of civilian and military fatalities, respectively) occurred when HI ≥80, which is our proposed heat death line. Some existing HI-based heat advisories are set at a higher temperature value. However, many occupational heat-related illnesses occur below these thresholds, resulting in low sensitivity and a false sense of security. In at-risk outdoor industries, HI ≥80 should trigger hazard awareness and protective actions.
Introduction
Occupational heat-related illnesses (HRIs) including heat stroke are a spectrum of disorders that affect workers exposed to excessive heat stress. Total heat stress is the combination of environmental heat (e.g., weather conditions) and metabolic heat produced by the worker’s physical activity. 1 Work clothing can further increase heat stress by impeding convective heat exchange and/or sweat evaporation. Each year in the United States, occupational HRIs cause thousands of severe illnesses and approximately thirty deaths in the civilian workforce.2,3 For these reasons, public health professionals have called upon employers and regulatory agencies to protect the vulnerable worker population. 4
Because metabolic heat generation is an important risk factor, workers are especially vulnerable to HRI when they engage in strenuous physical activity. More than 70 years ago, a study of 157 U.S. Army heat deaths noted that “death can occur at surprisingly low temperatures …” 5 The author, Elizabeth Schickele, established a critical “heat death line,” which was a straight diagonal line on a graph of dry bulb temperature versus water vapor pressure. The heat death line was drawn at the lower limit of scatter of cases with “average” physical activity. This line had 99 percent sensitivity (155 of 157) for recognition of fatal environmental heat, with the two outliers engaged in very heavy activity. 5
In subsequent decades, researchers have created new tools to measure environmental heat. The U.S. military developed wet bulb globe temperature (WBGT) in the 1950s to quantify the combined effects of temperature, humidity, air movement, and radiant heat. 6 WBGT is now considered the benchmark for occupational environmental heat measurements.7–9 Evidence-based occupational heat stress guidelines establish the maximum safe WBGT for a given level of physical activity.1,7
The Heat Index (HI) a is an alternative environmental heat metric developed in the late 1970s. The original HI algorithm was a heat-transfer model that assumed a person was wearing a single layer of clothing while walking in the shade with a light breeze. 10 HI combines air temperature (measured in degrees Fahrenheit) and relative humidity into a single number that represents “how hot it really feels.” 11 The National Weather Service (NWS) publishes HI data and issues heat alerts for the general public when HI is forecast to exceed location-dependent thresholds (generally 105 to 110). 12 The Occupational Safety and Health Administration (OSHA) and the National Institute for Occupational Safety and Health (NIOSH) have issued a mobile app that provides occupational HI guidance for outdoor workers. 13 The app features five “risk levels” defined by increasing HI. (OSHA created these risk levels by adopting, with slight modifications, a set of levels on a chart initially published by NWS. 11 ) For instance, the OSHA–NIOSH app uses a cutoff of HI ≥80 to define conditions that represent more than “minimal risk.”
The lack of evidence about the validity of the NWS or OSHA–NIOSH risk levels for civilian workers prompted recent retrospective analyses of HRIs reported to or investigated by OSHA. In two case series that included thirty fatalities, it was shown that workers died of HRI when HI was 86 or higher.14,15 However, given their small sample size, those case series might not have fully characterized the lower tail of the HI distribution.
The current review had two objectives. The primary objective was to assemble a larger collection of fatality reports to determine whether we could extend the military “heat death line” (1) to civilian workers and (2) to the use of HI (rather than Schickele’s use of temperature and water vapor pressure) as the measure of environmental heat. We hoped to define an evidence-based civilian “heat death line” (i.e., an alert threshold based on HI) below which it is unlikely that workers will suffer fatal HRI. Our hypothesis was that only a small percentage of reported fatalities would be associated with HI <80. The secondary objective was to determine how often occupational heat death case reports contain information about WBGT, the recommended measure of workplace environmental heat.
Methods
On September 26, 2018, we searched the PubMed database to identify case reports and case series of occupational (civilian or military) heat-related fatalities. The search terms were ([“occupational” OR “military” OR “work-related” OR “worker”] AND [“heat stroke” OR “heat illness” OR “heat-related illness”]). We found 480 articles that matched these search terms. In addition to the PubMed search, we attempted to identify other case reports from unpublished studies and NIOSH investigation reports.
We reviewed the search results to exclude non-English-language articles and articles that did not contain fatality reports. We restricted our review to fatalities because we wanted to focus on the most severe outcomes and avoid inclusion of milder illnesses that might not have been heat-related. We also excluded articles that did not contain enough weather information to determine the HI associated with each fatality. When weather conditions were presented in graphical form, we abstracted numerical data from figures. We required that each article provide the maximum HI on the day of the incident, the HI at the time of the incident, or the air temperature and relative humidity. When articles provided only air temperature and relative humidity, we calculated HI via a standard NWS algorithm. 16 We contacted one study’s author to obtain additional weather data. Our searches and inclusion criteria yielded fourteen publications that were eligible for further analysis (Figure 1).
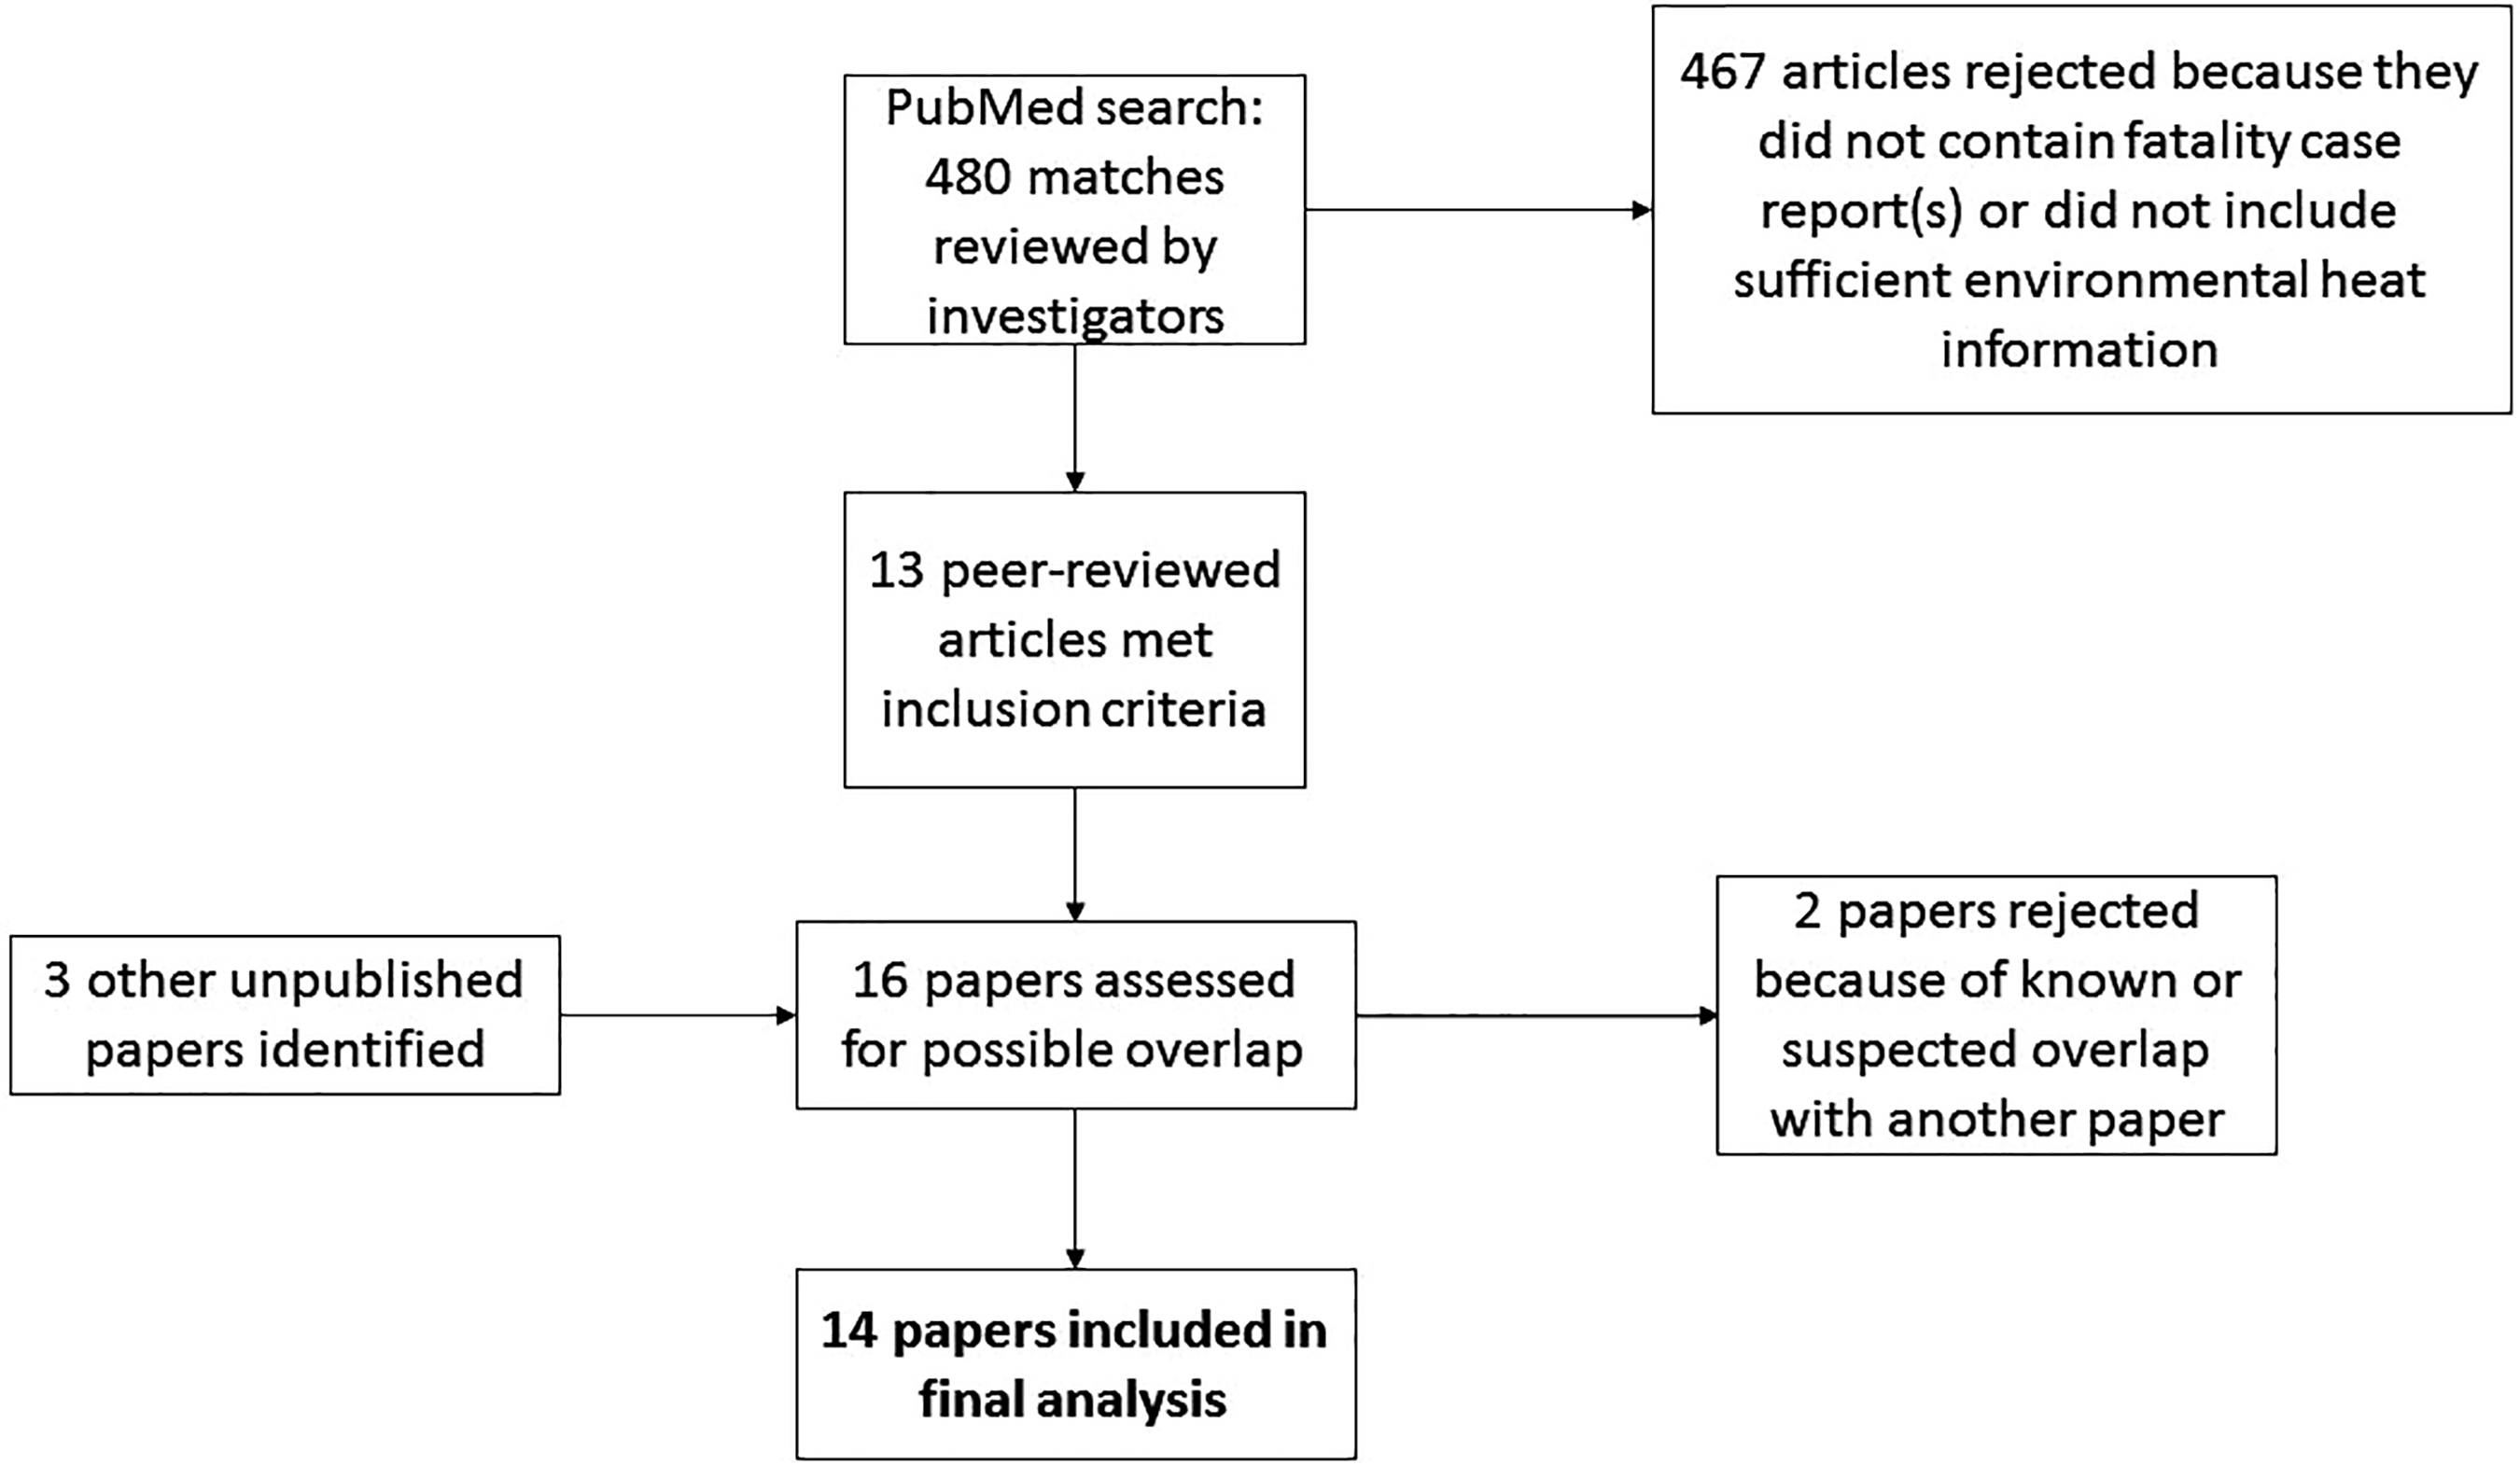
Flow chart showing selected studies for analysis.
We extracted the following data for each fatality in each eligible publication: worker type (civilian or military), work site location (indoors or outdoors), physical activity level (light, moderate, heavy, or very heavy, corresponding to standard metabolic rate workload categories used to assess occupational heat stress), 1 and environmental heat metrics (e.g., HI, air temperature, relative humidity, water vapor pressure, and/or WBGT). We truncated one HI outlier to 137 because 137 is the upper bound of standard HI charts. 11 We excluded indoor incidents because outdoor weather data do not necessarily correlate well with indoor heat conditions.
We calculated the mean, median, and range of HI for each study separately. We then performed a meta-analysis to compute summary HI statistics for the overall sample. In a stratified analysis, we calculated these statistics separately for civilian workers and military personnel. We used Student’s t test, with p value <.05 taken to indicate statistical significance, to examine whether mean HI differed between civilian and military fatalities. We also computed the percentage of cases that occurred within each OSHA–NIOSH risk level.
To propose a civilian “heat death line,” we first computed the sensitivity of each possible HI threshold between 60 and 140. Analogous to terminology used when evaluating diagnostic tests, we defined sensitivity as the percentage of fatalities with HI ≥ threshold. We next examined the distribution of sensitivity to determine which HI thresholds had a sensitivity of roughly 95 percent to 99 percent. These thresholds were our candidate heat death lines. Very high sensitivity is desirable when designing a screening test to prevent fatal outcomes, yet we recognized that a goal of 100 percent sensitivity might result in an unrealistically conservative low threshold because sporadic cases of exertional heat stroke happen at ambient temperatures below 50°F. 17 Therefore, consistent with the military study that defined the original heat death line, 5 we accepted a sensitivity slightly below 100 percent. Finally, we compared the candidate thresholds to existing recommendations, to determine whether there was an optimal “heat death line” that was both evidence-based and consistent with prior guidance.
Results
The review included 14 publications with 570 unique heat-related fatalities.5,18–30 There were 8 civilian studies with 418 fatalities and 6 military studies with 152 fatalities. Most (92 percent; 140 of 152) of the military cases came from the 1947 U.S. Army publication that defined the heat death line. 5 Similarly, a single manuscript supplied 78 percent (327 of 418) of the civilian fatality reports. 28 Most (eleven of fourteen) studies reported the daily maximum HI, while two studies reported weather conditions at the time of the incident, and one study reported the day’s mean HI. In the statistical analysis, we treated all of these timing choices as equivalent. WBGT was reported in only seven fatalities (1 percent; two of fourteen publications). Because of the paucity of WBGT data, we did not analyze WBGT further.
We were unable to create distributions of physical activity level because only three studies (one military and two civilian) provided explicit estimates of workload category (i.e., light, moderate, heavy, or very heavy). However, examination of the reported industries and job tasks provided some insight into likely workload levels. From 2000 through 2010, 58 percent of U.S. civilian heat-related fatalities occurred in agriculture or construction, 2 and between 2014 and 2016, 85 percent of fatalities were in the construction, agriculture, landscaping, oil and gas, or warehouse sectors. 30 Although specific job tasks were not reported, most of these workers likely performed moderate or heavy physical activity. At least 35 (23.0 percent) of the 152 military fatalities involved trainees who participated in intense physical training, such as running or marching while carrying heavy equipment. The other 117 (77.0 percent) military fatalities involved either physical training or less strenuous activities (e.g., guard duty), but the fraction of incidents that fell within each of these categories was unclear from the available information.
Figure 2 shows a forest plot of the HI distributions from each study. When we combined all 570 deaths in a meta-analysis, the median HI associated with heat-related fatalities was 101, with a minimum of 62 and a maximum of 137. When stratified by worker type, the median HI was 101 (range: 65 to 137) in civilian deaths and 102 (range: 62 to 121) in military deaths. The difference in means (99.6 civilian vs. 101.5 military) was less than 2, but this difference was statistically significant (p = .03).
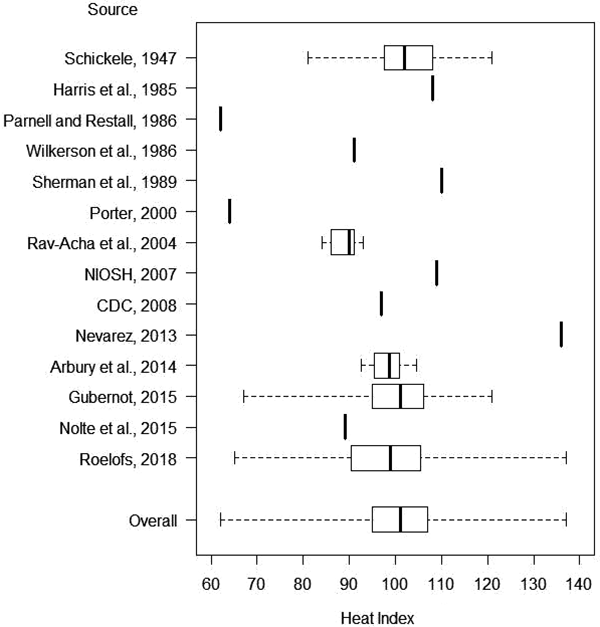
Forest plot of Heat Index distributions from studies in this review. The graph shows each study separately, as well as an overall summary of all 570 deaths. Dark black vertical lines represent the median values. The left and right edges of the boxes indicate the first and third quartiles, respectively. Dashed whiskers extend to the minimum and maximum observations.
Table 1 shows the distribution of deaths within the HI risk levels published by OSHA and NIOSH. Among civilian fatalities, the OSHA–NIOSH HI category was “minimal” risk in 4 percent (16 of 418) of cases, “low” risk in 11 percent (47 of 418) of cases, “moderate” risk in 44 percent (186 of 418) of cases, “high” risk in 38 percent (158 of 418) of cases, and “extreme” risk in 3 percent (11 of 418) of cases.
Occupational Heat Deaths Categorized by Heat Index Risk Levels Published by OSHA and NIOSH.
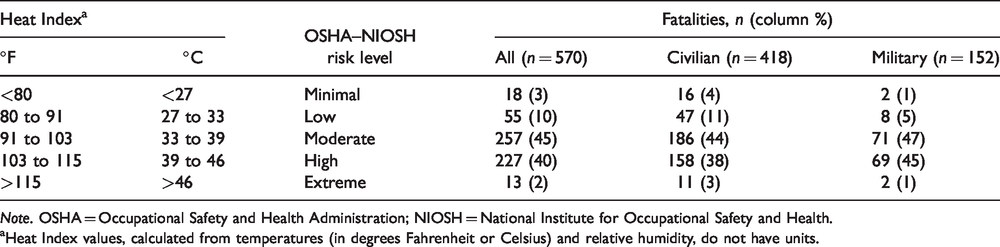
Note. OSHA = Occupational Safety and Health Administration; NIOSH = National Institute for Occupational Safety and Health.
aHeat Index values, calculated from temperatures (in degrees Fahrenheit or Celsius) and relative humidity, do not have units.
To propose a civilian heat death line, we first examined the sensitivity of each potential HI screening threshold (Figure 3). Candidate thresholds between 72 and 81 met our sensitivity goal of 95 percent to 99 percent. This range of HI was consistent with the 80 threshold in the existing guidance from NWS and OSHA–NIOSH. Consequently, we propose a heat death line defined by HI ≥80. In this meta-analysis, HI was greater than or equal to 80 in 96 percent (402 of 418) of civilian fatalities. Of note, the military and civilian data were consistent, as the sensitivity of this same 80 threshold was 99 percent (150 of 152) in the subset of military fatalities.
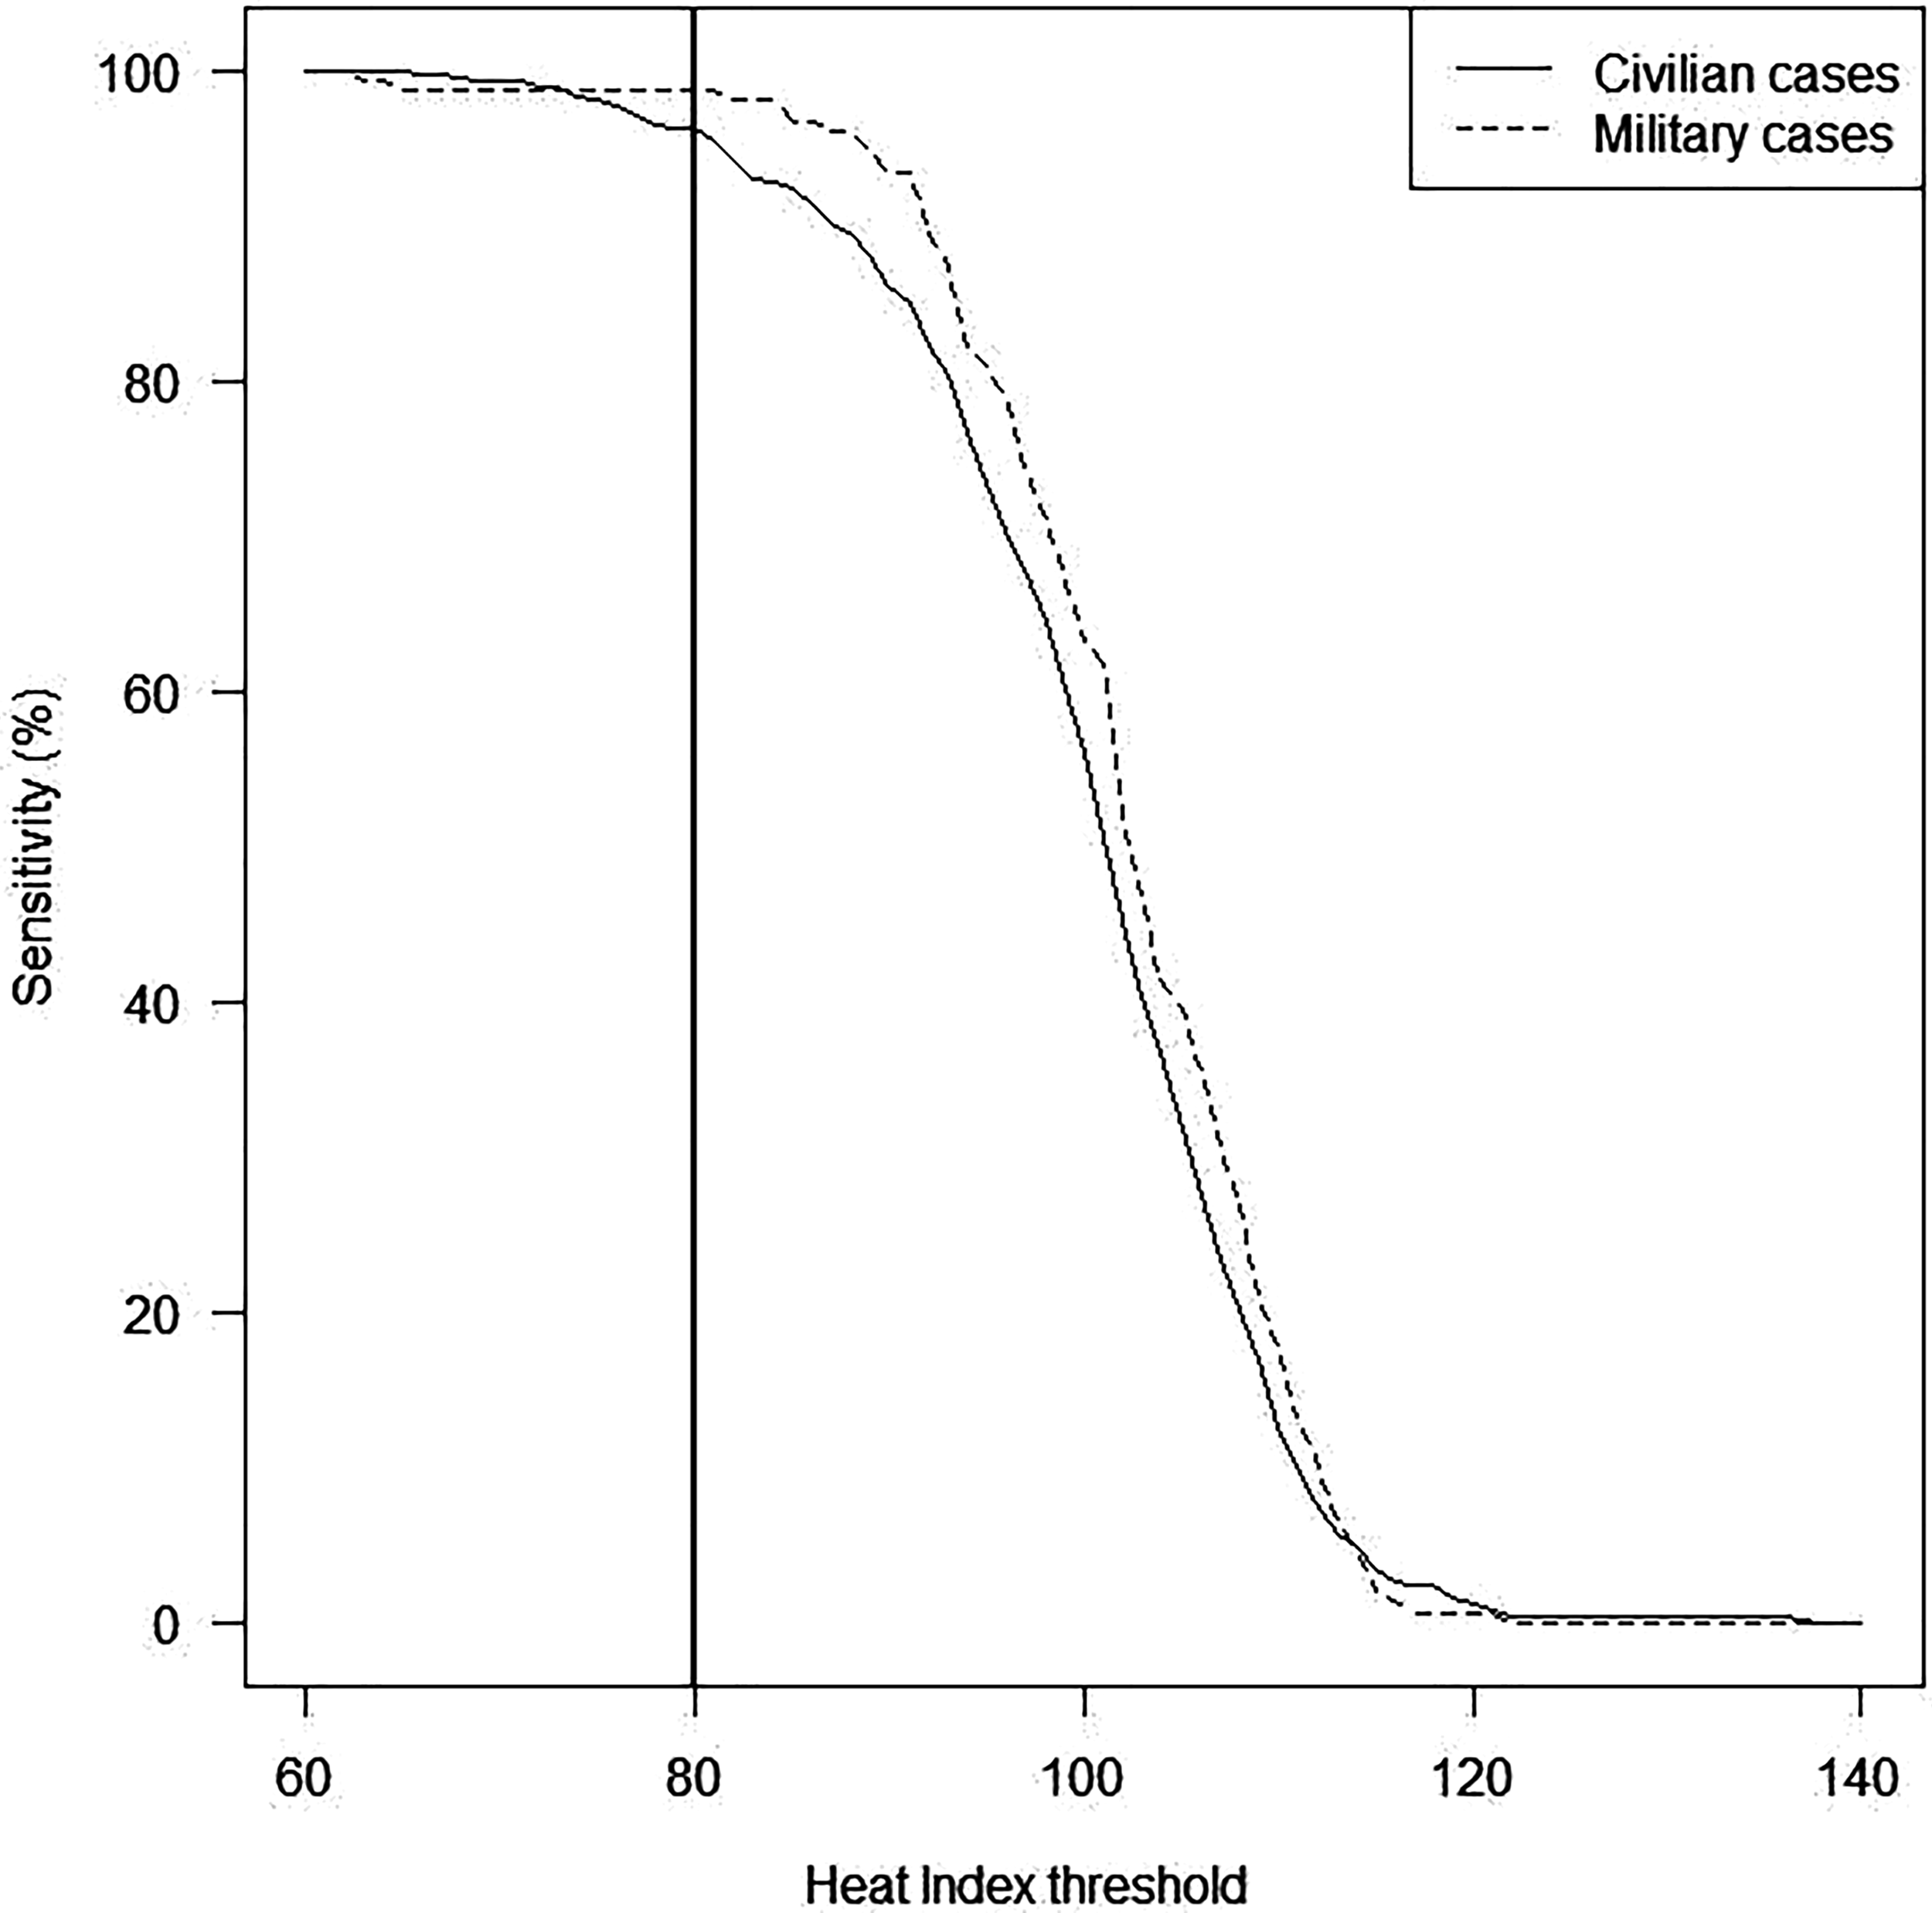
Sensitivity of each possible Heat Index threshold. The figure shows the percentage of occupational heat-related fatalities in which the Heat Index was greater than or equal to the given threshold. The thick vertical line at a Heat Index of 80°F (27°C) indicates the proposed “heat death line” (i.e., alert threshold) for civilian workers.
Discussion
We reviewed available occupational heat-related fatality reports with the intention of modernizing environmental heat ideas that were originally developed more than seventy years ago. A groundbreaking 1947 paper succinctly defined hazardous environmental heat conditions in both qualitative (“surprisingly low temperatures”) and quantitative (“heat death line”) terms. 5 Subsequent to that work, there has been a significant decline in military heat-related fatalities in ensuing years. Compared to 198 heat fatalities in a three-year period during World War II, 5 only 37 heat-related deaths were reported for the U.S. Army from 1980 to 2002. 31 This decrease has been attributed largely to improved methods for environmental monitoring, including the development of WGBT, coupled with effective preventive measures such as military regulations that limit training activity when environmental heat conditions exceed certain limits. 6
In a retrospective analysis of more than 500 heat deaths, HI exceeded our proposed alert threshold of 80 in 96 percent of civilian cases and 99 percent of military cases. One important public health implication of our study is that employers and workers could utilize a heat death line at HI of 80 prospectively to trigger awareness of workplace heat hazards. Because U.S. military regulations already require WBGT measurements, 9 the HI findings herein are most pertinent to civilian worker protections. In the U.S., no specific nationwide regulatory standard addresses heat stress for civilian employers, although three states have promulgated their own heat standards.8,32,33 The data herein demonstrate that the current OSHA–NIOSH caution threshold of HI of 80 provides sufficient warning in most fatal cases. On the other hand, some existing HI alert thresholds have low sensitivity for recognition of potentially fatal workplace environmental heat. For example, 68 percent of civilian worker fatalities occurred when HI was less than 105 (Figure 3), a threshold that NWS commonly uses to issue heat advisories for the public. Similarly, 59 percent of civilian fatalities occurred on days when HI was below the OSHA–NIOSH “high risk” threshold of 103 (Table 1). Employers and workers should realize that fatal HRIs are possible when HI is within any of OSHA’s four risk levels. Although most deaths occurred when HI >80, employers and workers should consider taking basic preventive measures, like providing water and breaks, whenever HI is above 70.
It is important to note that in addition to temperature and humidity, previous studies have identified additional risk factors that can increase a worker’s risk of HRI. As summarized in NIOSH’s Criteria for a Recommended Standard in 2016, personal risk factors include older age (i.e., sixty years and older), obesity or lack of physical fitness, underlying chronic medical conditions, use of certain medications and drugs (e.g., cocaine, alcohol, performance enhancers, and caffeine), and lack of heat stress acclimatization due to short job tenure (generally defined as two weeks or less). 7 Job-related risk factors include exposure to direct sunlight, higher levels of physical exertion and metabolic rates, operation of heavy equipment, and donning of extensive personal protective equipment. Some of these risk factors are modifiable. 7 Fatalities observed in this study at HI above 80 may have been preventable with appropriate interventions.
We note that 16 civilian workers (4 percent) and 2 military personnel (1 percent) died when HI was between 60 and 79, that is, below our proposed heat death line. This result implies that any HI over 60 is potentially hazardous, especially when workers perform very heavy physical activity or wear clothing that inhibits heat dissipation. The two lowest HI values (62 and 64) in this study were associated with soldiers who died of heat stroke after marching/running while carrying 12 to 18 kg (26 to 40 pounds) of gear.20,22 One of the soldiers was wearing a double layer of clothing including a combat jacket. Three civilian workers also died when HI was in the 60s.28,30 Thus, while the 80 heat death line is a useful screening tool that will identify most fatal conditions, a comprehensive workplace heat stress assessment should account for environmental heat, metabolic heat, and clothing factors.1,7
In the peer-reviewed medical literature, we found only ninety outdoor civilian work-related fatality reports that contained enough weather data to reconstruct HI. Some epidemiologic studies were ineligible for inclusion in this review because weather data were presented only as summary statistics or there was not enough information to compute fatality-specific HI.34,35 The fact that only a small percentage of occupational heat stroke cases are reported in journals indicates a large potential for publication bias. Fortunately, one published study contained comprehensive U.S. HI data from 2014 to 2016, 30 and an unpublished dissertation chapter reported HI for all 327 eligible civilian heat fatalities in the U.S. from 2000 to 2010. 28 The latter study utilized data from the Census of Fatal Occupational Injuries, a Bureau of Labor Statistics project that attempts to be a complete census of U.S. fatal work injuries. Thus, the current review includes nearly comprehensive U.S. civilian HI data for fourteen of the last nineteen years. Our results should therefore be representative of environmental conditions that caused outdoor U.S. civilian workers to die of heat stroke.
This study had at least five important limitations. First, we found that published fatality reports infrequently quantified WBGT and physical activity level. Lack of this information precluded us from comparing total heat stress to WBGT- and workload-based occupational exposure limits. The paucity of WBGT measurements likely reflects the fact that most employers do not measure WBGT despite the fact that WBGT measurements are recommended by NIOSH, OSHA, and the American Conference of Governmental Industrial Hygienists. All employers should consider using validated tools, in real time, to monitor heat stress conditions. We also recommend that researchers begin to quantify and report WBGT and physical activity, whenever possible, using measured data or validated algorithms. 36 Second, most studies in this review reported the day’s maximum temperature or HI. Reliance on maximum temperature readings biases our results toward overestimating the average HI experienced by workers during their workday. It is likely that an alert threshold based on the average HI would be even lower than 80. Third, most weather data came from off-site meteorological observation stations. Heat conditions at the work sites might have differed, either because of microclimates or because the nearest weather station was too distant to be representative. Fourth, we restricted our analysis to outdoor work sites, where sunlight often causes additional heat stress that is not reflected in HI data. Thus, the numerical value of our heat death line might not be generalizable to indoor work sites, which lack sunlight and which have other heating, air conditioning, and ventilation issues that influence heat stress. Fifth, we were unable to compute the specificity of the proposed HI of 80 alert threshold because we had no information about noncases. We note that the specificity of the proposed heat death line is likely to be low, given that outdoor heat-related fatalities are rare in comparison to the size of the heat-exposed workforce. However, for a threshold designed to promote awareness of potentially fatal conditions, high sensitivity is arguably more important than high specificity.
Conclusions
We propose a “heat death line” at an HI of 80. A meta-analysis of 570 occupational fatalities demonstrated that this HI threshold would have detected 96 percent of fatal heat stress conditions at outdoor civilian work sites. This heat death line is identical to the HI of 80 threshold at which NWS, OSHA, and NIOSH advise increased caution. Occupational heat stroke fatalities can occasionally occur below the proposed heat death line, when HI is between 60 and 79, particularly when workers perform very heavy physical activity. For this reason, employers should take basic heat stress precautions, such as provision of water, rest breaks, and shade, even when HI is below 80. Conditions above the heat death line, especially in unacclimatized workers, should prompt additional protective measures and/or a more detailed hazard analysis that includes evaluation of WBGT and work load. Close supervision should be provided when workers are exposed to extremely hot environments. Recommended protective measures include an acclimatization program for new workers, engineering controls and administrative controls to reduce heat stress, training of workers and supervisors about heat-related symptoms and first aid, and provision of shade and potable fluids. 7
Footnotes
Acknowledgments
The authors thank Michael Hodgson for valuable assistance with the design of this project. They also thank Cora Roelofs for providing unpublished data.
Authors’ Note
This article represents the views of the authors and does not necessarily represent the policy of the Occupational Safety and Health Administration or the U.S. Department of Labor.
Declaration of Conflicting Interests
The author(s) declared no potential conflicts of interest with respect to the research, authorship, and/or publication of this article.
Funding
The author(s) received no financial support for the research, authorship, and/or publication of this article.