



Abstract
Objectives: This article presents a cost-savings analysis of the statewide implementation of an evidence-informed parenting education program. Methods: Between the years 2005 and 2008, the state of Louisiana used the Nurturing Parenting Program (NPP) to impart parenting skills to child welfare-involved families. Following these families’ outcomes through August 2010, increased program attendance was associated with significant reductions in substantiated incidences and re-reports of child maltreatment. Program costs and benefits (cost savings) were calculated using program, workforce, and administrative data. Results: The benefit-cost ratio of 0.87 demonstrates that the NPP approaches cost neutrality in a short time period, without the consideration of long-term benefits or benefits to other systems. Conclusion: Louisiana’s child welfare department should be able to absorb all costs of statewide delivery of the NPP through observed reductions in repeat maltreatment. Targeted program delivery could potentially yield even greater savings.
Like many fields, child welfare is facing a demand for greater accountability. Funders, policy makers, advocates, program directors, and program participants want interventions with demonstrated effectiveness. Thus, evaluations that assess impact are needed (Partnership to Protect Children and Strengthen Families, 2007; Wilson & Alexandra, 2005). In addition, coupling program costs with effectiveness data to calculate savings is increasingly part of this demand for accountability and serves as a valuable tool for public policy and decision making (Goldhaber-Fiebert, Snowden, Wulczyn, Landsverk, & Horwitz, 2011; Lee & Aos, 2011). Federal agencies, including the Centers for Disease Control and the Children’s Bureau, are requiring cost analyses in the maltreatment prevention evaluations they fund (Brodowski & Filene, 2009; Corso & Filene, 2009). Yet, in the social work field, and especially child welfare, these analyses remain relatively rare (Kaplan, 2012; Mullen & Shuluk, 2011).
This article outlines a practical cost-savings approach that builds on previous evaluation results. It describes the range of approaches for cost analyses in child welfare and details a step-by-step approach for conducting a cost analysis using administrative data. Similar case studies and commentaries are emerging that describe the process and address the constraints, trade-offs, and challenges of cost analyses in this field (e.g., Boulatoff & Jump, 2007; Brodowski & Filene, 2009; Corso & Filene, 2009; Kaplan, 2012). In addition to detailing the approach in order to inform and promote similar types of analyses in the field, this study answers the question: what is the statewide benefit-cost (B-C) ratio during a specified time frame for a child welfare agency associated with different levels of participation in a parenting education program designed to prevent repeat maltreatment?
Definitions of Cost Analyses
Cost analyses are used to describe program costs in relation to benefits. Two types of cost analyses are typically used—cost-benefit or cost-effectiveness. While both types of analyses monetize program costs, only cost-benefit studies analyze outcomes monetarily. Measured benefits can be difficult to quantify and covert to a monetary benefit (e.g., improvements in parenting skills), and thus, cost-benefit studies are challenging to conduct (Lee & Aos, 2011; Selameab & Yeh, 2008). Instead, many studies perform cost-effectiveness analyses (e.g., DeSena et al., 2005; Sharac, McCrone, Rushton, & Monck, 2011), which compare costs and nonmonetized outcomes of a program to the status quo or an alternative program (Corso & Lutzker, 2006). Within each of these two types of cost analyses, a continuum of analyses are possible, ranging from direct and short-term calculations of program costs and benefits from a limited perspective (such as an agency or program) to the economic modeling of costs and long-term societal benefits of an intervention over the lifetime of participants.
Cost-savings is one particular form of a cost-benefit analysis and is the approach used in this article. Cost-savings is defined as follows: Cost-savings analysis is restricted to the costs and benefits realized by the government as a whole or a particular funding agency. Only the costs to the government are taken into account, and the benefits are those expressible as dollar savings somewhere in the government. This kind of analysis is used to determine whether a publicly provided program “pays for itself” and is thus justified not only by whatever human services it may render but also on financial terms alone (Karoly, Kilburn, Bigelow, Caulkins, & Cannon, 2001, p. xv).
A Review of Cost Studies in Child Welfare
Child welfare lacks extensive information on the societal costs of maltreatment as well as a rich menu of evidence-based programs that can prevent it (Corso & Fertig, 2010; Lee, Aos, & Miller, 2008; Plotnick & Deppman, 1999). A handful of studies have estimated the economic burden of maltreatment by examining the impact on many sectors of society over the lifetime of the victims, including short-term medical costs, long-term medical costs, productivity losses, child welfare costs, special education, criminal justice costs, and/or quality of life costs (see Corso & Fertig, 2010 for a review of these studies). As a demonstration of the extensive economic burden of child maltreatment to society, the most recent national estimate for the lifetime costs of maltreatment occurring in a single year ranged from $124 billion to $585 billion (Fang, Brown, Florence, & Mercy, 2012).
A few states have taken a similar societal approach to estimate the costs of maltreatment and, in some cases, savings from prevention activities. Watters, Odom, Ferguson, Boschung, and Edwards (2007) used the direct costs of hospitalizations and low-weight births, chronic illnesses, mental health treatment, child welfare services, police services, and judicial actions to estimate abuse and neglect costs in Alabama. The study also considered the indirect costs of maltreatment related to special education, housing juvenile delinquents and adult offenders, accelerated mortality, and reduced lifetime earnings. For Colorado, Gould and O’Brien (1995) estimated the direct costs of Child Protective Services (CPS) investigations, in-home services, out-of-home placements, and many of the same aforementioned indirect costs included in the Alabama study. They included the additional costs of community programs, job training, and domestic violence and substance abuse programs, as well as cost savings from a home-visiting program. In Michigan, two different prevention models (i.e., home visitor and parent education programs) were deemed cost effective relative to the long-term direct and indirect costs of maltreatment, which were measured similarly to those in the Alabama and Colorado studies (Caldwell, 1992; Noor & Caldwell, 2005).
Cost-benefit results on specific programs in child welfare are sparse, which has been attributed to a lack of suitable data on program costs, the inability to capture quality of life measures for children, and a general lack of feasibility from a resource perspective (Goldhaber-Fiebert et al., 2011; Kaplan, 2012). A relatively small number of programs in child welfare do have cost-benefit results, which have been summarized in several reviews. For instance, a review of parenting education programs conducted by McGroder and Hyra (2009) highlighted the cost-effectiveness of some of these programs. Another review of child maltreatment prevention programs with cost analyses found some programs have positive B-C ratios (e.g., Parent Child Interaction Therapy), indicating savings are greater than the cost, while others have negative (e.g., Healthy Families America) or inconclusive B-C ratios (e.g., Project KEEP; Lee et al., 2008). Finally, Goldhaber-Fiebert et al. (2011) conducted a comprehensive review that found only 21 original studies of interventions in child welfare with cost analyses.
A number of studies in child welfare have taken a more limited approach to conducting cost analyses. These studies either included only program costs and not benefits (e.g., Foster, Porter, Ayers, Kaplan, & Sandler, 2007) or the benefits are nonmonetized (e.g., Foster, Jones, & Conduct Problems Prevention Research Group, 2006; Goldfine, Wagner, Branstetter, & Mcneil, 2008; Sharac et al., 2011). One study, similar to the analysis presented here, examined the service costs of different types of out-of-home service models in relationship to children’s length and number of placements to assess the value of a short-term group care program called SAFE Homes (DeSena et al., 2005). These types of program-level studies reflect the growing demand for information on program costs and provide important information on maltreatment prevention.
This study expands on these studies by including both program costs and monetized benefits from the perspective of the child welfare agency to calculate a B-C ratio. It illustrates the steps, the value, and the practical considerations for conducting a cost analysis. In addition, this study makes a substantive contribution by estimating the B-C ratio associated with an evidence-informed parent education program in child welfare. First, the evaluation on which the cost-savings analysis is based is described. Next, the steps taken to conduct the analysis are outlined in detail, with limitations identified along the way. Then, the B-C ratio is calculated and sensitivity analyses are conducted. Finally, the implications of this work, the contributions it makes to decision making within child welfare, and appropriate cautions about relying on a cost perspective alone are discussed.
Method
The cost-savings analysis approach used for this study is built upon an existing evaluation of a statewide implementation of an evidence-informed parenting program for child welfare-involved families referred to parenting education in Louisiana (Maher, Marcynyszyn, Corwin, & Hodnett, 2011). The intervention—The Nurturing Parenting Program (NPP) for Infants, Toddlers, and Preschoolers—is a parenting education program designed to prevent maltreatment by developing positive parenting skills for caregivers of young children (Bavolek & Dellinger-Bavolek, 1985). The program was delivered statewide to all parents referred by child welfare to parenting education with the goal of preventing maltreatment and foster care placement. Maher et al. (2011) documented significant reductions in repeat maltreatment associated with higher levels of participation in the NPP. The cost-savings analysis builds on these results and estimates the savings to the child welfare agency over a 4½-year period stemming from decreased service and workforce costs associated with this reduction in maltreatment.
Through the methods and results section, each step in conducting a cost analysis is outlined, while some of the considerations and limitations are highlighted, replicating a similar approach by Farnham, Ackerman, and Haddix (1996). This evaluation was exempt from Institutional Review Board review as a program evaluation and was approved by Louisiana’s Department of Social Services, Office of Community Services (DSS OCS).
Step One: Determine the Perspective of the Cost Analysis
The perspective chosen when conducting a cost analysis guides subsequent analytical decisions. Resource constraints, in part, determined the perspective taken for this cost analysis—a short-term time horizon from the perspective of the child welfare agency. These constraints shaped the approach since primary data collection and a long follow-up period was not possible. This choice resulted in a conservative approach to estimating the savings since costs associated with maltreatment to other systems and long-term consequences of abuse and neglect were unavailable. This more limited perspective, however, has significant practical value for child welfare agencies, whose decision making is often focused on the direct impact to their agencies and short-term legislative budget cycles (Chamberlain et al., 2011) and may be a more viable approach to economic analyses in child welfare due to limited resources (Kaplan, 2012). Nonetheless, the choice of perspective taken (societal vs. agency) and the time horizon chosen can result in cost-benefit analyses that vary substantially (Plotnick & Deppman, 1999). For example, a community-based child welfare agency may view the costs of implementing a parenting education program as training, administration, overhead, and materials, and the generated savings as flowing from a reduced need for in-home services, foster care, team meetings, or services that the agency would normally provide. A cost-benefit analysis at the state level, however, may result in very different findings for the same program if the state analyzes program costs for the statewide implementation of the program and the generated savings from reductions in medical expenses and adult criminality or increases in job productivity and child well-being. Thus, the cost-benefit analyses for the same program may yield significantly different results depending on the perspective taken.
Step Two: Define the Sample and Study Population
To allow for valid inferential statements about program impact and inform the generalizability of the cost findings, the target population for the program and the sampling approach must be defined up front. If a sample is used, it should be adequately representative of the target population. This cost-savings analysis was based on the population of caregivers from the outcome evaluation, thus, a sample was not utilized. The population consisted of all caregivers in Louisiana with young children who came to the attention of child welfare, were referred to parenting education, and attended the NPP between October 2005 and April 2008 in 10 of the state’s 11 family resource centers. Caregivers served by the resource center in New Orleans were excluded from the evaluation because Hurricane Katrina necessitated significant program modifications that limited comparability. With the exception of a very small number of families who were screened out across the state (approximately 50) for circumstances that prevented constructive participation in the program (i.e., serious cognitive impairment, work barriers, and substance abuse), all child welfare-involved families with infants, toddlers, or preschool-aged children in the state with child abuse or neglect allegations assessed as needing parent education were referred to the NPP at one of these resource centers. The study used data from 528 caregivers participating for the first time in the NPP. Demographic characteristics of the population are summarized in Maher et al. (2011).
Step Three: Describe the Intervention
A detailed description of the intervention needs to accompany any cost analysis to logically link observed outcomes to the program and to capture the program elements with implications for costs. The intervention for this cost analysis, NPP, is based on social learning theory (Bandura, 1977, 1986) and the associated premise that most parenting patterns are learned during childhood and replicated later in life when the child becomes a parent. The program is designed to assess, prevent, and treat maltreatment by developing nurturing parenting skills as a counter to the key constructs of abusive and neglectful parenting including inappropriate expectations of the child, lack of empathy toward children’s needs, use of corporal punishment as a means of discipline, reversal of parent-child role responsibilities, and oppressing children’s power and independence (Bavolek & Keene, 2005; Bavolek, Kline, McLaughlin, & Publicover, 1979). In particular, the NPP is built on the core principle that empathy is the foundation of responsive parenting, for which there is general agreement that promoting nurturing and empathic parenting practices is critical to the safety and well-being of children (Donald & Jureidini, 2004; Kochanska & Aksan, 1995; Laible, 2004). The NPP for Infants, Toddlers, and Preschoolers focuses on parental self-awareness and empowerment, the development of empathy, understanding child development and the role of discipline, emotional communication, behavior skills training, the importance of routines, and making good choices for child safety for parents of children birth to 5 years old (Bavolek, 2000). The program is designed to be flexible in its application and involves lesson guides, DVDs, parent handbooks, assessment inventories, behavioral modeling, discussion, role playing, home visiting, and family activities to promote cognitive and affective learning. The NPP manual is written at the fifth grade level, and the state child welfare agency worked with the program developer to create an “Easy Reader” version of the materials for use with caregivers with more limited reading ability. Finally, the NPP is structured to involve children in the learning process where possible.
For the statewide implementation, Louisiana’s DSS OCS provided funding to train bachelor’s or master’s level resource center staff to become NPP facilitators. In addition, front-line child welfare staff were also trained so they could become familiar with the program model. The NPP was administered as a 16-week group-based program, the minimum number of NPP sessions recommended for a child welfare population (S. Bavolek, personal communication, January 31, 2011). Group sessions lasted approximately 2½ hours. Home visits, averaging about an hour in length, were used as make-ups for missed group sessions (in order to maximize participation), as compliments to the group sessions to reinforce concepts for parents who needed more time, and as supplemental sessions for parents who had other needs. To promote accessibility, the resource center staff were expected to assist caregivers in transportation plans to and from sessions as needed. Describing all of the features of the program delivery is critical as how the program is delivered will affect the program costs.
Step Four: Establish the Outcome Measure/Measures for Estimating Savings
The benefit portion of the B-C ratio stems directly from the observed outcomes associated with the intervention. The observed outcomes are guided by the perspective of the cost analysis. Cost savings from an intervention are realized in one of two ways: the avoidance of future costs or the generation of monetary benefits. In this analysis, savings were calculated from the avoidance of the direct costs of child maltreatment to the child welfare agency. Indirect savings (e.g., reduced criminal justice involvement, greater educational attainment) and opportunity costs (e.g., foregone income for parents attending the intervention or lost lifetime earnings for maltreated children) were not included but are typically recommended as part of a full economic analysis, which involves taking the societal perspective (Conrad, 2006; Lee & Aos, 2011; Wang & Holton, 2007).
Maher et al. (2011) demonstrated, using secondary analysis of administrative data, that greater participation in the NPP was associated with a reduction in short-term allegations and longer-term substantiated child maltreatment incidences—controlling for other characteristics of children and families that might be associated with participation or maltreatment (i.e., individual and household demographics, socioeconomic status, and risk factors for maltreatment, including prior maltreatment history for children and caregivers and parenting beliefs, such as the belief in the use of corporal punishment). For each additional session of the NPP, they found a significant decrease in both the likelihood of a maltreatment report within 6 months and the likelihood of a substantiated report within 2 years of completing the NPP. The more sessions caregivers attended, the more child safety improved. In other words, 6 months after the program’s conclusion, caregivers were significantly less likely to be re-reported for child maltreatment for every additional NPP session attended. Two years after participating, caregivers who attended more sessions were significantly less likely to have a substantiated maltreatment incidence. Logistic regression models were used to estimate these effects, and the cost-savings analysis was built around these outcome models.
Post-estimation commands for logistic regression in Stata (Long & Freese, 2006) were used to produce predicted probabilities of repeat maltreatment for an “average” caregiver at two illustrative levels of program attendance for each time period and type of report. The population average (18 group and home sessions) was used in comparison to the lowest decile of attendance (3 sessions) from which predicted probabilities of repeat maltreatment were obtained. Attendance ranged from 1 to 32 group and home sessions. Figure 1 presents this information visually.
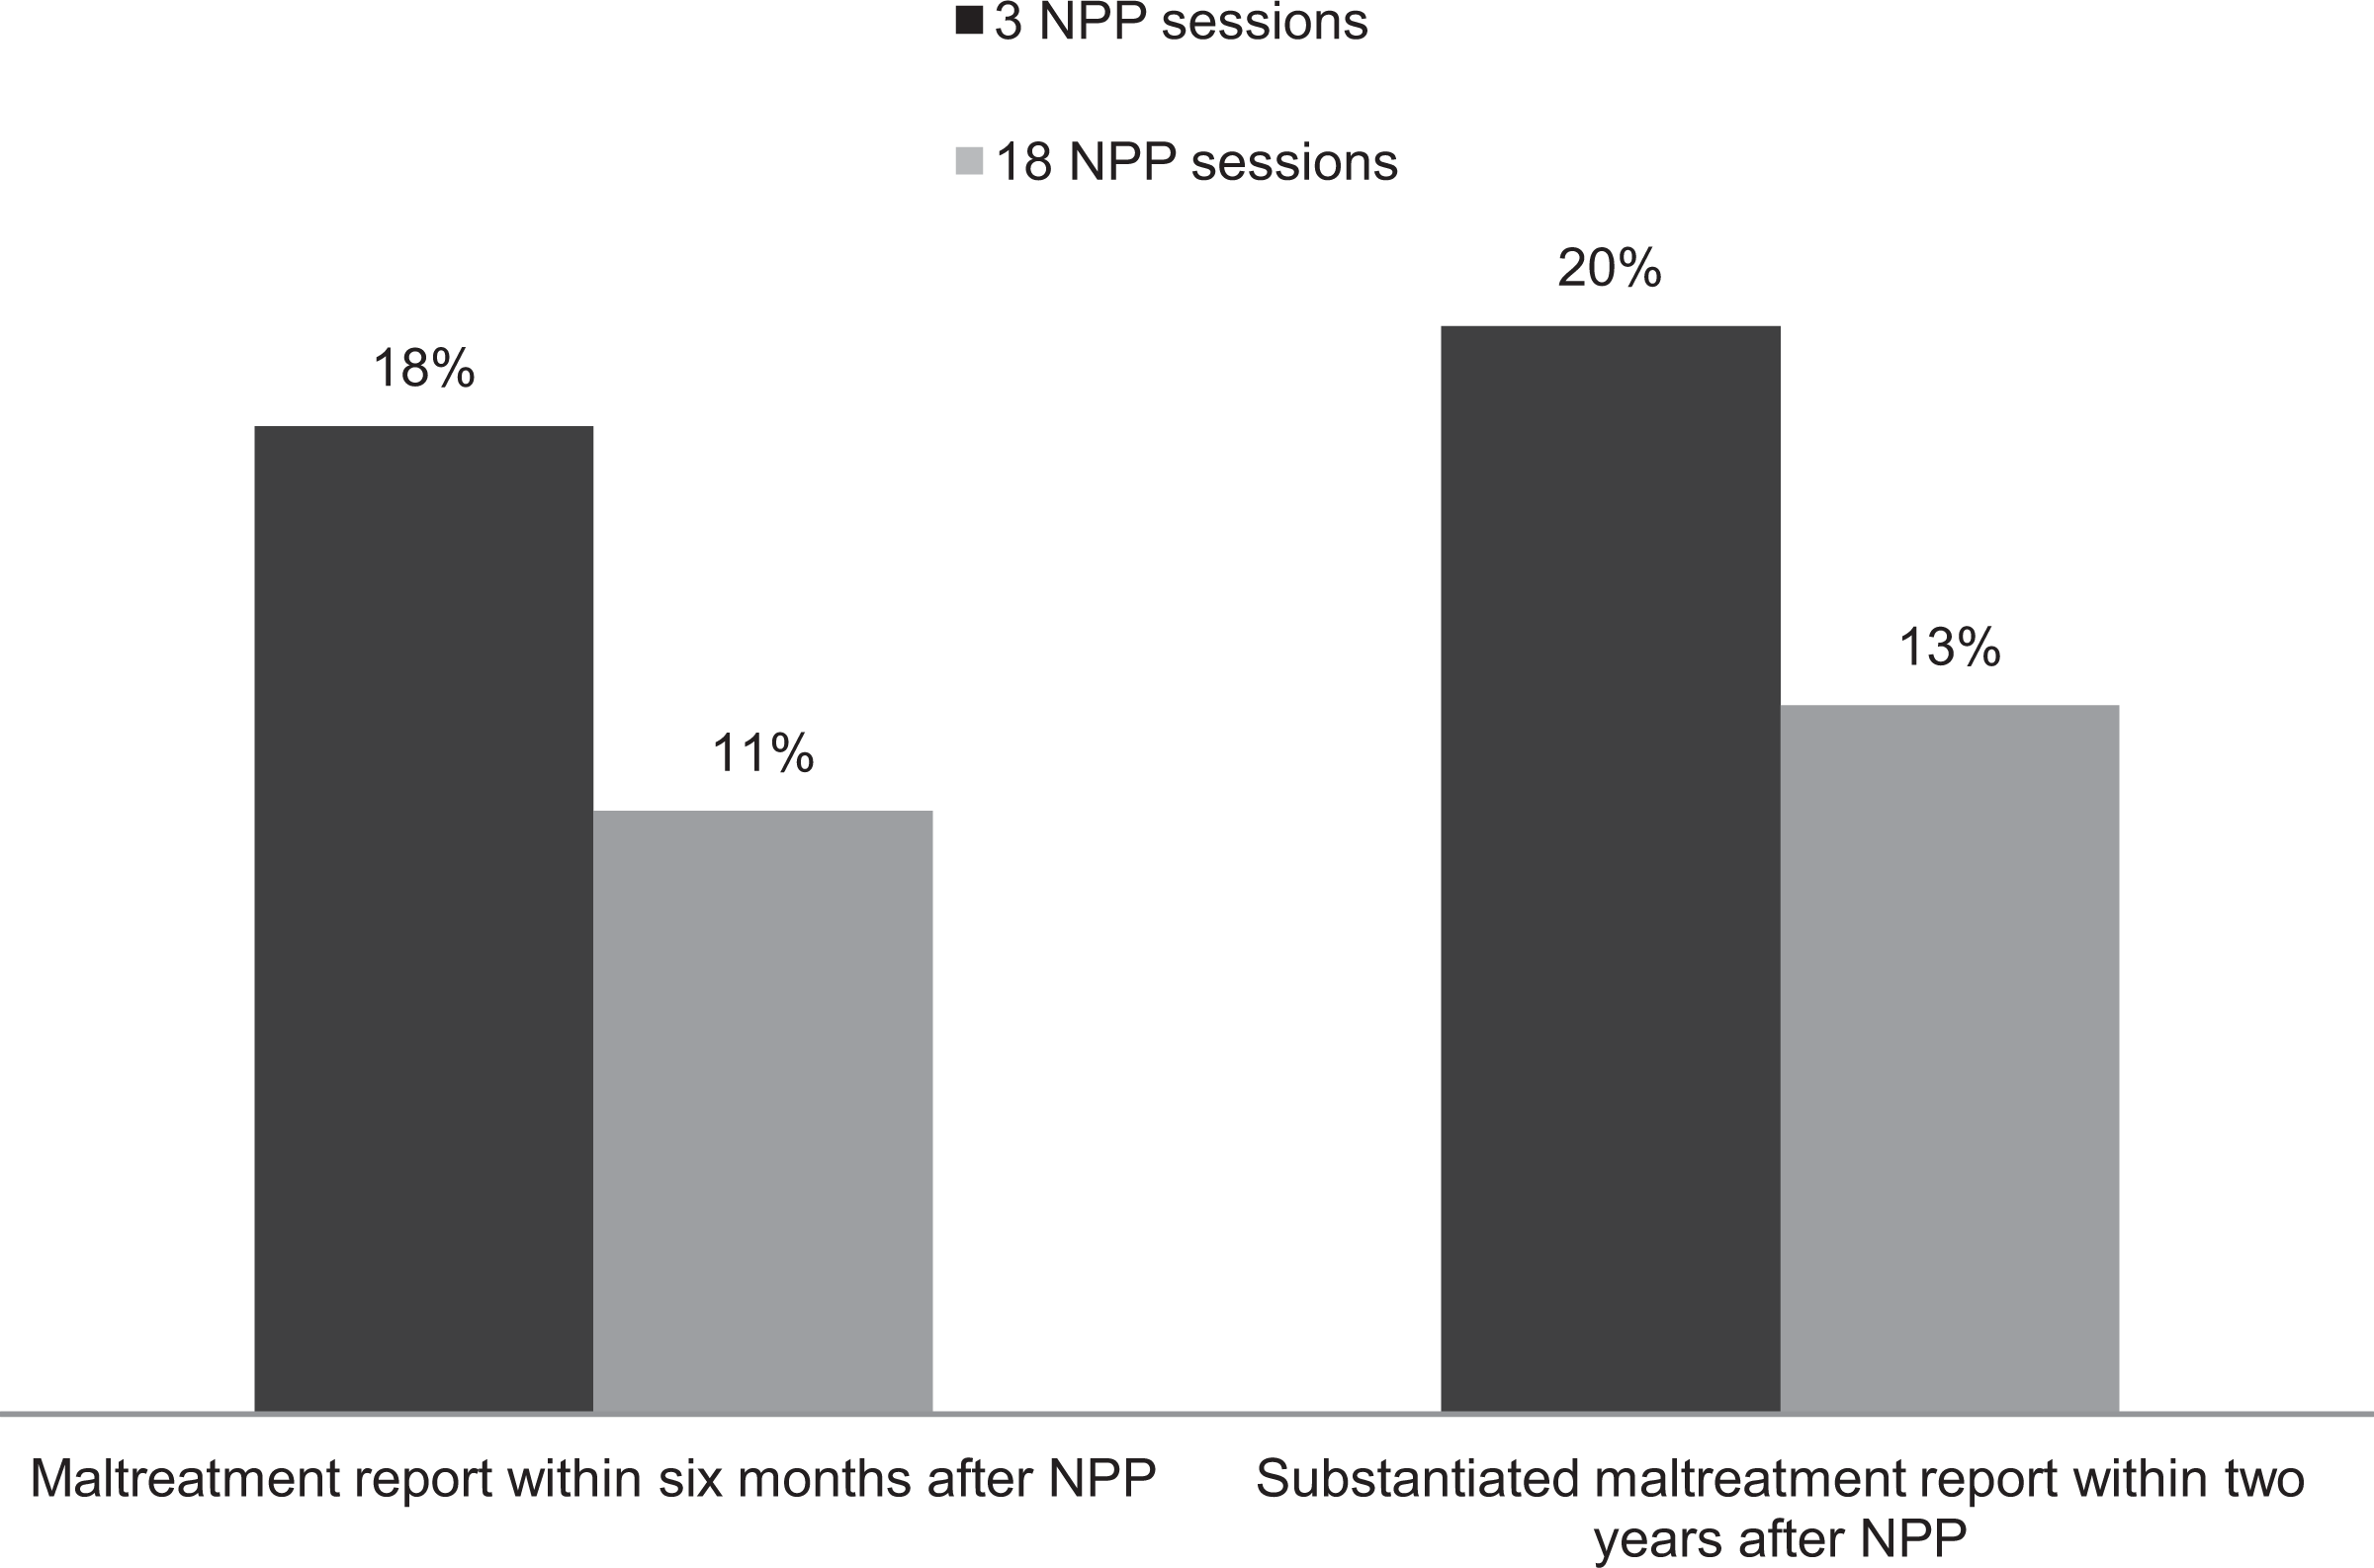
Likelihood of child maltreatment at two time periods by sessions attended. Adapted from “Dosage Matters: The Relationship between Participation in the Nurturing Parenting Program for Infants, Toddlers, and Preschoolers and Subsequent Child Maltreatment,” by E. J. Maher, L. A. Marcynyszyn, T. W. Corwin, and R. Hodnett, 2011, Children and Youth Services Review, 33, 1431. Copyright 2011 by Elsevier Ltd. Reprinted with permission.
Step Five: Determine the Data Sources to Conduct the Cost Analysis
Once the perspective has been established, the study population defined, and the outcomes identified, sources of data for the analysis need to be identified. In this case, a combination of existing data on program delivery, administrative data on maltreatment and service records, and workforce data were used to calculate the program costs and cost savings.
Program Data
Detailed knowledge about the components of an intervention and how it is implemented are necessary for estimating the costs of the intervention, as well as understanding how it is designed to work with the target population. These costs may be straightforward, such as the one-time purchase of training materials, or a bit more difficult to isolate, such as overhead or transportation costs. For example, transportation costs may include time, the price of gas, bus fare, vehicle maintenance, and other considerations.
Researchers generally recommend using the “ingredient method,” developed by Levin (1983) and enhanced by Chambers and Parrish (1983) to measure program costs (Corso & Lutzker, 2006; Plotnick & Deppman, 1999). Program costs are built up from all components and resources used to provide the service, including all personnel and nonpersonnel costs as well as donated, volunteer, and in-kind resources (Foster et al., 2007). Often, this involves primary data collection including time diaries from staff, which can be expensive and burdensome and require significant engagement from program staff (Brodowski & Filene, 2009; Chamberlain et al., 2011).
This analysis relied on previously collected information on program costs. In 2008, Louisiana’s DSS OCS collected information on program costs from a convenience sample of 5 of the 10 resource centers delivering the NPP. The centers provided estimates of staff time for group sessions and home visits (group and child facilitators, clerical support); associated salaries; expenses (transportation, supplies, food, photocopying); and, group size. Only one of the five agencies reporting cost information included supervision costs. DSS OCS also provided statewide contract amounts for ongoing training, technical assistance to the resource centers, and state oversight for quality assurance.
The start-up costs for training and infrastructure (e.g., training the trainers) were not available and, thus, these costs were not included. Another category of program costs that was not included in the calculation was overhead or nonpersonnel costs (e.g., governance and administration; rent or facility costs; equipment, including depreciation; material costs; in-kind or volunteer resources; and information systems or performance monitoring costs). To obtain precise estimates of the proportion of nonpersonnel costs dedicated to NPP, given that all centers provide other services as well, additional in-depth interviews and/or analysis of center budgets would be necessary, which was beyond the scope of this study.
While direct service personnel costs typically constitute the highest proportion of program delivery costs, a limited literature provides some guidance in the estimation of nonpersonnel costs. Two studies in child welfare report nonpersonnel costs for service delivery of particular programs as about 24–26% of total costs (Corso & Filene, 2009; Foster et al., 2007). However, the budget categories in these studies do not directly align with this study, so they were not applied to the program costs. Thus, the reader should be aware, the program costs in this study were underestimated for this reason. (Similarly, nonpersonnel overhead costs of services stemming from maltreatment were not included either, and, if similar, these omissions on each side of the B-C equation would cancel each other out. Those omissions are discussed next.)
Outcome Data
The data sources for the logistic regression model used in the outcome evaluation included NPP attendance data; the state child welfare Tracking and Information Payment System (TIPS), which is the state’s administrative child welfare data system; and, the Adult-Adolescent Parenting Inventory-2 pre- and post-test surveys (Bavolek & Keene, 2001). Savings from reductions in maltreatment associated with level of participation in the NPP were measured in terms of the reduction in costs incurred following significant reductions in substantiated and unsubstantiated reports of maltreatment.
Sources for calculating the reduction in direct costs associated with maltreatment included the TIPS administrative data, which contained the duration of time children spent in foster care (to the day), the services families received, the duration of in-home services provided, and the dates of investigations that resulted from both the reported incidences of maltreatment within 6 months and the substantiated incidences within 2 years following the NPP for every program participant.
DSS OCS provided the average daily payment rate per child for foster care, which was applied to each date of service. Additional services provided to these families and those receiving in-home services were also included. For foster care, these included special board payments (for special needs children), clothing, respite care, transportation, evaluation, medical/treatment, school supplies, incidental expenses, and day care. For in-home services and child protective investigations, service costs included payments from the preventive assistance fund and reunification assistance fund, transportation, evaluation, medical/treatment, and incidental expenses. Finally, average daily personnel costs for foster care, in-home services, and child protective investigations were calculated using the salary and caseload information for supervisors and case workers, provided by DSS OCS, applied to each service day and type.
Results
In this section, the process of calculating program costs, costs associated with repeat maltreatment, cost savings, and B-C ratios is outlined, as well as how sensitivity analyses were conducted.
Step Six: Calculate Program Costs
Program data from five resource centers provided estimates of staff time, expenses, and group size, all of which were used to produce an average program cost per caregiver. Of course, program costs could vary significantly depending on staff qualifications, education, and compensation; differences in the numbers of group and home-visiting sessions administered; and, regional differences in cost. The average program cost per caregiver across all five centers in the sample was used to estimate a statewide program cost. Sensitivity analyses are described in a later step in order to demonstrate how state cost estimates vary based on the range of costs provided by the sample of resource centers.
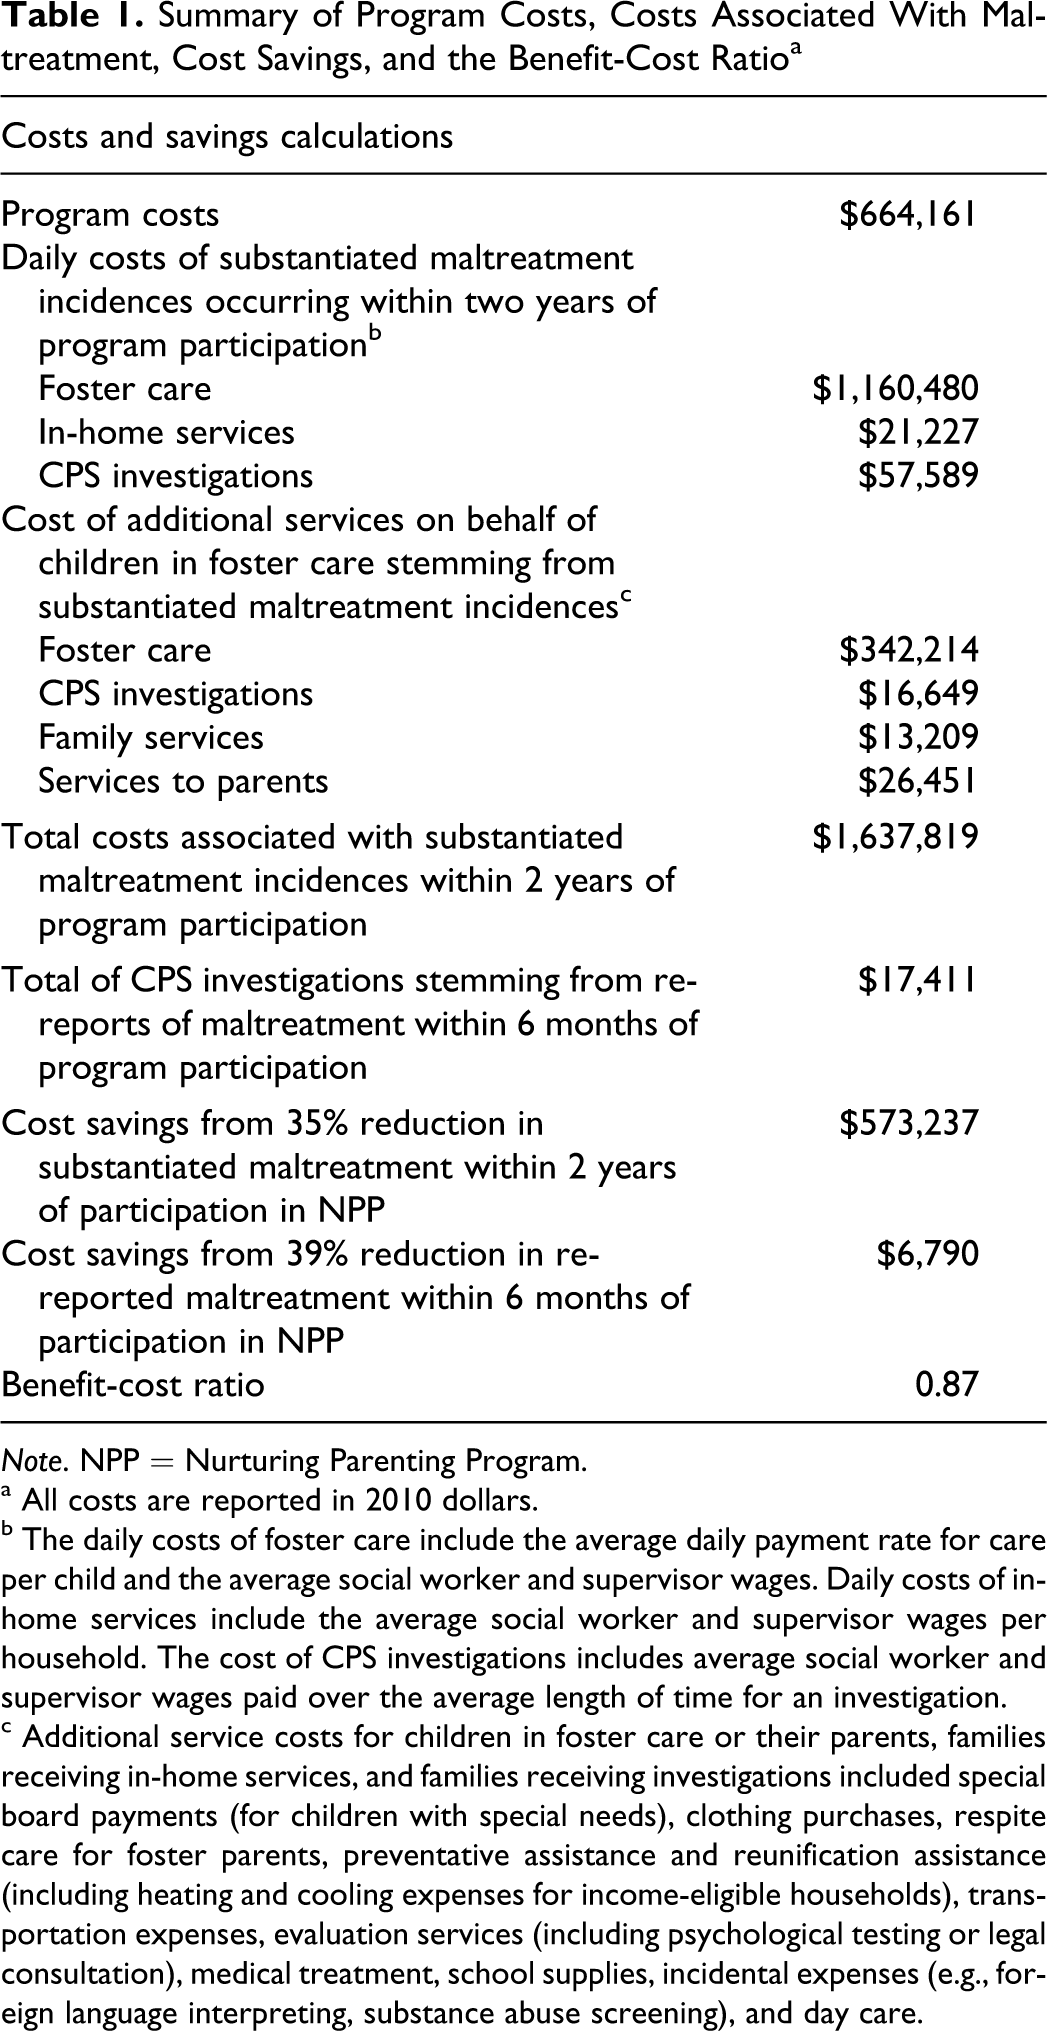
For purposes of comparability, all program costs were adjusted to 2010 values using the CPI inflation calculator (U.S. Department of Labor, 2011). In 2010 dollars, the average program cost per caregiver was $1,258, which sums to an aggregate cost of $664,161 for all 528 caregivers who participated in the NPP between October 2005 and April 2008. Program costs are not presented as an annual amount, as the number of participants varied each year. In addition, the estimated savings did not accrue at a constant annual rate during the study time frame.
Step Seven: Calculate Costs Associated With Outcomes for Estimating Cost Savings
The service costs associated with repeat maltreatment occurred between 2006 and 2010. The daily expenditures per caregiver were summed to calculate the aggregate service and personnel cost for this population of caregivers from the time they completed the NPP to the time of the cost analysis (August 2010). It is important to note, the time frame for calculating service costs was not the same for all families, since it was based on different cohorts of caregivers who participated in the NPP during the first 2½ years of program implementation. The time frame for the receipt of child welfare services for these caregivers ranged from 2 years and 4 months to 4½ years, depending on when they completed the NPP. Since some caregivers received services beyond the cost analysis cutoff date, the direct costs of maltreatment will accrue over time.
As mentioned previously, the reduction in costs associated with reductions in maltreatment were underestimated due to the fact that only direct child welfare personnel and service expenditure costs were included. Costs to the state child welfare agency for governance, administration, and other nonpersonnel costs (rent, supplies, and equipment) were not available. If included, service delivery expenditures would increase by approximately 25% (Corso & Filene, 2009; Foster et al., 2007), which is similar to the estimates from the literature for program delivery. Savings were further underestimated due to the absence of costs to other systems such as medicaid or education.
A discount rate was used for all service costs that were incurred more than 1 year following completion of the NPP. Discounting is necessary because immediate benefits are worth more than future benefits. In other words, prevention of a maltreatment incident immediately following an intervention is of more value than prevention of a maltreatment incident at a later date. Benefits occurring at different time periods need to be made directly comparable by adjusting them to their net present value through the application of a discount rate (Plotnick & Deppman, 1999). Because the value of costs associated with maltreatment prevented earlier are at a premium, costs incurred more than 1 year following the NPP, and the subsequent cost savings, were discounted to the year immediately following completion of the NPP for each caregiver for whom this applies. An inflation rate is not typically applied to benefits because the discount rate would be adjusted by the same inflation rate, and thus, would result in a net cancellation (Plotnick & Deppman, 1999). As Burgess and Zerbe (2011) point out, there is little agreement on what discount rate to apply when estimating net present values; however, a commonly used discount rate of 3.5% was used in the present study and is recommended in similar studies (Karoly et al., 2001; Moore, Boardman, Vining, Weimer, & Greenberg, 2004; Zerbe et al., 2009). As is typically done, sensitivity analyses were performed around this discount rate.
Substantiated maltreatment costs (after discounting) totaled $1,637,819 during the child welfare service period ending August 2010. An additional cost of $17,411 not already accounted for stemmed from child protective investigations of reported incidences of maltreatment that were unsubstantiated.
Step Eight: Calculate Cost Savings
Table 1 presents the total program costs for the evaluation period in relationship to the estimated savings from reductions in maltreatment. Maher et al. (2011) demonstrated that caregivers attending 18 program sessions were 39% less likely to have a reported incidence of maltreatment within 6 months following the NPP, and 35% less likely to have a substantiated incidence of maltreatment within 2 years following the NPP, compared to caregivers that attended only three sessions. Applying these percentage reductions to the costs reported above, resulted in a savings of $580,027 (39% of $17,411 and 35% of $1,637,819, which sums to $580,027).
Summary of Program Costs, Costs Associated With Maltreatment, Cost Savings, and the Benefit-Cost Ratioa
Note. NPP = Nurturing Parenting Program.
a All costs are reported in 2010 dollars.
b The daily costs of foster care include the average daily payment rate for care per child and the average social worker and supervisor wages. Daily costs of in-home services include the average social worker and supervisor wages per household. The cost of CPS investigations includes average social worker and supervisor wages paid over the average length of time for an investigation.
c Additional service costs for children in foster care or their parents, families receiving in-home services, and families receiving investigations included special board payments (for children with special needs), clothing purchases, respite care for foster parents, preventative assistance and reunification assistance (including heating and cooling expenses for income-eligible households), transportation expenses, evaluation services (including psychological testing or legal consultation), medical treatment, school supplies, incidental expenses (e.g., foreign language interpreting, substance abuse screening), and day care.
Step Nine: Calculate the B-C Ratio/Ratios
The B-C ratio was calculated by dividing the aggregate cost savings ($580,027) by the aggregate program cost ($664,161). The B-C ratio calculated in this analysis equaled 0.87. In other words, following participants from the first 2½ years of program implementation, Louisiana’s child welfare agency could recoup at least 87% of the program costs within 4½ years from the start of implementation (assuming average attendance levels). In effect, the NPP approached cost neutrality (i.e., a B-C ratio of 1.0) within a short time frame based on the observable and measurable benefits of reductions in maltreatment incidences.
Step Ten: Conduct Sensitivity Analyses for Estimates
Since most cost analyses are subject to several assumptions, sensitivity analyses are typically conducted to demonstrate how these assumptions can lead to changes in the B-C ratio (Merrifield, 1997). For the sensitivity analyses in this study, the following were examined: (1) the low- and high-end program costs from the sample of five resource centers in case the other resource center costs were closer to one end of the range or the other, (2) the low and high end of the confidence interval around the predicted reduction in the probability of maltreatment per additional NPP session attended for participants, (3) different attendance levels used to estimate reductions in maltreatment, and (4) alternative discount rates.
Sensitivity analyses were conducted on the program costs since these estimates were based on a convenience sample. The five resource centers may not have been representative of all 10 resource centers in the state and program costs may vary as a function of staffing structure and regional differences in the cost of living. Findings revealed that sample error around the NPP program costs could substantially affect the B-C ratio. NPP program costs ranged from $1,072 to $1,597 per caregiver. The total program costs of delivering the NPP using these extreme values (after inflation) was estimated at $573,255 and $853,998, respectively. Using the highest resource center program costs, the B-C ratio dropped to 0.68; using the lowest program costs, the B-C ratio increased to 1.01. While the latter estimate yielded a positive B-C ratio from the NPP, this should not be interpreted as a reason to spend less on NPP delivery as lower program costs may affect the quality of program delivery and, concomitantly, may not be as effective in reducing maltreatment.
The results of the original outcome evaluation demonstrated a significant association between program attendance and repeat maltreatment (Maher et al., 2011); specifically, the odds ratio for attendance of 0.97 (with a standard error of 0.01) suggested that for every additional session of the NPP attended by a caregiver, the probability of substantiated maltreatment for that caregiver within 2 years of program participation declined by approximately 3.3%, controlling for other caregiver characteristics. The confidence interval around this estimate indicated this percentage reduction was between 1.1% and 5.5% with 95% confidence. Similarly, the estimate of 0.96 (with a standard error of 0.01) suggested that for every additional session of the NPP attended by a caregiver, the probability of a re-report of maltreatment for that caregiver within 6 months of program participation declined by approximately 3.8%, controlling for other caregiver characteristics. The confidence interval around this estimate ranged between a 1.3% and 6.3% reduction in re-reports of maltreatment. Using the low or high ends of the confidence intervals results in a B-C ratio of 0.32 or 1.30, respectively—a substantial difference in results.
Sensitivity analysis was also performed around the different levels of attendance used to calculate the percentage reduction in maltreatment. While defining program completion is not always clear-cut (i.e., How many sessions constitute completion? Does a participant need to attend specific sessions (e.g., one of the last sessions) to be defined as a completer?), differences in the likelihood of repeat maltreatment and the resulting B-C ratio were analyzed using a constructed definition of completers and noncompleters. Completers were defined as any participant who attended at least eight group sessions (half of the program duration) and at least one of the final two sessions. For completers, average attendance was 24 sessions (group sessions and home visits), and for noncompleters, average attendance was 10 sessions. The difference in the likelihood of repeat maltreatment for completers and noncompleters was 38% for unsubstantiated reports of maltreatment after 6 months and 34% for substantiated reports of maltreatment after 2 years, resulting in a B-C ratio of 0.85. While using the attendance levels for completers versus noncompleters did not dramatically change the B-C ratio, this exercise demonstrated that the B-C ratio can be sensitive to the predicted probabilities for different levels of attendance.
A sensitivity analysis was also performed around the discount rate—3.5%. Discount rates of 2% and 5% were used for the sensitivity analysis. Using a discount rate of 2%, the total maltreatment costs were calculated to be $1,686,658. Using a discount rate of 5%, the total maltreatment costs equaled $1,625,094. Using the more conservative discount rate of 5% for the maltreatment costs and resultant savings, the B-C ratio dropped to 0.86; using the less conservative discount rate of 2%, the B-C ratio increased to 0.89. The use of different discount rates would have a larger impact on the B-C ratio if a longer time horizon was available to estimate savings. For outcomes observed in shorter time periods, the discount rate does not make a substantial difference.
These sensitivity analyses are reported to show the impact of varying assumptions used in calculating the B-C ratio. As demonstrated, variations in the program costs per caregiver, the predicted reductions in maltreatment, different attendance levels, and the discount rate can substantially affect the estimated B-C ratio. However, the B-C ratio of 0.87 reflects the middle ground of these assumptions that most likely accurately reflects the potential savings of the NPP for the time period examined.
Discussion
In this article, the method for conducting a cost-savings analysis using existing data and previously published evaluation results is showcased. This approach draws upon existing methods in economic evaluation literature, takes a relatively short-term perspective that relies on existing data, and produces a practical estimate of cost savings, which may be the direction child welfare needs to go in the absence of the significant resources required for extensive economic analyses (Kaplan, 2012). The NPP was delivered to all caregivers in Louisiana with prior maltreatment reports for whom parenting education was an appropriate intervention. Due to the large numbers of families served, the costs for program delivery were substantial. For the population of parents referred to parenting education in Louisiana, only a small percentage of caregivers had a second substantiated maltreatment incident (16.9%) and, among these, only a proportion resulted in foster care placements (40.4%). Yet, the NPP was provided to all families for whom parenting education was recommended. Thus, this cost-savings analysis was approached with the realization that it may be difficult to observe statewide savings from maltreatment reductions for a small subset of families. However, the final B-C ratio, which approaches cost neutrality in a short time frame, is very promising.
The B-C ratio of 0.87 is also quite conservative for many reasons. First, it includes only one measurable outcome of maltreatment prevention—service and personnel costs avoided through reductions in maltreatment. If this outcome alone were tracked beyond the study period, the B-C ratio would almost certainly exceed 1.0. Second, and most importantly, costs to other systems were not included in the calculation of savings. These long-term savings could be substantial if reductions in repeat maltreatment result in fewer special education placements, higher educational attainment, less medical care use, less mental health therapy, greater earnings, or less incarceration. For instance, some researchers estimate that costs to child welfare may only account for between 29% (Noor & Caldwell, 2005) and 53% (Watters et al., 2007) of the total annual costs of child abuse and neglect after taking into account impacts on other systems. If child welfare service and personnel costs comprise only 29% to 53% of the total cost of child abuse and neglect in Louisiana, the actual B-C ratio would be somewhere between double and 3½ times greater.
Finally, other nonmonetizable benefits such as increased parenting knowledge and skill, improved quality of parent and child interactions, and enhanced child development were not examined. These outcomes, while associated with child maltreatment, may result in other unmeasured benefits, some of which likely could be monetizable if resources were in place to track these relationships over time. A full economic analysis would include a complete accounting of program costs, and also an expansive range of benefits, not just in terms of costs averted but also intangible benefits—even those that are not easily monetizable (Foster, Dodge, & Jones, 2003). Economic cost modeling can be resource intensive, though, in terms of both cost and technical capacity.
One caution when interpreting the results of this study stems from a limitation of the evaluation on which this cost-savings analysis was built. In the original study design, which did not involve a comparison group, it could not be definitively concluded that the observed negative relationship between attendance and maltreatment was not due to some other unmeasured characteristics of caregivers. Because the population database included all families referred to the NPP, no comparisons could be drawn between maltreatment outcomes for participants in the NPP and otherwise similar parents who received no parenting education. While available factors that might be associated with attendance and repeat maltreatment were controlled for, it is possible that caregivers who attended more sessions may have been qualitatively different than caregivers who attended fewer sessions in ways that were not accounted for. The economic analyses in this study could have been considerably strengthened by the establishment of causation in the original evaluation study.
The cost-savings approach detailed here is a reflection of the growing demand for greater accountability in terms of quality and effectiveness of service delivery and fiscal responsibility. The conservative, albeit limited, approach outlined here demonstrates that an evidence-informed parenting education program with a high level of participation will lead to savings for child welfare and likely other systems in the short- and long-term. The B-C ratio approached cost neutrality in a short period of time from the limited perspective of the child welfare agency despite the fact that, as Plotnick and Deppman (1999, p. 394) note, this method of calculating benefits “makes it much harder for an intervention to pass a fair benefit-cost test because most or all of the costs come up front, although benefits may accrue well into the future.” In contrast to a societal level economic analysis, this type of cost-savings approach may, however, have more immediate utility for a child welfare department. Ideally, this type of cost analysis should be planned in advance so that the requisite data can be collected and limitations minimized.
Understanding the effectiveness and the associated costs and benefits of parenting education programs in child welfare is critical as they are a common component of services provided to families (Barth et al., 2005; Huebner, 2002; Waldfogel, 2009). If child welfare services can demonstrate that they reduce foster care caseloads, thus saving money, a strong case for investing in prevention programs is made.
Conclusions
In summary, given the service expenses associated with maltreatment, Louisiana’s child welfare department should be able to realize savings in a short time period from use of a statewide evidence-informed parenting education program. If the program could be targeted to those families most at risk for repeat maltreatment, more savings could be realized. This targeted approach would, however, require better measures of risk and would also prevent other families not at risk for reoccurrence of maltreatment from realizing program benefits. Strategies to encourage a high degree of participation and retention in the NPP are also warranted. Providing incentives or outreach to increase participation is apt to pay off.
Families likely experience other benefits from participation in effective parenting education. Unmeasured benefits could include improved parenting, enhanced child development, and thus, improved well-being for both children and families. These outcomes likely result in families and children utilizing fewer services from other public systems and increased productivity in terms of more employment, greater earnings, and, thus, additional tax revenue. However, economic incentives should be only one framework to justify service delivery. Beyond monetary benefits alone, the short- and long-term well-being of families is both a moral and ethical imperative for social service institutions.
Footnotes
Acknowledgment
The authors would like to acknowledge Mark Chaffin, Dave Danielson, Adam Darnell, John Fluke, Lyscha Marcynyszyn, Kirk O’Brien, Peter Pecora, and Dee Wilson for helpful feedback on this article. We are grateful to Alison Evans Cuellar for her professional consultation.
Declaration of Conflicting Interests
The authors declared no potential conflicts of interest with respect to the research, authorship, and/or publication of this article.
Funding
The authors received no financial support for the research, authorship, and/or publication of this article.