




Abstract
Objectives:
The existing literature on the impact of workplace conditions on client care suggests that good cultures and climates provide the best outcomes for clients. The primary purpose of this study was to investigate the relationship between organizational culture and climate and the proportion of children and youth successfully discharged from a large organization in New York state.
Method:
Thirty-three child and youth programs with existing culture and climate data evaluated outcome information from 1,336 clients exiting its services.
Results:
Programs reported as having bad culture and climate yielded superior client outcomes, measured as discharge to a lower level of care and successfully completing.
Conclusion:
This study and its conclusion point to a gap in knowledge concerning the relation between workplace culture and climate and the impact on client care and workers’ perceptions; this warrants further investigation in similar studies of agencies and their outcomes.
Introduction
A growing number of studies have investigated the relationships between workplace conditions and their impact on workers, types of services provided, and on the clients being served. For instance, studies indicate poor organizational culture and climate not only negatively affect workers and impede the implementation of new interventions but also adversely impact clients’ outcomes (Glisson, Dukes, & Green, 2006; Glisson & Green, 2006; Hemmelgarn, Glisson, & James, 2006; Patterson, in press; Patterson, Dulmus, & Maguin, 2012; Patterson, Maguin, Dulmus, & Nisbet, 2013). The literature related to organizational culture and climate over the past decade has provided a clear, consistent message that there are no constructive attributes of poor organizational cultures and climates, and that in order to provide best practices and ensure high-quality outcomes, poor culture and climate must be rehabilitated (Aarons & Sawitzky, 2006; Glisson, 2007; Glisson, Green, & Williams, 2012).
Although some variations occur in terms and understanding of what constitutes organizational culture and climate (Schneider, 1985; Verbeke, Volgering, & Hessels, 1998), there is some coherence regarding the characteristics that comprise these two concepts. According to Glisson and James (2002), organizational culture is embedded within and the sole property of the organization. Culture is defined as the organizational norms and how things are expected to be done within an organization (Glisson, 2007; Glisson & James, 2002; Schein, 2010; Zohar & Hofmann, 2012). Organizational climate, on the other hand, is the perceptions and exclusive property of the individual worker (Glisson & James, 2002; James & Sells, 1981; Schneider, Ehrhart, & Macey, 2011). Climate is a shared perception between individuals within an organization and how the working environment affects these individuals (Glisson, 2007).
If there is clear scientific evidence linking excellent organizational culture and climate to enhanced client outcomes, organizations would be moved to improve poor working conditions. Although researchers are investigating this line of reasoning, unfortunately, there are still some missing links in this chain of scientific evidence.
Measuring Organizational Culture and Climate
The Organizational Social Context Measurement Model (OSC), developed by Dr. Charles Glisson, is guided by a model of social context that comprises both organizational-level (e.g., structure and culture) and individual-level (e.g., work attitudes and behavior) constructs, including individual and shared perceptions (e.g., organizational climate), which are believed to mediate the impact of the organization on the individual worker. By utilizing the OSC measurement system, an organization’s culture and climate profiles can be established as good or bad (Glisson et al., 2008).
The OSC measurement tool contains 105 items that form 4 domains, 16 first-order factors, and 7 second-order factors, which have been confirmed in a national sample of 100 mental health service organizations with approximately 1,200 clinicians. The OSC is a measure of a program’s culture and climate as reported by its workers; thus, scores are computed for the program as a whole and not for its individual workers. The scores reported are t scores, the computation of which is based on Glisson et al.’s (2008) sample of agencies. The three factors that comprise an organization’s culture are proficiency (e.g., placing the health and well-being of clients first and workers will be proficient, working to meet the unique needs of individual clients, with the most recent available knowledge), rigidity (e.g., allowing workers a small amount of discretion and flexibility in their activities, with the majority of controls coming from strict bureaucratic rules and regulations), and resistance (e.g., workers showing little interests in changes or new ways of providing services. Workers in resistant cultures will suppress any openings to change). The factors for organizational climate are engagement (e.g., workers’ perceptions that they can accomplish worthwhile activities and stay personally involved in their work while remaining concerned about their clients), functionality (e.g., workers receive support from their coworkers and have a well-defined understanding of how they fit into the organizational work unit), and stress (e.g., workers are emotionally exhausted and overwhelmed as the result of their work; they feel that they are unable to accomplish the necessary tasks at hand; Glisson et al., 2008).
What Constitutes Good or Bad Culture and Climate?
Organizational profiles have been developed by Glisson et al (2008) using the psychometric properties of the OSC from a nationwide study of mental health clinics. Glisson et al.’s (2008) OSC tool labeled them as having “good” or “bad” culture and climate. These profiles developed as a result of a second-order confirmatory factor analysis of clinician responses, estimates of scale reliabilities, and indices of within-clinic agreement and between-clinic differences. A proficiency score of two or more standard deviations (SDs) above the organization’s rigidity and resistance scores is necessary to meet the “good” criteria for culture. The criteria for being a “bad” culture are determined by an agency’s proficiency score being two or more SDs below both its rigidity and its resistance scores (Glisson et al., 2008). A good climate is one that has high engagement and functionality along with low stress. Conversely, low engagement and functionality along with high stress constitutes a bad climate (Glisson et al., 2008). This profile allows for some level of understanding of the effects of organizational culture and climate on the individual worker, thereby opening the potential of the OSC measure predict factors such as service quality and outcomes.
Attempts at Linking Culture and Climate to Client Outcomes
In their 7-year follow-up study, Glisson and Green (2011) found that maltreated youth who were served in a welfare system with more engaged workers had significantly improved on Achenbach’s (1991) Child Behavior Checklist’s total problem T scores. In this study, the other factors making up organizational climate (e.g., functionality and stress) were not reported. Also, in an earlier study, Glisson and Hemmelgarn (1998) reported that certain factors making up good organizational climate improved psychosocial functioning of youth in child welfare services. This particular 1998 study was 10 years before the determination of specific factors and profiles making up organizational culture and climate.
Again, although there has been some movement toward understanding the relationship between organizational climate’s specific impact on client outcomes (Aarons & Sawitzky, 2006; Glisson, 2007), there is still a large knowledge gap related to the overall organizational working condition’s impact on client outcomes. To the best of our knowledge, no other research has investigated the relationship between the factors making up organizational culture and climate and their impact on client outcomes. The primary purpose of this study was to investigate the relationship between organizational culture and climate and the proportion of children and youth successfully discharged from 33 different programs in a large organization in New York state.
Method
Data Sources
This study combined data from two separate archival data sets. The first data set consisted of the organizational culture and climate data and program data collected in 2009 from 55 programs under the operation of the Hillside Family of Agencies (HFA), a large child and family human services agency headquartered in Rochester, NY (see Patterson, Dulmus, & Maguin, 2012; Patterson, Dulmus, Maguin, & Cristalli, 2013 for a complete description of the institutional review board (IRB) approval process and data collection procedures). The 55 programs provide both residential- and community-based services in child welfare, mental health, juvenile justice, education, youth development, and developmental disabilities. A senior HFA manager identified the programs in terms of their service function and supervisory structure. Consenting clinical services employees were asked to complete an assessment package that included Glisson et al.’s (2008) OSC measure. Of the 1,552 eligible employees in 55 programs surveyed, 1,273 (82%) participated. The raw OSC survey data were transmitted to Dr. Glisson for scoring, and a data file of program-level culture and climate scores were returned to the investigators. Since valid responses from at least five employees are required for OSC scoring, some small HFA clinical programs with similar service functions were aggregated while other small programs with a unique service function were excluded.
The second data set consisted of the available discharge status data for 2,043 clients discharged from 56 HFA programs between July 1, 2009, and December 31, 2010. This date set was de-identified secondary data not requiring further IRB approval. Of the 2,043 clients, 252 were discharged two or more times in that period. Multiple discharges might have occurred because the client was being seen in two different programs simultaneously or because the client was discharged from one service, referred to another, and then discharged from that service. In addition, if multiple youth in a family each received services, for example, youth as the unit of service, each youth would have her or his own discharge record, even though they were from the same family. If, however, the family received services as a unit, the family, irrespective of how many children were in the family, would have one discharge record. When a family as a whole receives services, the demographic information is recorded for the/a parent in the family. Thus, depending on the specific program, services may have been provided to the family unit or to a youth. Hereafter these different service constellations are referred to as “clients.” Of the clients served, 50.9% were female and 7.9% biracial, 25.4% African American, 6.2% Hispanic, 57.8% White, and 2.7% Asian, Native American, other, or unknown. Age ranged from birth/less than 1 year to 83, with 29% of clients aged 12 years or less, 38% aged 13–18 years, 7% aged 19–26 years, and 16% aged 27 years or older. The 19–26 age-group may have included both young adults receiving services and families whose child/children were receiving services.
When the two data sets were joined to form the analysis data set, it was found that 33 programs had both discharge data and culture and climate data. These programs had discharge records for 1,336 clients. The programs were primarily either community based (n = 13) or residential (n = 10). The 10 remaining programs consisted of 5 day treatment programs, 4 foster care programs, and 1 outpatient program. Of the 1,336 clients, 54.0% were female and 7.3% were biracial, 26.9% were African American, 6.2% were Hispanic, 57.0% were White, and 2.6% were Asian, Native American, other, or unknown. Clients ranged in age from birth/less than 1 year to 83 years, with 25.4% being aged 12 years or less, 43.4% aged 13–18 years, 9.1% aged 19–26 years, and 22.2% aged 27 years or older.
Measures
Two measures of treatment status at discharge were used. The first, lower care, recorded whether or not the client was discharged to a lower level of care. Clinical staff recorded the client’s next placement in terms of the level of clinical care judged to be required. Clients may be discharged to a lower (n = 632, 47.3%), the same (n = 193, 14.4%), or a higher level of care (n = 158, 11.8%), or recorded as having dropped treatment (n = 283, 21.2%) or unknown (n = 70, 5.2%). For these analyses, clients were categorized as yes if they were discharged to a lower level of care and no if they were discharged to the same or a higher level of care, had dropped treatment or were unknown, which is a more conservative (and pessimistic) view.
The second measure, treatment success, recorded whether the client’s treatment was judged to have been successful. Clinical staff recorded whether (a) the client had been successful (e.g., had increased skills, accomplished goals, required less intensive services, reduced risk behaviors, or finalized an adoption) in the treatment program (n = 417, 31.2%); (b) the client was discharged due to program limitations or system requirements (e.g., program was eliminated, time limits in the program were reached, transferred to adult services, aged out, or no longer eligible or lost funding; n = 198, 14.8%); (c) the client disengaged from treatment (e.g., Absent Without Official Leave [AWOL], client lost to contact or moved, client withdrew, failed to attend program; n = 413, 30.9%); (d) the program was judged not to be meeting the needs of the client (e.g., crisis discharge or more intensive services required; n = 131, 9.8%); or (e) for another reason(s)s (n = 177, 13.2%). Clients were categorized as yes if they were judged to have successfully completed treatment and no if they had not.
The association between these two measures was reasonably high with a Π coefficient of .54, which was significant at the .001 level. Interestingly, the cross tabulation was not symmetrical, as the odds of treatment success given a discharge to a lower level of care were 1.37, while the odds of a discharge to a lower level of care given treatment success were 7.02.
Several client demographics variables were available: female gender, ethnicity, and admission age in years. The ethnicity categories of biracial, Hispanic, Asian, Native American, other, and unknown defined the reference group (n = 215, 16.1%). Two ethnic contrasts were developed. One contrasted African Americans (n = 360, 26.9%) to the reference group and the second contrasted Whites (n = 761, 57.0%) to the reference group. Admission age was categorized as 12 years or less (n = 339, 25.4%), 13–18 years (n = 580, 43.4%), 19–26 years (n = 211, 9.1%), and 27 years or older (n = 296, 22.2%).
Organizational culture and climate were assessed by OSC measurement system. The OSC is guided by a model of social context that consists of both organizational-level (structure and culture) and individual-level (work attitudes and behavior) constructs, including individual and shared perceptions (climate), which are believed to mediate the impact of the organization on the individual. The OSC measurement tool contains 105 items that form 4 domains, 16 first-order factors, and 7 second-order factors confirmed in national samples in 99 social and mental health service organizations with approximately 1,200 individuals. The self-administered, Likert-type scale survey takes approximately 20 min to complete and is situated on a scannable bubble sheet. In OSC validation studies, principal components analysis confirmed the tool’s factor structure; coefficient α reliability showed acceptable levels of psychometric internal consistency. Completed surveys are scored at Children's Mental Health Services Research Center and the data returned consist of each program having its own single T score. The specific factors making up an organization’s culture and climate are discussed in detail earlier in the introduction section.
Results
The data have a multilevel structure, with clients being nested within programs. At the client level, several demographic covariates are available: female, ethnicity, and client age. The individual relationships of the demographic covariates to each of the dependent variables (lower care and treatment success) were first examined using Mplus version 7. Since both dependent variables were dichotomous, the intraclass correlation (ICC) was not computable. Significant covariates were retained for the primary analyses. In the primary analyses, each of the culture and climate scales was tested individually as a predictor of the dependent variable. Although we report standard significance tests, readers should bear in mind that the Level 2 units, the programs, were not a random selection of Hillside programs having both discharge data and culture and climate data, nor were they of a randomly selected program from a sample of agencies having these data.
Lower Care
Table 1 presents the descriptive statistics for the discharge status variables and the culture and climate scales. Across the 33 programs, the proportion of clients discharged to a lower level of care was 0.535 (SD = 0.245; range = 0.000–1.000). The distribution was slightly negatively skewed and flattened (−0.193 and −0.328, respectively). Preliminary analyses revealed that a discharge to a lower level of care was unrelated to any of the client demographic variables examined. Thus, the Level 1 model consisted of the maximum likelihood estimate of the logit of the odds of a discharge to a lower level of care. Table 2 reports the results of the regressions of lower care on each of the culture and climate variables.
Descriptive Statistics for Discharge Status Variables and Culture and Climate Scales.
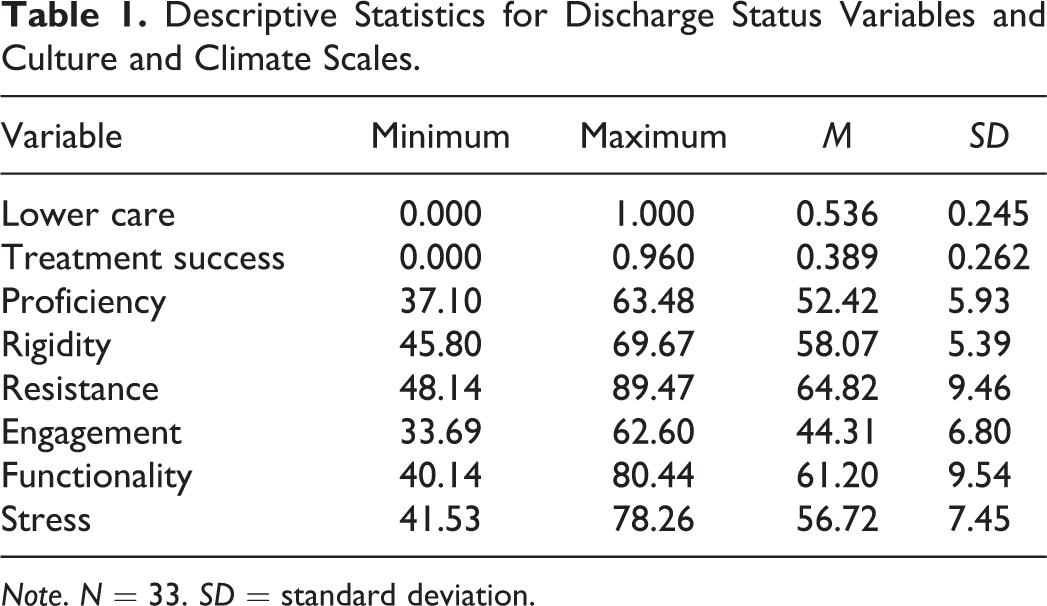
Note. N = 33. SD = standard deviation.
Regressions of Lower Care and Treatment Success on Culture and Climate Scales.

Note. N = 33. SE = standard error. Proficiency, rigidity, and resistance are dimensions of organization culture. Engagement, functionality, and stress are dimensions of organization climate.
As shown earlier, each of the six culture and climate variables were significantly related (p <.05) to lower care in the separate regressions. Programs with high scores on rigidity, resistance, or stress had a larger percentage of their clients discharged to a lower level of care. However, programs with high scores on proficiency, engagement, or functionality had a smaller percentage of their clients discharged to a lower level of care. Thus, the programs with less favorable cultures and climates had better outcomes as assessed by care level at discharge.
Treatment Success
The proportion of clients across the 33 programs discharged as successful was 0.389 (SD = 0.262; range = 0.000–0.960). The distribution was slightly positively skewed and flattened (0.524 and−0.509, respectively). Preliminary analyses revealed that a discharge coded as successful was related to both age category and ethnicity category. Although the coefficients varied slightly depending on the specific analysis, the results showed that compared to clients aged 12 or less, clients aged 13–18 were 0.59–0.62 times as likely to have a successful discharge, clients aged 19–26 were 0.29–0.30 times as likely, and clients aged 27 or greater were 0.32 to 0.35 times as likely. Compared to clients in the ethnicity reference group, African Americans were 0.58 times as likely to have a successful discharge, and Whites were 1.08 to 1.12 times as likely. The right hand panel of Table 2 reports the results of the regressions of treatment success on each of the culture and climate variables, and, as shown there, three of the six culture and climate variables were significantly related (p <.05) to treatment success. Programs with high scores on rigidity and resistance or with low scores on functionality had a larger percentage of their clients with successful discharges.
Discussion and Application to Practice
This study examined how dimensions of programs’ culture and climate were related to the proportions of the programs’ clients that had favorable discharges, which were indicated by being discharged to a lower level of care or by program clinicians coding the discharge as successful. The results were remarkably consistent in direction, although some of the specific relationships did not attain significance for one of the outcome variables. Programs that had poorer culture and climate scores had a larger proportion of favorable discharges. Poorer cultures and climates mean higher rigidity, resistance, and stress and lower proficiency, engagement, and functionality. Although these data are informative, it is important recognize some limitations. Because all data were from programs in a single agency, these results have an unknown generalizability, even to other agencies of the same type. Also, neither agencies nor programs were randomly sampled, resulting in the standard errors and the significant tests having uncertain validity. Thus, we believe that that the relationships obtained should be regarded as a data point against which to evaluate other similar studies.
Given the limitations, the results from this study are surprising and go against what has been discussed in the larger literature and introduction of this article. The only other studies published that provide any guidance on the relationship between organizational culture and climate and client outcomes are Glisson and Hemmelgarn (1998) and Glisson and Green (2011). While they found some improved outcomes related to some factors making up a good climate, these findings could not establish a relationship between good cultures and climates and improved outcomes. On the contrary, those programs with significantly worse cultures and climates had more children leave treatment needing lower levels of care. Furthermore, programs with significantly worse cultures and climates had more children successfully completing treatment.
One of the more appealing characteristics regarding the work behind organizational culture and climate is that it plays to the common sense notions of how clinical treatment should be provided and in what type of environment. No one—professional, parent, funder, and especially children—wants to be treated in a bad service environment. Faced with the choice between placing a child in a program with bad culture and climate or one with good working conditions, what would be a parent’s choice?
In an effort to try to make sense of these perplexing outcomes, we further investigated the national sample of organizations used to establish good and bad organizational profiles. In Glisson et al.’s (2008) national sample of 100, a subset of 200 programs across the nation was part of the National Survey of Child and Adolescent Well-being study. The design and sampling strategy used in that larger study are described in Burns et al. (2004). Of the 100 programs used in Glisson’s study, 10% met the criteria for having the best cultures and climates and 9% met the criteria for having the worst. This indicates that 90% of the programs nationally had cultures and climates that failed to meet the “good” criteria. There is high probability that children are being treated in a program with bad culture and climate.
Although more investigations in this matter are necessary, the limited outcomes of the present study can provide some solace. Bad cultures and climates had better outcomes. Also, there might be some encouragement for our social work profession and its workers. They are working in programs with a 90% chance of having bad working conditions, and yet, their clients are showing signs of improvements upon completion. Workers are busting through well-established barriers to implement empirically supported treatments (ESTs) that could provide some insights into what factors contribute to ideal EST adopters (Patterson, in press). It seems social workers, regardless of their overall working conditions, are responding to their profession’s call that practice is empirically based, responsive to client needs, and outcomes focused (Rosen, 2003).
As with any new area of investigation, this study’s outcome raises more questions than it answers. Although the literature has expressed some confidence that organizational culture and climate can be quantitatively captured, questions remain about the variability of culture and climate factors (Schneider, Ehrhart, & Macey, 2012; Zohar & Hofmann, 2012). It is also not known which factors (e.g., ESTs, service types, client conditions, etc.) might account for improved outcomes. Finally, until conditions are controlled by randomly assigning some services in organizations with good and bad cultures and climates, and evaluating ESTs and client outcomes, the links in this chain of scientific evidence between organizational working conditions and client outcomes will remain missing.
Footnotes
Declaration of Conflicting Interests
The authors declared no potential conflicts of interest with respect to the research, authorship, and/or publication of this article.
Funding
The authors disclosed receipt of the following financial support for the research, authorship, and/or publication of this article: This work was supported by NIH-NIAAA Grant#:7K23AA017684-01.