




Abstract
In 1970, the unemployment rate in the United States was 5%, while the unemployment rate in the European Union was 3% (Solow, 2000). Since the first oil crisis in 1973, the unemployment rates in Europe and the United States have diverged. While it remained relatively steady in the United States, there was an upward trend in Europe. By the end of the century, the unemployment rates in most European countries did not seem to go back to the low levels that were commonplace 30 years ago, when the average unemployment rate in the European Union was around 10%. By the end of the previous decade, however, the financial crisis turned things upside down. The U.S. unemployment rate was 10% in 2010, whereas the unemployment rates in major European countries such as Italy, the United Kingdom, and Germany was lower than that in the United States. The average unemployment rate in the European Union was, however, at the same level as in the United States. This steady contrast has posed the inevitable question: What explains the difference between the levels of unemployment in Europe and the United States? Many hypotheses have been put forward to explain this difference, but no single factor has been identified. In labor market research, the conventional understanding is that the difference rests on differences in labor market “institutions.” The variables considered are, among others, the unemployment benefit system, trade union power, taxes, employment protection, barriers to labor mobility, and wage inflexibility (Layard, Nickell, & Jackman, 2005; Nickell, Nunziata, & Ochel, 2005). Among these variables, the benefit system is shown to be one of the key factors (Layard et al., 2005; other key factors are the coordination level of the wage bargaining and employment adjustment costs). The main aspect of the benefit system that influences unemployment is the generosity of the system either in amount or in duration of benefits. In the United States, replacement rates (the replacement rate is the ratio of the unemployment benefit and previous earnings) are low and duration is short compared to most European countries. According to the Organization for Economic Cooperation and Development (OECD, 2007), the maximum duration (for a 40-year-old single worker without children and with a 22-year employment record) in 2005 was shortest in the United States at 6 months (the maximum duration was also around 6 months in the Czech Republic, the Slovak Republic, and the United Kingdom), and longest in Denmark, Norway, Portugal, the Netherlands, France, Finland, and Spain where it varied between 23 and 48 months. The gross initial replacement rate was around 50% in the United States, and in the before-mentioned European countries, it varied between 62% and 90%. The natural consequence is that higher levels of active searches and a greater willingness to accept inferior jobs by unemployed workers are seen in the United States than in Europe.
From a societal point of view, the optimal benefit system is determined as a trade-off between protection and distortion. Benefit programs protect individuals against loss of income and provide unemployed individuals the possibility of finding a better match between their qualifications and job vacancies. In fact, this positive aspect of inducing risk-averse workers to achieve better job matches has been shown to increase economic efficiency (Acemoglu & Shimer, 1999; Marimon & Zilibotti, 1999). However, the same benefit can also distort incentives through job searches that are long and unproductive. Therefore, unemployment benefits should aim for a balance between protection and distortion (Feldstein, 2005; Mortensen, 1987).
In order to reduce the high unemployment level, European policy makers may wish to reduce the generosity of the unemployment system. While it may be politically intractable to lower the replacement rate (indeed, examples of reductions of benefit rates and amounts are rare), the length of the unemployment benefit eligibility period is often used as a political instrument to create work incentives for the unemployed. For example, the benefit period was altered in Spain in 1992, in Slovenia in 1998, in Norway in 1997, in the United Kingdom in 1996, in Denmark in 1996, 1998, and 1999, and, more recently, in the Czech Republic in 2004, in Hungary and Portugal in 2006, and in Denmark in 2010 (however, the benefit period was extended by 6 months in March 2012, just prior to the expiration of benefits for those who were first unemployed under the reduced period).
This review focuses on the effect of exhaustion of unemployment benefits and looks at the unemployed workers’ exit rate into employment prior to exhaustion of unemployment benefits or shortly thereafter. The effect occurring prior to benefit exhaustion or shortly thereafter, which we denote the “incentive effect,” is relevant because several studies, empirical as well as theoretical, suggest that the prospect of exhaustion of benefits results in a significantly increased incentive for finding work (Caliendo, Tatsiramos, & Uhlendoff, 2009; Card, Chetty, & Weber, 2007; Feldstein, 2005; Katz & Meyer, 1990; Meyer, 1990; Mortensen, 1987). Hence, shortening the benefit eligibility period may reduce the share of long and unproductive job searches and thereby decrease the overall unemployment level.
Description of the Intervention
The intervention that is the topic of this systematic review is the exhaustion of any kind of unemployment benefit with a known expiration date. The review focuses on the incentive effect, that is, the exit rate out of unemployment into employment prior to exhaustion of unemployment benefits or shortly thereafter, which can be attributed solely to the prospect of benefits exhaustion.
The benefits may be unemployment insurance (UI) benefits, or they may be unemployment assistance (UA)/social assistance (SA) benefits as long as they have a known expiration date.
In the majority of OECD countries, the UI benefit has a time limit. In fact, only Belgium has an unlimited UI period. In other countries, the maximum duration varies between 6 months (as, e.g., in the United Kingdom and the United States) and 36 months (in Iceland).
In most OECD countries, a secondary benefit is available for those who have exhausted regular UI benefits. This is known as SA benefits. Unlike UI benefits, SA benefits are generally means tested without any necessary connection to past employment, pay a lower level of benefit, and are indefinite. We know of only one example of a SA benefit with a time limit: the Temporary Assistance to Needy Families available in the United States. The federal government requires states to impose between 2- and 5-year limits (Gustafson & Levine, 1997). In a minority of OECD countries, UA benefits are paid after exhaustion of UI benefits. Like SA benefits, they are generally means tested, pay a lower level of benefits, and, excepting Hungary, Portugal, and Sweden, they are generally indefinite.
How the Intervention Might Work
Search theory offers an explanation as to why we might expect to find an effect for this intervention. According to search theory, one can derive a relationship between the job-finding rate and the time to benefit exhaustion when the maximum benefit duration is fixed and predictable (Mortensen, 1977). This relationship is driven by adjustments in search effort and reservation wages. The reservation wage is the minimum wage at which the unemployed are willing to accept a job. The benefit exhaustion gives the unemployed individual a strong incentive to gain employment to avoid the drop in income after the exhaustion date. How strong the incentive is depends on the magnitude of the income drop. If no secondary benefit is available for those who have exhausted their current benefit, the incentive to gain employment will be stronger. As the unemployed worker approaches benefit expiration, the search intensity goes up and the reservation wage goes down, thus increasing the job-finding rate. If an increased job-finding rate is mainly driven by lowering the reservation wage, a lower job match quality is to be expected, for example, in the form of lower wages and/or lower reemployment duration.
A number of factors may have an impact on the magnitude of the expected increase in the job-finding rate when approaching benefit exhaustion. In general, the overall labor market conditions, that is, the vacancy rate (the number of unfilled jobs expressed as a proportion of the labor force) and, in particular, the unemployment rate, have an impact on the availability of and competition for jobs. If the vacancy rate is high, that is, the number of vacancies is high in relation to job seekers, we would expect a bigger effect than if the vacancy rate is low. We would further expect a lower effect if the unemployment rate is high, regardless of the vacancy rate. If the vacancy rate is low, competition for available jobs is likely to be high. If the vacancy rate is high coincident with a high unemployment rate, it suggests mismatch in the labor market, that is, the process by which vacant jobs and job seekers meet is not efficient (Filges & Larsen, 2000; Pissarides, 2000).
The maximum benefit duration is also expected to have an impact on the size of the exhaustion effect. The longer the initial benefit eligibility period, more sorting may be expected to occur and, hence, a smaller benefit exhaustion effect would be expected. Sorting refers to a dynamic selection mechanism based on a relationship between individual heterogeneity (i.e., heterogeneity in the individual characteristics of the unemployed) and the hazard of leaving unemployment. Heterogeneity is related to job performance; those perceived to be most productive and more desirable to employers are hired first (Jackman & Layard, 1991; Salant, 1977). Several studies find sorting effects. For example, Lancaster (1979), Narendranathan and Stewart (1993), and, more recently, the analysis in Kalwij (2010), identify significant sorting effects. They show that both observed (to the researcher) heterogeneity (e.g., age and education) and unobserved (to the researcher) heterogeneity (e.g., motivation and “drive”) are important determinants of the unemployment hazard.
The extent to which those left unemployed by the end of the benefit eligibility period are considered unproductive and not desirable to employers has an effect on their unemployment hazard and, therefore, an impact on the exhaustion effect (i.e., it may be impossible to find an employer willing to hire the unemployed regardless of the search intensity or reservation wage).
Whether compulsory participation in active labor market programs is part of the unemployment system may result in additional sorting. The compulsory aspect may provide an incentive for unemployed individuals to look for and return to work prior to program participation (Geerdsen, Bjørn, Filges, & Jensen, 2011). Further, participation in active labor market programs may improve some of the participants’ qualifications, thus helping them to find a job. Hence, those left unemployed by the end of the benefit eligibility period may be considered even more unproductive if participation in active labor market programs did not improve their qualifications or lead to a job. Alternatively, active labor market programs may have negative stigmatization and signaling effects to employers. Programs associated with participants having poor employment prospect may carry a stigma. Because of asymmetric information, employers do not know the productivity of new workers, some of whom they might hire from the pool of the unemployed. Prospective employers might then perceive participants in such programs as low productivity workers or workers with tenuous labor market attachment (Kluve, Lehmann, & Schmidt, 1999; Kluve et al., 2007).
Finally, the type of unemployment benefit may have an impact on the job-finding rate close to exhaustion. As mentioned previously, some countries employ two systems to provide benefits to unemployed individuals: a UI system for individuals who typically have a strong labor market attachment (UI benefits) and a social welfare system for individuals who often have other problems in addition to unemployment (SA or UA benefits). The effect size in social welfare systems offering unemployment benefits with a known expiration date is expected to be less than the effect size in UI systems with a known expiration date.
Why Is It Important to Do This Review
There are many empirical articles on the effect of benefit exhaustion on unemployed individuals (Caliendo et al., 2009; Card et al., 2007; Katz & Meyer, 1990; Lalive, van Ours, & Zweimüller, 2006; Meyer, 1990), but the empirical research has not been summarized in a systematic review to obtain a clearer picture of the available evidence on the employment effect of benefit exhaustion. One article provides a review of the recent literature on how incentives in UI can be improved (Fredriksson & Holmlund, 2006). However, it is not a systematic review, and, furthermore, the authors do not make the important distinction between exits to employment and exits to other destinations such as secondary unemployment benefits. Distinguishing between destinations is vital. As shown in Card, Chetty, and Weber (2007), the exit rate from registered unemployment increases over 10 times more than the rate of reemployment at the expiration of benefits. The difference between the two measures arises because many individuals leave the unemployment register immediately after their benefits expire without returning to work.
There is a great deal of political interest in optimizing the unemployment benefit system, so it balances the protection and distortion dimensions. The political interest is to reduce the unemployment level, to prevent exploitation of the unemployment benefit system, and at the same time protect the unemployed individuals with real difficulties in finding a job. It is therefore of great importance to examine what effect unemployment benefit exhaustion has on employment probabilities.
Objectives
The primary objective of this systematic review is to study the impact of exhaustion of unemployment benefits on the job-finding rates of unemployed individuals. The primary outcome is unemployed individuals’ exit rate out of unemployment and into employment prior to benefit exhaustion or shortly thereafter. Due to the fact that a higher exit rate from reemployment jobs may indicate that benefit expiration forces unemployed individuals into less optimal jobs, the review will also examine the exit rate from the reemployment job as a secondary outcome.
Method
Criteria for Considering Studies for This Review
Types of studies
The study designs eligible for inclusion in this review were controlled trials (see Filges, Geerdsen, Knudsen, Jørgensen, & Kowalski, 2013 for a definition) and nonrandomized studies (NRS) where the allocation is not controlled by the researcher, and there is a comparison of two or more groups of participants. Participants are allocated by means such as time differences, location differences, decision makers, policy rules, or participant preferences.
No controlled trials were identified. We have only included study designs that used a well-defined control group, that is, unemployed persons whose benefit expiration was not immediate. Studies that utilized qualitative approaches were not included in the review due to the absence of adequate control group conditions.
Types of participants
The participants were required to be unemployed individuals who received some sort of time-limited benefit during their unemployment spell. We included participants receiving all types of unemployment benefits with a known exhaustion date. The only restriction was that the benefits needed to be related to being unemployed. Therefore, studies examining individuals receiving other types of benefits not related to being unemployed were not eligible. We did not restrict our attention to certain types of participants, since the main focus of this review was on the incentive effect to find a job when benefits expire. Therefore, we included all unemployed participants regardless of age, gender, and so on, who received some sort of time-limited benefit during their unemployment spell.
Types of interventions
The intervention of interest is the exhaustion of any kind of unemployment benefit with a known expiration date. The review focuses on the incentive effect, that is, the exit rate out of unemployment into employment prior to exhaustion of unemployment benefits or shortly thereafter (1 month after). The benefits were allowed to be UI benefits or UA/SA. The only requirement was that the benefit must have had a known expiration date. The UI benefit usually has a known time limit, whereas UA and SA usually are indefinite. Unemployment benefits with an indefinite time limit or nonfinancial benefits were not included in this review.
Types of comparison conditions
Studies of the effect of benefit exhaustion typically use data that describe individuals over time, making it possible to see when people move between the different states on the labor market, for example, from unemployment to employment. This type of data facilitates the use of hazard ratios (HRs). According to Duerden (2009), “Hazard ratios are increasingly used to express effects in studies comparing treatments when statistics which describe time-to-event or survival analyses are used” (p. 2), to express the effect of benefit exhaustion. The HR measures the proportional change in hazard rates between unemployed persons approaching exhaustion (i.e., unemployed persons whose benefit expiration is immediate) and unemployed persons not approaching exhaustion (i.e., unemployed persons whose benefit expiration is not immediate).
A hazard is the rate at which an event happens (in the present context, finding a job) in a short time interval conditional on survival (staying unemployed) until that time or later (see “Measures of Treatment Effect” subsection for a more thorough description of hazard rates).
The central problem in studies of benefit exhaustion is the identification of the incentive effect. Often the variable describing time to benefit exhaustion is a function of variables, which all have a direct effect on an individual’s duration of unemployment. But identification of the incentive effect requires that at least one of the variables be omitted from the modeling of the hazard rate (the exclusion restriction, alternatively identification can be achieved by assuming that the duration dependence follows a specific functional form. For more information, see Geerdsen (2002). Examples of exclusion restrictions used in the primary studies are differences in benefits entitlement between individuals due to age or work experience (Card et al., 2007; Jenkins & Garcia-Serrano, 2004; Portugal & Addison, 2008). If, for example (as in Portugal in 1992–1997), an unemployed person of age 24 is entitled to 10 months of benefits, and an unemployed person of age 39 is entitled to 18 months of benefits, and both survive (stay unemployed) 9 months of unemployment, the 24-year-old unemployed person’s benefit expiration is immediate. In order to use the variation in entitlement to disentangle the incentive effect from other time-varying effects, one has to assume that the entitlement does not, on its own, have an effect on individuals’ hazard rate.
Sources of individual variation in entitlement (age and work experience) are often, however, correlated with personal characteristics, which may themselves have an impact on the exit rate. For example, in Portugal, older individuals are entitled to longer benefit durations. Therefore, if individuals entitled to longer benefit durations find jobs at a slower rate, it can be attributed not only to the entitlement of longer benefit duration but also to their age. To disentangle these two effects, variation in entitlement across individuals uncorrelated with work experience or age is needed. Legislative changes of the maximum entitlement provide such variation. Identification driven by legislative changes of the maximum entitlement period is used, for example, in van Ours and Vopodevic (2004), Vodopivec (1995), and Schmitz and Steiner (2007). Legislative changes make it possible to compare individual’s labor market behavior just before and after the change was implemented.
The incentive effect in the primary studies is given by the ratio of hazard rates prior to, or within 1 month of, benefit exhaustion for unemployed persons who approach exhaustion to the ratio for unemployed persons who do not approach exhaustion. All included studies examine the exhaustion effect of UI benefits, that is, the treated persons are unemployed receivers of UI benefits whose benefit expiration is immediate. The majority of included studies use unemployed receivers of UI benefits whose expiration is not immediate as the comparison, using individual variation in benefit entitlement (due to age or work experience) and/or legislative changes as mentioned. One included study (Addison & Portugal, 2004) used unemployed nonreceivers of UI benefits (whose expiration is not immediate, as they do not receive UI benefits) as the comparison condition. Some studies estimate the incentive effect using indicator variables for the number of months or weeks until exhaustion (Portugal & Addison, 2008; Schmitz & Steiner, 2007; van Ours & Vopodevic, 2004), whereas others uses a spline function describing the same time period (Card et al., 2007; Jenkins & Garcia-Serrano, 2004; Vodopivec, 1995).
Types of outcomes
The objective of the review is to determine whether the prospect of unemployment benefit exhaustion motivates unemployed individuals to find a job. Distinguishing between destinations is therefore vital. The primary outcome is exit to employment. Studies only looking at exits to other destinations, such as other types of social benefits or nonemployment, were not included in this review. Studies that do not distinguish between destinations were excluded from this review.
In addition to the primary outcome measure, we planned to include the following secondary outcomes: duration of reemployment and reemployment wage. None of the included studies provided data that enabled the calculation of effect sizes for the reemployment wage. A few studies, however, provided data on the exit rate from the reemployment job, though none measured it directly as mean duration. We included the measure of exit rate from the reemployment job in the analysis of secondary outcomes. A higher exit rate from the reemployment job may indicate that the exhaustion of benefits forces unemployed individuals to find jobs that do not match their qualifications and, therefore, return to unemployment quickly.
Search Methods for Identification of Studies
The search was performed by one review author (A.K.J.) and one member of the review team (P.V.H.; members of the review team at SFI Campbell are the research assistants Pia Vang Hansen, Simon Helth Filges, and Stine Lian Olsen). For details of search methods, see Filges, Geerdsen, Knudsen, Jørgensen, and Kowalski (2013).
Data Collection and Analysis
Selection of studies
One review author (A.D.K.) and two members of the review team (S.H.F. and S.L.O.) independently read titles and available abstracts of reports and articles identified in the search to exclude reports that were clearly irrelevant. Citations considered relevant by at least one reviewer were retrieved in full-text versions. If there was not enough information in the title and abstract to judge relevance, the full text was retrieved.
Two reviewers (A.D.K. and T.F.) and one member of the review team (S.H.F.) read the full-text versions to ascertain eligibility based on the selection criteria. Any disagreements were resolved by discussion. A screening guide (see Filges et al., 2013) was used to determine inclusion or exclusion.
Coding and numeric data extraction
One review author (A.D.K.) and one member of the review team (S.H.F.) independently coded the included studies (see Filges et al., 2013). Disagreements were resolved by consulting a third review author (T.F.). Information was extracted on characteristics of participants, intervention characteristics and control conditions, research design, sample size, and censoring. Numeric data extraction (outcome data) was performed by one review author (T.F.) and was checked by a second review author (A.D.K.). Extracted data were stored electronically. Analysis was conducted in RevMan5.
Assessment of risk of bias in included studies
Two review authors (T.F. and A.D.K.) independently assessed the risk of bias for each included study. There were only minor disagreements, and they were resolved by discussion. We assessed the methodological quality of studies using a risk of bias model developed by Prof. Barnaby Reeves in association with the Cochrane Non-Randomised Studies Methods Group (this risk of bias model was introduced by Prof. Reeves at a workshop on risk of bias in NRS at SFI Campbell, February 2011. The model is a further development of work carried out in the Cochrane). This model, an extension of the Cochrane Collaboration’s risk of bias tool, covers risk of bias for randomized controlled trials (RCTs) as well as risk of bias for NRS that have well-defined control groups.
The point of departure for the risk of bias model is the Cochrane Handbook for Systematic Reviews of Interventions (Higgins & Green, 2008). The existing Cochrane risk of bias tool needs elaboration when assessing NRS because particular attention must be given in these studies to selection bias/risk of confounding. It is also important to try to discriminate between NRS with varying risk of bias, so the model requires assessment on a 5-point scale for some items.
Risk of bias judgment items
The risk of bias model is based on 9 items (see Filges et al., 2013). Some items are judged by high/low/uncertain and some by a 5-point scale. Using the 5-point scale, 1 corresponds to low risk of bias and 5 corresponds to high risk of bias. Five corresponds to a risk of bias so high that the findings will not be considered in the data synthesis (because they are more likely to mislead than inform).
The 9 items concern sequence generation (relevant for selection bias), allocation concealment (relevant for selection bias), confounders (relevant for selection bias; only for NRS), blinding (relevant for performance, detection, and attrition bias), incomplete outcome data (relevant for attrition bias), selective outcome reporting (relevant for reporting bias), other potential threats to validity (relevant for performance, detection, and other sources of bias), and a priori protocol and a priori analysis plan (relevant for reporting bias).
Measures of treatment effect
Our main interest was to include studies in a meta-analysis where HRs and variances were either reported or were calculable from the available data. All the effect sizes used in the data synthesis were measured as log HRs. We performed the meta-analyses on the individual-included studies using the log HR and variance. We report the 95% confidence intervals (CIs). The secondary outcome, exit rate from the reemployment job, was also measured as HRs and the effect sizes were measured as log HRs. We report the 95% CIs.
The HR measures the proportional change in hazard rates between unemployed persons approaching exhaustion and unemployed persons not approaching exhaustion. The hazard rate is defined as the event rate (in the present context, the event is finding a job) at time t conditional on survival (staying unemployed) until time t or later (Filges et al., 2013).
Unit of analysis issues
To account for possible statistical dependencies, we examined a number of issues: whether individuals were randomized in groups (i.e., cluster randomized trials), whether individuals had undergone multiple interventions, whether there were multiple treatment groups, and whether several studies were based on the same data source. Multiple intervention groups: There were no studies with multiple intervention or control groups (with different individuals). Multiple interventions per individual: There were no studies with multiple interventions per individual. Multiple studies using the same sample of data: Several studies used the same or overlapping sample of data, that is, the studies used administrative register data from the same country covering the same time period or overlapping time periods. For example, in the case of Slovenia, the administrative registers provide complete coverage (complete coverage of administrative registers applies to other countries as well); that is, all registered unemployed in the selected period are included in the administrative registers. We identified two primary studies analyzing a 6% random sample from these administrative registers in Slovenia covering the years 1997–1999 and one primary study analyzing a random sample covering the years 1997–2001. The data used in these primary studies were thus representative of the same population of unemployed at the same time (or there was overlap), and the effect estimates from these studies were not independent. We reviewed all such studies, but in the meta-analysis we only included one estimate of the benefit exhaustion effect from each sample of data. The choice of which estimate to include was based on our quality assessment of the studies. We chose the estimate from the study that we judged to have the lowest risk of bias, and the judgment paid particular attention to the confounding item. In case of equal scoring on the confounding item, we based the choice on the incomplete data item. Multiple time points: It was possible to group the time points as follows: the week or month of exhaustion (some studies report the time of exhaustion on a weekly basis, and some studies report the time of exhaustion on a monthly basis), 1 month before exhaustion, 2 months before exhaustion, 2–4 months before exhaustion, and 1 month after exhaustion. If a study provided multiple estimates within a time period, we calculated and used a synthetic (average) effect size to avoid dependence problems. This method provides an unbiased estimate of the mean effect size parameter but overestimates the standard error (Hedges, 2007). Each time point was analyzed in a separate meta-analysis. Cluster randomization: No studies using cluster randomization were found. Other sources of dependency: Where studies reported separate effect estimates, for example, separated by gender, a synthetic (average) effect size was calculated and used to avoid dependence problems. This method provides an unbiased estimate of the mean effect size parameter but overestimates the standard error. Also, tests of heterogeneity when synthetic effect sizes are included are rejected less often than nominal (Hedges, 2007).
Dealing with missing data and incomplete data
Missing data and censoring were assessed in the included studies. For studies using questionnaire data, a sensitivity analysis was performed to assess potential bias. For studies in which the censoring level was high (more than 25%) or the level was not reported, a sensitivity analysis was performed to assess potential bias in the analysis. The extent to which the results might be biased by a high censoring level was included in the sensitivity analysis.
Assessment of heterogeneity
Statistically significant heterogeneity among primary studies was assessed with a chi-square (Q) test and I-square (Higgins, Thompson, Deeks, & Altman, 2003) test. A significant Q (p < .05) and I-square of at least 50% were considered to indicate statistical heterogeneity.
Assessment of publication bias
We used funnel plots to identify possible publication bias.
Data Synthesis
Studies that were coded with a very high risk of bias (i.e., 5 on the risk of bias scale) were not included in the data synthesis.
In the majority of studies, results were measured at multiple time points. The outcome at each time point was analyzed in a separate meta-analysis with other comparable studies taking measures at a similar time point. As outlined in Unit of Analysis Issues subsection, it was possible to group outcomes as follows: 2–4 months before exhaustion, 2 months before exhaustion, 1 month before exhaustion, the month or week of exhaustion, and 1 month after exhaustion.
We carried out our meta-analyses using the point estimate of the HR. All analyses were inverse variance weighted using random effects statistical models that incorporate both the sampling variance and between-study variance components into the study-level weights. Random effects weighted mean effect sizes were calculated using 95% CIs.
Subgroup and moderator analysis and investigation of heterogeneity
We performed single-factor subgroup analysis. The assessment of any difference between subgroups was based on 95% CIs. No conclusions from subgroup analyses were drawn, and interpretation of relationships was cautious, as they were based on subdivision of studies and indirect comparisons.
Sensitivity analysis
Sensitivity analysis was used to evaluate whether the pooled effect sizes were robust across components of methodological quality. For methodological quality, we performed sensitivity analysis for the confounding, incomplete data, and selective reporting items of the risk of bias checklists, respectively. Sensitivity analysis was further used to examine the robustness of conclusions in relation to the quality of data (outcome measures based on weekly or monthly data and whether data were based on questionnaires or administrative registers).
Results
Results of the Search
We ran the searches between the end of 2010 and during the first months of 2011. Two additional databases, Dissertations and Thesis and Social Care Online, were added and searched in June 2011.
The total number of potential relevant studies from “white literature,” “gray literature,” and the hand search constituted 23,991 hits (white: 22,328; gray: 1,476; hand search: 178). Hand searching was done in two journals (The Journal of Labor Economics and Labour Economics). In total, 454 hits (including results from the hand search) were retrieved for full text screening. Of these 454 hits, 384 did not fulfill the screening requirements. No articles from hand searching or the gray literature were included.
A total of 47 studies, consisting of 65 articles, met the inclusion criteria and were vetted by the review authors. Figure 1 illustrates the flowchart for the literature search and screening. Furthermore, Figure 1 shows the division of studies used in the data synthesis and studies that could not be included in the data synthesis.

Flow chart for the literature search.
Description of the Studies
Studies included in the systematic review
The search resulted in a final selection of 47 studies that met the inclusion criteria for this review. Of the 47 studies that met the inclusion criteria, 26 did not provide data that permitted the calculation of an effect size. Of the remaining 21 studies, 4 studies were coded with a very high risk of bias (5 on the risk of bias scale) and were therefore not used in the data synthesis. An additional five studies could not be used in the data synthesis due to overlapping data samples (i.e., the studies used administrative register data from the same country covering the same time period or overlapping time periods; see Unit of Analysis Issues subsection for this methodological issue). These studies analyzed benefit exhaustion in Spain, Slovenia, Germany, and the United States. After these exclusions, 12 studies remained and were included in the data synthesis.
In Table 1, we show the total number of studies that met the inclusion criteria for this review. The first column shows the total number of studies grouped by country of origin. The second column shows the number of these studies that provided enough data to calculate an effect estimate, in total 21 studies. The third column gives the number of studies that were coded with very high risk of bias. The fourth column gives the number of studies that were excluded from the data synthesis due to overlapping samples. The last column gives the total number of studies used in the data synthesis, in total 12.
Number of Included Studies.

Note. The reduction due to too high risk of bias preceded the reduction due to overlap of data sample.
aThe data samples used are representative for the same population at a given time (see Unit of Analysis Issues subsection for this methodological issue).
The choice of which study to use in the data synthesis among the studies with overlapping data samples was based on our quality assessment of the studies. The citations for the 21 studies that provided effect size estimates can be found in References section. In cases of overlap, the study that we judged to have the least risk of bias was chosen (the judgment paid particular attention to the confounding judgment, and in case of equal scoring, the choice was based on the incomplete data scoring). In the case of Germany and the United States, there were differences in our judgments of confounding, so the studies with the least risk of bias were chosen. In the case of Spain, the two studies were judged to have the same risk of bias due to confounding, so the study we judged to have the least risk of bias due to incomplete outcome data was chosen. In the case of Slovenia, the three studies were judged to have the same risk of bias in both confounding and incomplete outcome data. Two of the studies provided only an estimate of the exhaustion effect in the month of exhaustion, so we chose the one study that provided an estimate of the exhaustion effect in the month of exhaustion as well as 1 month prior to exhaustion and 1 month after exhaustion. In total, we were left with effect estimates for 12 unique populations. These are listed in the Appendix.
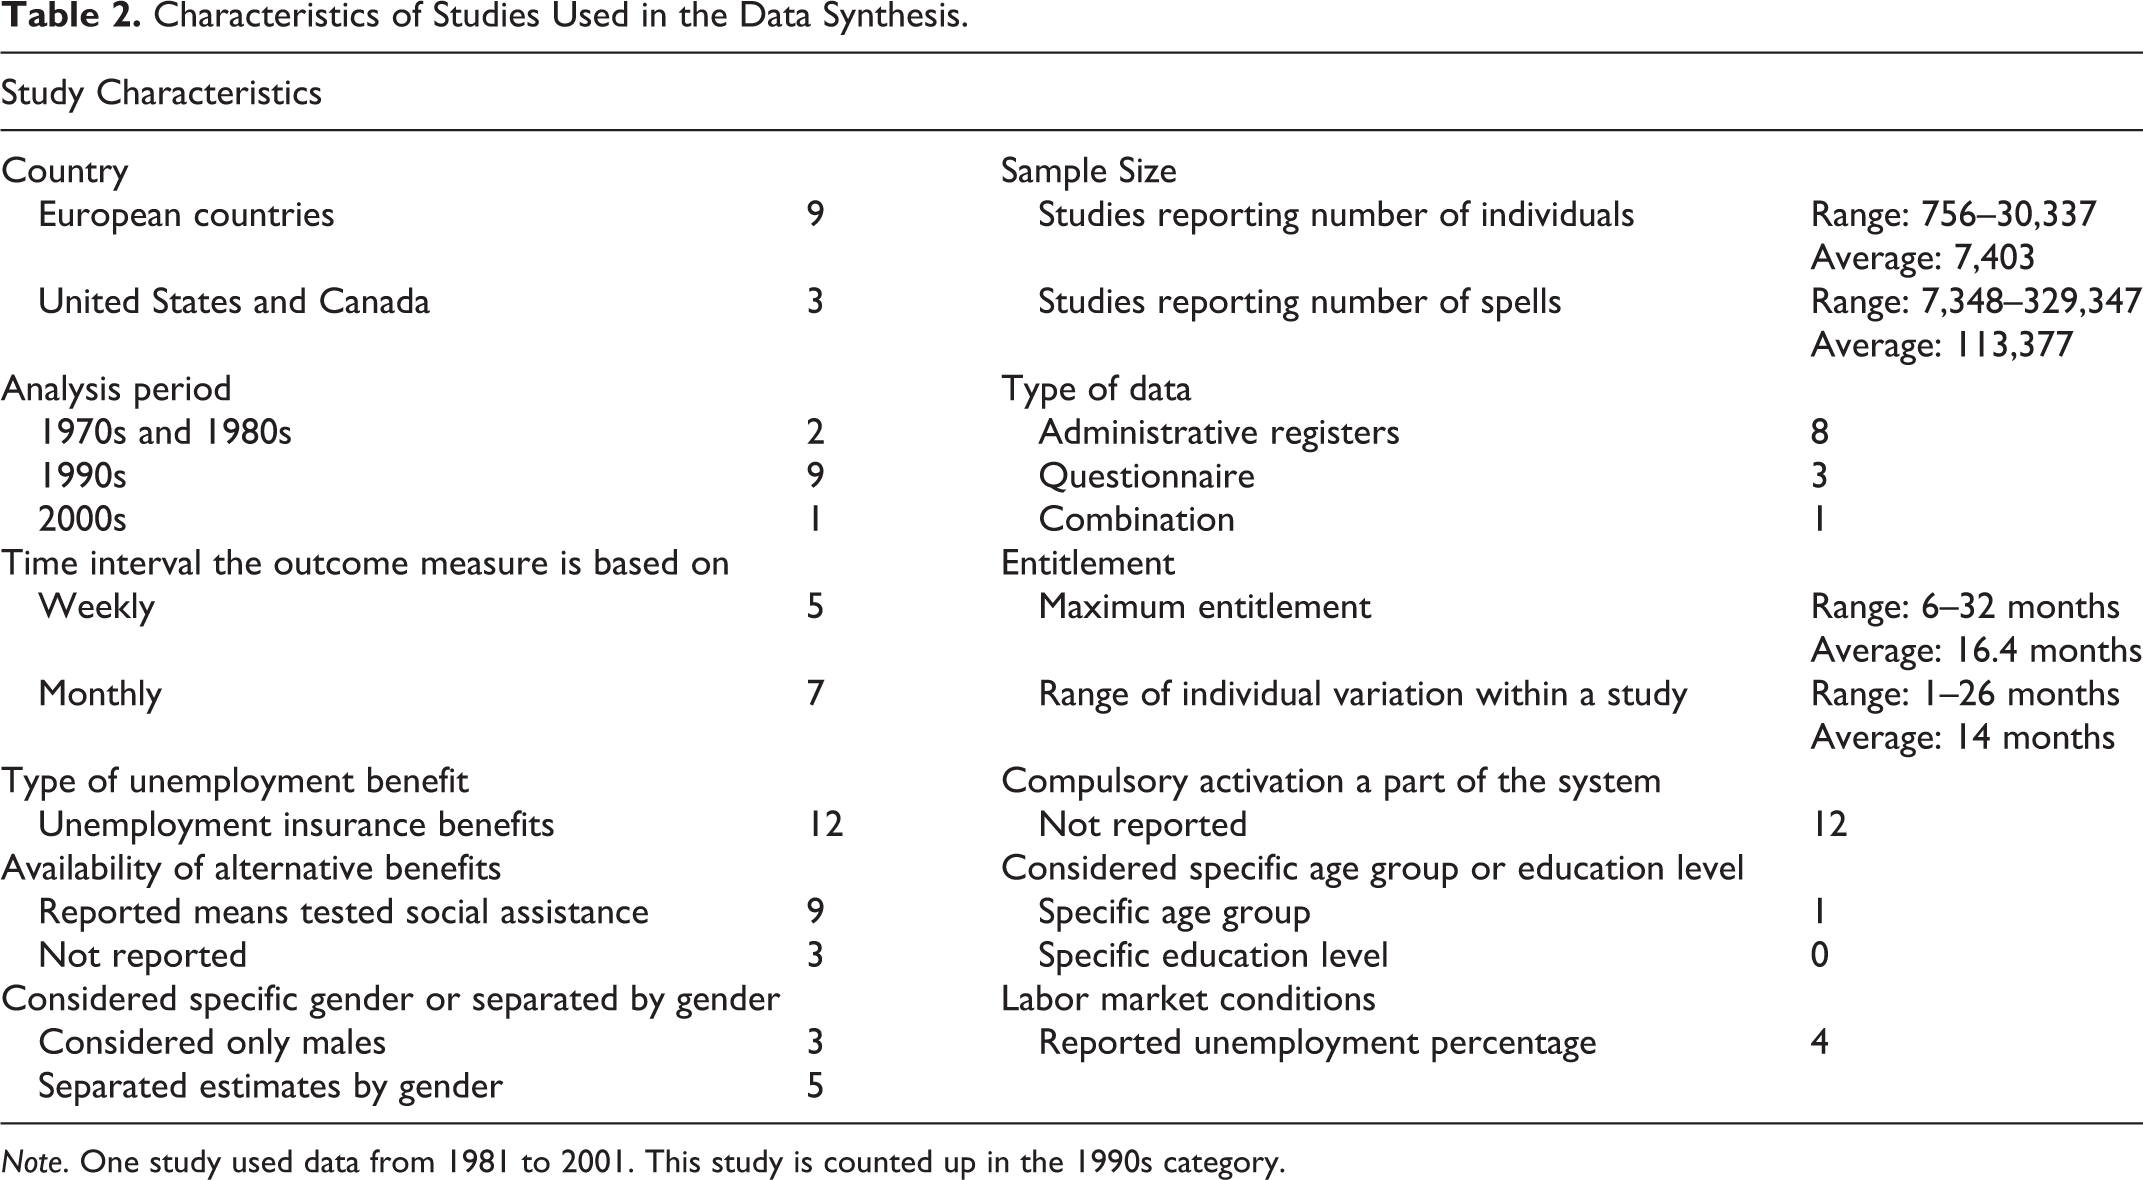
The characteristics of the 12 studies that were used in the data synthesis are shown in Table 2. A description of the individual studies is provided in Filges et al. (2013).
Characteristics of Studies Used in the Data Synthesis.
Note. One study used data from 1981 to 2001. This study is counted up in the 1990s category.
The studies were mainly from European countries. Two studies were from the United States and one study was from Canada. Nine studies analyzed data from the 1990s. One of these nine studies used data from 1981 to 2001. Two studies used data from the 1970s and 1980s, and one study analyzed the period 2000–2007. The outcome measures were based on weekly data in five studies, and the remaining seven were based on monthly data. Data were drawn mainly from administrative registers. Some primary studies report sample size by number of unemployment spells rather than number of individuals. The number of unemployment spells will be different from the number of individuals only if data providing multiple spells are used. Two studies used in the meta-analyses used multiple unemployment spells to control for unobserved heterogeneity. The sample sizes were generally large; all but two studies had sample sizes of more than 2,500 unemployment spells.
All studies analyzed the exhaustion of UI benefits. None of the studies reported whether compulsory labor market activation was part of the unemployment system. Most studies did not report on the availability of alternative benefits; those that did only reported that means tested UA was available. Only one study restricted the analysis to a specific age group (18–25), and none restricted the analysis to a specific educational level. Three studies included only males in their analysis, and five studies provided separate effect estimates by gender.
The majority of studies did not report the labor market conditions—only four studies reported the unemployment level. All studies reported the maximum entitlement but in almost all studies there was a high degree of variation in individual entitlement, as individual entitlement in most countries depends on work experience and/or age. All but one study used this individual variation in entitlement as part of the identification strategy.
The relevant variation in the individual entitlement for the countries and time periods of the studies included in the data synthesis are shown in Table 3, and a more comprehensive description of the existing rules applicable in the respective countries and time periods is given in Filges et al. (2013). The individual entitlement investigated within a country varies considerably. In the case of Slovenia, it also varies considerably between time periods.
Range of Individual Entitlement in the Countries and Time Periods of the Studies Used in the Data Synthesis.
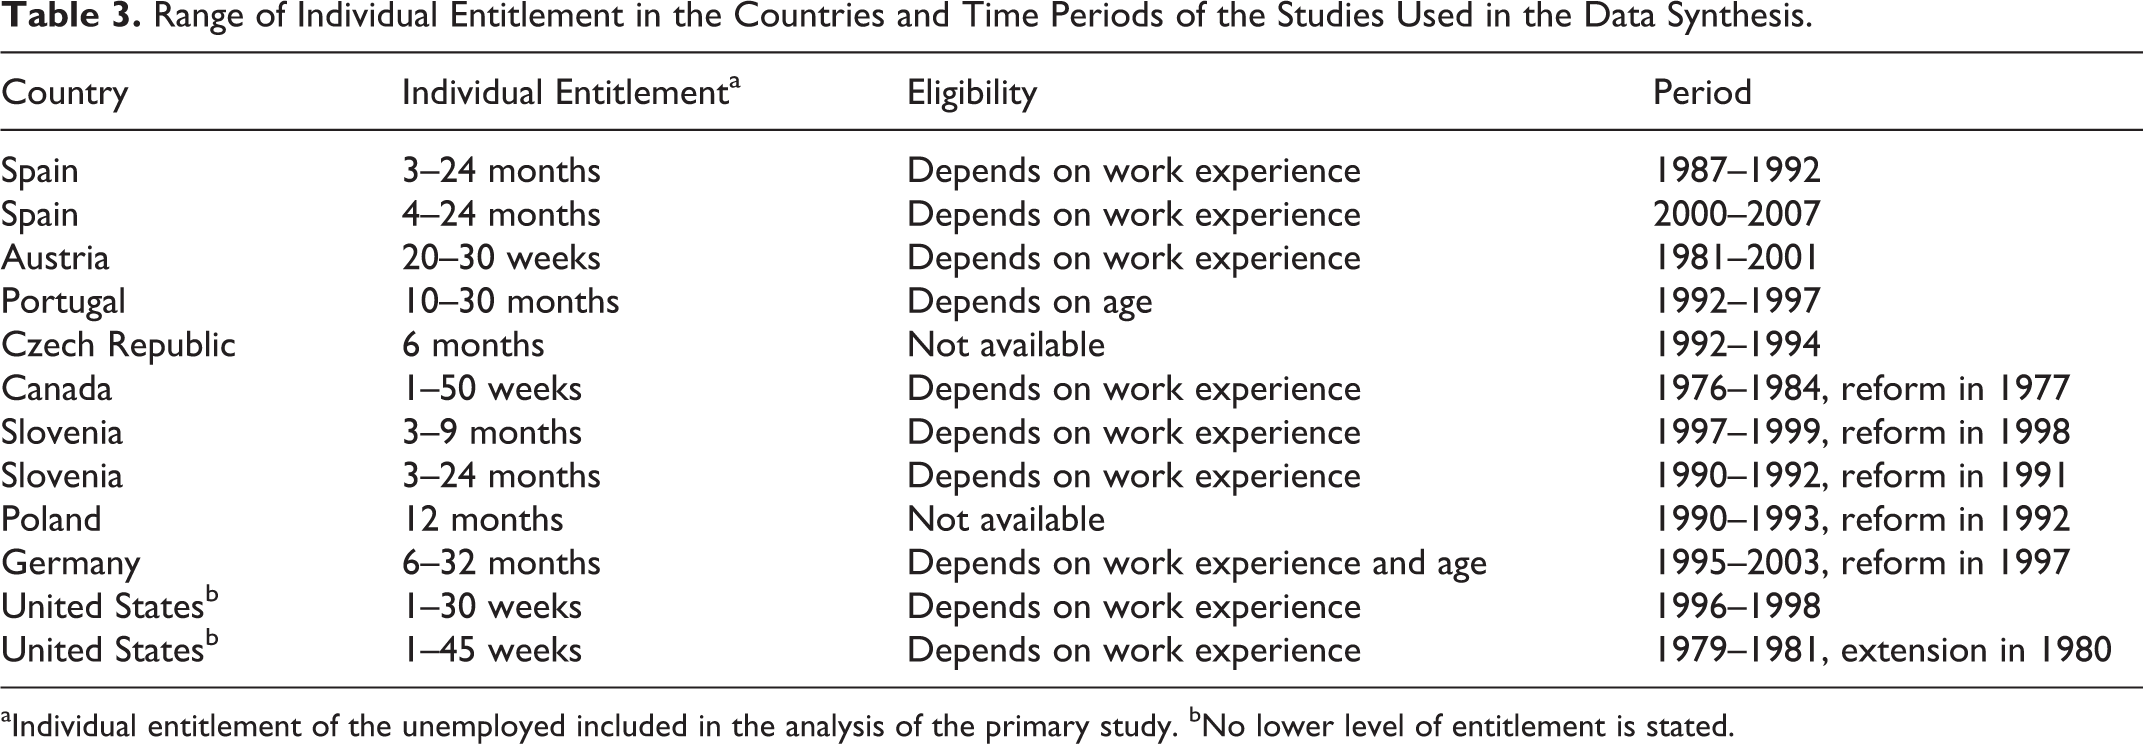
aIndividual entitlement of the unemployed included in the analysis of the primary study. bNo lower level of entitlement is stated.
Risk of Bias in Included Studies
The risk of bias coding for each of the 21 studies from which we could extract an effect estimate is shown in Filges et al. (2013). Because all included studies used nonrandomized designs, they were all judged to have a high risk of bias on the sequence generation item and the allocation concealment item. We did not judge the studies on the blinding item. This review focuses on the incentive effect of benefit exhaustion, that is, the exit rate out of unemployment into employment prior to exhaustion of unemployment benefits. The treated group has to know they are treated in order to react to it; therefore, it is not relevant to consider blinding of the participants. Furthermore, the nature of the outcome, exit into employment, is objective and obtained from administrative registers or questionnaires, which were not collected with the aim of analyzing unemployment benefit exhaustion.
The central problem associated with risk of bias in the primary studies included in this review is identification of the incentive effect; this judgment is reflected in the score on the confounding item of our risk of bias instrument. Using sources of individual variation in entitlement such as age and work experience carries the risk of being correlated with personal characteristics, which may have an impact on the exit rate. Variation in entitlement across individuals uncorrelated with work experience or age may be achieved through legislative changes of the maximum entitlement. Studies using legislative changes are generally better off with respect to risk of bias in terms of confounding.
Ten studies used both legislative changes and individual variation in entitlement as their source of identification, six studies used only individual variation in entitlement, one study used unemployed nonreceivers of UI benefits as comparison, and four studies were given a score of 5 on the confounding item. None of the studies had an a priori protocol or an a priori analysis plan.
A summary of the risk of bias associated with confounding, incomplete data, and selective reporting for the 21 studies from which it was possible to extract an effect estimate is shown in Table 4. Four studies were given a score of 5 on the confounding item, corresponding to a risk of bias so high that the findings should not be considered in the data synthesis. For these four studies, we did not find it relevant to judge on the selective reporting item because of their already high risk of bias. None of the other studies were given a score of 5 on the incomplete data and selective reporting items.
Risk of Bias—Distribution of the 21 Studies Reporting an Effect Size.
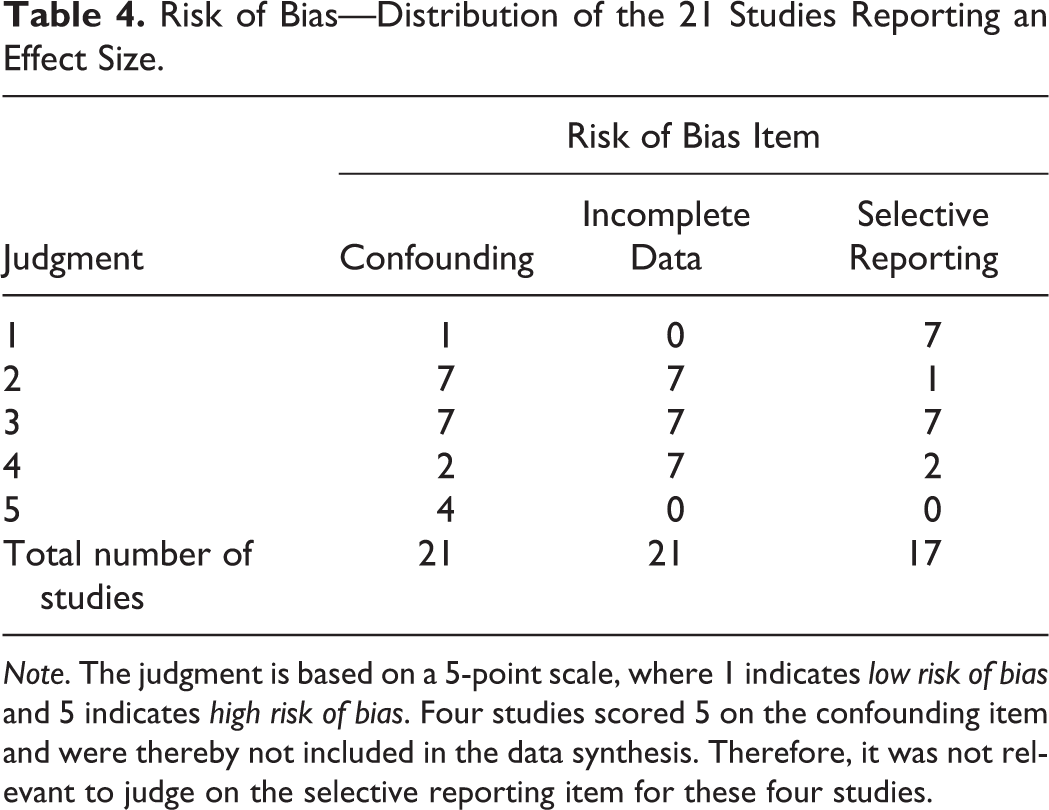
Note. The judgment is based on a 5-point scale, where 1 indicates low risk of bias and 5 indicates high risk of bias. Four studies scored 5 on the confounding item and were thereby not included in the data synthesis. Therefore, it was not relevant to judge on the selective reporting item for these four studies.
Effects of the Intervention
In order to carry out a meta-analysis, every study must have a comparable effect size. All 12 studies used in the meta-analyses reported HRs. The approach shared by the majority (9) of the 12 studies was to use indicator variables for the number of months or weeks until benefit exhaustion; the remaining studies (3) used a linear spline function. The comparison condition was benefit exhaustion that was not immediate.
In the majority of studies, the results were measured at multiple time points. The effect estimates at different time points were independent, as the effect sizes were measured as the proportional impact on the hazard rate that is the event rate (in the present context, the event is finding a job) at time t conditional on survival (staying unemployed) until time t or later.
The outcome at each time point was analyzed in a separate meta-analysis with other comparable studies taking measures at similar time points. Two studies reported separate effect measures based on number of weeks or fortnights. For these two studies, the average effect size was calculated and used to avoid dependence problems.
Five studies reported separate effect measures for men and women. Of these, two studies further reported separate effect measures for two different regions, and one study reported separate effect measures for recall and exit to new job. For these five studies, the average effect size was also calculated and used to avoid dependence problems.
We rely on results of random effects models. We carried out our meta-analyses using the point estimate of the HR. An HR greater than 1 favors the treated group, which means that the conditional exit rate from unemployment into employment is higher for persons who approach exhaustion than for persons who do not approach exhaustion.
Primary Outcome Results
The month or week of exhaustion
Nine studies provided effect estimates in the month or week of exhaustion. All nine studies reported results that indicated a positive exhaustion effect; only two of the study-level effects were statistically nonsignificant. Pooled results showed a significant exhaustion effect. The random effects weighted mean HR was 1.78 (95% CI [1.33, 2.38], p < .0001); however, there was significant heterogeneity of effects among studies (τ2 = 0.16, Q = 120.62, df = 8, p < .00001). The forest plot is displayed in Figure 2.

Forest plot, the week/month of exhaustion.
One month before exhaustion
Nine studies provided effect estimates 1 month before benefit exhaustion. All nine studies reported results that indicated a positive exhaustion effect. Five of the study-level effects were statistically nonsignificant, but pooled results showed a significant exhaustion effect. The random effects weighted mean HR was 1.30 (95% CI [1.12, 1.50], p < .0001); however, there was significant heterogeneity of effects among studies (τ2 = 0.03, Q = 53.63, df = 8, p < .00001). The forest plot is displayed in Figure 3.
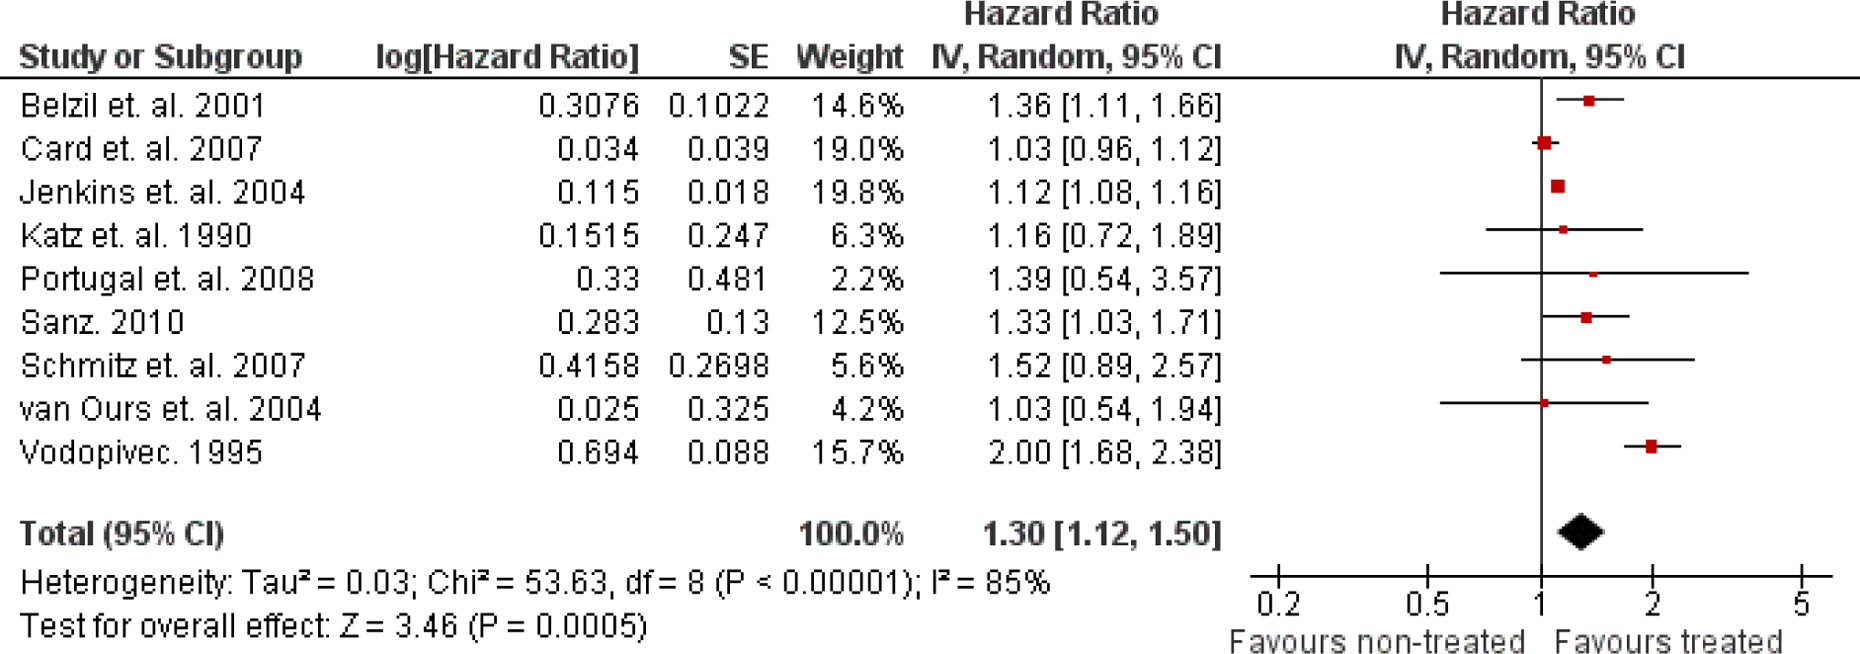
Forest plot, 1 month before exhaustion.
Two months before exhaustion
Seven studies provided effect estimates 2 months before benefit exhaustion. A nonsignificant negative threat effect was found in one study, while six studies reported results that indicated a positive exhaustion effect. Only one of the individual study-level effects was statistically significant, and in the positive direction. Pooled results showed a significant exhaustion effect. The random effects weighted mean HR was 1.10 (95% CI [1.00, 1.22], p = .04). There was significant heterogeneity of effects among studies (τ2 = 0.01, Q = 26.51, df = 6, p = .0002). The forest plot is displayed in Figure 4.

Forest plot, 2 months before exhaustion.
Between 2 and 4 months before exhaustion
Three studies provided effect estimates between 2 and 4 months before benefit exhaustion. A statistically significant negative effect was found in Jenkins and Garcia-Serrano (2004), while two studies reported results that indicated a statistically significant positive exhaustion effect. Pooled results did not show a significant exhaustion effect. The random effects weighted mean HR was 1.32 (95% CI [0.60, 2.87], p = .49). There was significant heterogeneity of effects among studies (τ2 = 0.46, Q = 98.23, df = 2, p < .00001). The forest plot is displayed in Figure 5.
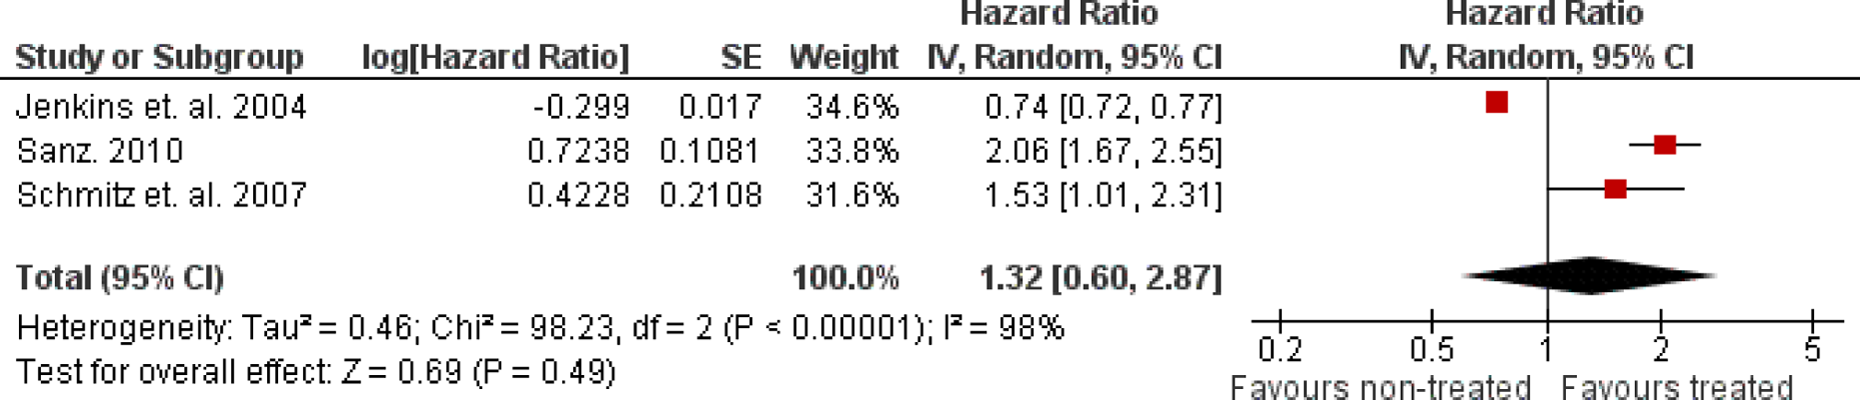
Forest plot, between 2 and 4 months before exhaustion.
One month after exhaustion
Four studies provided effect estimates 1 month after benefit exhaustion. A statistically significant negative effect was found in one study, while three studies reported results that indicated a statistically significant positive exhaustion effect. Pooled results did not show a significant exhaustion effect. The random effects weighted mean HR was 0.98 (95% CI [0.57, 1.67], p = .93). There was significant heterogeneity of effects among studies (τ2 = 0.29, Q = 120.18, df = 3, p < .00001). The forest plot is displayed in Figure 6.
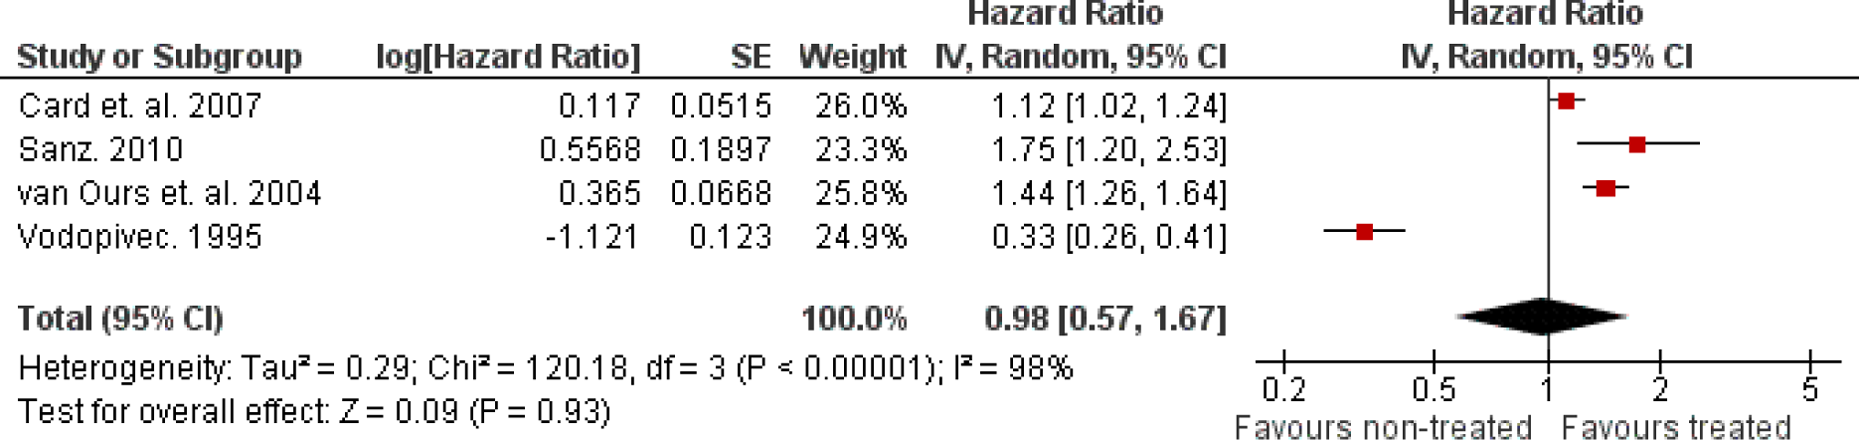
Forest plot, 1 month after exhaustion.
Summary of primary outcome results
The data synthesis for the primary outcome, the impact of exhaustion of unemployment benefit, revealed a significant exhaustion effect in the month/week of benefit exhaustion, 1 month before exhaustion, and 2 months before exhaustion. No significant effects were found more than 2 months before exhaustion or 1 month after benefits have expired.
Secondary outcome results
In addition to the primary outcome, exit rate from unemployment into employment, we planned to consider secondary outcomes in terms of the impact of exhaustion of benefits on the exit rate of the reemployment job and on the reemployment wage. No studies provided data on the reemployment wage. However, estimates of the relative exit rate from the reemployment job, that is, the reemployment HR, were provided. We included this measure in the analysis of secondary outcomes. A higher exit rate from the reemployment job indicates that the exhaustion of benefits forces unemployed individuals to find jobs that do not match their qualifications and, therefore, they may return to unemployment quickly. One study, Gaure, Røed, and Westlie (2008), analyzed both reemployment hazards and monthly earnings, but the study did not provide data that permitted the calculation of an effect size. Four studies provided an effect size in the form of reemployment HRs, of which two were from Slovenia analyzing the same time period. The choice of which study to use in the data synthesis could not be based on our quality assessment. The two studies were almost identical, using the same data, method of estimation, and both used legislative changes and individual variation in entitlement due to labor market history to identify the effect. The only difference was that in van Ours and Vodopivec (2006), work experience was included (among other variables) as a confounding factor in the analysis, and this factor was not controlled for in Boone and van Ours (2009). We therefore chose to use van Ours and Vodopivec (2006) in the data synthesis. The effect sizes from the two studies do not differ much, and a sensitivity analysis shows that the pooled effect size from using the one or the other study does not differ. Only the lower limit of the 95% CI of the pooled effect size differs marginally (by 0.01).
Of the three studies used in the meta-analysis, two studies reported HRs using indicator variables for the number of months or weeks until benefit exhaustion, and one study used a linear spline function. It was not possible to analyze the exit rate of jobs found at different time points before benefit exhaustion. Two studies reported separate effect sizes for men and women, and one study reported separate effect sizes for permanent and temporary jobs. For all studies, a synthetic (the average) effect size was calculated and used to avoid dependence problems.
We carried out our meta-analysis using the point estimate of the HR. A HR of less than 1 indicates that treatment groups are favored. That is, the conditional exit rate from the reemployment job into unemployment is lower for persons who found the job when they approached benefit exhaustion than for persons who found the job when not approaching benefit exhaustion.
All three studies reported individual nonsignificant exhaustion effects. Pooled results were also nonsignificant. The random effects weighted mean HR was 1.03 (95% CI [0.99, 1.07], p = .09). There was no evidence of significant heterogeneity of effects among studies (τ2 = 0.00, Q = 1.44, df = 2, p = .49). The forest plot is displayed in Figure 7.
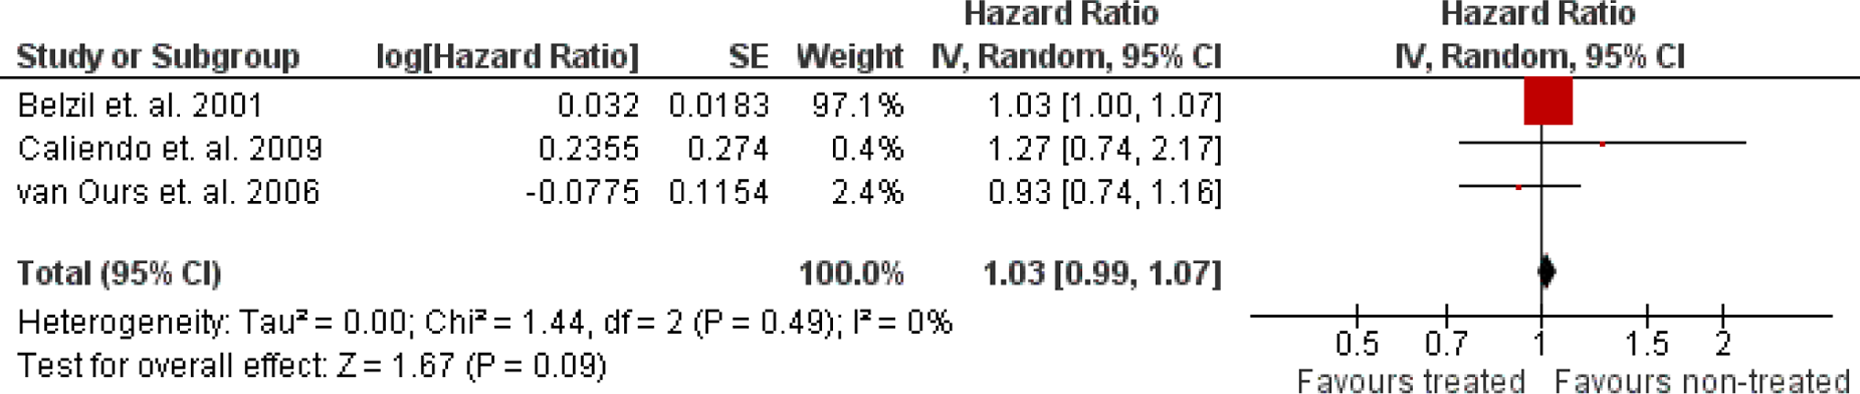
Forest plot, exit from reemployment job.
Moderator analysis and investigation of heterogeneity
The included studies differed in terms of their sample characteristics, comparison conditions, and methodology. With between three and nine studies in a single meta-analysis, the statistical power to detect heterogeneity of effects was quite low; nevertheless, evidence of statistical heterogeneity was found.
With the aim of explaining observed heterogeneity, we planned to investigate the following factors: study-level summaries of participant characteristics (e.g., specific age group, gender or educational level), labor market conditions (good/bad), type of unemployment benefit (UI or SA/UA), maximum entitlement (less than 1 year, between 1 and 2 years, more than 2 years), whether alternative benefits were available, and if compulsory activation was part of the system.
Among the studies used in the data synthesis, only one study restricted its analysis to a specific age group (18–25 years), and none restricted their analyses to a specific educational level. No separate estimates for young/old or low/high educational level were available. The majority of studies did not report the labor market conditions and, among those that did, there was hardly any variation in this covariate. All studies reported the maximum entitlement, and almost all studies reported the individual entitlement as well (see Table 3). As all but one study used individual variation in entitlement as part of the identification strategy, and effect estimates were not provided separated by individual entitlement, it was unfortunately not possible to analyze the impact of entitlement on the between-study variation in exhaustion effects. Even a comparison of effect sizes by countries with low/high maximum entitlement does not provide the “right” guidance as to whether a larger effect size was found for lower maximum entitlements. For example, a comparison of the effect size for the Czech Republic, with a maximum entitlement of 6 months, and the effect size for Spain, with a maximum entitlement of 24 months, would be misleading. The individual entitlement in Spain in the period 1987–1992 was 3 months if tenure in the last 48 months was 6–12 months, it then increased in 3-month intervals for each incremental 6 months of tenure in the last 48 months up to a maximum of 24 months with tenure more than 48 months. The effect size for Spain is thus an average of unemployment benefit exhaustion effects at various individual entitlements. Thus, a country comparison of the reported effect sizes is not a comparison of high (in Spain) versus low (in Czech Republic) maximum entitlement as one might think.
Concerning the three covariates: type of unemployment benefit, availability of alternative benefits, and compulsory activation, they were either not reported or there was no variation in the covariate.
Five studies provided separate effect estimates by gender. Although these five studies comprise a subset of the included studies, we chose to investigate the impact of gender using effect estimates separated by gender within studies. In general, the strength of inference regarding differences in treatment effects using subsets of studies is controversial. However, making inferences about different effect sizes among subgroups on the basis of between-study differences entails a higher risk compared to inferences made on the basis of within-study differences (Oxman & Guyatt, 1992).
Subgroup analysis was therefore performed using effect estimates separated by gender from the five studies where separate estimates were available. We have drawn no overall conclusion because the analysis is based on a subset of the studies used in the data synthesis. The assessment of any difference between the subgroups is based on 95% CIs and interpretation of relationships is cautious.
Of the five studies that reported separate effect measures for men and women, two studies further reported separate effect measures for two different regions, and one study reported separate effect measures for recall and exit to new job. For these two studies, a synthetic (the average) effect size was calculated and used to avoid dependence problems.
The month or week of exhaustion
The forest plot for the five studies reporting gender breakdowns is displayed in Figure 8. Pooled results for both subgroups showed significantly positive exhaustion effects; HR = 1.67 (95% CI [1.17, 2.39]) for men and HR = 1.85 (95% CI [1.38, 2.48]) for women. There was significant heterogeneity of effects among studies in both subgroups (τ2 = 0.13, Q = 21.66, df = 4, p = .0002 for men and τ2 = 0.06, Q = 9.64, df = 4, p = .05 for women). The CIs for the subgroups differed only marginally. There was no evidence to support the hypothesis that the exhaustion effect in the week or month of exhaustion differs by gender.
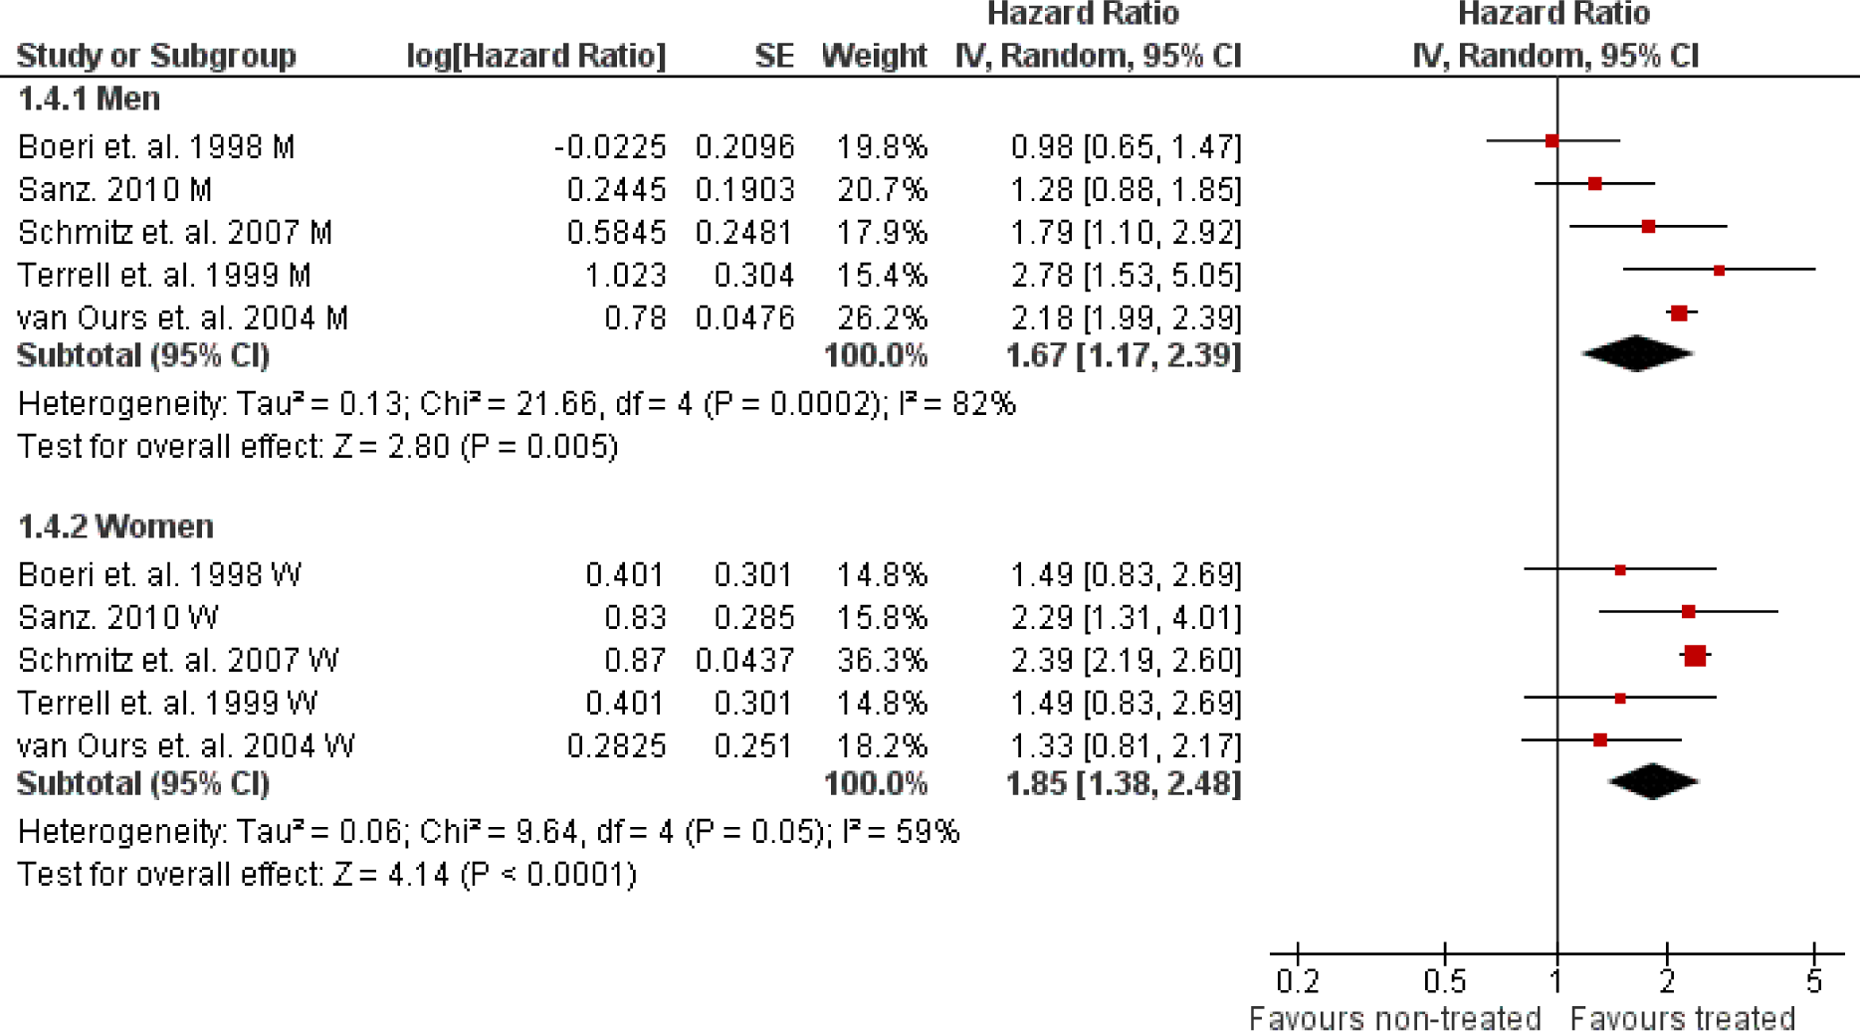
Forest plot, subgroup—The week/month of exhaustion.
One month before exhaustion
Three studies reported estimates separated by gender for the 1-month time period. Pooled results for men showed a nonsignificant exhaustion effect, whereas pooled results for women showed a significant positive exhaustion effect. The forest plot is displayed in Figure 9. There was no significant heterogeneity of effects among studies in either of the subgroups (τ2 = 0.00, Q = 2.37, df = 2, p = .31 for men and τ2 = 0.00, Q = 1.08, df = 2, p = .58 for women). The CIs of the subgroups did not overlap (95% CI [0.88, 1.16] for men and 95% CI [1.48, 2.19] for women). However, making inferences about different effect sizes among subgroups entails a higher risk when the difference is not consistent within the studies (Oxman & Guyatt, 1992). Only in the Sanz (2010) study was there a clear difference between men and women. The effect estimates in both the Schmitz and Steiner (2007) and the van Ours and Vodopivec (2004) studies were nonsignificant for both men and women and the 95% CI for women included the 95% CI for men in the van Ours and Vodopivec (2004) study, whereas the 95% CI of men included the 95% CI for women in the Schmitz and Steiner study. There is no evidence to support the hypothesis that the exhaustion effect 1 month before exhaustion differs by gender.
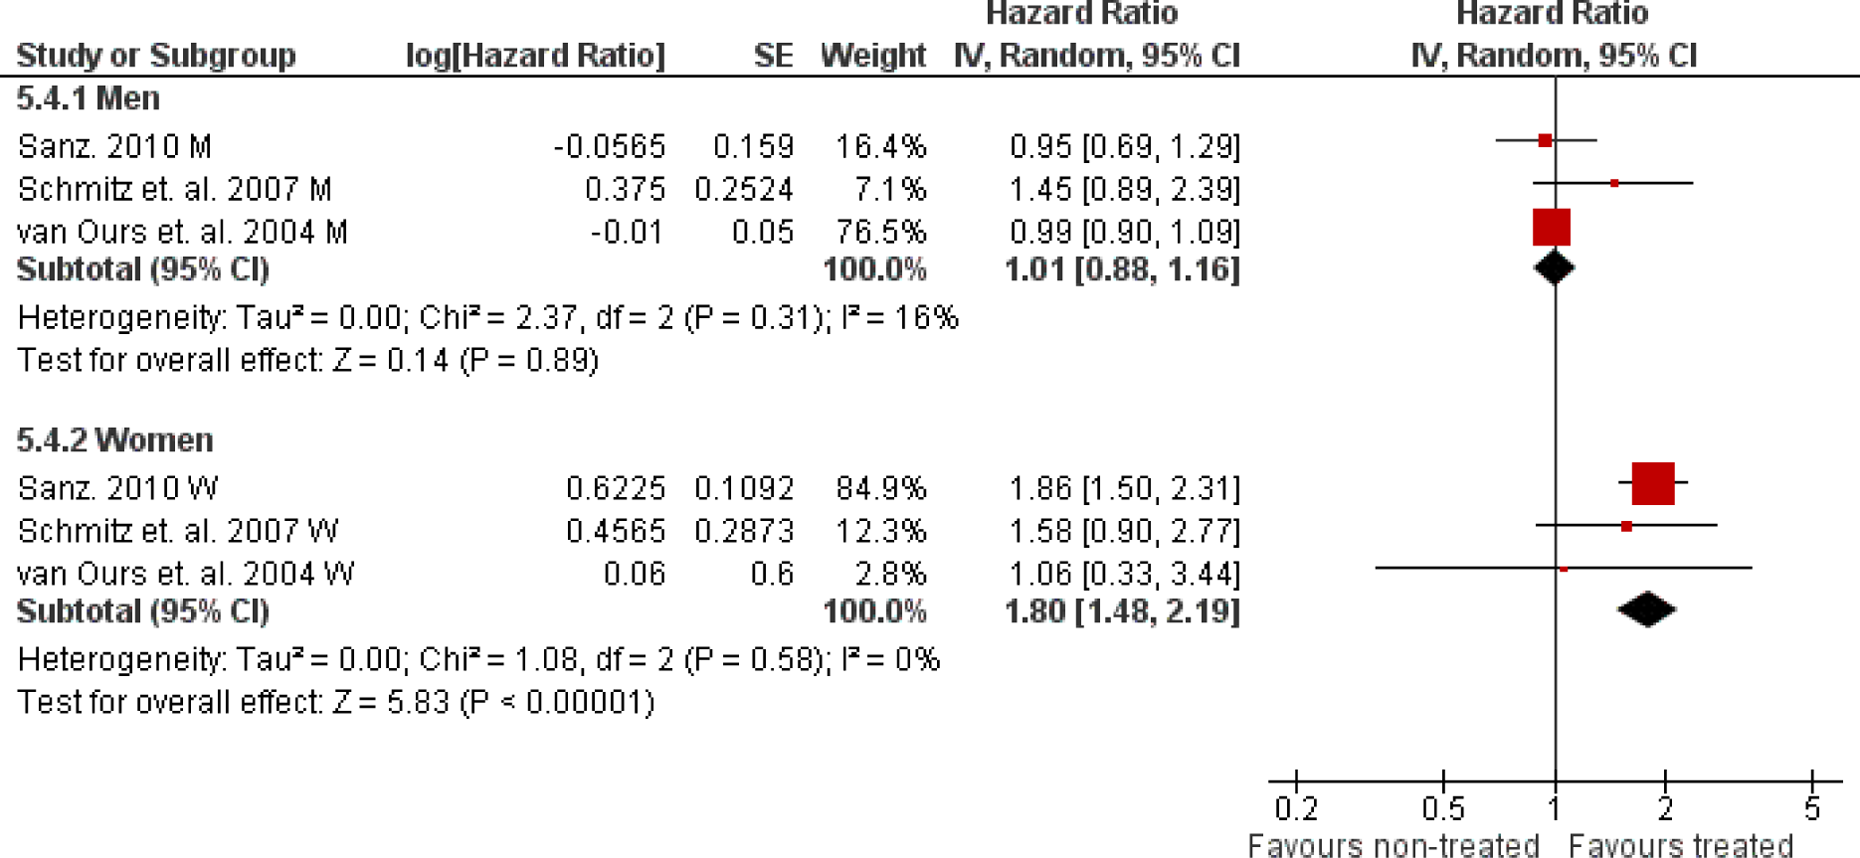
Forest plot, subgroup—1 month before exhaustion.
Two months before exhaustion
No effect estimates separated by gender were available.
Between 2 and 4 months before exhaustion
Two studies reported estimates separated by gender for the 2- to 4-month time period. Pooled results for both subgroups showed a positive exhaustion effect; HR = 1.85 for men and HR = 1.76 for women. There was significant heterogeneity of effects among studies in the subgroup of men but no significant heterogeneity of effects among studies in the subgroup of women (τ2 = 0.13, Q = 6.08, df = 1, p = .01 for men and τ2 = 0.00, Q = 0.02, df = 1, p = .88 for women). The CI of the subgroup of men was wide and inclusive of the CI of the subgroup of women (95% CI [1.06, 3.21] for men and 95% CI [1.48, 2.10] for women). There is no evidence to support the hypothesis that the exhaustion effect between 2 and 4 months before exhaustion differs by gender. The forest plot is displayed in Figure 10.

Forest plot, subgroup—between 2 and 4 months before exhaustion.
One month after exhaustion
Two studies reported estimates separated by gender for the 1-month period after benefit exhaustion. Pooled results for both subgroups showed a positive exhaustion effect; HR = 1.63 for men and HR = 1.36 for women. There was no significant heterogeneity of effects among either of the subgroups (τ2 = 0.01, Q = 1.29, df = 1, p = .26 for men and τ2 = 0.00, Q = 0.45, df = 1, p = .50 for women). The CIs of the subgroups overlapped (95% CI [1.33, 2.00] for men and 95% CI [1.21, 1.53] for women). There is no evidence to support the hypothesis that the exhaustion effect 1 month after exhaustion differs by gender. The forest plot is displayed in Figure 11.
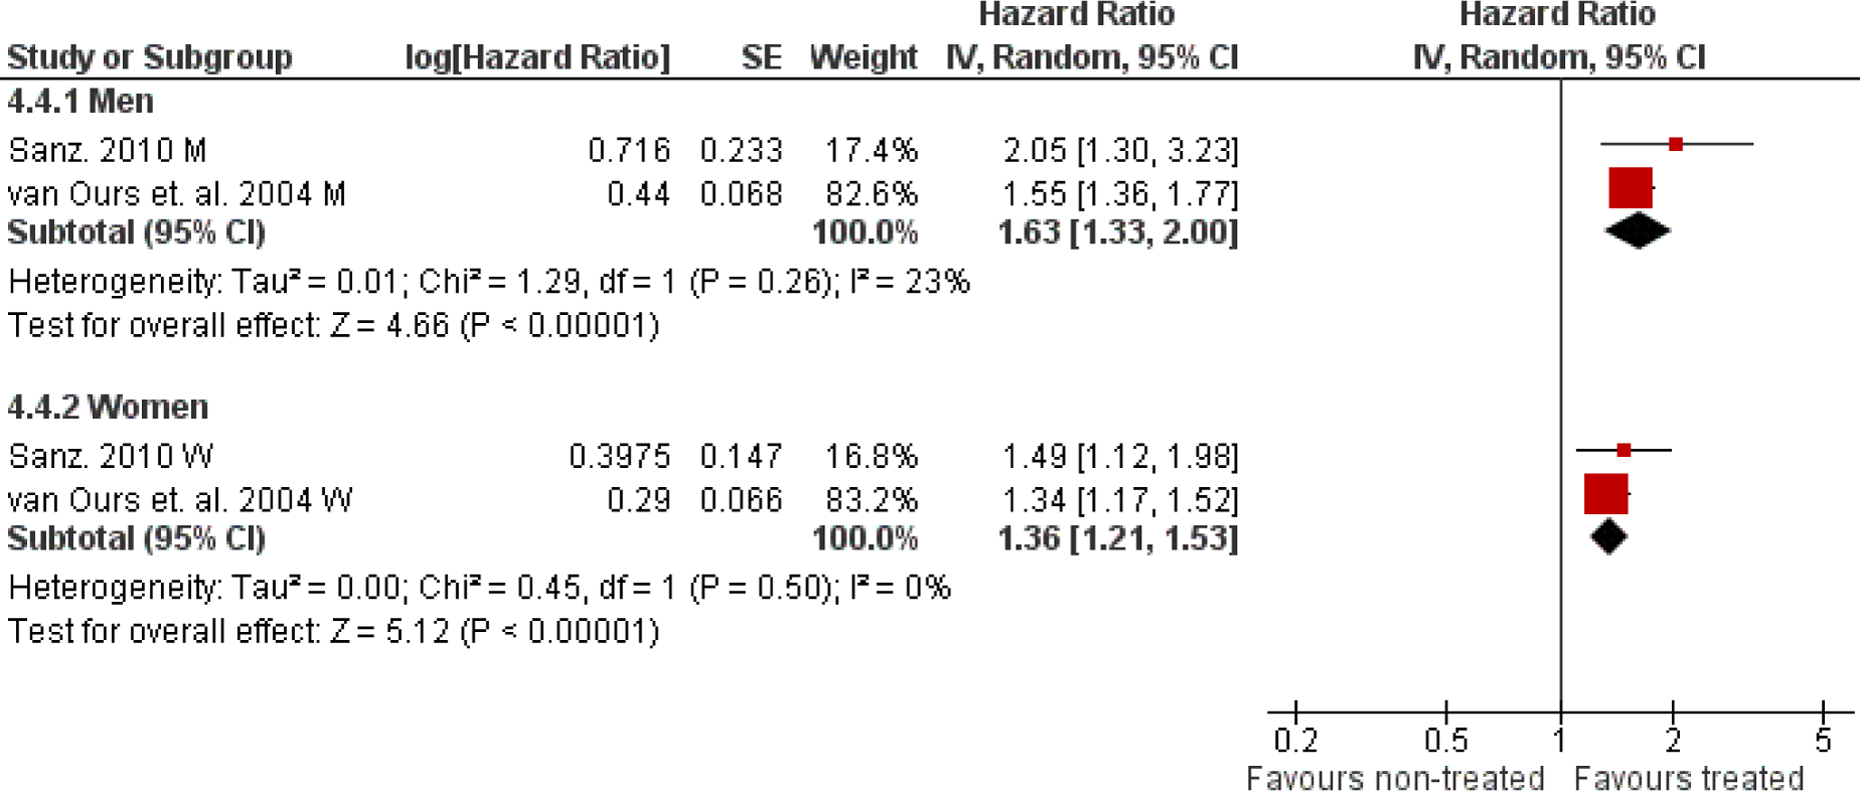
Forest plot, subgroup—1 month after exhaustion.
Sensitivity analysis
Sensitivity analyses were planned to evaluate whether the pooled effect sizes were robust across study design and components of methodological quality. Due to the fact that we found no RCTs, we could not evaluate the impact of study design. For methodological quality, we carried out sensitivity analyses for the confounding, incomplete data, and selective reporting components of the risk of bias checklists, respectively. Two sets of sensitivity analyses were performed. First, we examined the robustness of conclusions when we excluded studies with risk of bias scores of 4 on confounding, incomplete data, or selective reporting. Second, we examined the robustness of our conclusions when we excluded studies with risk of bias scores of 3 or 4 on confounding, incomplete data, or selective reporting. Sensitivity analyses were further used to examine the robustness of conclusions in relation to the quality of data (outcome measures based on weekly or monthly data collection and whether data were derived from questionnaires or administrative registers).
Due to the small number of studies providing effect estimates for the time intervals 2–4 months before exhaustion and 1 month after exhaustion, we only performed sensitivity analyses for the following three time points: (1) the month or week of exhaustion, (2) 1 month before exhaustion, and (3) 2 months before exhaustion. The results are provided in Table 5 and in forest plots in Filges et al. (2013).
Sensitivity Analysis—Results.
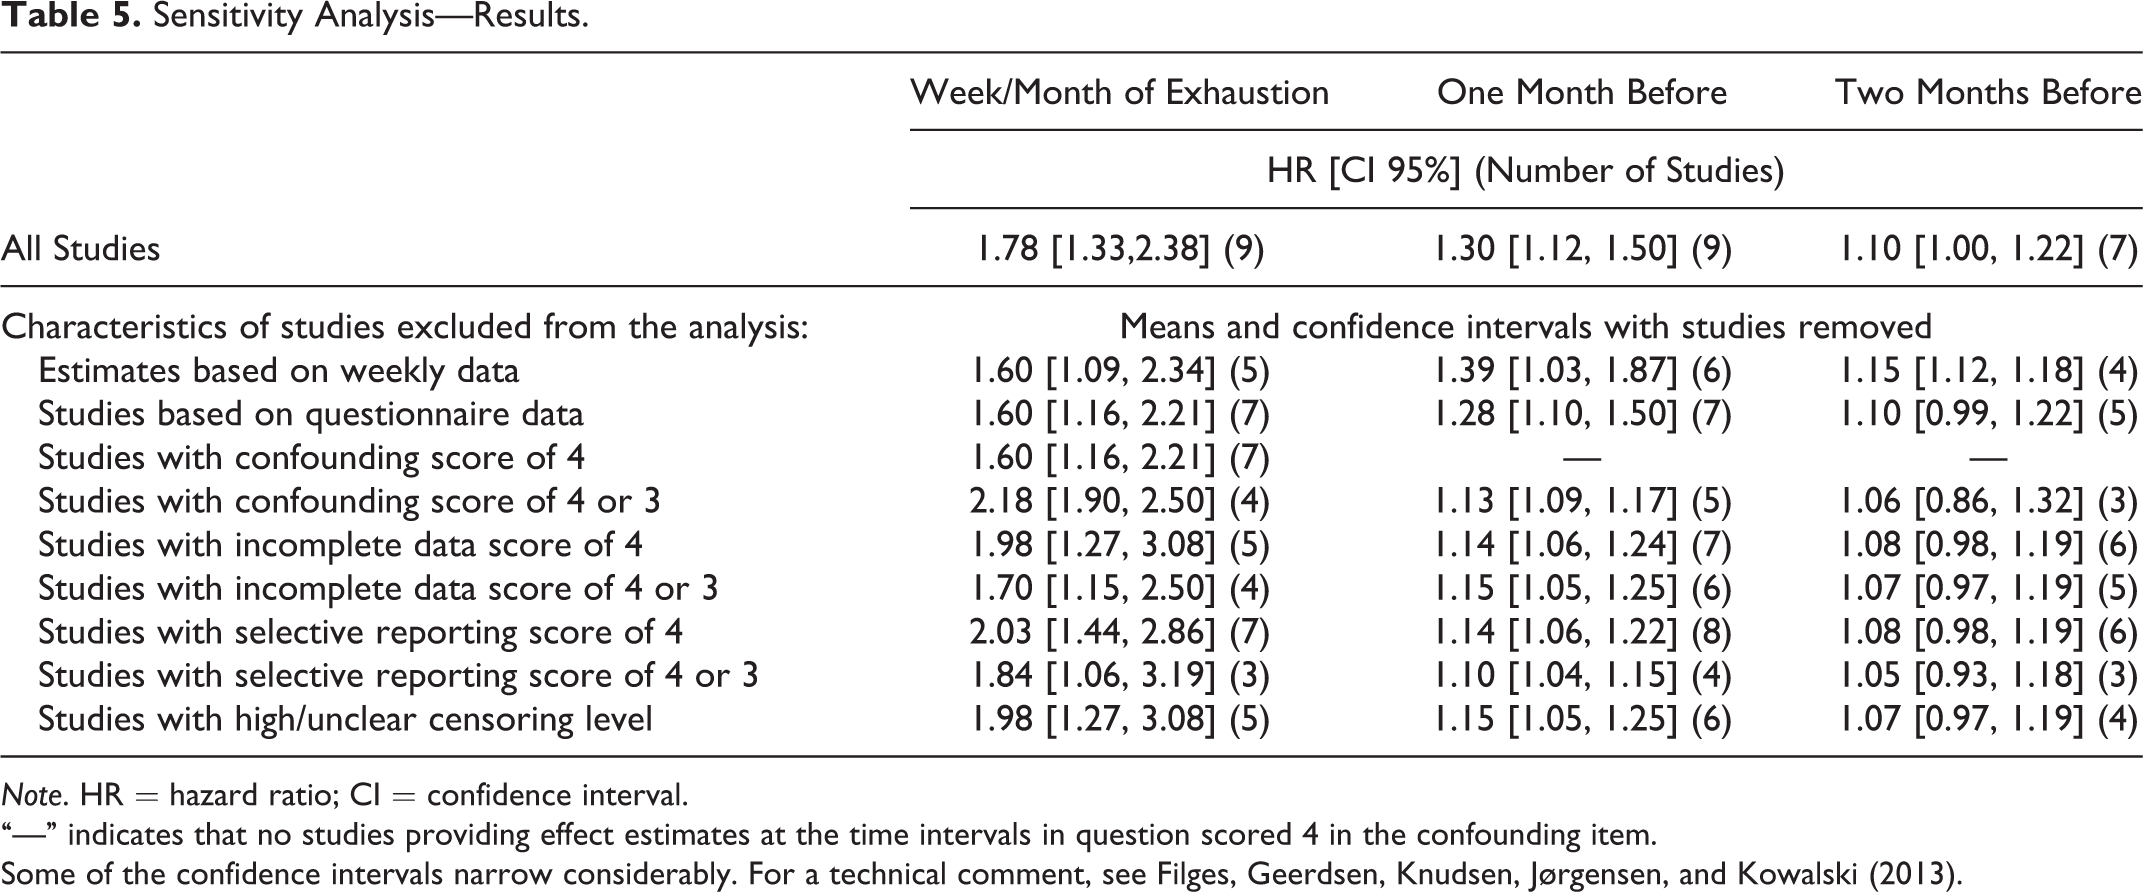
Note. HR = hazard ratio; CI = confidence interval.
“—” indicates that no studies providing effect estimates at the time intervals in question scored 4 in the confounding item.
Some of the confidence intervals narrow considerably. For a technical comment, see Filges, Geerdsen, Knudsen, Jørgensen, and Kowalski (2013).
For the exhaustion effect in the month or week of exhaustion, there were no appreciable changes in the results either due to exclusion of studies where the effect estimates were based on weekly data or due to exclusion of studies using questionnaire data. There were no appreciable changes in the results either due to exclusion of studies with a high/unclear censoring level or due to exclusion of studies with scores of 4 on the confounding, incomplete data, or selective reporting components of the risk of bias checklists. Finally, there were no appreciable changes in the results due to exclusion of studies with scores of either 3 or 4 on the confounding, incomplete data, or selective reporting components of the risk of bias checklists. The overall conclusion that the hazard rate significantly increases in the month or week of exhaustion does not change. In fact, when we only included the studies with the highest scores on the confounding component of the risk of bias Checklist (1 and 2), the pooled effect was higher and the CI was narrower compared to inclusion of all studies.
For the effect estimate 1 month before exhaustion, there were no appreciable changes in the results due to exclusion of studies where the effect estimates were based on weekly data, or due to exclusion of studies using questionnaire data, or due to exclusion of studies with a high/unclear censoring level. There were no appreciable changes in the results either due to exclusion of studies with scores of 4 on the confounding, incomplete data, or selective reporting components of the risk of bias checklists, or due to exclusion of studies with a scores of either 3 or 4 on the confounding, incomplete data, or selective reporting components of the risk of bias checklists. The overall conclusion is that the hazard rate increases but less than at the week or month of exhaustion. The exhaustion effect estimate 1 month before exhaustion is only sensitive in the sense that the CIs narrow when studies with high/unclear censoring levels or studies with high risk of bias are excluded.
For the effect estimate 2 months before exhaustion, there were no appreciable changes in the results either due to exclusion of studies where the effect estimates were based on questionnaire data or due to exclusion of studies with scores of 4 on the confounding, incomplete data, or selective reporting components of the risk of bias checklists. Finally, there were no appreciable changes in the results due to exclusion of studies with scores of either 3 or 4 on the confounding, incomplete data, or selective reporting components of the risk of bias checklists. The exhaustion effect estimate 2 months before exhaustion is, however, sensitive to the exclusion of studies where the effect estimates were based on weekly data in the sense that the CI narrows. The point estimate increases only slightly but is now very precisely estimated and significant within a 95% CI.
Publication bias
We have assessed the possibility of publication bias for the three time intervals: (1) the week or month of exhaustion, (2) 1 month before exhaustion, and (3) 2 months before exhaustion. We did not consider the remaining time intervals (between 2 and 4 months before exhaustion and 1 month after exhaustion), as there were too few studies that provide effect estimates (three and four). We assessed the possibility of publication bias visually by examining funnel plots. The three funnel plots can be found in Filges et al. (2013). There are too few studies and not enough variation in the standard errors to assess whether the funnel plots are symmetric. However, there is no striking asymmetry visible in any of the funnel plots.
Discussion
Summary of the Main Results
This review focused on the incentive effect of benefit exhaustion, that is, the increase in the exit rate out of unemployment into employment of an unemployed person approaching benefit exhaustion. The available evidence supports the hypothesis that there is an incentive effect of approaching benefit exhaustion but only shortly prior to exhaustion and at the time of exhaustion. Furthermore, the available evidence suggests that this incentive effect diminishes as time increases both before and after the time of expiration.
We found a statistically significant exhaustion effect in the month/week of benefit exhaustion. The effect estimate translates into an increase of approximately 80% in the exit rate from unemployment into employment. The exit rate, also termed the hazard, is the rate within a short time interval at which the unemployed find a job conditional on staying unemployed. In other words, the probability of finding a job in that short time interval is the hazard rate. The time intervals used in primary studies varied; they were either 1 week or 1 month. This means that, for an unemployed person who has stayed unemployed until the month/week of benefit exhaustion, the probability of finding a job increases with 80% in that time interval solely due to the prospect of benefit exhaustion.
The increase in the hazard rate associated with benefit exhaustion starts even earlier. We found a statistically significant exhaustion effect 1 month before benefit exhaustion, though this effect was smaller than that found for the month/week of exhaustion. The effect estimate 1 month before benefit exhaustion translates into a 30% increase in the exit rate from unemployment into employment. A significant effect of a 10% increase in the exit rate from unemployment to employment was found 2 months prior to benefit exhaustion. No significant effects for benefit exhaustion were found more than 2 months before exhaustion, and no significant effects for benefit exhaustion were found after benefits had expired.
Interpretation of the results would ideally involve a measure of the average hazard rates for the comparison. However, none of the included studies reported such rates. Most of the studies, however, displayed figures of the average hazard rates over the entire unemployment period. Using these figures, we were able to estimate that the relevant hazard rates (depending on the reference used in the estimation which varies between studies) lie in the interval 0.02–0.08, that is, the conditional probability of finding a job in a short time interval (a week or a month depending on the unit of analysis in the primary studies) lies between 2% and 8%. Thus, 2 months prior to exhaustion, the hazard rates have increased with 10% to the interval 0.022–0.088, that is, the conditional probability of finding a job in a short time interval has increased to 2.2–8.8% solely due to the prospect of benefit exhaustion. One month prior to exhaustion, the hazard rates have increased with 30% so the conditional probability of finding a job in a short time interval has increased to 2.6–10.4%. In the week/month of exhaustion, the hazard rates have increased with 80% so the conditional probability of finding a job in a short time interval has increased to 3.6–14.4% solely due to the prospect of benefit exhaustion.
It was possible to assess the impact of gender using a subset of studies. We found no evidence to support the hypothesis that the exhaustion effect differs by gender.
Concerning secondary outcomes, we analyzed the effect of benefit exhaustion on the subsequent exit rate from the reemployment job. Only three studies could be used in this analysis. Based on the low number of studies, the evidence was inconclusive with respect to support of the hypothesis that the prospect of benefit exhaustion has an impact on the quality of the job measured as the exit rate of reemployment.
Overall Completeness and Applicability of Evidence
In this review, we included 12 studies in the data synthesis. In the light of the large number of studies meeting the inclusion criteria for this review (n = 47), this number is quite low. The reduction was caused by three factors. Unfortunately, 26 of the 47 studies did not report effect estimates or provide data that enabled the calculation of an effect size. Disregarding studies without a usable effect estimate, it was still possible to include 21 studies in the data synthesis. Of these 21 studies, four were judged to have a risk of bias of 5 on the point scale. In accordance with the protocol, we did not use these studies in the data synthesis. The score of 5 corresponds to a risk of bias so high that the findings of those studies are more likely to mislead than inform. Due to overlap of the samples used in several studies, the number of studies in the synthesis was further reduced to 12. If all the 47 studies had provided an effect estimate or provided data that enabled the calculation of an effect size, the final list of usable studies in the data synthesis would have been larger, which again would have provided a more robust literature on which to base conclusions.
During the reduction from 47 studies to 12 studies, the list of countries represented became shorter. The 47 included studies originated from 19 different countries, whereas the 12 studies used in the data synthesis originated from only 9 different countries. The coverage became narrower as studies from many Western European countries could not be used in the data synthesis, including Norway, Sweden, Finland, the Netherlands, Belgium, the United Kingdom, and Switzerland. The 12 studies used in the data synthesis covered the United States, Canada, Portugal, Spain, Slovenia, Germany, Czech Republic, Austria, and Poland.
The 12 studies included in the data synthesis were used to consider the effect on the primary outcome, namely individuals’ exit rate out of unemployment and into employment.
It was not possible to examine if the exhaustion effect differed for particular age or educational groups, or if factors such as good/bad labor market conditions, high/low maximum entitlement, availability of alternative benefits, and whether compulsory activation was part of the system had an impact on the exhaustion effect. It was possible to study the impact of gender but only using a subgroup of five studies.
To obtain a clearer picture of the effect of the prospect of benefit exhaustion on the quality of the job, the intention was to consider the duration of reemployment and the reemployment wage as secondary outcomes. Unfortunately, no studies provided data for reemployment wages. However, four studies provided data for the effect of benefit exhaustion on the subsequent exit rate from the reemployment job. We included the measure of exit rate from the reemployment job in the analysis of secondary outcomes. A high exit rate from the reemployment job could indicate that the exhaustion of benefits forces unemployed individuals to find jobs that do not match their qualifications, and therefore they return to unemployment quickly. Due to overlap of data samples, only three studies were eligible for further analysis. The small number of studies reporting this outcome makes us reluctant to draw a conclusion.
Quality of the Evidence
The quality of each study from which it was possible to extract an effect size (21 studies) was examined using a newly developed tool for assessing risk of bias incorporating NRS. One of the main points in this tool is that a study with a risk of bias equal to 5 on the point scale corresponds to a risk of bias so high that the findings should not be considered in the data synthesis. Therefore, the quality of the evidence in this review is guaranteed to be at an acceptable level, as the studies that are more likely to mislead than inform were not used in the data synthesis.
Furthermore, we have performed a sensitivity analysis to check whether the obtained result is robust across methodological quality and data quality. To check the robustness across methodological quality, the studies with relatively high risk of bias in confounding, incomplete data, and selective reporting, respectively, were excluded from the analysis. To check the robustness across data quality, studies with estimates on weekly data were excluded. In addition, studies based on questionnaire data were excluded from the main analysis. The overall conclusion that the hazard rate significantly increases in the month or week of exhaustion did not change. Neither were there appreciable changes in the results for the effect estimate 1 month and 2 months before exhaustion. Due to the low number of studies, it was not possible to perform sensitivity analyses for the remaining time intervals.
Potential Biases in the Review Process
We believe that all of the publicly available studies of the unemployment benefit exhaustion effect on exits to employment up to the censor date were identified during the review process. However, two references were not obtained in full text due to unknown information and long delivery time.
One review author (A.D.K.) and one member of the review team (S.H.F.) independently coded the included studies. Disagreements were resolved by consulting a third review author (T.F.). Decisions about inclusion of studies and assessment of study quality were made by two review authors (A.D.K. and T.F.) independently, and disagreements were resolved by discussion. Data extraction was made by one review author (T.F.) and was checked by a second review author (A.D.K.).
Conclusion
Implications for Practice
In order to reduce high unemployment levels, policy makers may wish to reduce the generosity of the unemployment system either in amount (the replacement rate) or in maximum potential duration. The positive correlation between UI benefit generosity in terms of the replacement rate and unemployment duration is well established at the empirical level (Layard et al., 2005). However, it may be politically intractable to lower the replacement rate, and there are indeed strong efficiency and equity arguments for having a reasonable value of unemployment benefits (Acemoglu & Shimer, 1999; Marimon & Zilibotti, 1999).
Search theory suggests that the prospect of exhaustion of benefits may result in a significantly increased incentive for finding work. Hence, shortening the benefit eligibility period may reduce the share of long and unproductive job searches.
In this review, we have found clear evidence that the prospect of exhaustion of benefits results in a significantly increased incentive for finding work but only shortly prior to exhaustion and at the time of exhaustion. Thus, the theoretical suggestion of an exhaustion effect on job-finding rates has been confirmed empirically.
Whether the increased job-finding rate close to benefit expiration implies a decrease in the overall unemployment level depends on whether it is caused mostly by an increase in search intensity or a decrease in reservation wages. If increases in the job-finding rates close to benefit exhaustion are explained by decreases in reservation wages, those who are close to benefit exhaustion might accept jobs that do not match their qualifications from which they are more likely to quit in the future. If the increased job-finding rates are explained by increases in the search effort, there is no reason to expect that exhaustion of benefits forces unemployed individuals to find jobs that do not match their qualifications.
We found no studies that provided data for reemployment wages. We found three studies that could be used for analysis of the exit rate from the reemployment job. Based on this low number of studies, we found no evidence to support the hypothesis that the prospect of benefit exhaustion has an impact on the quality of the job in terms of the exit rate from the reemployment job. Thus, whether the unemployed workers who are affected may actually be worse off than policy makers intend them to be, in the sense that they accept “bad” jobs, have not yet been fully investigated.
It was not possible to examine a number of factors which we have reasons to expect have an impact on the magnitude of the exhaustion effect. Knowledge of whether the effect depends on labor market conditions and benefit system factors such as the maximum entitlement, availability of alternative benefits, and compulsory activation may be crucial to policy makers. The factors are all potential moderators of the exhaustion effect that policy makers need to be able to assess in relation to the context of their country. The results of this review, however, merely suggest that across a number of countries there is an overall incentive effect of benefit exhaustion on job-finding rates.
Implications for Research
In this review, we have found clear evidence that the prospect of exhaustion of benefits results in a significantly increased incentive for finding work.
Whether the increased job-finding rate close to benefit expiration implies a decrease in the overall unemployment level, however, remains an open question. More information is needed about what triggers the transition out of unemployment.
Further research should be directed at the possible side effects of the benefit exhaustion, in particular whether the unemployed leave unemployment due to a higher acceptance of low-paid employment or due to an increased search effort.
The planned examination of potential moderators of the exhaustion effect was not possible, as the covariates often were not reported. Further, many of the available studies did not provide data that permitted the calculation of an effect size. If effect sizes of these studies had been available, valuable information about the heterogeneous effects of the exhaustion of benefits derived from moderator analyses may possibly have been provided.
These considerations point to the need for studies considering heterogeneous effects of the exhaustion of benefits and for reporting detailed results that permit their inclusion in systematic reviews.
Footnotes
Appendix A
Acknowledgments
We thank Madina Saidj for her invaluable help with screening studies written in French and Maiken W. Pontoppidan for her invaluable help with screening studies in German. We thank Mette Deding for her comments and suggestions and Lise Sand Ellerbæk for her contributions at an early stage of the process of creating this review. We would like to thank Dr. B. C. Reeves from the Cochrane Non-Randomised Studies Methods Group for materials and training regarding the assessment of risk of bias. We appreciate the guidance and comments of Sandra Jo Wilson, Emily E. Tanner-Smith, and Karianne T. Hammerstrøm.
Authors’ Note
The review authors are responsible for any remaining errors. This article is an abridged version of a systematic review previously approved by the Campbell Collaboration. It was invited and accepted by the Editor.
Declaration of Conflicting Interests
The authors declared no potential conflicts of interest with respect to the research, authorship, and/or publication of this article.
Funding
The authors received no financial support for the research, authorship, and/or publication of this article.