



Abstract
Since its creation, the Supplemental Nutrition Assistance Program (SNAP) has changed from an antihunger program to an income-supplementation program. Because the program (and its predecessor Food Stamp Program) was not designed for this purpose, the result is a program that has many unintended and, many believe, negative effects. The key challenge is to modernize a massive income support program that started as a small food assistance program. The author proposes an effort to rationalize the current patchwork of programs that make up the U.S. safety net—in a way that balances what looks to be long-term weak demand for labor with the need to minimize the work and marriage disincentives in current law.
Keywords
The Supplemental Nutrition Assistance Program (SNAP) is a large and complicated program. Together with other safety-net programs, civil rights advances, and economic growth, SNAP (and its predecessor Food Stamp Program) eradicated the income related, severe hunger, and malnutrition among the poor that motivated the program’s creation. SNAP is now a US$74 billion program, servicing about 17% of Americans under age 60. SNAP’s basic shape, however, is anchored in the past—even as the needs of recipients and the U.S. economy have changed. As a result, major issues before the nation are the recent dramatic growth of the SNAP caseload and its behavioral and budgetary implications for the country (Aussenberg, 2013).
In the summer of 1967, I saw American starvation and malnutrition up close. As a civil rights worker in the Mississippi Delta, I (literally) carried ill and malnourished Black children into hospitals. (The hospitals—without this then-law student from the North standing in the admitting room and threatening a lawsuit—ordinarily refused to treat poor African Americans.) The children were starving because their families had no money to buy food. Making things worse, many Black families were denied welfare, simply because of their race. (I saw mothers with young children who applied for welfare being offered bus tickets to Chicago.)
A main reason SNAP enjoys wide political support is that the public continues to view it as an antihunger program when, for many recipients, it is really an income-supplementation program. This is also a worthy purpose, but because the program was not designed for this purpose, the result is a program that has many unintended and, many believe, negative effects. Based on my research and analysis, I think the key challenge is to modernize a massive income support program that started as a small food assistance program. As I describe below, that would mean coordinating the SNAP with Temporary Assistance for Needy Families (TANF), Unemployment Insurance (UI), Supplemental Security Income (SSI) and Social Security Disability Insurance, the Earned Income Tax Credit (EITC), and other tax credits. In doing so, there should be an effort to rationalize the current patchwork of programs that make up the U.S. safety net in a way that balances what looks to be long-term weak demand for labor with the need to minimize the work and marriage disincentives in current law (see Figure 1).
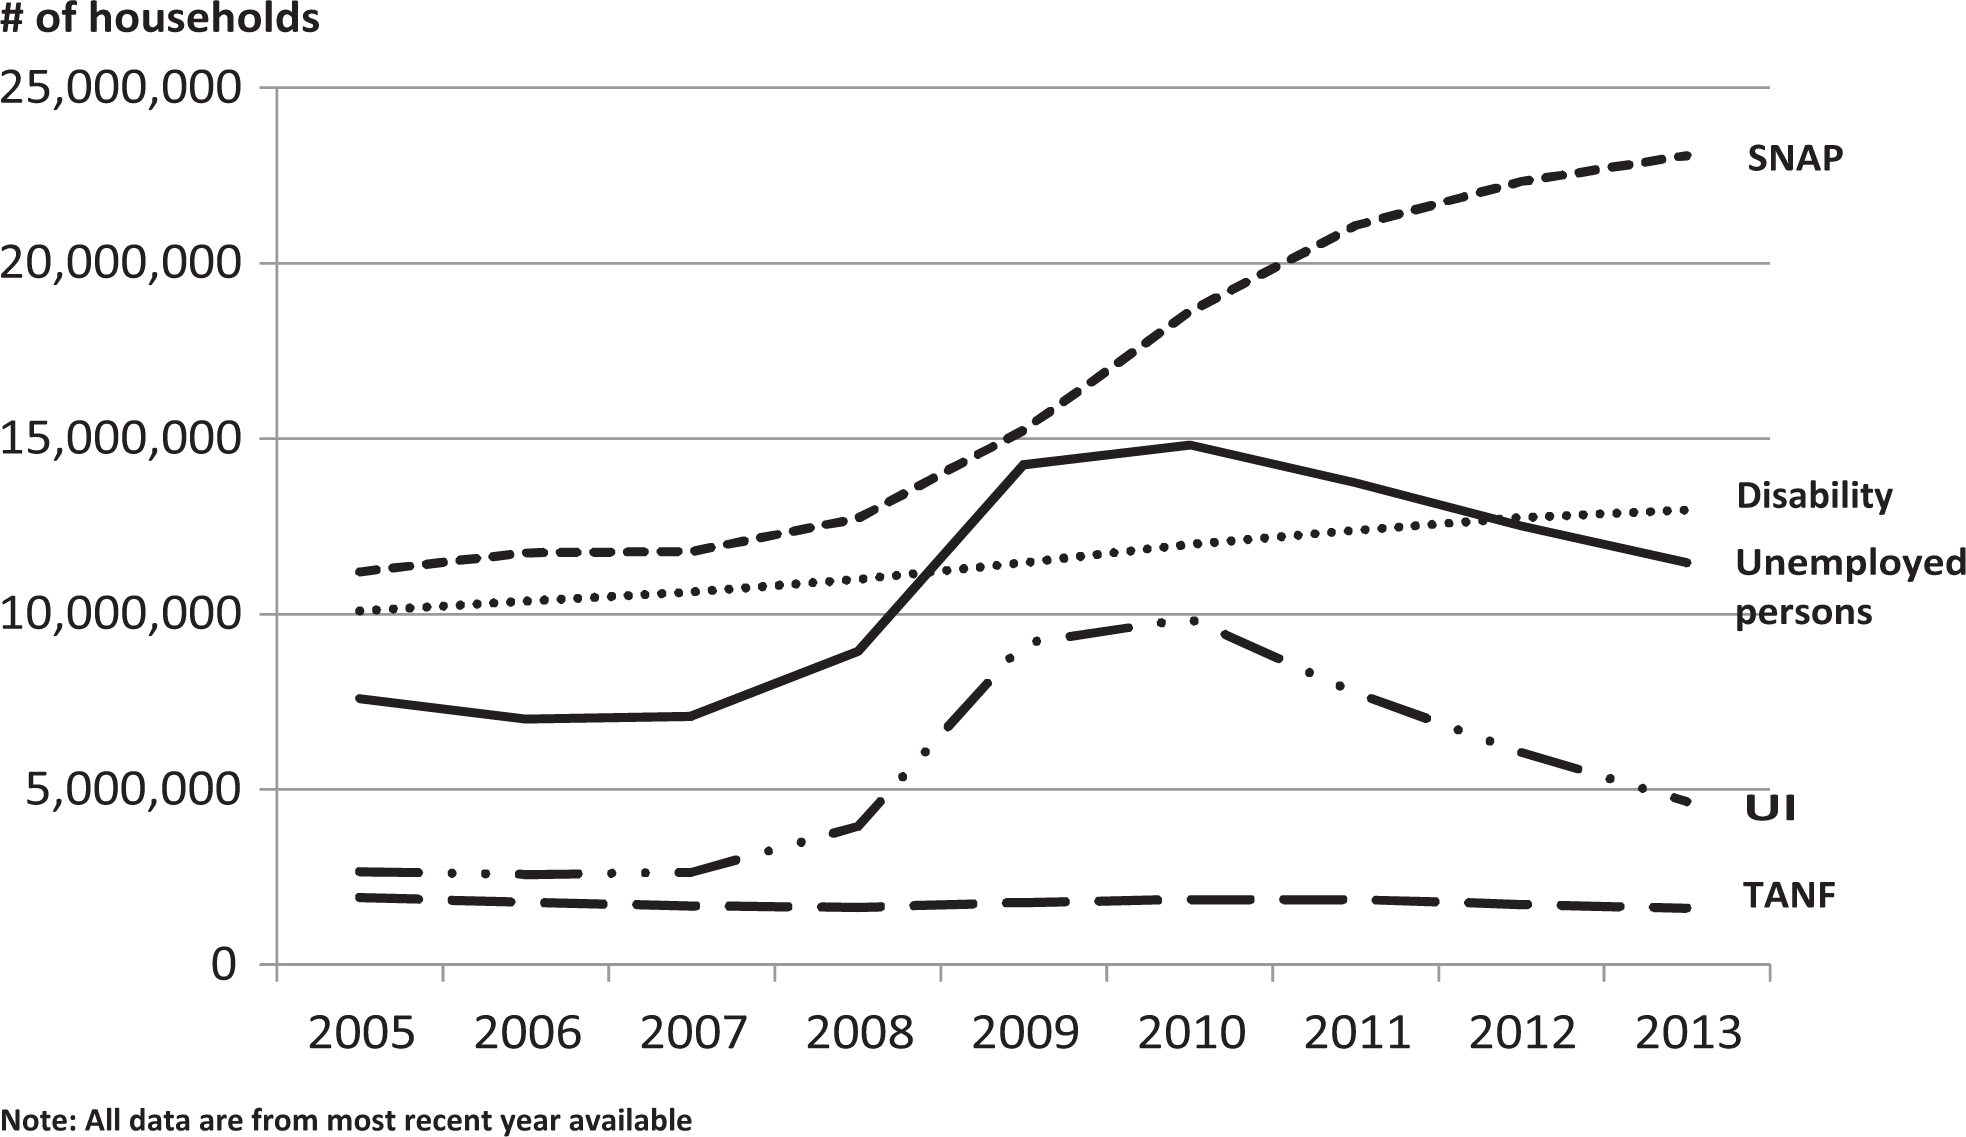
Unemployment and enrollment in select cash and noncash government programs. (Social Security Administration, 2015; U.S. Department of Agriculture, 2015; U.S. Department of Health and Human Services, 2014; & U.S. Department of Labor, 2015).
Program Origins
In 1939, the Congress authorized the United States Department of Agriculture (USDA) to implement a Food Stamp Program for individuals receiving direct relief payments. Individuals who bought orange “food stamps” at face value (accepted by store owners for any product) were given free blue stamps worth 50% of the value of the orange stamps. (This amounted to a one-third subsidy up to US$0.75 worth of food, about US$12.77 in 2014 dollars.) The blue stamps could only be used to “purchase” “surplus food,” that is, food that the federal government had purchased from farmers (to place a floor on its price). This Food Stamp Program was ended in 1943, after general economic conditions had improved as a result of the World War II mobilization (Roth, 2013).
Through the 1950s and early 1960s, the federal government continued to distribute surplus food, essentially by providing the food to local social welfare organizations such as food banks. Over time, support grew for a revived, food stamp-type program on the grounds that it would be more effective than direct distribution of surplus food. In 1961, President John Kennedy, who, as a senator, had introduced a bill to create a Food Stamp Program, issued an executive order that created a pilot Food Stamp Program and also proposed legislation to create a permanent program. The Food Stamp Act passed in 1964, making the program permanent, but for the first few years, it remained relatively small. Localities were not required to implement the program, and some decided against doing so (Roth, 2013; U.S. Department of Agriculture, n.d.a).
In 1967, Senator Robert F. Kennedy famously visited rural Mississippi (with the national media accompanying him) to document that hunger was a serious problem for poor, even with the new Food Stamp Program. In his words, they saw Black children with “bellies … swollen with hunger” (John F. Kennedy Presidential Library and Museum, n.d.).
One of the reasons that the problem of hunger was greatest in the rural south is that many local welfare agencies systematically excluded many African American families from Aid for Families with Dependent Children (AFDC) and other government benefits. In the ensuing years, various steps were taken to alleviate malnutrition, particularly by increasing access to food stamps. An important step was 1970 legislation (proposed by President Richard Nixon) that (1) removed the requirement that food stamp recipients pay a defined amount of their income in order to receive food stamps (called the “purchase requirement”) for families with incomes below US$30 a month (about US$185 a month in 2014 dollars), (2) reduced the purchase requirement for families that did not qualify for free food stamps, and (3) increased the value of monthly food stamps by about 40% (Roth, 2013).
Rather than directly take on the Democrats in control of these Southern states—as well as the powerful Southern Democrats in Congress—advocates expanded federal food assistance as an end run around their opposition. Today’s program is still shaped by this political expediency.
The End of Malnutrition
As mentioned above, as late as the 1960s, symptoms of malnutrition (and especially child malnutrition)—including emaciation, kwashiorkor, marasmus, stunting, wasting, and even death—were a reality in America. The liberalization of AFDC and food stamps in the late 1960s and early 1970s, however, and their consequent large expansions (plus increased opportunities for African Americans), all but eradicated these conditions. Besides the US$75-plus billion SNAP, for example, annual federal expenditures for school breakfasts and lunches have grown to US$16 billion and for WIC (the Special Supplemental Nutrition Program for Women, Infants, and Children) to US$6 billion.
In 1997, Rebecca Blank, who recently served as Acting and Deputy Secretary of Commerce in the Obama Administration, reported, “Evidence of severe malnutrition-related health problems has almost disappeared in this country” (Blank, 1997, p. 163). In fact, since the 1970s, the physical manifestations of real malnutrition have all but disappeared from the nation’s health data. Between 1973 and 2011 (the latest year for which data are available because the Pediatric Nutrition Surveillance Survey was discontinued), the percentage of children who were underweight declined from 7.3% to 3.5% and the percentage of children who were short in stature declined from 9% to 6.3% (Center for Disease Control, 2012). Many of these children suffered from other illnesses or diseases that caused their being underweight. Furthermore, over the past 35 years, there have been almost zero cases of children suffering from protein-energy malnutrition (PEM), and where cases of PEM have been diagnosed in adults, the vast majority are the result of chronic diseases or drug addictions and not insufficient food. (Center for Disease Control, 2012).
In the face of this progress, advocates turned to estimates of “food insecurity” as a rallying point for continuing and expanding SNAP (so does the Obama Administration). Every year since 1995, the federal government has conducted a survey called “The Food Security Survey.” In 2013, it found that 14.3% of American households were “food insecure,” but many think that this is an artificial construct, as it is based on answers to 18 different questions that express some uncertainty about having sufficient financial resources to obtain enough food to meet the needs of all household members even once in the past year (Bavier, 2002). In the same survey, only 5.6% of all households actually reported that one or more household members were hungry—even once in the past year—because they could not afford food (Coleman-Jensen, Gregory, & Singh, 2014). Moreover, only 0.9% of households with children reported that one or more children were hungry at least once during the year. A far cry from the 1960s, the formative years for most federal feeding programs (see Table 1). However, one feels about this controversial and, much criticized concept, it is a very different problem than malnutrition and should not be the basis for making policy for a US$75 billion-plus program (Wunderlich & Norwood, 2006).
Food Insecurity/Hunger (Even Once in the Past Year).

Note. Adapted from Coleman-Jensen, Gregory, & Singh, 2014.
Obesity
Today, instead of hunger, the central nutritional problem facing the poor, indeed all Americans, is not too little food but, rather too much—or at least too many calories. Although there are still some pockets of real and substantial hunger in America, they are predominantly among populations with behavioral or emotional problems. In 1998, for example, then-Agriculture Secretary, Dan Glickman, when discussing the problem of childhood obesity, said that “the simple fact is that more people die in the United States of too much food than of too little, and the habits that lead to this epidemic become ingrained at an early age.” (Besharov, 2002, p. 4).
Today, as many as 70% of low-income adults are overweight, about 10% more than the nonpoor. Adolescents from low-income families are twice as likely to be overweight (16% vs. 8%). Racial disparities are even greater. Almost 82% of African American women, for example, are overweight—almost 30% more than White women. Even more serious, about 57% of African American women are obese—two thirds more than White women (Ogden, Carroll, Kit, & Elegal, 2014; see Table 2).
Overweight/Obesity.

Note. Adapted from Ogden, Carroll, Kit, & Flegal, 2014.
a1961–1962: for adults and 1963–1965: for children.
Overweight and obesity refer to excess amounts of body fat. The commonly used ways to determine whether a person is overweight or obese are based on medical data indicating weight levels (for a given height) that are associated with increased mortality and various health risks. The standard measure is the body mass index (BMI), calculated as weight in kilograms divided by the square of height in meters (or weight in pounds divided by the square of height in inches multiplied by 703). A BMI of 25.0 or more is used to define overweight. In children, overweight is defined as sex- and age-specific BMI above the 95th percentile, based on growth charts from the Centers for Disease Control (CDC). Obesity is defined as a BMI of 30.0 or more. Other methods used to measure overweight and obesity in epidemiologic studies include waist circumference, skin-fold thickness, and waist-to-hip ratio. For example, a man 5 ‘10” would be considered overweight at 175 pounds and obese at 210 pounds. A woman 5’4” would be considered overweight at 145 pounds and obese at 175 pounds.
Being overweight is not simply a matter of aesthetics. The growing girth of Americans is a major health concern. The Harvard School of Public Health has summarized a number of studies of the effects of obesity. Among the findings are that women with a BMI of 35 or higher have a risk of developing type 2 diabetes that is 93 times higher than women with BMI lower than 22, individuals who are overweight have a 32% higher risk of coronary artery disease compared to individuals with normal weight, and those who are obese have an 81% higher risk, and that being overweight and obese increases the risk of stroke by 22% and 64%, respectively (Harvard School of Public Health, n.d.). Obesity, of course, is more serious, causing an estimated 50–100% increase in premature deaths (estimated to be 300,000 deaths per year; Allison, Fontaine, Manson, Stevens, & VanItallie, 1999).
Despite this massive increase in overweight and obesity among the poor, federal feeding programs still operate under their nearly half-century-old objective of increasing food consumption. In 2012, the Department of Agriculture reported that SNAP “raises food expenditures and improves nutritional availability. Participants in SNAP spend more on food than they would in the absence of the program” (U.S. Department of Agriculture, 2012a, p. 1). Few experts are willing to say that federal feeding programs are making the poor fat, although the evidence points in that direction. But no expert thinks they do very much to fight this growing public health problem.
SNAP benefits work as intended, raising caloric consumption by as much as 10% more than if recipients were given cash. It’s like when you buy tickets for a set number of rides before entering an amusement park. The tendency is to buy more than one needs and, rather than return the unused ones for a refund, it is easier to take that one or two more rides before leaving. That’s of course why the parks sell them that way. The only difference is that unused food stamps can’t be turned in for cash. (The fact that people do not want to use all their food stamps for food helps explain why a black market has developed with them.)
A 2008 research synthesis by USDA economists found that some evidence that long-term receipt of SNAP benefits increased obesity in non-elderly adult women by between 4 and 10 percentage points, but they did not find any effects on obesity for other subgroups (Ver Ploeg & Ralson, 2008). However, these were econometric studies that, by their nature, have difficulty in controlling for selection effects or other factors that might affect obesity rates. On the other hand, we do know from more rigorous methods that SNAP benefits can lead to increased consumption.
In the early 1990s, the USDA commissioned two random assignment studies of the Food Stamp Program where some recipients were provided cash instead of food stamps. Peter Rossi summarized the findings of these studies: “The reductions in food expenditures were $0.18–0.28 for each dollar provided in the form of cash, compared with conventional food stamps.… These studies show that providing income in the form of food stamps leads to more food consumption than an equivalent dollar amount given in unearmarked form” (Rossi, 1998, pp. 36–37). This “cashing out” of food stamps did not result in unhealthy diets nor the mismanagement of family finances. Recipients continued to get well above the recommended dietary allowances for most nutrients (Carlson as cited in Fasciano, Hall, & Beebout, 1993).
It is unclear, however, what effect, if any, the 2002 adoption of the Electronic Benefit Transfer system has had on this behavior. Since the implementation of Electronic Benefit Transfer cards to all SNAP recipients in 2002, SNAP recipients have been allowed to rollover unspent benefits at the end of the month to the next month, which may have a dampening effect on overconsumption in a given month. Such savings, however, cannot be used for purchases of other goods, so it is likely that recipients spend the excess in future months. The failure to be clear about SNAP as a form of income support has removed the possibility of using this important program to address America’s dietary and obesity problems.
SNAP as the Primary U.S. Social Assistance Program
How should we think about the current SNAP’s role in maintaining this progress? It is most accurate to think of SNAP as a form of income assistance that allows recipients to purchase food. Thus, in its Budget and Economic Outlook reports, the Congressional Budget Office treats SNAP as an “income support” program along with TANF, the EITC, the Additional Child Tax Credit, SSI, and unemployment compensation (Congressional Budget Office, 2015). In fact, the Organization of Economic Cooperation and Development (OECD) classifies SNAP as the primary U.S. “social assistance” program and as the equivalent of other countries’ cash welfare programs. (It does not include TANF because of its narrow scope [Immervoll, 2009].)
SNAP acts indirectly to improve the nutrition and health of low-income Americans by enabling them to purchase and consume more food. Moreover, eligibility for SNAP now reaches to those with incomes high enough to afford an adequate diet—but often not the other necessities of contemporary American life. This does not make the program less socially valuable. As described below, especially since the passage of TANF, SNAP is the major safety-net program for those who have exhausted their UI benefits and have insufficient other income or assets.
Many program advocates, however, have chosen to leave this reality ambiguous—because they believe that it is only the prospect of hunger that is the reason for the program’s strong support among the public (Center on Budget and Policy Priorities, 2015). They could be correct, but the result is to stifle efforts to update the program to reflect developments in other means-tested government programs as well as economic and social conditions generally.
SNAP benefits now far outstrip TANF benefits (in average size and number of recipients), making SNAP (and its predecessor Food Stamp Program) the primary element of the U.S. income support system (Rosenbaum & Neuberger, 2005). This developed by historical happenstance—and the fact that 100% of SNAP benefits are paid for by the federal government (while they were shared under AFDC and are, essentially, a 100% state cost under TANF).
First, what started as a small federal nutrition program was expanded in the 1960s and 1970s because of apparent hunger in states that had low-benefit inadequate and racially discriminatory welfare systems. The federal Food Stamp Program essentially worked around this problem by ignoring state welfare agencies—a disconnect that continues 50 years later even as the initial reason disappeared.
Second, because SNAP would fill in between 30% and 45% of the difference, in the 1970s through 1990s, many states kept AFDC payments lower than they might otherwise have set them. For example, in 1991, California cut its cash assistance (AFDC) to reduce state spending on the poor by US$10.8 billion between 1991 and 1996. The state’s budget analysts, however, calculated that this reduction would trigger a US$4 billion rise in food stamp payments, so the net loss to the poor dropped to US$6.8 billion (Besharov & Baehler, 1993).
Third, again because the federal government paid program costs, there was a tendency to encourage low-income families to leave their time-limited TANF programs while continuing on the federal SNAP (and, when applicable, being transferred to federal disability programs). Pamela Loprest and Sheila Zedlewski of the Urban Institute used the National Survey of American Families to examine former recipients of cash welfare benefits who left the program but not for employment. They found that between 1997 and 2002, the percentage of these “welfare leavers” receiving food stamps increased from about 46% to about 55% (Loprest & Zedlewski, 2006).
Fourth, in the wake of the Great Recession, long-term unemployment was at an all-time high. (Even now, 31.5% of the unemployed have been jobless for 6 months or more [Bureau of Labor Statistics, 2015].) After their UI benefits expire, many unemployed turn to SNAP, especially given recent liberalizations. In 2012, Anderson, Kirlin, and Wiseman (2012) examined longitudinal UI and SNAP data in seven states and found evidence of this phenomenon.
Explaining Recent Increases in SNAP Caseloads
The recent sharp growth of the SNAP caseload began long before the Great Recession. It began under Republican President George W. Bush at a time when employment was in reasonably strong shape, although employment had not recovered from its prerecession levels. Between 2000 and 2013, SNAP spending grew from about US$20.6 billion to about US$79.9 billion (in 2014 dollars) and the SNAP caseload increased from 17.2 million individuals to about 47.6 million individuals (U.S. Department of Agriculture, 2015). (In 2014, as the economy improved, those numbers dropped to US$74.1 billion and 46.5 million individuals.) In comparison, during this same period, the number of individuals in poverty increased from 31.5 to 45.3 million. Since the start of the Great Recession in 2008, the number of SNAP recipients has increased by 68.7% between 2008 and 2013, even as the number of individuals in poverty increased by only 16.5% (U.S. Census Bureau, n.d.; U.S. Department of Agriculture, 2015).
Why have the caseloads and expenditures increased so much? Although a struggling economy and an increase in poverty certainly contribute to the increase in the enrollment of SNAP, statutory changes and local discretion that result in expanded eligibility and loosened criteria for determining eligibility have also been contributors. Here are some of the key changes in SNAP. (The figures below for number of households involved have not been corrected for likely duplication.)
Nullified assets tests. To meet SNAP asset requirements, a household must have less than US$2,000 in assets (US$3,000 for households with a disabled individual) and no more than one vehicle that must be worth less than US$4,650. (Houses, retirement accounts, and personal property are not counted as assets.) There are two exceptions to these rules. For vehicles, the Agricultural Appropriations Act of 2000 allows states to use the vehicle asset test of their TANF programs instead of the SNAP vehicle asset test (Super & Dean, 2001). As of November 2012, 34 states and DC exclude the value of all vehicles, and another 15 states exclude the value of one vehicle (U.S. Department of Agriculture, 2012c). For the more general asset test, under the categorical eligibility provisions issued by USDA regulations in 2000 (described below), states may use the asset tests in their TANF programs in place of the SNAP asset test. Thirty-six states exercise this option and do not have an asset test for SNAP recipients (Falk & Aussenberg, 2012).
Categorical eligibility to incomes of 200% of poverty. Categorical eligibility for SNAP was first introduced in the Food Security Act of 1985. Recipients of AFDC, SSI, and state general assistance programs were made eligible to receive food stamps by virtue of their being recipients of these other government programs. In 1996, when TANF replaced AFDC as the U.S. cash welfare program, TANF recipients were also given categorical eligibility. However, because TANF money could be used for more than just cash assistance, it was unclear who constituted a “TANF recipient.” In 2000, the USDA issued regulations regarding TANF categorical eligibility for SNAP that allows states the option of conferring categorical eligibility for SNAP on a TANF family if at least one member of the family receives or is authorized to receive TANF-funded cash assistance or “nonassistance” (defined as nonrecurrent lump sum benefits or services such as child care or transportation subsidies that allow states to help low-income families without starting the clock on TANF’s lifetime, 5-year limit on benefits). TANF nonassistance can go to families with incomes in excess of 185% of poverty or with assets greater than TANF’s general limit. As of January 2012, only five states restrict categorical eligibility to the receipt of cash assistance and five states restrict categorical eligibility to the receipt of cash assistance or specified nonassistance such as child care. The remaining 40 states and DC confer categorical eligibility through the receipt of either cash assistance or any nonassistance that is provided using TANF funds, including such minimal elements as pamphlets describing benefit programs. The SNAP regulations also impose a cap on income eligibility (200% of poverty) for SNAP categorical eligibility established by the receipt of TANF nonassistance under purposes three and four of TANF (to prevent and reduce the incidence of out-of-wedlock pregnancies or to encourage the formation and maintenance of two-parent families). The SNAP regulations do not impose an income eligibility cap for TANF purposes one and two (provide assistance to needy families and end dependence of needy families by promoting job preparation, work, and marriage), but all states that confer TANF through nonassistance have instituted one. As of July 2014, 27 states had gross income caps higher than 130% but not higher than 200% of poverty (Falk & Aussenberg, 2014). The Congressional Research Service estimated that, in 2011, about 5% of all SNAP households had income above 130% of poverty (Falk & Aussenberg, 2014). That is about 1.1 million households.
Verifying income eligibility only once a year. Prior to 2002, after eligibility was verified, all households were required to have their earnings recertified every 3 months. For households with earnings, states had the option of using “simplified reporting.” This meant that states could increase certification periods up to 1 year and households were only required to report an increase in earnings if it made them no longer eligible for food stamps. (Income was required to be reverified every 6 months.) The Farm Security and Rural Investment Act of 2002 (“2002 Farm Bill”) gave states the option to use simplified reporting for all SNAP households, not just those with earnings. As of November 2012 (the latest data available), all states except for California used simplified reporting (U.S. Department of Agriculture, 2012b). What impact do lengthening certification periods have on enrollment and program costs? Maria Hanratty of the University of Minnesota found that extending certification periods to 6 months and requiring food stamp recipients to report a change in income during the certification period only if it results in their income exceeding 130% of poverty led to a 9.2% increase in food stamp participation between 2001 and 2003 (using the 2001 panel of the Survey of Income and Program Participation; Hanratty, 2006).
Eligibility for noncitizens. The Personal Responsibility and Work Opportunity Reconciliation Act of 1996 made noncitizens ineligible to receive SNAP benefits. The 2002 Farm Bill restored eligibility to legal noncitizens who (1) have been in the United States for 5 years, (2) are under age 18, or (3) receive disability benefits (U.S. Department of Agriculture, 2011). In 2012, the USDA reported that about 1.2 million SNAP households (about 5% of all SNAP households) had a noncitizen that received benefits and another 1.3 million SNAP households (about 6% of all SNAP households) had citizen children receiving benefits living with a noncitizen, nonrecipient adult (Gray & Eslami, 2014).
Counting less income and allowing more deductions in calculating net income. To be eligible for SNAP, recipients must have gross income below 130% of the poverty line and net income below 100% of the poverty line. The gross income requirements are waived for recipients who are categorically eligible for SNAP benefits. Net income is calculated by taking gross income and subtracting a number of deductions: a standard deduction (for “basic unavoidable costs”), a 20% earnings deduction, a dependent care deduction, a child support deduction for recipients paying child support, a shelter deduction, and a medical expenses deduction for the elderly or disabled. The 2002 and 2008 Farm Bills (officially the “Food, Conservation, and Energy Act of 2008”) increased the amount of the standard deduction, removed the cap of the dependent care deduction, and allowed states to not require recipients to report changes in their deductions until their next recertification (U.S. Department of Agriculture, n.d.b; & Rosenbaum, 2008). In 2012, the USDA reported that SNAP recipients with earned income had an average monthly gross income of US$1,203, but net incomes of only US$556, a difference of US$694 dollars (Gray & Eslami, 2014). This has the effect of increasing the number of eligible households and incentivizing eligible non-recipient households to enroll to take advantage of higher benefits.
Increasing the amount of benefits. The 2008 Farm Bill increased the minimum monthly SNAP benefits from US$10 a month to “8 percent of the thrifty food plan for a household of one” for one- and two-person households (about US$16 a month in 2012; Rosenbaum, 2008, p. 2). The 2009 American Recovery and Reinvestment Act (ARRA) increased the maximum benefit amount for each size of SNAP household by another 13.6% (Nord & Prell, 2011). These increases may have contributed to the increase in the take-up rate of SNAP benefit because it substantially increased the amount of SNAP benefits for eligible households with earnings for whom the initial benefit otherwise would have represented a negligible increase in their income. According to a USDA report, the percentage of eligible individuals receiving SNAP increased from 54.1% in 2002 to 70.8% in 2012 (Gray & Eslami, 2014). The maximum benefit increase, however, was designed to be temporary. The maximum SNAP benefit is based on the Thrifty Food Plan, which is increased annually to account for inflation in food prices. The ARRA legislation, however, held the new maximum benefit constant between 2009 and 2013, when it was projected that inflation would have increased the value of the Thrifty Food Plan to the maximum benefit level. However, inflation was less than expected during this period and when the temporary maximum benefit expired, the maximum benefit declined by about 5% (Dean & Rosenbaum, 2013).
Waived work requirements for able-bodied adults without dependents (ABAWDs). ARRA also waived the work requirement for SNAP recipients who are ABAWDs that they must work at least 20 hours per week, be enrolled in a job training program for 20 hours a week, or participate in workfare. States were able to extend this waiver after the initial waiver expired in 2010. Currently, 28 states plus DC have waived work requirements for ABAWDs in 2015 (Aussenberg, 2014). In 2012, the Congressional Research Service estimated that between 2007 and 2010, the number of ABAWDs increased from 1.7 million to 3.9 million (Congressional Research Service, 2012).
Five months of transitional benefits regardless of income. TANF recipients who are leaving welfare for work are eligible to receive “transitional SNAP benefits” even if they no longer meet the income requirements. The amount of their benefits is based on the amount they received (or would have received) in their final month of TANF, adjusted for the loss in TANF income (U.S. House of Representatives, 2008). The 2002 Farm Bill extended the number of months of transitional SNAP benefits from 3 to 5.
Ignoring the income of others in the household. A SNAP household is defined as “a group of individuals who live together and customarily purchase food and prepare meals together for home consumption.” (Food Stamp Act of 1977, 2004, p. 4). At least some states (and perhaps most), however, have implemented the definition in a way that allows for broader eligibility. In Massachusetts, for example, SNAP applicants self-report their household composition and state agency verification of household composition is only required if there is something “questionable” about the reported household composition. Massachusetts also does not require that the households store food separately from others who live in the house or that they use separate cooking facilities (Baker, Harris, Gallant, Hahn, & Newberg, 2012). In many instances, income-eligibility determinations are based on the subfamily income and not that of the entire household (which could be much higher because it can include the income of relatives and cohabitors). The WIC program has a similar problem and, in a 2009 report on this program, Besharov and Call estimated that the failure to count all of the household’s income could, by itself, have expanded the WIC caseload by about 20% (Besharov & Call, 2009).
Work Disincentives
One of the most distressing trends of recent years has been the decline in U.S. labor force participation.
Less job seeking
As of January 2015, the U.S. labor force participation rate was only about 72.7% (compared to its high of 77.4% in 1997; OECD, 2014). About 6 million working age, Americans (2.5%) did not have a job and were not looking for one (even as they said they wanted one). That takes them out of the “labor force,” and, hence, not officially “unemployed.” (“Unemployment” is defined by the federal government as being without a job and also looking for one.) Federal Reserve Chairman Janet Yellen has called this “shadow unemployment” (Graver, 2014). (See Figure 2, showing participation in the labor force of working-age adults.)

U.S. employment indicators. (Organization for Economic Cooperation and Development, 2014).
Another 49.2 million Americans of working age were not actively looking for a job and, when surveyed, said they did not want a job. (They answered “no” to “Have you looked for a job in the past 4 weeks?” and “Do you currently want a job?”). They explained that they were disabled or ill, enrolled in school, retired, or taking care of the house or others.
Some of the declines in employment among working-age Americans reflect underlying demographic trends. At one end of the working age spectrum, higher percentages of young people are choosing postsecondary education (colleges, community colleges, and specialized job training programs) instead of immediate employment, and, at the other end, an aging baby boom generation is predictably accelerating its exit from the labor market. (At the same time, there are more elderly who are working full-time than in the past, presumably because of the asset losses they experienced during the Great Recession. In fact, between 2000 and 2013, the entire increase in the number of individuals in full-time employment has been because of the increase among elderly, those aged 65 and older, who are working full time [OECD, 2014].)
A Council of Economic Advisors report estimates the impact of these demographic factors to be only about 51% of the decline in the labor force participation among all workers (not just working age; Council of Economic Advisors, 2014), but, given data limitations, the true number is probably lower.
No one knows how many of the 49.2 million Americans not in the labor force thought they could not get a job or were well-enough off from other sources income (perhaps supplemented with safety-net benefits). But given the dearth of good-enough-paying jobs, a sense of palpable discouragement pervades the nation. Many of the long-term jobless feel left behind by what appear to be permanent changes in the economy and have all but given up. It is difficult to exaggerate the impact of repeated failed job searches. In a 2014 nationwide poll by Express Employment Professionals, an employment staffing company, 47% of the unemployed agreed with the statement: “I’ve completely given up looking for a job” (Express Employment Professionals, 2014, p. 2).
Worse, the problem seems to be feeding on itself. Many employers have apparently decided that the long-term jobless would not make good employees—because of their attitude, skills, or just plain age (Ghayad, 2014). Barring a major increase in demand for American workers—or some change in their willingness to accept lower-wage employment, many of the long-term jobless may never get back to work.
Those directly affected by this weak labor market have paid a high price in lost earnings and emotional stress and continue to do so. But this high level of nonwork is also an obstacle to the economy’s long-term recovery. On June 6, 2014, a Washington Post lead editorial worried: Declining labor-force participation may be a new characteristic of the postrecession U.S. economy, and it bodes ill for two reasons: The economy’s capacity for growth depends on robust use of all available factors of production, the minds and hands of U.S. workers very much included; indeed, the surge of women into the workforce was one of the key drivers of economic expansion in the 1980s and 1990s. Declining labor-force participation implies a rising “dependency ratio” of workers to recipients of social assistance.
Moreover, as the same Washington Post editorial suggests, the billions more now being spent on means-tested, safety-net benefits are not available for other pressing societal needs. Consider this very rudimentarily calculated example: If the percentage of U.S. households receiving SNAP had remained the same between 2008 and 2013 (about 10.7%), spending on SNAP benefits would have been about US$122 billion lower than the actual amount spent during this 5-year period, adjusting the base to reflect the increase in poverty still leaves a whopping US$93 billion (U.S. Department of Agriculture, 2002–2014). (Of course, some of this money might be spent on less worthy causes or not at all because other programs might not enjoy the same level of political support.)
Long-term trends
There is a tendency to blame the labor market’s weaknesses on the economic shocks surrounding the recent financial crisis and subsequent recession. Many experts, however, think that our current problems have much deeper roots—reflecting long-term, if less noticed, trends. Major elements of the labor market never recovered from the 2001 recession (that is why it was called the “jobless recovery”), and actually, some underlying conditions have been festering for decades. As President Obama, in his 2009 State of the Union address, pointed out, “The fact is, our economy did not fall into decline overnight. Nor did all of our problems begin when the housing market collapsed or the stock market sank” (Obama, 2009, p. 1).
For example, the labor force participation of less-educated men (both White and Black) has been steadily declining since at least the 1970s. Between 1970 and 2000, for example, the labor force participation of men with a high school diploma declined from 96.3% to 86.2% (and fell to 79.2% in 2012). In the same period, for men without a high school diploma, labor force participation rate declined from 89.3% to 74.9% (and declined to 69.7% in 2012). Many went onto disability programs after they left the labor force (Juhn & Potter, 2006). (The enormity of this decline was obscured because total labor force participation rose as a result of the massive entry of women into the labor force.)
The main reasons for the labor market’s long-term weakness are well accepted: Global competition from lower-wage and better-managed workers in the developing world (especially as U.S. workers seem to be losing their skills advantage) aggravated by automation (which for the first time may actually reduce total jobs in the economy, at least good ones). Most experts also agree that the main remedies are related: a stronger economy and, to a lesser extent, a better trained U.S. workforce and a more competitive position in world trade (e.g., by lowering formal and informal trade barriers).
Research on work disincentives
At least since the income maintenance experiments of the 1960s and 1970s, when a guaranteed income appeared to decrease work and increase divorce (at least among some groups; Munnell, 1986), the role of safety-net benefits as work disincentives has been heavily researched. Almost all serious scholars have concluded that they can reduce labor force participation, but with sharp disagreement about how much they do so. For example, in a 1991 study for the University of Wisconsin Institute on Poverty, Robert Moffitt estimated that every dollar transferred to female-headed households under the old AFDC program reduced the mother’s work effort by 37 cents (Moffitt, 1991; see also Ek, 2013; Katz & Meyer, 1990; but, see also Moffitt, 2015). Researchers have attributed at least part of the falling labor force participation rates for all men, and especially those with less education, to their declining employment prospects combined with the relative availability of disability benefits (Juhn & Potter, 2006).
The work discouraging effect of safety-net programs should be neither surprising nor controversial. Their very purpose is to make getting a new job less urgent. They are supposed to soften the financial hardships of unemployment and, thus, to give the unemployed time to find a good job. This is unquestionably a valid societal goal, but at some point, safety-net benefits can become large enough to make working seem not worthwhile to large numbers of people, at least not right away. The question is usually not whether the unemployed will earn as much as their benefits, but, rather, whether they will earn enough more than their benefits to justify working (taking into account, on the one hand, the possibility of advancement and, on the other, of working off the books.)
There is sharp disagreement, however, about the size of these effects and whether corrective action is needed or even possible—partly because so much depends on the specifics of the study. At one extreme, Casey Mulligan, an economist at University of Chicago, has written: I found that, among the 23 million layoffs experienced by non-elderly American household heads and spouses during 2009 and the second half of 2008, at least 4 million of them resulted in job acceptance penalty rates near or above 100 percent… meaning that they could be (and perhaps were) laid off with little or no short-term reduction in their disposable income even if they had to compensate their employer for the UI payroll tax liabilities associated with the layoff as a consequence of “experience-rated” UI financing. The large majority of these workers were in that situation because of the safety net rule changes implemented by the ARRA. (Mulligan, 2013, pp. 7–8)
The Absence of SNAP Work Requirements
As described above, states are financially and politically rewarded when they move people off UI and TANF (programs with at least some activation requirements) and on to SNAP. This incentive was not created deliberately, but, rather, is a historic accident of how and when the programs were established.
The SNAP does have some work requirements. (“With some exceptions, able-bodied adults between 16 and 60 years must register for work, accept suitable employment, and take part in an employment and training program to which they are referred by the SNAP office. Failure to comply with these requirements can result in disqualification from the program.” U.S. Department of Agriculture, 2012b, p. 4) However, as Ron Haskins of the Brookings Institution and others have noted, “These requirements do not seem to be rigorously enforced” (Haskins, 2012, p. 12). The absence of meaningful job search or work-related activity requirements in SNAP can undermine UI and TANF work requirements—because SNAP benefits rise if UI or TANF is terminated or reduced. If the average UI recipient (in a three-person household) loses benefits, monthly SNAP benefits rise from about US$180 to about US$530. If the average TANF recipient (in a three-person household) loses benefits (about US$430 a month), then monthly SNAP benefits rise from about US$400 to about US$530 a month.
It is possible to correct this problem. In April 2014, the University of Maryland and the Secretary’s Innovation Group, with the assistance of the American Public Human Services Association, cosponsored a one-day meeting on how to implement the SNAP pilots authorized in the 2014 Farm Bill in a way that will reduce dependency and increase work levels. Seven state human services secretaries attended the meeting as well as about six senior professional Congressional staff and about five senior administration officials. Through the associated webinar, senior state officials from 13 other states participated (University of Maryland School of Public Policy, 2014).
These pilots, the product of an awkward political compromise, may well point the way to meaningful reform. The problem, however, goes deeper. Although the states administer the SNAP, pay one half of its administrative costs, and essentially decide who will receive benefits, they do not pay for any of the benefit costs. Those are covered entirely by the federal government. Hence, the states have no incentive to reduce SNAP caseloads and in fact, as described above, have an incentive to shift recipients from their state-funded TANF programs to the federally funded SNAP, while keeping the resulting savings and enjoying the political benefit of a reduced cash welfare caseload. In contrast, because states can keep the money that they save in TANF, they are more cautious with spending and focus on limiting the growth of the caseload.
Real reform probably requires that the states be made financial partners of the federal government. States should have a more direct financial stake in the proper governance of SNAPs, including eligibility determinations. Given that all program funds come from the federal government, a substantial liberalization of eligibility determinations was predictable. State officials have little reason to be cost conscious—as long as program funds seem available. And they have even less reason to take on “street-level bureaucrats” and the vast discretion they enjoy (Lipsky, 1980). As in the case of many of other federal, means-tested programs, states should be required to pay a portion of SNAP’s costs, so that they would have a stake in enforcing eligibility rules. (Properly structured, this would make it possible to give states the flexibility to shift how they spend funds—to spend less on expanding enrollment and more on enhancing services for current recipients, such as spending more time on job training, job seeking, and, yes, nutritional counseling.)
International Comparisons
Starting in the 1970s, many European countries experienced similarly worrisome declines in employment and labor force participation. Across the original 15 members of the European Union (EU-15: Austria, Belgium, Denmark, Finland, France, Germany, Greece, Ireland, Italy, Luxembourg, the Netherlands, Portugal, Spain, Sweden, and the United Kingdom), between 1970 and 1982, the percentage of the population employed fell from 61% to 57.8% (before beginning a slow increase). For men, the decline was much longer and steeper, from 83.7% in 1970 to 70.5% in 1994 (OECD, 2014). Overall, labor force participation increased during this period, but only because more women were entering the labor force. At the same time, in most countries, new highs were reached in the percentage of the population receiving government benefits from unemployment, disability, and social assistance programs.
In response, a growing number of developed countries introduced policy reforms aimed at “activating” the recipients of safety net benefits who might be able to work, that is, requiring them to perform work-related activities while receiving benefits. (The U.S. welfare reforms of the 1990s were an early part of this movement, but since then, some other developed countries have made more fundamental reforms to their labor activation policies.) Since the 1990s, one country after another has modified its safety net programs, as described in this policy brief. The countries that made the most extensive changes are Australia, Denmark, Germany, the Netherlands, the United Kingdom, and to a lesser extent, Finland, France, Japan, Norway, and Sweden. These countries made both substantive changes (tightening eligibility, limiting the duration of benefit receipt, and mandating job search and other work-first activities) and administrative changes (consolidating programs, decentralizing authority, outsourcing services, and incentivizing systems of financing and reimbursement). The key aspects of the changes in Europe can be summarized under three overarching themes:
Synchronizing benefits across safety-net programs to facilitate seamless benefit receipt over time as well as activation efforts, so that, as individuals were time-limited off UI and disability programs, they were transitioned to cash welfare or subsistence programs;
Encouraging work by embedding coordinated activation requirements, phase outs and time limits on benefits (before transfers to other programs), and workforce development services in most major safety-net programs and when possible, by reducing high-marginal tax rates and other disincentives to work; and
Decentralizing authority while strengthening accountability in order to facilitate programmatic innovation and experimentation within ongoing performance measurement systems, often operated using performance-based funding mechanisms.
Few of these changes have been rigorously evaluated. Although no one can say that they have successfully lowered long-term recipiency and increased labor force participation, the evidence from similar policies adopted in the past indicates that if, implemented well, they have the potential to do so (see, e.g., Grubb, 2011 and Tatsiramos & Van Ours, 2011). According to a World Bank report on labor activation programs, “One conclusion from a review of existing evidence is that well-designed policies can have a positive impact on employment outcomes for participants, but that many existing policies have in fact failed to prove effective or cost efficient” (Immervoll, 2012, p. 8). Moreover, the changes seem to enjoy reasonable political acceptance from the left and right. If not initially, over time. And they seem to have maintained the essentials of that nation’s safety net.
Hence, it is worthwhile to review what these countries have done to adjust their safety nets to encourage labor force participation at a time of high joblessness. It is not that their programs should be simply transplanted here. There are surely too many economic, social, and political differences for that to be possible, let along make sense. But just as certainly, the general approaches they adopted are worthy of consideration.
Our focus in the United States should be on rationalizing interactions among our patchwork of safety-net programs—TANF, SNAP, UI, and disability—which too often create a work disincentive for low skilled or difficult to employ citizens. A possible solution is to combine—or at least align—the administration of these programs and to add what the Europeans call “labor activation” (akin to job search requirements) to all recipients of government assistance.
Footnotes
Declaration of Conflicting Interests
The author declared no potential conflicts of interest with respect to the research, authorship, and/or publication of this article.
Funding
The author disclosed receipt of the following financial support for the research, authorship, and/or publication of this article: This article was partially funded by the Smith Richardson Foundation.