
Abstract
Purpose:
Substance use disorders (SUDs) are on the rise, particularly concerning opioids, and existing services are still not adequately meeting treatment needs. Most treatment dropouts occur within the first few weeks of treatment, indicating health improvement is likely not occurring. In this study, a clinical dashboard tool has shown promising utility with increasing retention in SUD treatment.
Method:
This pilot study was designed to measure the effects of implementing a performance-based practice clinical dashboard tool and having a process for monitoring patients’ recovery in a Midwestern SUD treatment center.
Results:
The results demonstrated the efficacy of a clinical dashboard tool that complements therapists’ monitoring and measuring of their patients’ performance.
Discussion:
Results support a building knowledge base about the impact of real-time, evidence-based tools on the retention and support of clients seeking SUD treatment.
Addiction in the United States
An opioid overdose crisis exists in the United States, and the illness of opioid use disorder has become an epidemic in the United States with more than 200,000 cases reported annually. About 3.8 million people aged 12 and above reported having misused a prescription pain medication in 2015. Of these, within 1 year, 2.0 million people acquired a disorder of opioid use or dependence (in accordance with disorders listed in the Diagnostic and Statistical Manual of Mental Disorders, fourth edition). In 2015, over 5 million Americans (1.9% of persons in the United States aged 12 or above) were estimated to have used heroin at some point in their lives (National Academies of Science, 2019). Consequently, heroin-related overdose death is also on the rise with nearly 13,000 reported in 2015, and more than 72,000 Americans reportedly died from a drug overdose in 2017 (Scholl et al., 2018).
Substance use disorder (SUD)—broadly applied to the use of opioid, alcohol, tobacco, cannabis, hallucinogens, inhalants, sedatives, and stimulants—is a major threat to the nation. Nearly one third of all American adults have SUD at some point in their lives. Tens of thousands die because of SUD each year, and the associated health care costs in the United States soars to over US$200 billion annually (Bouchery et al., 2011; Davenport et al., 2019). Currently, a great need exists for SUD treatment in the United States (Johnson et al., 2020). Unfortunately, over 70% of people who seek professional help do not receive an adequate dose of treatment, and they drop out of services within a few weeks after admission (Patterson Silver Wolf et al., 2019).
Retention in SUD Treatment
To meet the challenges of SUD, which is a chronic illness, treatment should be based on the best, most up-to-date science. Treating individuals who have SUDs requires a planned, measurable sequence of events that lead to the prevention or reduction of harmful use and the improvement of biopsychosocial functioning (Walker, 2009). A wide array of treatment designs and many treatment durations are used to accomplish this difficult but important task (Kleber et al., 2007).
Regardless of any treatment configuration, treatment retention and completion have been continually shown to significantly improve health and wellness outcomes (Dalsbø et al., 2010). Regrettably, patients who have a SUD drop out much sooner in the treatment process compared to general psychotherapy patients (Howard et al., 1986; Szafranski et al., 2019). With about 50% of dropouts occurring in the first 2 weeks of SUD treatment (Patterson Silver Wolf, 2008; Stark, 1992), and with only about 20% remaining until a successful discharge (Patterson Silver Wolf et al., 2019), patients are receiving insufficient exposure to treatment and are not recovering from their illness.
Our historical literature has established that patients leaving SUD treatment before the 3-month mark show no significant health improvements (Brorson et al., 2013; Eaton, 2004; Hawkins et al., 2008). Focusing treatment resources toward—and specifically targeting—patient retention has critical, wide-ranging ramifications. Without a planned, purposeful effort to address treatment retention rates, SUD treatment agencies will continue to fall short of appropriately treating this chronic illness, and individuals will continue to suffer from their untreated illness.
How Clinical Dashboards Can Improve Patient Treatment Retention
Most of the 1.6 million professional therapists in the United States who offer relief services in SUD treatment facilities rely on their judgment and intuition rather than basing their decisions on scientific data and substantive evidence (Patterson Silver Wolf et al., 2018; Ramsey et al., 2017). Clinical practices without any real-time patient performance outcome data is intuition-based treatment (Lambert, 2010). Further, clinical practitioners are not well equipped to readily access patient performance data. Prior work has demonstrated that formal instruments are too lengthy or take too much time to conduct (Duncan & Miller, 2000). Even when therapists do collect useful patient health data and enter the data into electronic health record (EHR) systems, these vital data largely remain inaccessible to clinical practitioners as there are little technology resources to help clinicians extract these data leaving them in EHR data coffins. Ultimately, therapists are not likely to use any instrument or data-tracking system that takes longer than 5 min to complete, score, and interpret (Lambert, 2010; S. D. Miller et al., 2006). To address these issues, technologies such as clinical dashboards can be implemented to retrieve and display key patient health indicators quickly, in a visual format that is easy to digest, potentially improving clinical evaluation and decision making.
Dashboards are tools that display graphs at a glance in a visual pleasing and usable format. Dashboards originated in the business sector to integrate and extract key performance indicators (Pauwels et al., 2009). Research has demonstrated significant improvements in both retention and client outcomes when clinicians receive formal, real-time, real-world feedback from their clients (S. D. Miller et al., 2006; Reese et al., 2009). Clients whose therapists had access to data on their treatment progression were less likely to deteriorate, more likely to stay longer in treatment, and were two times as likely to achieve clinically significant changes (Whipple et al., 2003). Technology such as dashboards can help provide this necessary support and training for clinicians (Quanbeck et al., 2014) thus improving client retention and completion outcomes.
In a recent review conducted on the impact of dashboard use, researchers found an association with improved care processes and outcomes for patients (Dowding et al., 2015). In hospital-based care, higher levels of information automation are associated with lower mortality rates, lower rates of complications, and lower overall costs (Amarasingham et al., 2009). For every 10-point increase in information automation, fatal hospitalizations decreased by 15% (US$56.3 billion), risk of complications fell by 16% (US$60.1 billion), and savings on hospital admissions grew by US$116.4 billion (Pauwels et al., 2009). While hospital-based care research demonstrates significant benefits of technology, research investigating addiction treatment retention and completion outcomes with clinical dashboards is still emerging (Patterson Silver Wolf, 2018; Voelker, 2019). This study seeks to address this gap in the literature.
Purpose
The evolution of clinical dashboards has produced positive clinical outcomes; however, our current knowledge remains incomplete because of their limited use outside of medical/hospital environments. Clinical dashboards can provide pertinent patient information in a timely manner and improve decision making and quality of care (Amarasingham et al., 2009). The key to having effective dashboards is to populate them with essential, real-time, real-world recovery data. These data can result in actionable interventions to address the problem of high treatment dropout rates.
In this pilot project, we propose to explore the potential effects of implementing a clinical dashboard tool and the effect of implementing a process for monitoring patients’ recovery processes on successful SUD treatment completion outcomes. We propose to design and develop cutting-edge technologies that will gather real-world, in the moment patient information and that will organize and display on a clinical dashboard where therapists can see and make judicious and personalized treatment decisions. We hypothesize that the incorporation of this tool will enable a better understanding of and more effective models of caseload monitoring, thereby improving patient care, treatment retention, and successful completion.
Method
Business and Treatment Collaboration
The pilot study was led by Takoda (2018), a private technology business located in St. Louis, MO. Takoda’s mission is to create SUD technology developed from academic findings and knowledge gained from real-world SUD services. Its eight-member multidisciplinary team consists of academic researchers, behavioral health treatment professionals, software engineers, data scientists, and human-centered designers.
Members also have interdisciplinary expertise. A trained professional programmer has been a frontline SUD therapist before, and two of the team members have experience as patients themselves, receiving treatments in the past and sustaining long-term recovery from SUDs. Takoda has developed several technology tools for SUD treatment, including the stand-alone clinical dashboard tool tested for this project.
Pilot Testing Site
A large, multistate addiction program served as the site of the project, with this particular study taking place in St. Louis, MO. This specific location serves over 1,200 patients annually in its outpatient program. Frontline therapists are responsible for the treatment plans and overall care of patients and maintain a caseload of approximately 75 patients. Along with standard individual and group therapy, the treatment facility also provides ancillary services including peer and community support specialists, employment supports, and medications that assist treatment.
Therapist Training and Onboarding
All therapists working at one SUD outpatient treatment location were introduced and trained to use the clinical dashboard tool during an hour-long training session. During the first 30 min, Takoda staff led therapists through a workshop to qualitatively discuss how they currently monitored patient recovery progress. As therapist caseloads are large, the team asked therapists how they monitored the basic treatment performance of their patients. Therapists were asked simple but vital questions pertaining to caseload profile and treatment performance. The questions are as follows: What is the percentage of successful treatment completion for your caseload and/or this clinic? Who does better (i.e., completes with staff approval) on your caseload by age, race, and gender? What percentage of patients on your caseload stopped attending after 5 days? and What percentage of patients on your current caseload are making quantifiable progress toward meeting their treatment goals?
Therapists gave a variety of answers to questions, with no therapist able to show any real-time data on the performance of their current or closed patient caseloads. The purpose of the exercise was to expose the lack of any data guiding clinical services and reveal that therapist use their own intuitions in measuring patient’s treatment progression through outpatient treatment.
During the second 30 min, Takoda staff demonstrated how to enter patients into the tool, log patient sessions, edit patient details, and analyze the performance displays. Takoda emphasized that this software was under development and that therapists should readily submit feedback and report issues they counter. The feedback would be utilized to shape the growth of the technology.
Regular Dine and Dashboard Meetings
Over the next 3 months, Takoda staff held hour-long, bimonthly meetings on-site at the treatment facility with all therapists. At the beginning of every meeting, to inform product development and technology support, therapists were asked to fill out an evaluation of system usability, willingness to use, and perceived level of usefulness. The results were used by the lead designer to measure receptiveness to new features or modifications introduced to the system since the previous meeting.
Additionally, to show therapists how well their overall staff adopted new technologies, Takoda staff prepared usage graphs to display statistics. The staff members were anonymized with numerical IDs so as not to cause negative associations with therapists who were not readily adopting the platform. The purpose of sharing these data was to demonstrate the therapists’ overall willingness to engage with the dashboard and to encourage usage by giving therapists a sense of progression toward a goal of entering the majority of their patient caseload and patient sessions into the platform.
Finally, Takoda staff conducted unique usability workshop activities to determine what new ideas therapists had for the platform and what pain points they faced in their regular workflows that the dashboard could help alleviate. Because of Takoda’s limited capacity to develop many of the more transformative ideas, they were archived for later discussion.
Key Indicators Displayed on Clinical Dashboard
The clinical dashboard is based on mixed-methods data collected from frontline therapists, leaders, and patients. The development team consists of the Takoda team and an academic researcher. Every therapist was given a dashboard that displayed their own caseload. The main goal of the tool was to replace therapist’s intuition with real, quantifiable data. The dashboard has four screens that simultaneously display key indicators of patient data. The first screen shows active caseload patient demographics. Because therapists are unable to see, at a glance, basic patient data, this first screen allowed therapists to monitor their caseload by race, age, gender, and other treatment performance outcomes such as number of days in treatment, last sessions attended, and other graphs to use when measuring treatment plan performance.
The second screen displays metrics from a set of questions asked in regular one-on-one counseling sessions. The questions are tied to Dimensions That Support a Life in Recovery by Substance Abuse and Mental Health Services (Strashny, 2013). They are related to the following: health, overcoming or managing one’s disease(s) or symptoms; home, a stable and safe place to live; purpose, meaningful daily activities; and community, relationships, and social networks that provide support, friendship, love, and hope (SAMHSA, 2012). The third screen shows treatment plan information on medication, short- and long-term goals, interventions used, specific services administered, and other supporting services engaged.
The clinical dashboard was designed for therapists to use it to track verbal and behavioral signs that demonstrate patients’ progress, or lack thereof, within the dimensions that support a life in recovery. The graphical representation of the patients’ progress will also be used in direct discussions with patients to mutually decide which dimensions need more effort.
Primary Outcome Measure
We chose to measure successful discharge percentage because it is a reliable quantitative measure and is decided by clinical staff rather than by individual therapists. Successful discharge is defined as “discharged with staff approval,” which means the patient, clinical team, and supervisor concurred that the patient had made significant progress toward recovery and met treatment plan goals. Although the Takoda technology system tracked discharge reasons, this project worked with the clinic’s administration to check Takoda’s data with their EHR, ensuring reliable data for analysis. The clinic’s administration provided deidentified, aggregated data for a 12-month period describing the clinic’s discharge outcomes. Regarding human subject protection, this study met the criteria for exemption as it was not research with human subjects, and all data were deidentified and aggregated to include only the number of successful and unsuccessful discharges each month.
Hypothesis
Results
The project officially trained and onboarded therapists using the dashboard tool in March 2019. During the project period, the clinic discharged a total of 1,337 patients. In Table 1, the breakdown of monthly discharge outcomes is presented. Discharge data were collected from the EHR system beginning in September 1, 2018, until August 9, 2019. In the first 6 months before implementing the new tool and practice protocol (deemed the control period), the percentage of discharge with staff approval hovered around 11%. We hypothesized that after the implementation of the dashboard, percentages of successful discharges will increase. During the 6 months of dashboard tool usage and new monitoring practices, the successful discharge rate doubled to more than 27% (Figure 1). Based on this increase in successful discharge percentages, we conclude that our hypothesis was supported.
Discharge Overview by Month.
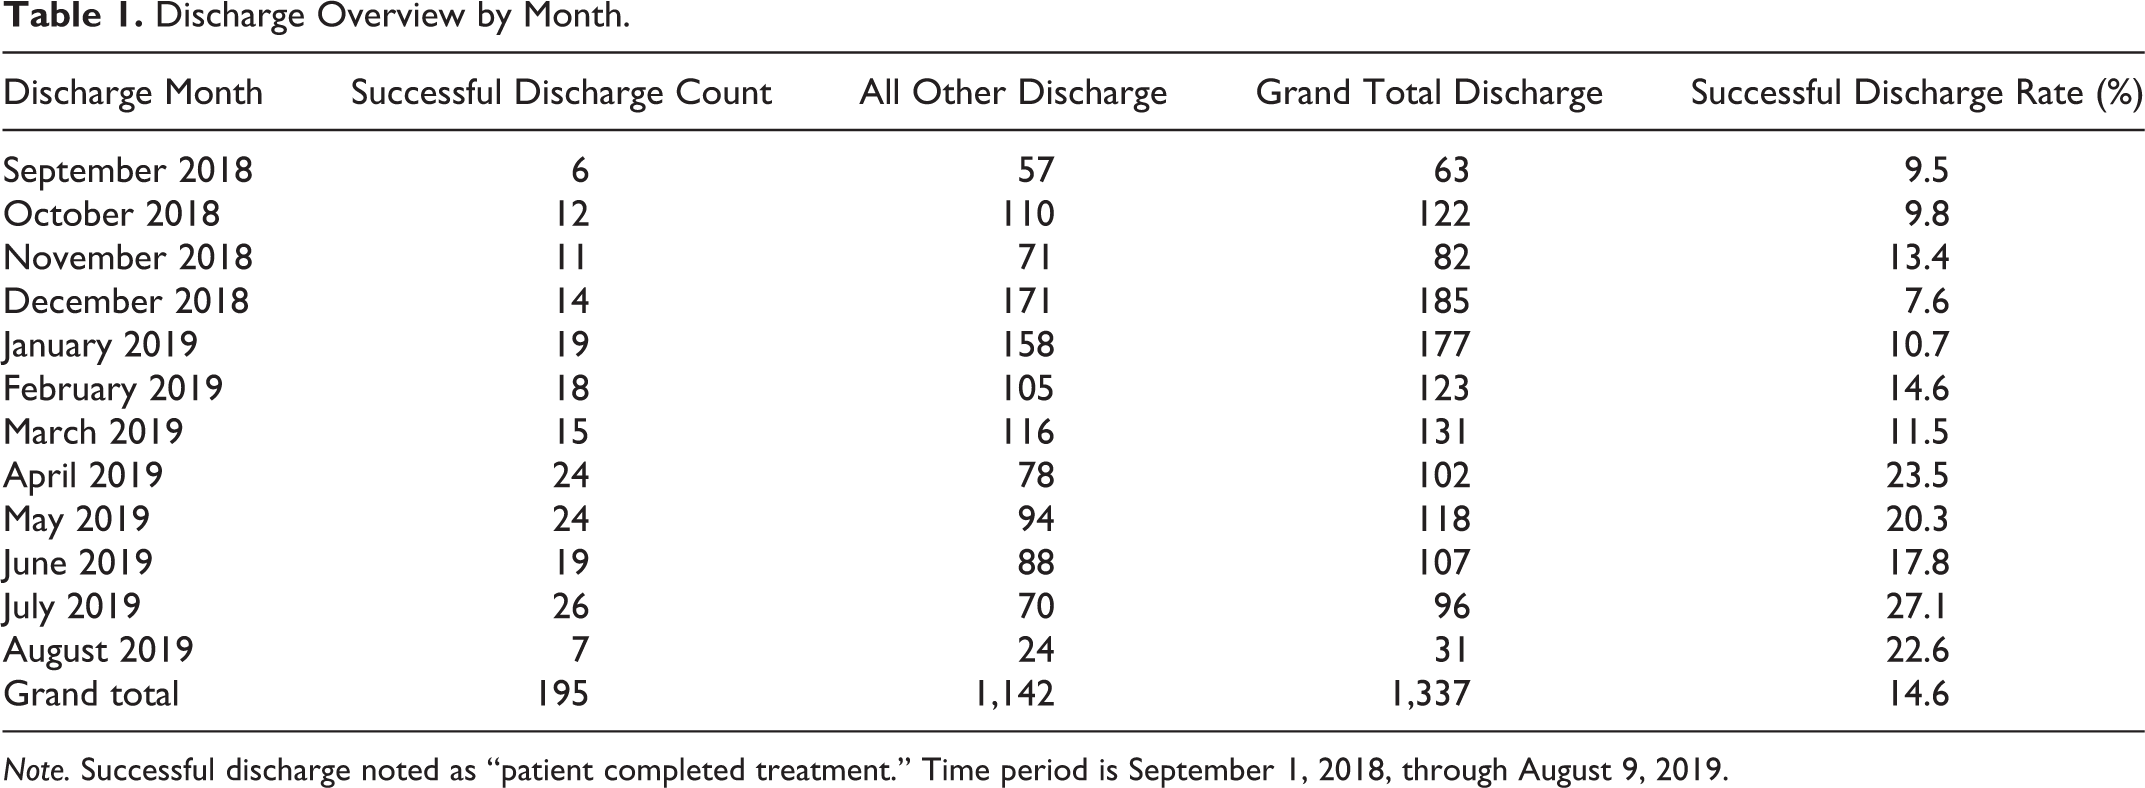
Note. Successful discharge noted as “patient completed treatment.” Time period is September 1, 2018, through August 9, 2019.
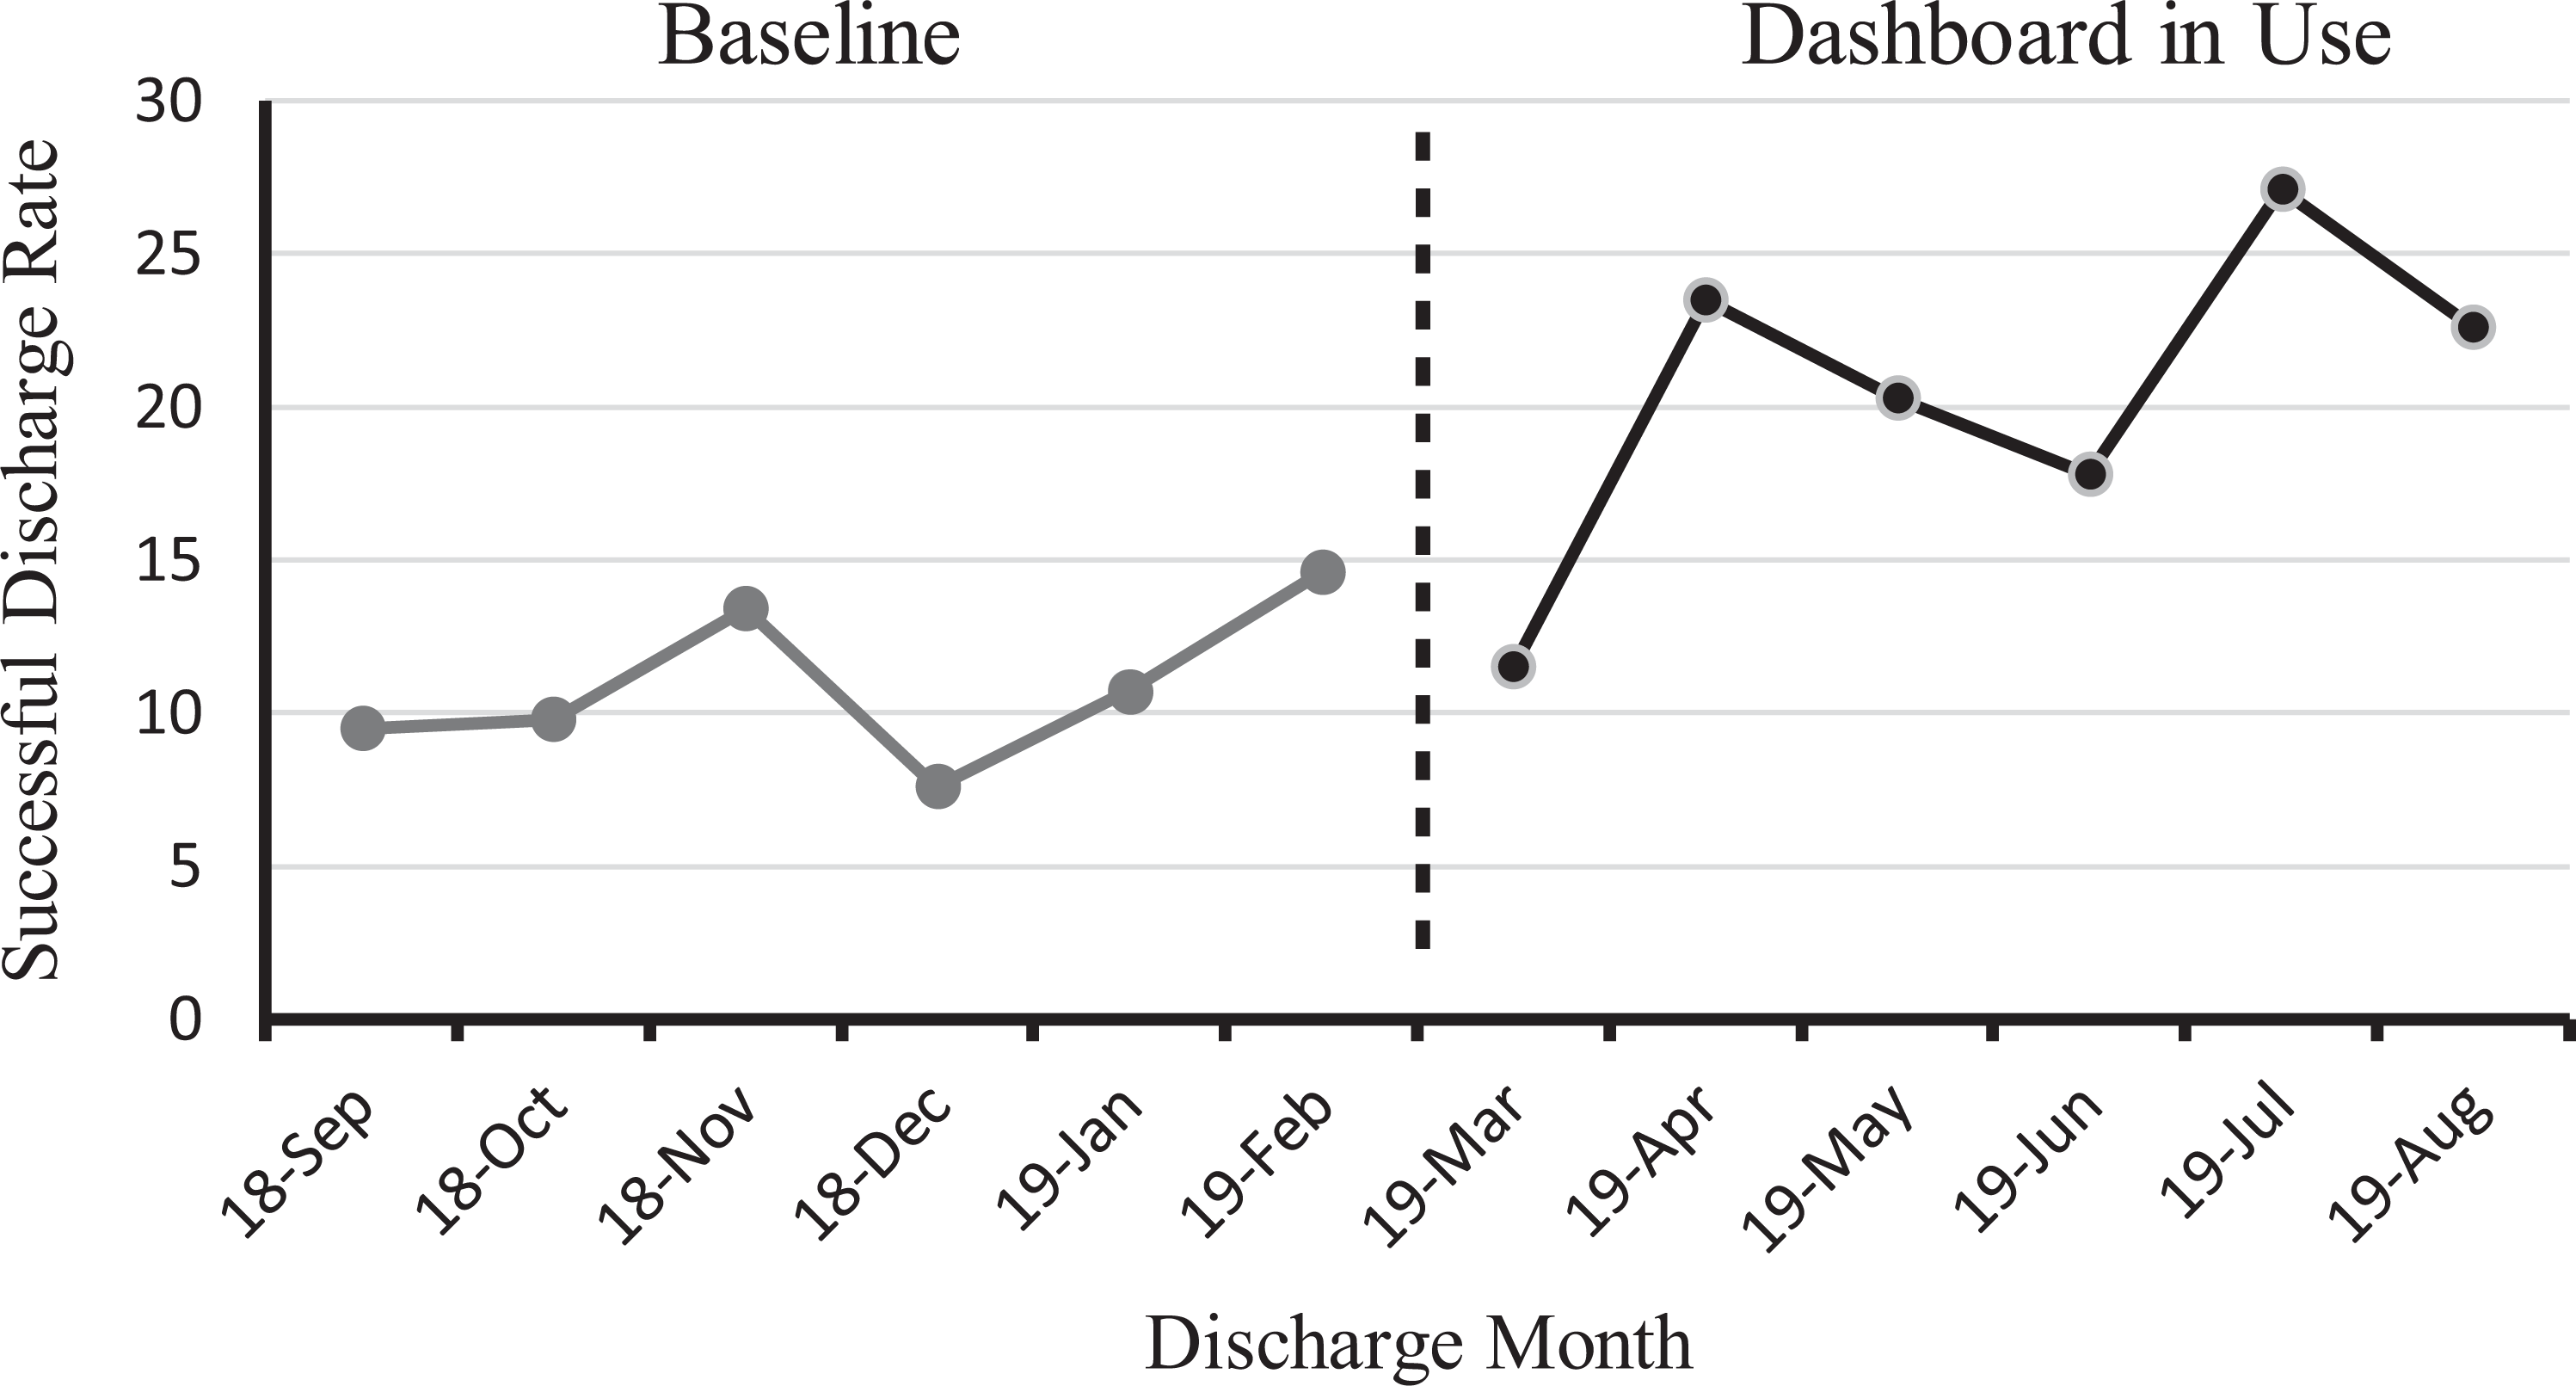
Discharge with staff approval, percentage over time.
Discussion and Applications to Practice
The goal of this pilot study was to gauge potential impacts of a clinical dashboard tool on SUD outpatient treatment completion rates. The authors hypothesized that therapists would be able to better monitor their patient caseloads, develop improved patient care, and increase successful treatment completion. After the dashboard tool was implemented and regular meetings were held with therapists to discuss clinical protocols to best leverage the new tool, the results demonstrated that the number of patients successfully completing this SUD treatment program steadily increased. During the 6 months before implementing the new tool, the treatment completion success rate averaged 11%. During the 6 months of implementation, the success rate doubled to more than 27%. Future research should apply inferential statistics to evaluate a scaled-up version of this work with an increased sample size and account for spurious effects in order to isolate indicators of dashboard effectiveness.
This pilot study has several limitations. First, the research design had no random sampling. Disadvantages consist of selection bias, the inability to minimize other variables, and low confidence of the intervention’s direct impact on outcomes. Maturation bias may explain some of our results as participants may have learned throughout the multiple dine and dashboard meetings. Similarly, our study is subject to testing bias given the pretest assessment of the dashboards. The positive outcomes from this pilot study cannot be explained beyond the sample of patients admitted to this treatment location. Further, we did not measure whether the technology tool alone or the additional regular dine and dashboard meetings impacted outcomes.
Given the previously mentioned limitations, this simple pilot study does provide some opportunities for further SUD treatment research and practice endeavors. There is an ongoing concern regarding the gap between research and practice (Kohn et al., 2000; Pincus et al., 2007). The primary issue is that when interventions tested outside of the real world of community-based treatment services—in places where caseloads are very small and interventions require multiple weeks to effectively administer (Bradizza et al., 2018; Stasiewicz et al., 2013)—are finally attempted in the real-world treatment system, their required protocols and outcomes fall victim to limited resource capacity (Patterson Silver Wolf, 2015). The National Institute of Drug Abuse (2012) has questioned the worthiness of continuing to develop and test interventions in the face of these treatments not being adopted in real-world practice systems.
This study has exposed the problems associated with having a large patient caseload (around 75 for this study) and the challenges of closely monitoring a population that has an illness that is both chronic and complex and that may have multiple other conditions. With so many evolving and dynamic variables related to SUD treatment and recovery, frontline therapists are relying mostly on their intuitions rather than real-time patient performance data (Patterson Silver Wolf et al., 2019).
During this study’s first dine and dashboard meeting, we asked frontline therapists what their clinic’s average completion success rate was. Their responses hovered around 30%–40%. When further probed how they determined that rate, it was mostly grounded in anecdotal guesses and the myths of the thirds (W. R. Miller et al., 2001). In Miller’s large 2001 national alcoholism study in 2001, the authors reported that about one third of individuals treated for addiction remained clean and sober for the rest of their lives. Another third who received treatment still used drugs or alcohol but not at as high a risk level as they did before treatment. The final third never recovered. While that 20-year-old study focused on sustained recovery and not successful treatment completion, this myth of the thirds lives on inside of today’s treatment systems.
In reality, frontline therapists are unlikely to know their treatment program’s successful completion rates or their own performance outcomes. In this study, therapists reacted with a mixture of disbelief and disappointment when learning their clinic’s actual success rate averaged 11% during the 6 months before implementing the new tool, with some months dipping into single digits.
Future research should pursue a randomized control trial where conditions can be more reliably controlled. Because it can be assumed that clinical therapists working on the frontlines of SUD treatment are motivated by the desire to improve the lives of their patients, it is important to control for these behavior change effects after learning of their patient’s poor treatment completion success rates. Also, reasons for SUD therapists not using new research-supported treatments should be measured in forthcoming investigations (Patterson Silver Wolf & Dulmus, 2012 , 2018; Patterson Silver Wolf et al., 2013 , 2018).
As with trying to implement any new intervention or technology, some therapists will be early adopters, while others will lag behind. In addition, there will be a cohort of therapists who might never be moved to adopt a new intervention (Patterson Silver Wolf et al., 2018). Further, any future research measuring the effects of an intervention on treatment retention and completion will also have to control for patient–therapist matching. In a recent study, it was revealed that certain gender and racial matching led to large differences in treatment completion rates (Patterson Silver Wolf et al., 2019).
With the disruptions of outpatient treatment caused by COVID-19, where services have been transitioned to cyberspace without much planning or forethought, the future of SUD treatment will continue to move toward telehealth. Technology tools that were supposed to assist the clinical process, much like EHR systems, have proven less than beneficial for informing and guiding treatments (Kruse et al., 2016). Not only does the clinical dashboard tool that was investigated in this study monitor patient treatment and recovery performance, but it also measures and monitors the therapist’s performance in relation to success with specific patient profiles (Patterson Silver Wolf, 2018).
With SUD treatment completion being associated with improved health outcomes, it is important to focus on barriers and pathways to patients remaining in treatment until successful completion. This pilot study has demonstrated the initial efficacy of a clinical dashboard tool that assists therapists’ efforts to monitor and measure their patients’ performance. Throughout our outpatient treatment infrastructure where services are guided mostly by therapist’s intuitions, technology tools that can easily replace anecdotal validation with real-time data are crucial. Just like psychotherapy interventions have been empirically investigated on various outcomes, similar investigations are needed for emerging technologies that might impact patient outcomes.
Footnotes
Declaration of Conflicting Interests
The authors declared the following potential conflicts of interest with respect to the research, authorship, and/or publication of this article: The first author, Patterson Silver Wolf, is a cofounder, chief clinical officer, and board member and holds shares in Takoda, Inc.
Funding
The authors disclosed receipt of the following financial support for the research, authorship, and/or publication of this article: Sara Beeler-Stinn is a NIDA predoctoral fellow T32DA015035 (mPI/Director R. Cunningham-Williams and K.K. Bucholz).