



Abstract
Introduction
Since 1999, there has been a 400% increase in the rate of drug overdose deaths, and over 70% of the deaths were related to opioids in 2019 (CDC, 2021c). Approximately half a million Americans died from opioid overdose in 2009–2019 (CDC, 2021c). From April 2020 to March 2021, in the midst of the COVID-19 pandemic, the incidence rate of opioid overdose deaths increased by 32% in the United States, which could be largely attributed to the surge of fentanyl-related overdoses (CDC, 2021a). In New York State (NYS), the number of opioid overdose deaths increased by 200% from 2010 to 2017 (NYSDOH, 2020). Drug overdose is now considered a leading cause of fatal unintentional injury (CDC, 2021b).
The HEALing Communities Study (HCS) aims to evaluate the effectiveness of a multi-sectoral community intervention in reducing opioid overdose and death across 67 communities in four states (Walsh et al., 2020). HCS employs a community-engaged and multi-tiered strategy for the adoption and implementation of EBPs at the local level, including opioid outreach, education and naloxone distribution (OEND), medication treatment for opioid use disorder (MOUD), and safe prescribing of opioids (Winhusen et al., 2020). In each community, resources are provided by the study to support a multi-stakeholder coalition, led by a local program manager, to prioritize community actions and develop strategies for implementation. A typical coalition consists of representatives from diverse sectors including health, criminal justice, harm reduction, and patient groups. The community engagement process within HCS is designed to ensure transparency, opportunities for meaningful input, and the ability for local coalitions to evolve as understanding increases and opportunities emerge. In addition, HCS offers stakeholder technical assistance, education, and training to foster participation and to ensure data-driven decision-making. Ultimately, HCS hopes to establish a learning system with the capacity to share and act upon lessons that emerge from on-going practice (Chandler et al., 2020; NIDA, 2021).
New York is one of four states, alongside Kentucky, Massachusetts, and Ohio that participate in the HCS (HCS-NYS for the study in New York). HCS-NYS includes 16 counties as part of the national HCS, with eight counties in each of the two waves in the study. In HCS-NYS, we are applying system dynamics (SD) modeling to support effective community- and data-driven action planning (El-Bassel et al., 2021). The goal of SD modeling, a systems science approach, is to enable community stakeholders to develop a shared understanding of the complex drivers underlying the opioid problem in each community, and to identify potential intervention levers based on this shared understanding, to improve the adoption and implementation of EBPs. We draw upon best practices in community SD modeling to support the ethos of participatory discovery (Hovmand, 2013; Sterman, 2002), which aligns well with the community engagement focus of HCS. In addition to using SD modeling to help communities identify ways to improve and sustain desired outcomes, SD modeling is useful for anticipating trade-offs and challenges that may arise and impact the effectiveness of a given program, policy, or practice in both the short and long term (Sabounchi et al., 2022).
Qualitative systems modeling is a formative phase of many SD modeling projects (Hovmand, 2013). In SD, qualitative models are often presented as causal loop diagrams (CLDs) that elucidate interdependencies among actors, factors, and sectors that contribute to a problem. These feedback loops, or structures, define a working hypothesis of the dynamics that define a focal problem (Lounsbury, Hirsch et al., 2014; Lounsbury, Wylie-Rossett et al., 2015; Weeks, Li et al., 2017; Weeks, Lounsbury et al., 2020). In this paper, we present the process and outcome of this qualitative SD modeling approach in the first 8 counties in HCS-NYS, with the specific aims of (1) elucidating the interdependencies and feedback structures among drivers of opioid use, overdose, and fatality at the local level; and (2) Identifying EBP implementation challenges and opportunities based on a clearer understanding of this complex system.
Methods
In partnership with HCS-NYC communities (n = 8), we implemented a novel process of qualitative SD modeling, which was used to characterize similarities and differences in perceived forces driving the local ecology of opioid-related morbidity and mortality. To foster stakeholder engagement in SD model building, system dynamicists often organize one or more Group Model Building (GMB) sessions, where facilitated exercises orient stakeholders to tenets of systems thinking and elicit a shared understanding of the often complex dynamics that give rise to a focal problem (Andersen & Richardson, 1997; Hovmand et al., 2012). Although there is no one way to organize these sessions, a successful GMB identifies important insights and helps stakeholders build a common understanding of a given problem (Rouwette et al., 2002). However, logistical concerns about stakeholder burden, particularly during the COVID-19 pandemic, restricted our options for engaging communities in conventional GMB as we had done in prior community studies (Swierad et al., 2020; Weeks et al., 2020; Zimmerman et al., 2016). Instead, we adapted the methodology to leverage extensive qualitative interview data that were collected from community stakeholders at baseline and ongoing meeting notes from community coalition meetings during the initial phases of HCS-NYS. This allowed us to develop qualitative SD models, in the form of CLDs that described community concerns about challenges in addressing the opioid epidemic and how these concerns relate to each other. We first developed a community-specific CLD for each community; this was shared with each community and community feedback was used to refine the CLDs. Subsequently, we synthesized the county-specific CLDs into a single, comprehensive CLD presented in this paper.
Data Sources
To develop the CLDs, we used various community-specific secondary data sources collected in 2019, including 46 de-identified and transcribed qualitative interviews with key stakeholders and coalition members (e.g., county commissioner, law enforcement agents, criminal justice representatives, healthcare and social services providers, and people directly impacted by the opioid crisis) regarding their beliefs, experiences, and opinions about OUD, its effects on the communities, and their engagement in finding solutions for the problem (Drainoni et al., 2022; Walker et al., 2022). Using the RE-AIM/PRISM implementation science framework (Glasgow et al., 2019), the goal of these interviews was to obtain an in-depth understanding of community members’ perspectives about internal and external contextual issues such as community stigma that could have an impact on the implementation process of EBPs (Drainoni et al., 2022; Knudsen et al., 2020). Areas of topics covered in the interviews were (1) community risk perceptions, (2) levels of stigma, (3) the health services environment and the availability of substance use services, and (4) funding for substance use services (Drainoni et al., 2022; Knudsen et al., 2020).
Moreover, we used de-identified transcripts from a total of 98 meeting minutes from monthly community coalition calls and also weekly check-in calls during the initial phases of HCS-NYC (Walsh et al., 2020).
Data Analysis
Four coders (PI, PL, BT, and WE) and three modeling investigators (NS, DL, and TH) from our team were involved in data analysis throughout the study. At each of the following steps, a coder-modeler pair reviewed the outputs. If a code could not be reconciled, it was discussed by the three key modeling investigators (NS, DW, and TH) and a resolution would be reached by consensus.
Step 1—Data Extraction and Coding of Each Transcript
Seven coders and modelers from our team conducted thematic coding of each transcript (interview or meeting minutes) using Airtable (2021). Key drivers of the opioid crisis and challenges in the adoption and implementation of EBPs were extracted from the qualitative source materials, including any mention of trends or patterns of change related to the drivers and challenges as well as hypothesized cause-and-effect between variables (with such links explicitly coded as part of data extraction).
Step 2—Data Reduction and Thematic Categorization Across Transcripts
After coding the aforementioned data within Airtable, we reduced the data by identifying the main themes and clustering data around common themes across all the communities under study. Table 1 presents a summary of common challenges in relation to the adoption and implementation of EBPs. If a challenge was described by one or more stakeholders in a community, it is marked with an “x.”
Common Challenges Across Communities (Ordered Randomly as A–H).

Note. OUD = opioid use disorder; MOUD = medication treatment for opioid use disorder.
In Table 2, the secular trends of patterns of change over time, as perceived by stakeholders, are shown for the common challenges described in Table 1. Patterns of change are noted as increasing, decreasing, or not changing (stagnant).
Common Secular Trends of Challenges Across Communities (Ordered Randomly as A–H).

Note. Rx = prescription; OUD = opioid use disorder; MOUD = medication treatment for opioid use disorder. Empty cells indicate that the factor was not described by any of the county stakeholders.
Step 3—Initial Causal Mapping of Key Variables
Based on the results from Step 2, we developed an initial causal map for each community using Vensim, a system dynamic modeling software (Vensim, 2021). A sample causal map of factors, and their interdependencies, that underlie the opioid crisis in one community is shown in Figure 1. In this diagram, each variable was coded with the source file type and date of meeting as described in the section on data sources above. The variables in bold were based on meeting discussions relevant to the COVID-19 situation. Figure 1 is not meant to be read with granularity; it is shown only to illustrate the step of translating data extracted from qualitative interviews and meeting notes into causal links, which may not yet form completed (closed) feedback loops.

Sample raw causal map of factors underlying the opioid crisis in one community.
Step 4—Community-Specific Causal Loop Diagramming
In this step, we developed a refined CLD based on the initial causal map for each community. To construct the CLD, key variables were interlinked by directional arrows showing cause-and-effect. The signs on the arrows showed (+) and (−) polarity, indicating positive and negative correlation between each pair of variables (Lounsbury et al., 2015).
Positive signs indicate that two variables change in the same direction. For example, as the number of “Individuals with OUD without Treatment” grows, the number of “Overdose Fatalities” also increases. If one goes down, the other also decreases. The two variables have a positive causal relationship. Negative signs indicate that two variables change in opposite directions. For example, as “Naloxone Use” increases in the community over time, “Overdose Fatalities” will decrease. Likewise, if “Naloxone Use” decreases instead, “Overdose Fatalities” will increase as a result. The two variables have a negative causal relationship. Reinforcing (R) loops can lead to exponential growth and decline in the system. This cycle can be desirable (e.g., more treatment success leads to more funding which leads to more treatment success) or can be undesirable (e.g., less treatment success leads to less funding which leads to less treatment success), often at an increasing rate of speed. A reinforcing loop has zero or an even number of negative links in a CLD. Balancing (B) loops can lead to growth or decline, but will eventually plateau (e.g., more prevention funding leads to fewer individuals with OUD, which in turn diminishes funding for prevention—as the need is no longer perceived). A balancing loop has an odd number of negative links.
A closed sequence of arrows can form two kinds of feedback loops (i.e., complete circles). Both loops can lead to a change in the system, but the pattern of change differs:
Through iterative deliberation among research team members and feedback from communities, we revised community-specific CLDs accordingly, focusing on the goal of identifying feedback processes (closed loops). During this activity, a few causal links were inferred based on expert knowledge and known literature and added to the model using a dashed arrow link. Each final community-specific CLD reflected what we understood about each community's experiences and understanding of the opioid crisis and the challenges that existed within the community system.
Step 5—Synthesizing a Common CLD Across Communities
After reviewing and analyzing each of the community-specific CLDs, we merged the common feedback loops into a single, synthesized CLD to represent common structures, implementation challenges and opportunities, and dynamics of OUD identified across all eight participating communities. For ease of conveying the results, only the synthesized model, and not the community-specific CLDs, is shown in this paper and described as follows.
Results
Synthesized CLD of the Opioid Crisis at the Local Level
Figure 2 shows the synthesized CLD, which features 16 common feedback loops for the purpose of building a shared understanding of the interdependencies and feedback structures among drivers underlying opioid use, overdose, and fatality at the local level across counties. Table 3 shows which feedback loops were included in community-specific models and their commonality across communities, where columns represent the feedback loops of the merged CLD and the rows represent the eight communities, as marked by an “x.” Also, the columns in the table are shaded to match the color of the feedback loop in the CLD (Figure 2). All community-specific CLDs included feedback structures representing access to and retention in MOUD (i.e., Initiation, Continuation & Completion of MOUD [B1, B2, & B3]; MOUD & Community Reintegration [B4]; MOUD Relapse [R1]). Similarly, feedback loops representing the study's primary outcomes, opioid overdose and fatalities (B5), were common to all community-specific CLDs. Most communities (n = 6) included the feedback loop for Harm Reduction & Compassion Fatigue (B7), such as strategies that promoted outreach, education, and naloxone distribution (OEND). Conceptualization of the role of stigma varied across communities, with multiple types of OUD-related stigma identified, with the most commonly represented being Overdose & Stigma for Seeking MOUD (R5) (n = 3), Provider Stigma (B6) (n = 2), and Stigma and Incarceration (R3) (n = 2).

Final merged causal loop diagrams (CLD) across communities.
Common Feedback Loops across Communities (ordered randomly from A - H)

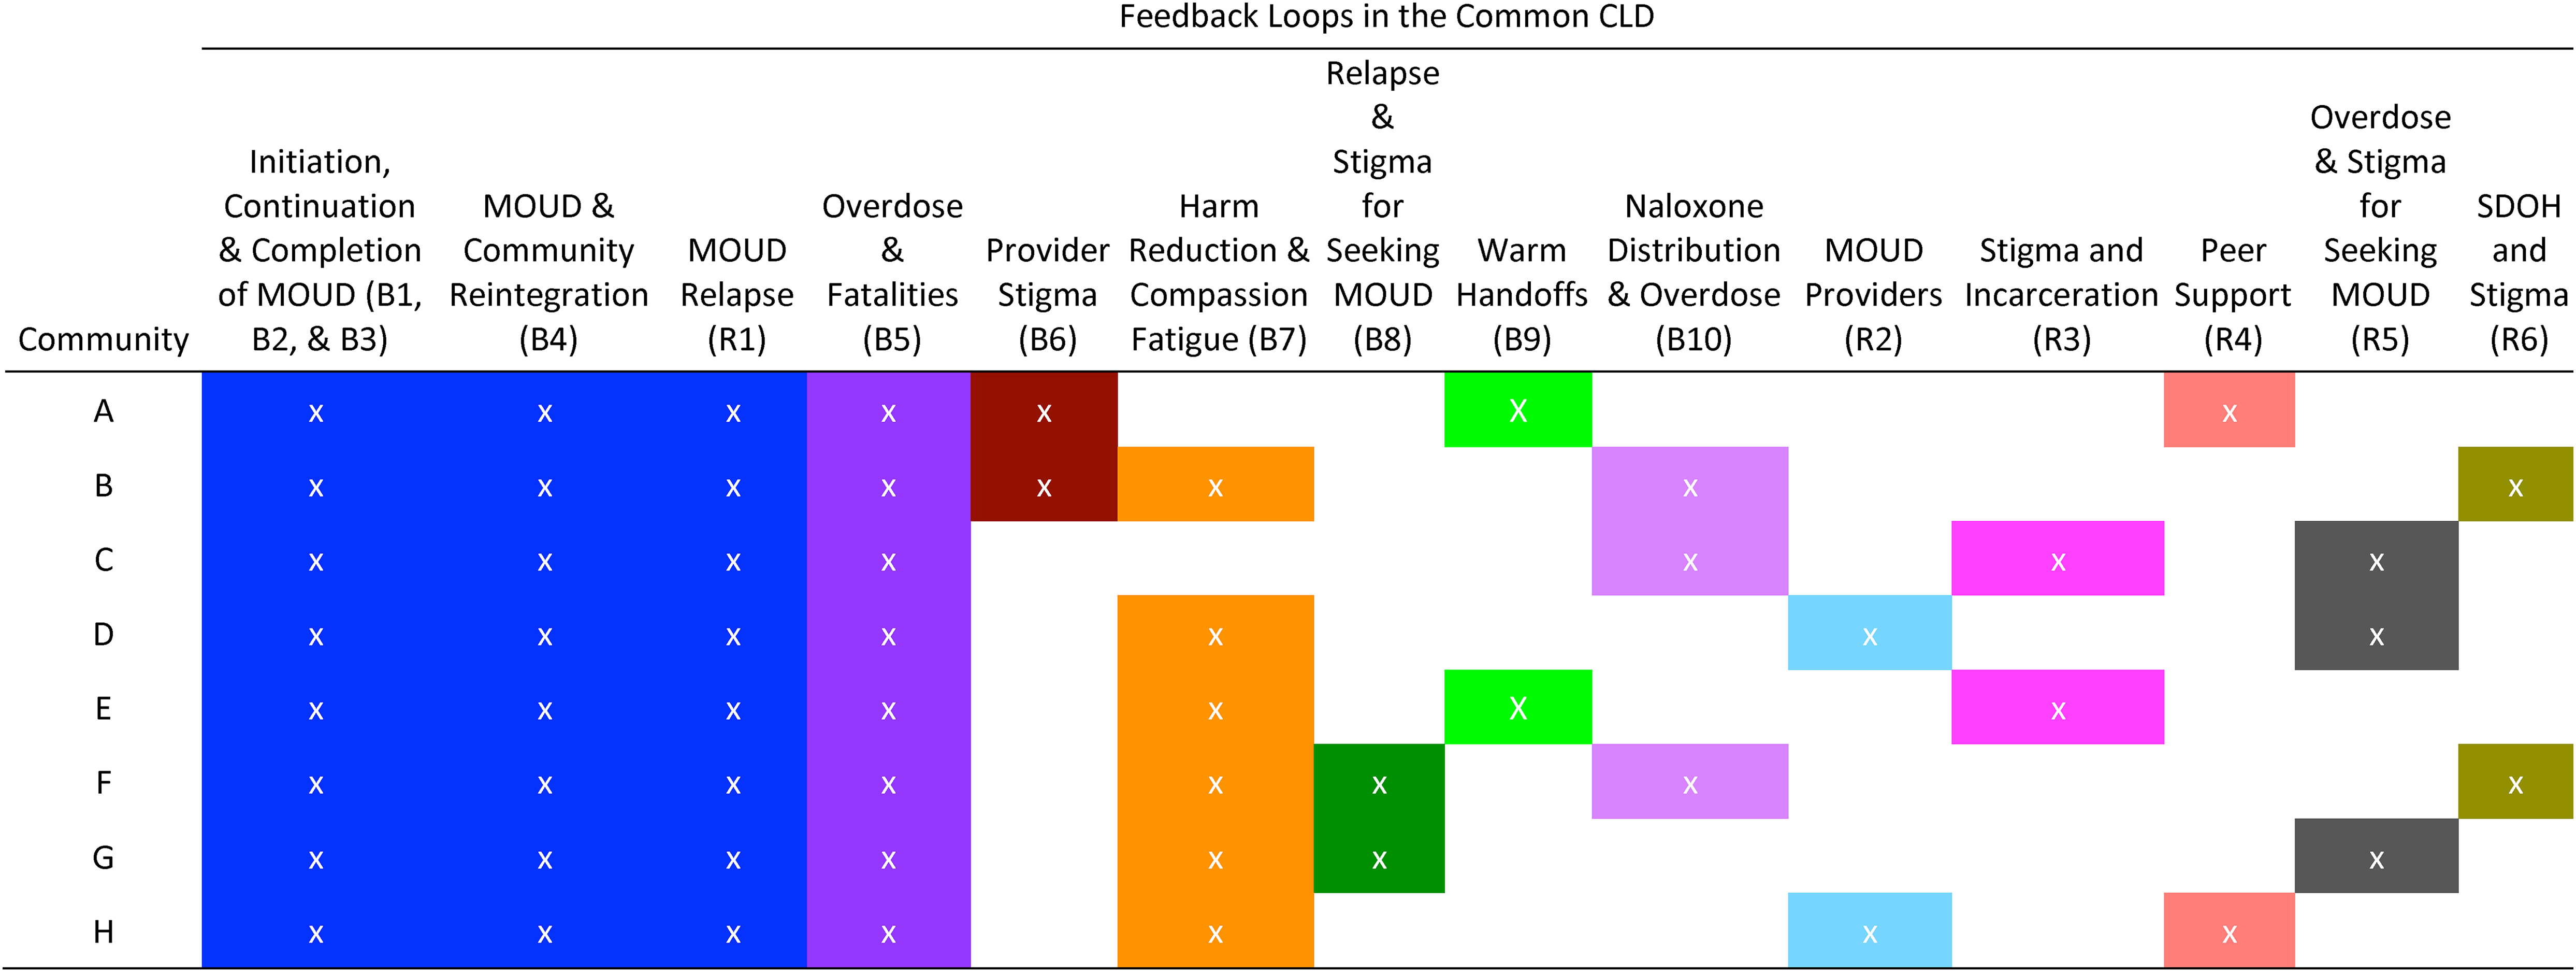
Note. MOUD = medication treatment for opioid use disorder; SDOH = Social Determinants of Health.
Table 4 further describes the loops shown in the synthesized CLD and summarizes the corresponding causal links and variables within each loop. In addition, we indicate each loop's behavior over time (either reinforcing or balancing) as well as its expected impact (fueling or curbing) on overdose, the number of individuals receiving MOUD, and the stigma towards OUD.
List of Feedback Loops and Causal Paths.

Note. Tx = treatment; OUD = opioid use disorder; MOUD = medication treatment for opioid use disorder.
CLD-Derived Insights to Improve the Implementation of EBPs
For the second aim of this study, we have identified implementation challenges and opportunities that stem from an understanding of the underlying feedback structures in the common CLD (Figure 2) and that could improve the adoption and performance of evidence-based programs (Table 5). The synthesized CLD revealed useful insights on commonly perceived challenges including stigma, and social determinants of health (e.g., housing, and incarceration), that have a complex and integral role in addressing EPB reach across communities. Naloxone training can serve as a strategic entry point to reduce overdose fatality, expand harm reduction efforts in the community, and lower stigma. However, strategies and interventions should not just focus on initiating individuals into MOUD treatment but also providing support for relapse prevention and retention in long-term treatment to reduce both fatal and nonfatal overdose.
List of Feedback Loops and Insights.

Note. OUD = opioid use disorder; MOUD = medication treatment for opioid use disorder.
Discussion and Application to Practice
Our approach to systems thinking and qualitative SD modeling with HCS-NYS communities yielded a common CLD that provides a generalizable visualization of key feedback structures representing shared drivers of the opioid crisis and allowing us to identify the challenges and opportunities in addressing OUD at the community level. The resultant synthesized CLD reflects a collective understanding of dynamics that drive opioid overdose and fatality, based on the mental models of diverse stakeholders across communities. The CLD clearly demonstrates that there are interdependencies between prevention (harm reduction and OEND) and treatment (access to MOUD) over time. Further, it illustrates how the dynamics of certain social forces can compromise or limit community capacity building and EBP reach at the local level. The CLD supports various narratives about how social forces attributable to various forms and levels of stigma (e.g., provider beliefs about persons with OUD; concern among persons with OUD about being stigmatized by seeking treatment), social needs (e.g., housing), and local capacities (e.g., peer support; warm handoffs, community reintegration services) can be implemented together as part of a holistic, synergistic approach to the crisis.
And there are other, more general benefits to applying systems science methods, such as SD modeling, to the study of complex problems, too. These stem from the epistemological differences between systems science methods and pure qualitative or statistical approaches. For example, a critical review of, or a reflective dialogue about, our common CLD with stakeholders can help explain how change occurs; raises questions about the quality (reliability and validity) of extant information or data supporting key assumptions; identify gaps in current theory or evidence; and generate new research questions and hypotheses for future empirical work (Ip et al., 2013; Mabry et al., 2011).
The results of our modeling analysis revealed that, across communities, stigma was a fundamental issue, and many feedback loops (six out of 16) referenced stigma towards OUD, harm reduction, and MOUD in the synthesized CLD (Figure 2). Stigma exists at the individual and community levels, inhibiting the availability of and access to prevention services and care across subsystems within a community (e.g., criminal justice, law enforcement, emergency departments). Stigma can also interfere with a community's ability to address social determinants of health when individuals affected by OUD are seen as unworthy of help.
Although overall stigma towards OUD and MOUD was perceived to be declining (Table 2), various forms of stigma and the lack of community awareness or understanding about OUD remain a common challenge in combating overdose and fatalities. There is growing evidence showing that higher levels of stigma are associated with noncompletion of treatment for substance use (Brener et al., 2010), obstruction of recovery and reintegration of people with substance use disorder (Brewer, 2006; Van Olphen et al., 2009), and escalation of risky drug use behaviors such as needle-sharing (Simmonds & Coomber, 2009). Stigma is not only a major barrier to treating substance use disorder (Copeland, 1997; Digiusto & Treloar, 2007; Semple et al., 2005), but also a barrier to strategies aimed at averting overdose fatality by reducing support for public health-oriented policies such as naloxone distribution (Kennedy-Hendricks et al., 2017). This, in turn, hinders the implementation of interventions and worsens health inequities (Tsai et al., 2019).
In this study, we identified two salient social determinants of health based on stakeholder perspectives: homelessness and incarceration. Other social determinants that affect persons with OUD did not emerge from the data, such as unemployment, food insecurity, aggressive policing, lack of access to transportation, and lack of access to health care, all of which have also been found in prior research to significantly increase the risk of fatal and nonfatal overdoses (Riggs et al., 2020).
Indeed, risk trajectories of drug use are influenced by structural factors such as poverty, discrimination, and other social disadvantages (Altekruse et al., 2020; Barocas et al., 2019). Future work with the next wave of HCS-NYS communities will explicitly investigate how unmet social needs may limit EBP implementation success. That few social determinants emerged from stakeholder interviews and community discussions in the early stages of HCS-NYS suggest that there are opportunities to develop strategies to integrate other sectors into community-wide efforts.
Furthermore, it is notable that this study did not explicitly identify dynamics associated with specific subgroups at high risk of opioid overdose and fatality, such as persons who have a concomitant mental illness, persons who suffer chronic pain, or persons who inject drugs. Future work is warranted to expand the common CLD for diverse populations. Although clinical data reflect that anyone can develop OUD, diagnosis is more prevalent in lower socioeconomic groups and other vulnerable and marginalized populations. In recent years and since the Covid-19 pandemic, African Americans and Latinos have had alarming increases in opioid overdoses (Khatri et al., 2021; Larochelle et al., 2021; Tiako, 2021). To mitigate racial/ethnic disparities in opioid fatalities and access to MOUD, strategies that address root causes of poverty, including strategies that serve to dismantle systemic racism, are warranted (Jones et al., 2019; Mehtani et al., 2021; Mountain-Ray et al., 2021; Peterkin et al., 2021). For example, historical trauma coupled with contemporary experiences of racism, discrimination, and medical mistrust continues to be major barriers for minority populations with OUD to access MOUD (Fisher et al., 2007; James & Jordan, 2018).
Our study constitutes a novel modeling approach to developing and applying qualitative systems models in community intervention projects. The methodology may be generalized to other public health topics and settings where conventional GMB may not be feasible. We found that the rich qualitative data from stakeholder interviews and community coalition meetings served to provide a robust view of community concerns about the drivers of the opioid crisis and the challenges in addressing it. That said, the adapted methodology was nonetheless resource-intensive and required substantial topical and modeling expertise to translate the raw data into the final CLD. The standard approach to GMB supports potentially more effective dissemination because stakeholders are engaged in every phase of model building and validation. In our approach for this study, stakeholder input was limited to the finalized diagram that the core modeling team made, and was not participatory. So the challenge exists of how best to communicate the modeling process and outputs to community stakeholders to enhance their ability to leverage model insights for local actions. This remains an evolving area of inquiry in community-based SD modeling research.
In conclusion, our study demonstrates the interconnectedness of the community system underlying the opioid crisis, such that addressing the crisis cannot only depend on any one sector of the community. Indeed, a collective and cross-sectoral approach is needed, involving individuals with OUD, families, health professionals, law enforcement, criminal justice agencies, social service organizations, and healthcare. This study shows how strategies across sectors can be mutually reinforcing while continuing a siloed approach is unlikely to solve the crisis faced by so many communities across the country. In this light, given their training and role as both system managers and service providers, social workers can have a particularly significant role to play in supporting the linkage of different components of the system and helping at-risk and OUD-affected individuals navigate care at different stages of prevention and treatment. Systems science methods, as the one illustrated in this paper, can be useful to social work research and practice by giving social work professionals the tools to better understand complex problems and cope with the complexity of service design and delivery.
Footnotes
Declaration of Conflicting Interests
The authors declared no potential conflicts of interest with respect to the research, authorship, and/or publication of this article.
Funding
The authors disclosed receipt of the following financial support for the research, authorship, and/or publication of this article: This work was supported by the National Institute on Drug Abuse, Centers for Disease Control and Prevention (grant no. UM1DA049415, Centers for Disease Control and Prevention (U48DP0).
