
Abstract
The Cannabis Act legalized the possession and sale of nonmedical cannabis in Canada on October 17, 2018. Evaluating the impact of cannabis legalization requires a more thorough understanding than is provided by most existing measures of cannabis use. The aim of this study was to pretest a range of cannabis consumption measures used in a population-based survey and to share insights gained in the process. Cognitive interviewing was conducted among 10 cannabis users aged ≥16 years. Comprehension and self-reporting of consumption types and amounts, sources of purchase, and cannabinoid levels were examined. Findings revealed areas for improvement in a number of survey items, including unclear wording and reference images. Identified issues were used to improve the survey for use in the International Cannabis Policy Study. The authors discuss important principles (e.g., use of visual cues, user-selected units, and time frames) that should be adopted when assessing cannabis use in population-based studies.
Background
Cannabis (also referred to as “marijuana,” “pot,” “weed,” etc.) is the most frequently used illicit substance worldwide, with approximately 183 million past-year users in 2015 (United Nations Office on Drugs and Crime, 2017). In Canada, cannabis use is common, with past-year use rates of 41%, 45% and 18%, respectively, among Canadians aged 16 to 19, 20 to 24, and ≥25 years in 2017 (Health Canada, 2017). Cannabis use is associated with both beneficial (e.g., pleasure-seeking motives; reduction of pain, nausea, vomiting, and spasticity) and adverse effects (e.g., impaired driving, certain cardiovascular and respiratory outcomes, increased risk of schizophrenia and other psychoses; National Academies of Sciences, Engineering, and Medicine, 2017; Vaucher et al., 2018). These effects depend largely on age of initiation and frequency, duration, and mode of use (Volkow, Baler, Compton, & Weiss, 2014).
A wide range of national and international surveys assess the prevalence of cannabis use. To date, however, most surveys assess prevalence using a limited number of measures assessing frequency of use, such as past-month use. Currently, few surveys have published psychometric properties (e.g., Daily Sessions, Frequency, Age of Onset, and Quantity of Cannabis Use Inventory [DFAQ-CU]; Cuttler & Spradlin, 2017), and few assess cannabis consumption in terms of the number of times cannabis is used within a particular month, day or week, or the typical amount used on each occasion (e.g., Canadian Cannabis Survey; Advanis, 2017). In addition, few studies (e.g., Canadian Student Tobacco, Alcohol and Drugs Survey [University of Waterloo, 2017] and Ontario Student Drug Use and Health Survey [CAMH, 2018]) assess the different methods of using cannabis—whether it is smoked, vaped, applied topically, or ingested orally—which may influence both the subjective and physiological outcomes (Barrus et al., 2016; Newmeyer, Swortwood, Abulseouda, & Huestisa, 2017) and health effects (Borodovsky, Crosier, Lee, Sargent, & Budney, 2016) of cannabis. Cannabis products also vary in their potency. Various high potency extracts—including “wax,” “shatter,” and concentrated oils, often used in edible products—appear to be increasing in popularity (Barrus et al., 2016; Russell, Rueda, Room, Tyndall, & Fischer, 2018). Many of these products are produced by consumers themselves, while others have emerged along with the commercial industry as part of medical and nonmedical cannabis legalization (Russell et al., 2018). The need for more sensitive measures of use is particularly important for cannabis, which has more variable patterns of use and risk compared with other products, such as cigarettes.
In Canada, the Marihuana Medical Access Regulations legalized cannabis use for medical purposes in 2001 (Government of Canada, 2018a). On October 17, 2018, the Cannabis Act (Bill C-45; Parliament of Canada, 2018) made Canada the second country after Uruguay (República Oriental del Uruguay, 2013) to legalize the sale and possession of nonmedical (i.e., recreational) cannabis. Evaluating the impact of cannabis legalization requires a more thorough understanding than is provided by most existing measures of cannabis use frequency. The public health impact of cannabis policies will depend on the routes of administration and product type, quantity of cannabis consumption, and retail source (e.g., product potency, quality, and availability). Indeed, preliminary data from U.S. states that have legalized medical cannabis indicate a shift toward vaping and edible forms of cannabis use (Borodovsky et al., 2016). Collectively, measuring these outcomes will help to estimate transitions from the illicit to the licit market following cannabis legalization, as well as “high risk” and problematic patterns of cannabis use. Furthermore, citing challenges in measuring outcomes post-legalization, a report from Colorado suggested that other jurisdictions consider “adding marijuana questions to population-based surveys prior to major policy shifts, like legalization, with sufficient sample size to monitor regional trends” (Ghosh et al., 2017, p. 4).
The current study used cognitive interviewing to pretest a range of cannabis consumption measures included in a population-based cannabis survey (Leos-Toro & Hammond, 2017) for use in the International Cannabis Policy Study (Hammond et al., 2018). In particular, the researchers examined consumer comprehension and ability to self-report consumption types and amounts, sources of purchase, as well as cannabinoid (tetrahydrocannabinol [THC] and cannabidiol [CBD]) levels in cannabis products. As Canada and other jurisdictions shift toward a legal cannabis market, the objective of this article is to share the insights gained in this process with regard to developing surveys on cannabis use. Specific changes made to the final survey have been incorporated into the “Results” section of this article as examples of item modifications made following the cognitive interviewing process.
Method
Cognitive interviewing is used “to study the manner in which targeted audiences understand, mentally process, and respond to the materials we present” (Willis, 2005, p. 2). The current study used cognitive interviewing to examine consumer understanding and comprehension of a new survey instrument developed to examine cannabis consumption (Leos-Toro & Hammond, 2017). This methodology has been used in previous studies to examine and improve comprehension of health surveys (e.g., Murphy, Hollinghurst, & Salisbury, 2018; Solorio, Ayala, Paez, Skalicky, & Morales, 2016). Cognitive interviews were used to better understand participants’ comprehension, recall, decisions, judgment, and response processes (Willis, 2005) while answering survey questions about cannabis consumption, as well as to reveal anticipated and hidden issues with survey items.
Participants and Recruitment
A sample of 10 participants (50% female) aged ≥16 years was recruited from Southwestern Ontario. Participants who had completed a previous focus group on cannabis were contacted by email to ask whether they were interested in participating in an upcoming study on cannabis; if interested, they were contacted by phone and provided with information on the current study. Additional participants were recruited using word of mouth. Inclusion criteria were age ≥16 years and regular cannabis use (at least once per week). Although the survey will eventually be administered to the general population (i.e., cannabis users and nonusers), we recruited regular cannabis users only in order to test specific survey questions on consumption frequencies and amounts, for which non-users would be unable to provide insight.
Procedure
Interviews were conducted in January to February 2018. Cognitive interviewing was conducted by the first author during a 60- to 90-min interview in a private office at the University of Waterloo. Participants provided written consent and were informed that the study aimed to gather information on their thought processes, understanding, and interpretation of survey questions. All 10 participants completed an online cannabis survey on a laptop; due to automated skip logic, participants did not see every question. Briefly, the survey was designed to examine cannabis use and consumption behaviors and norms surrounding cannabis use. A set of “target” questions, primarily relating to cannabis consumption measures and reasons for use, was selected for cognitive interviewing. Target questions were selected to evaluate respondents’ ability to recall and estimate consumption frequency and amounts, which, as mentioned above, have not been tested in depth in many population-based surveys. The researchers also wished to test the utility of specific images used as references for reporting consumption amounts and to ensure specific questions were interpreted as intended (e.g., items on “medical” cannabis use). Most other survey items (e.g., sociodemographic and problematic use questions) were adapted from previous measures and were not selected for testing. Target survey items and probes are available in Supplementary File 1.
After the participant completed the survey, the interviewer presented the target questions one-by-one as PowerPoint slides on a laptop, and asked scripted (retrospective) probes, which prompted the participant to provide more information about their response to each question. Probes were developed a priori by the authors and designed to highlight issues with survey items related to response options, potential computational and/or recall errors, and misinterpretation of intended question meaning, as well as to ensure clarity of item wording and images. Spontaneous probes were used to gather more information when needed.
An effort to avoid leading questions was made; probes were designed to place the participant in a “storyteller” rather than an “evaluator” role (Miller, Chepp, Padilla, & Willson, 2014) by asking them to openly describe their thought processes and interpretations (e.g., “Can you tell me how you came up with your answer?”; see Supplementary File 1). Interviews were audio-recorded for later review. Participants were debriefed and received US$50 cash as remuneration. The study was reviewed by and received clearance from a University of Waterloo Office of Research Ethics committee (ORE No. 21786).
Data Analysis
Participant responses were transcribed and summarized in an item-by-item fashion across interviews. Specifically, the interviewer noted both the nature and frequency of issues that arose. This analytical approach was used (as opposed to devising a formal coding scheme) as per Willis’s (2005) argument that (a) the vast majority of issues with survey items fall into the comprehension/communication coding category and (b) the coding process does not add additional information with which to improve items. When analyzing responses to interview probes—which primarily focused on understanding, opinion, or personal experience answering survey questions (e.g., “Can you tell me how you came up with your answer?”)—an interpretivist approach was assumed, which focuses on participants’ interpretations and experiences (Miller et al., 2014). Collectively, this approach allowed the researchers to update survey items based on both individual feedback (e.g., a participant’s inability to recognize a reference image) and common responses or varied interpretations (which would reflect the ambiguity of a question), rather than focusing exclusively on themes emerging from a formal coding process. A sample of 10 participants was recruited as per previous research indicating that sample sizes of five to 15 participants are sufficient for cognitive interviewing (Willis, 2005). After 10 participants were interviewed, theoretical saturation was determined to have been attained because several recurrent responses were identified.
Results
Table 1 lists the sample characteristics. Average participant age was 24.6 years (SD = 6.3, range = 19–40); 70% were students.
Characteristics a of Cannabis Users Who Participated in Cognitive Interviewing (n = 10).
Data in Table 1 were collected from the online survey (Leos-Toro & Hammond, 2017) completed by participants prior to cognitive interviewing.
Response options with zero frequencies have been collapsed. See Supplementary File 1 for full item wording and response options.
Although we screened for at least weekly use at recruitment, one participant indicated monthly use when completing the online survey.
Sources and Access
Nine of 10 participants found it easy to identify the sources from which they had accessed cannabis in the past 12 months. Some overlap was noted for certain response options provided (e.g., “Shared around a group of friends” vs. “From a family member or friend” vs. “From someone else I know”); these response options were collapsed in the final survey. Participants were able to estimate the percentage of dried cannabis they received from each source by mentally breaking down the sources into proportions with little difficulty.
Although all participants found it easy to state whether they had sold/resold cannabis to others, one questioned whether this included giving it to others for free, and four participants spontaneously mentioned having done so. To remove ambiguity, this question was updated to ask whether anyone had paid the respondent for marijuana they had given them.
For the question, “How close do you live to a store that sells marijuana?” participants were asked to quantify the response option “a short drive.” Responses ranged from <5 to 30 min from home, indicating that the response options should be expressed in numeric rather than subjective terms. In the updated survey, response options are expressed in “minutes from home.”
Purchase Amount
Although the majority (seven of 10) participants found it easy to indicate how much dried cannabis they had purchased in the reference period, three found this difficult either because their purchasing behavior varies or because their purchases are shared with others. Similarly, when asked the amount they had spent on dried cannabis in the reference period, three participants found this difficult to estimate because of variations in pricing, because they receive the cannabis for free, or because it is shared. Participants had no trouble answering how much dried cannabis they purchased the “last time.” However, half of participants who were asked a follow-up probe (four of eight) noted that the amount they purchase tends to vary. The sequence of questions on purchasing was updated to include both the amount spent in a reference period of the respondent’s choosing and at “last purchase.”
Forms of Use
All participants found it easy to indicate whether they had used each of 12 different forms of cannabis in the past 12 months (see Table 1); however, eight of 10 participants had not heard of “fresh flower for juicing,” and one participant did not recognize the term hashish. The term fresh flower was removed, and “hashish” was replaced with the (locally) more common terms hash or kief in the final survey.
Frequency of Use
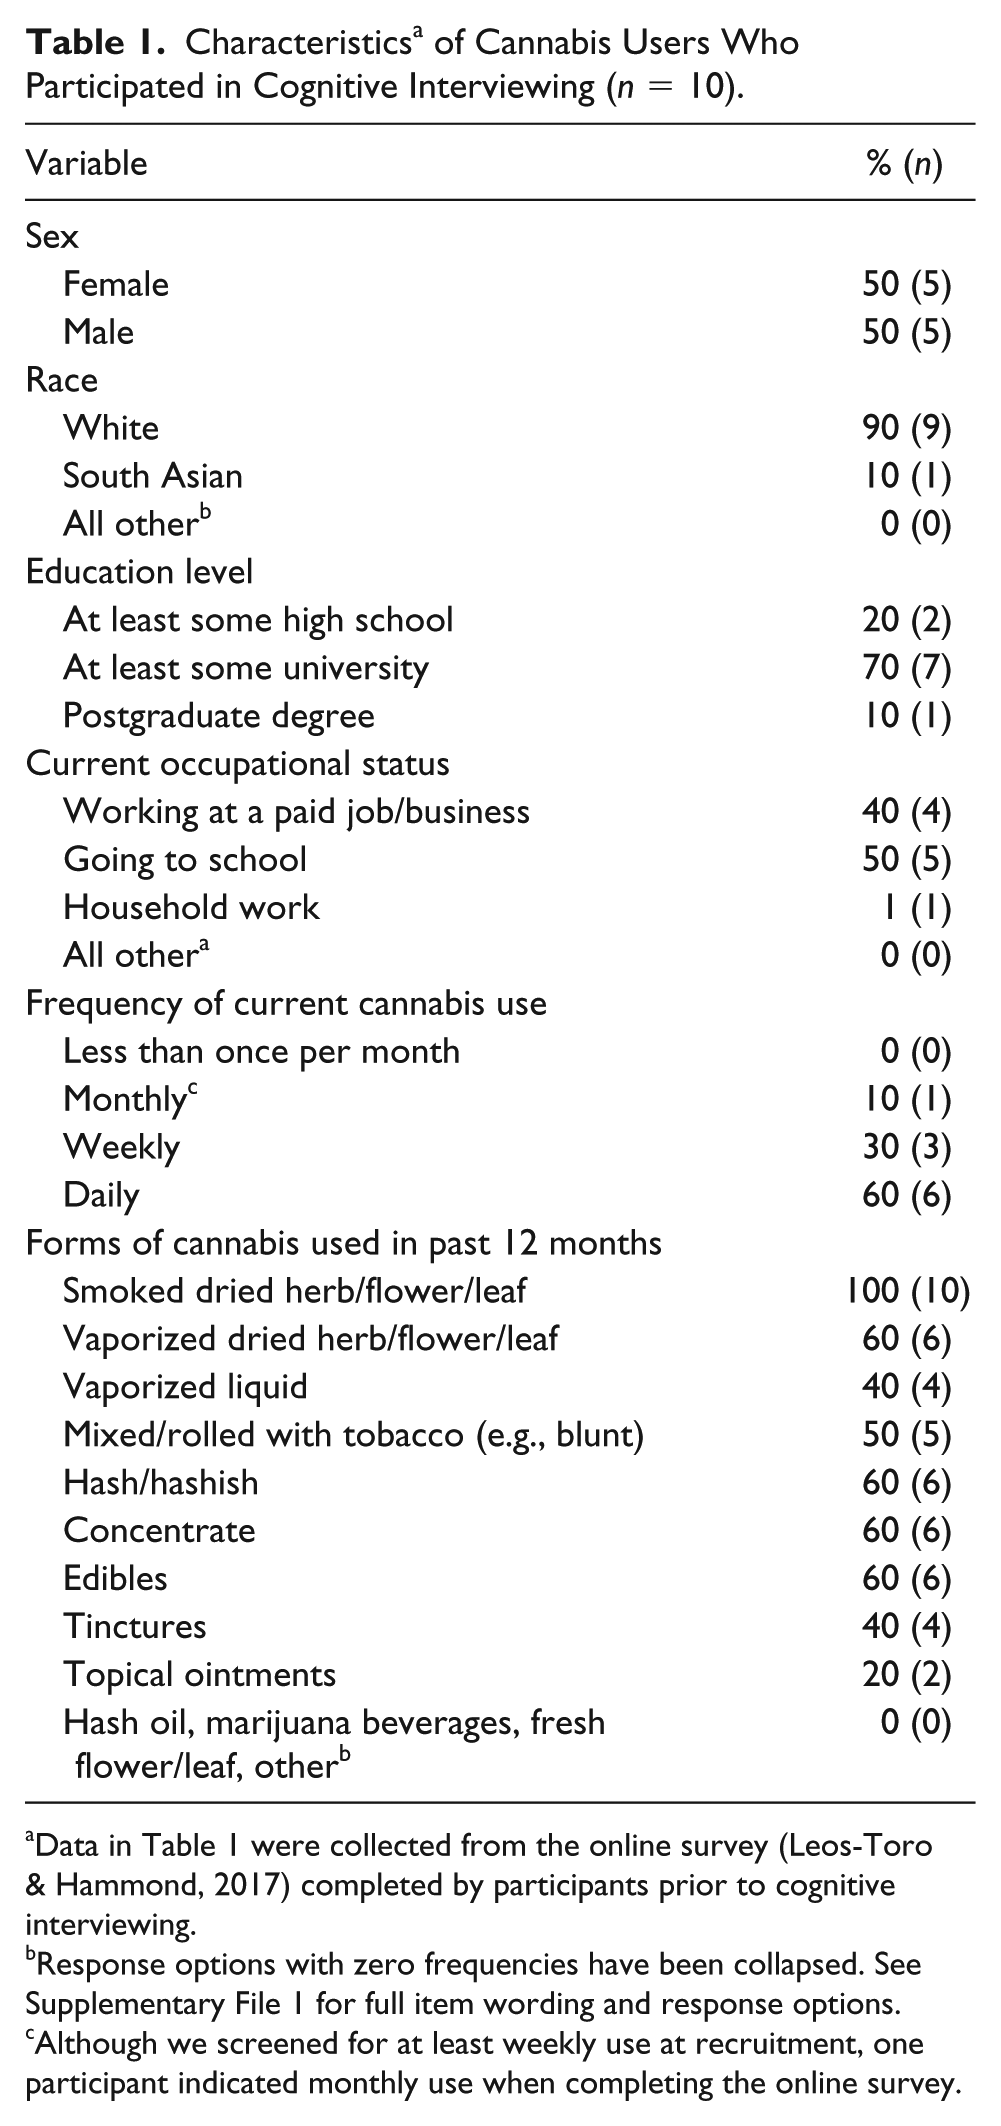
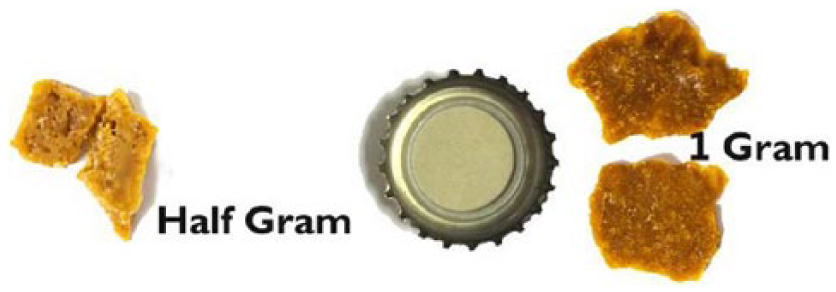
When answering target survey questions, nine of 10 participants indicated that it was easy to recall the last time they had used dried cannabis. When shown a reference image (Figure 1), participants generally understood that the bottle cap was present for size reference, but two did not recognize the image of the joint. The image was understood as intended by eight participants. One noted that the amount of cannabis shown in the joint may not be representative of a typical joint. Two participants found this question difficult to answer because the amount they use varies. The reference image was updated to include photos of authentic joints in six sizes (see Hammond et al., 2018).
Reference image associated with the question, “In (a usual day/a usual week/the past 12 months), up to how much dried/herb/flower/leaf did you use?”
Quantities Used
Dried cannabis
Participants were asked two questions about dried cannabis to examine whether they could self-report their cannabis use in grams. When asked to report the number of grams of dried cannabis flower or leaf smoked or vaped in the past 30 days, participant responses ranged from 1 to 40 g, with an average of 10.6 g. When asked to report the number of grams in a typical joint, responses ranged from 0.2 to 2 g, with an average of 0.81 g per joint. Perceived ability to answer these questions varied, with responses ranging from “hard” to “easy”/“pretty easy.” Any difficulty (mentioned by five of 10 participants) stemmed from variation in the amount smoked, never having been asked to quantify it, or not having prepared the joint oneself. Nevertheless, seven of 10 and nine of 10 indicated that they were “sure” or “fairly sure” of their estimates over the past 30 days and in a typical joint, respectively.
Respondents were able to report their consumption amount for the reference period of their choice (usual day, usual week, usual month, or past 12 months), using images of different cannabis amounts with numeric descriptors (Figure 1). When asked follow-up questions about how much (½ oz, 1 oz, >1 oz) dried cannabis they had used in the reference period, five of six participants found this easy to answer; however, five of six also indicated that their frequency of use varies.
To address issues raised by some participants, the final survey was updated to include a two-step question in which respondents select an image of a real joint corresponding to the joint size they typically smoke, and then indicate the number of joints of that size they would typically smoke in a given reference period. A statement was also added directing participants to only indicate the amount smoked personally, and not the amount shared with others. In this way, a respondent who typically shares a 1-g joint with a friend can choose the image of the 1-g joint and then choose “half a joint” as the amount personally smoked.
Other forms of cannabis
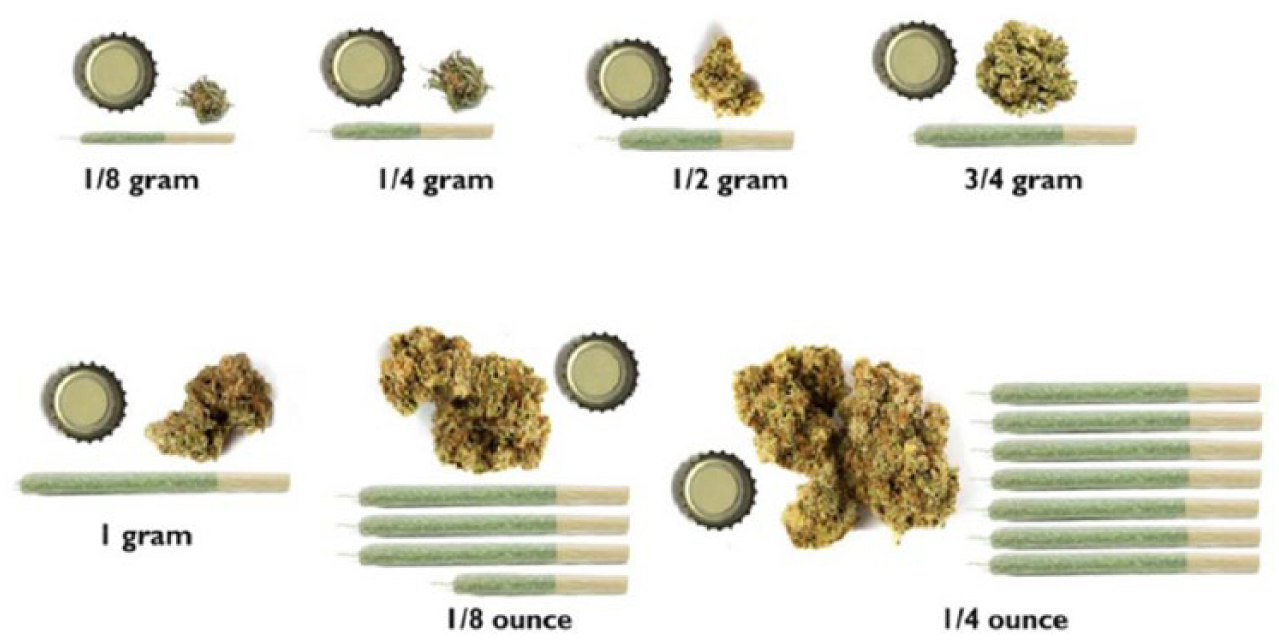
Three of four participants found it easy to determine how much marijuana liquid they had vaped in the reference period, whereas all five who had used tinctures had difficulty determining the amount they had used. Reasons included not knowing the size of the bottle they had purchased, not knowing the amount contained in a single drop or a syringe, and infrequency of use. Regarding the reference image shown for these questions (Figure 2), participants noted that an image of a prefilled cartridge would have facilitated their estimate, while others suggested using a reference object for scale and/or indicating the number of mL per drop/syringe. The reference image was updated to include both a cartridge and the conversion from drops to milliliters.
Reference image associated with the following two questions: “In (a usual day/week/month/past 12 months), how much marijuana liquid did you vape?” and “In (a usual day/week/month/past 12 months), how much liquid concentrate in the form of tinctures (e.g., concentrated amounts ingested orally or taken under the tongue) did you use?”
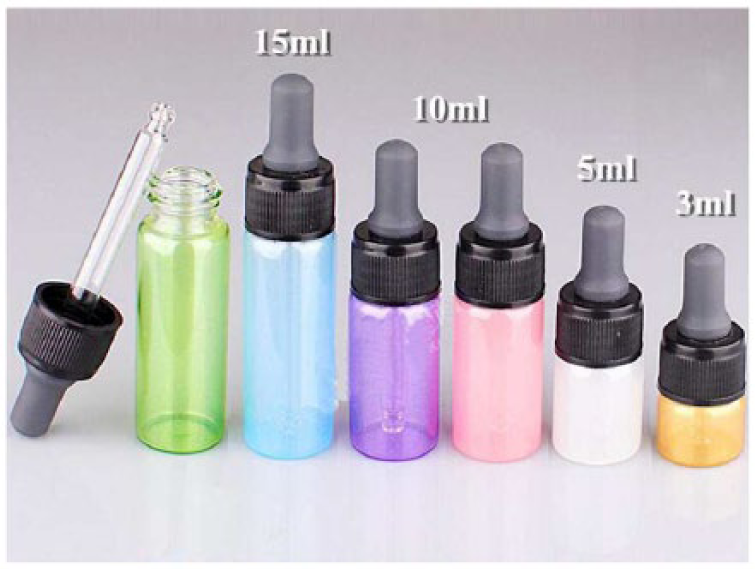
Four of six participants found it easy to determine how much hash they had used in the reference period, and all six understood the reference image (Figure 3), although two noted that the hash should be lighter in color. Whereas two of three participants found it easy to determine the amount of hash oil they had used, the six participants who had used concentrates were divided in terms of ease of ability to report the amount used.
Reference image associated with the question, “In (a usual day/week/month/past 12 months), how much marijuana hash or hashish did you use?”
There was no consensus on the ability to interpret the reference image for concentrate questions (Figure 4). Participants noted the varying consistency of concentrate, lack of familiarity with the product’s visual appearance, and limits of the 2-D image (which does not indicate the thickness of the product) as barriers to using the reference image. In the updated survey, a bottle cap was added to both reference images for scale, and equal quantities of several different types of concentrate were added to the image to improve recognizability.
Reference image associated with the following two questions: “In (a usual day/week/month/past 12 months), how much hash oil did you use?” and “In [a usual day/week/month/past 12 months], how much concentrate (e.g., Butane honey, shatter, budder, etc.) did you use?”
Participants were divided in terms of the ease of reporting the number of edible cannabis products they had consumed. Two participants noted that the edible they had consumed contained multiple “doses” (e.g., a packet of gummies or a brownie cut into pieces and consumed on separate occasions). Two out of three participants found it easy to report the amount of topical product they had used; the third indicated not knowing how to quantify “a palmful.” These questions were updated to reduce subjectivity. For example, because edible products vary considerably in size, packaging, and dosage, the final survey asks how many times the respondent consumed edible products (rather than the quantity) within a reference period.
None of the participants had consumed beverages containing cannabis or used fresh flower for juicing. One participant noted having used cannabis mixed with tobacco in a bong (a form of use colloquially known as “Poppers”), which they considered different from the response option provided (“mixed/rolled with tobacco—e.g., a blunt”). A question regarding the proportion of dried herb smoked with tobacco, without tobacco, vaped, or “other” was added to the survey.
“Medical” Versus “Nonmedical” Cannabis Use
When asked whether they had used or tried cannabis for medical purposes, there was some lack of clarity as to the intended definition of “medical purposes.” Eight participants considered “medical use” to include the use of nonlicensed or approved medical cannabis. Common reasons included “self-medication,” such as treating symptoms, relieving stress/anxiety, or improving sleep. All participants provided similar definitions for the phrase “authorized by a licensed physician” (i.e., needing a card/license/verbal approval/prescription from a physician to access cannabis for medical purposes), confirming the clarity of this phrase. When asked to define the terms acute pain and chronic pain (reasons for medical cannabis use), all participants could define “chronic pain,” whereas four had to guess the definition of “acute pain”; these response options were collapsed into “pain” in the final survey. When asked whether they had used cannabis to manage/improve emotional or mental health issues, interpretations of the term emotional or mental health varied considerably, from less to more severe issues (e.g., “feeling sad” vs. “schizophrenia”), indicating ambiguity. This subjective yes/no question was replaced with a multiple-choice question that includes a list of specific mental health issues as response options.
Cannabinoids
Participants generally did not know the amount of THC (seven of 10 participants) or CBD (nine of 10 participants) in the dried cannabis they used. Questions were added to the final survey in which respondents select the ratio of THC to CBD in each form of cannabis typically used (e.g., “High THC, Low CBD”); respondents then indicate THC and CBD amounts, if known, in a subsequent question.
Discussion
The current study represents one of the most comprehensive efforts to date to refine survey measures for assessing cannabis use. As the legal framework for both medical and nonmedical cannabis evolves, there is a greater need for population-based methods to monitor changes in cannabis use. This is particularly important as the emphasis in many jurisdictions transitions from a “prohibitionist” message to one of “responsible” cannabis use, which requires more nuanced measures of consumption.
An increasing number of surveys seek to discriminate between “medical” and “nonmedical” use. Cognitive interviews highlighted that many “nonapproved” users nevertheless report using cannabis for therapeutic purposes, consistent with other Canadian literature (Hamilton, Brands, Ialomiteanu, & Mann, 2017). Therefore, in jurisdictions where medical cannabis is legal, surveys should consider assessing both “approved” status for using medical cannabis and the use of “nonmedical” cannabis for therapeutic reasons. This is particularly important given that a wide range of factors, including stigmatization and regulatory barriers, may limit whether an individual seeks official approval for medical cannabis (Bottorff et al., 2013; Satterlund, Lee, & Moore, 2015).
The findings also highlight the importance of providing images and visual cues when assessing consumption amounts. Cannabis is consumed in an increasing variety of forms. In addition, in markets where it remains illegal, cannabis is often purchased in unlabeled packaging, without explicit references to amounts. Results of our cognitive interviews suggest that providing images of different amounts is helpful and may enhance reporting accuracy, particularly with respect to consumption of dried herb.
The majority of participants did not know the amounts of THC or CBD in the products they used. This reflects the lack of product labeling in the current cannabis market. A higher level of awareness might be expected among approved medical cannabis users who purchase from “licensed” producers. Increased awareness of cannabinoid levels (and other product information) is also expected following legalization of recreational cannabis in Canada, as the Cannabis Act requires THC and CBD labeling on packages (Government of Canada, 2018b). To determine whether this labeling is effective and understandable, inclusion of survey questions on THC/CBD levels will continue to be necessary following legalization.
Results of the study also indicated that the ease of recalling information on use and purchasing of cannabis varies by product type and context of use. Difficulties with recall and estimation were most common for forms of cannabis used infrequently and those prepared by or shared with others, as well as among participants with inconsistent patterns of use. In addition, participants indicated that their frequency of use varies, which suggests that it may be helpful to provide participants with a choice of reference period for reporting consumption, such as allowing participants the option of reporting consumption for daily, weekly, or monthly time periods. This may be particularly true for those who use cannabis less than monthly—which accounts for 36% of cannabis users in Canada (Health Canada, 2017).
Finally, it is important to acknowledge that, unsurprisingly, responses to some interview questions were mixed. In these situations, the researchers based their decisions about whether/how to modify survey items on theory/past research, intended meaning or aim of the question, and/or past experience developing survey measures. For example, half of participants asked indicated that the amount of cannabis they purchase tends to vary; however, the researchers decided to retain questions on “last purchase,” as this is a valid measure used widely in tobacco research (National Research Council & Institute of Medicine, 2015). In other cases, questions or phrases with a wide range of interpretations in cognitive interviews were restructured or removed from the survey altogether. This is a subjective process and the researchers therefore urge survey developers to (a) qualitatively pretest new survey items to identify hidden issues, and (b) refer to previous research on related substances or topics when aiming to modify problematic items.
Strengths and Limitations
This study had several strengths. First, the use of cognitive interviewing addressed silent misinterpretation of questions and highlighted issues with question wording or response options (e.g., ambiguity of the term a short drive). Second, in comparison with the pure “think aloud” method, the use of scripted verbal probing helped keep participants on track and involved little participant training (Willis, 2005). This was considered an appropriate method of evaluation for the current survey, which mainly focused on objective responses (such as frequency of cannabis use and consumption amounts), and maintained an investigative focus on specific areas of the survey (Willis, 2005). Third, when developing the survey tested herein, we attempted to improve upon other recent measures of cannabis consumption. For example, building upon the efforts made by Cuttler and Spradlin (2017), we included expanded lists of response options for cannabis amounts and forms of use, and included a more widely recognizable object (bottle cap) for scale in our reference image.
The study was not without limitations. First, we used a convenience sample of 10 participants, as samples of five to 15 participants are common in cognitive interview studies (Willis, 2005). We feel that this sample was sufficient to reveal common issues with the survey measure, as repeat responses arose for several questions. Nevertheless, given that most participants were young, well-educated adults (average age = 24.6 years, 80% university educated), results may have differed substantially in a larger, more diverse sample, or among noncannabis users. Second, issues of reflexivity and interviewer bias are relevant in qualitative analysis (Miller et al., 2014). Thus, to address the authors’ research bias (i.e., interest in population health), all possible efforts were made to avoid leading questions that would suggest preconceived ideas or anticipated issues with the survey measure. Third, survey probes were developed a priori, making it possible that certain ideas were missed due to the semi-structured interview setting. Finally, as recreational cannabis use was not yet legal in Canada at the time of the study, issues related to sensitive content and/or social desirability bias may have emerged. However, participants were given verbal and written assurance that their responses would not be used as evidence of their cannabis use.
Conclusion
The current study highlights several important principles that should be adopted when assessing cannabis use in population-based studies, particularly with respect to assessing “medical” vs. “nonmedical” use, purchasing sources, and consumption of different forms of cannabis. The findings have been used to adapt the survey measure for use in the International Cannabis Policy Study (Hammond et al., 2018). As a direct result of cognitive interviewing, reference images were updated and numerous survey items were modified to ensure comprehension and inclusivity of response options. The authors recommend the use of cognitive interviewing to health researchers wishing to examine and improve understanding of survey measures. More comprehensive measures such as the survey tested herein will be required to adequately evaluate the impact of health policy changes, such as the legalization of nonmedical cannabis in Canada, and regular qualitative testing of surveys will be valuable for the adaptation of measures and/or reference images as the legal retail market develops in Canada and various U.S. jurisdictions.
Supplemental Material
Supplementary_File_1 – Supplemental material for Methods to Assess Cannabis Consumption in Population Surveys: Results of Cognitive Interviewing
Supplemental material, Supplementary_File_1 for Methods to Assess Cannabis Consumption in Population Surveys: Results of Cognitive Interviewing by Samantha Goodman, Cesar Leos-Toro and David Hammond in Qualitative Health Research
Footnotes
Authors’ Note
All participants provided written, informed consent to publication of study results. The data sets used and/or analyzed during the current study are available from the corresponding author on reasonable request.
Ethical Approval
The study was reviewed by and received clearance from the University of Waterloo Office of Research Ethics (ORE No. 21786). All participants provided written, informed consent before participating in the study.
Declaration of Conflicting Interests
The authors declared no potential conflicts of interest with respect to the research, authorship, and/or publication of this article.
Funding
The authors disclosed receipt of the following financial support for the research, authorship, and/or publication of this article: This study was supported by a Canadian Institutes of Health Research (CIHR) Project Bridge Grant (PJT-153342). Additional support was provided by a CIHR Research Chair in Applied Public Health (Hammond).
Supplemental Material
Author Biographies
References
Supplementary Material
Please find the following supplemental material available below.
For Open Access articles published under a Creative Commons License, all supplemental material carries the same license as the article it is associated with.
For non-Open Access articles published, all supplemental material carries a non-exclusive license, and permission requests for re-use of supplemental material or any part of supplemental material shall be sent directly to the copyright owner as specified in the copyright notice associated with the article.