
Abstract
Background:
Chronic iodine excess is associated with increased serum thyrotropin (TSH) levels. We assessed the independent and interactive effects of iodine-excess transition outcomes and aging on TSH levels over 20-year follow-up.
Methods:
The original prospective cohort study started in 1999 and focused on three communities in North China (n = 1176). Based on the iodine status transition over the 20-year period, the euthyroid participants were categorized into groups according to urinary iodine concentrations (UIC): continuous iodine sufficiency (UIC 100–299 μg/L) (SI–SI, n = 261), from iodine excess (UIC >299 μg/L) to iodine deficiency (UIC <100 μg/L) (EI–DI, n = 145), from iodine excess to iodine sufficiency (EI–SI, n = 530), and continuous iodine excess (EI–EI, n = 240), respectively.
Results:
During 1999–2004, the baseline median TSH levels were positively associated with the initial UIC levels. After 20 years, for participants with negative thyroid antibodies, the three iodine-excess groups all exhibited elevated median TSH levels (SI–SI 1.81 mU/L vs. EI–DI 2.19 mU/L vs. EI–SI 2.08 mU/L vs. EI–EI 2.01 mU/L), an increased prevalence of mild subclinical hypothyroidism (SCH) with TSH <10.0 mU/L (SI–SI 5.3% vs. EI–DI 11.2% vs. EI–SI 12.3% vs. EI–EI 9.4%) and reduced central thyroid hormone sensitivity compared with the SI–SI group (p < 0.05). However, the EI–EI group had the lowest TSH rising degree (SI–SI 0.32 mU/L [24.57%] vs. EI–DI 0.47 mU/L [24.56%] vs. EI–SI 0.45 mU/L [37.52%] vs. EI–EI 0.21 mU/L [14.18%], p < 0.05). Repeated-measures analysis revealed that aging was primarily related to a stable increase in TSH. Iodine-excess transition outcomes were also associated. Furthermore, a significant interaction effect existed between aging and different iodine-excess transition outcomes, modulating the TSH rising degree. Alleviation of iodine excess promoted aging-related TSH elevation, whereas persistent iodine excess suppressed aging-related TSH elevation. However, among participants with positive thyroid antibodies, no significant interaction effect above was observed. By comparison, there was a greater prevalence of SCH, especially an obvious high prevalence of severe SCH under persistent iodine excess.
Conclusions:
Elevated TSH levels induced by chronic iodine excess cannot be downregulated by reducing iodine intake. In nonautoimmune contexts, an interaction effect between iodine status and aging synergistically modulates the TSH rising degree. Iodine excess contributes to mild SCH and is correlated with high baseline TSH levels.
Keywords
Introduction
China’s implementation of the universal salt iodization (USI) policy for more than two decades has successfully eliminated iodine deficiency disorders.1–3 However, the prevalence of subclinical hypothyroidism (SCH) increased from 3.21% in 1999 to 12.93% in 2019.3–5 Chronic iodine excess is associated with increased serum thyrotropin (TSH) levels.3,6–9 A similar situation of elevated TSH levels has been reported in the high-iodine-intake nation, South Korea. 10 Globally, chronic iodine excess has become an emerging public health concern.11–17
A 20-year prospective follow-up study in China revealed that changing the iodine status from excess to more than adequate did not improve the SCH incidence density. Despite a significant decrease in urinary iodine concentrations (UIC) in the former iodine-excess areas, the cumulative incidence of SCH (8.8%) remains significantly greater than that in iodine-sufficient areas (6.0%) or in iodine-deficient areas (1.9%). 18 Furthermore, the hypothalamic–pituitary–thyroid axis undergoes an upward shift in the TSH set-point to adapt to physiological changes during the aging process, resulting in an age-dependent increase in TSH levels.19–24 Consequently, both aging and iodine excess contribute to elevated serum TSH levels. Whether these two factors exhibit synergistic effects remains to be elucidated.
A prospective 20-year follow-up was conducted in this study. The iodine-sufficient cohort served as the control group and experienced only the aging effect for 20 years. We assessed the independent and interactive effects of persistent excessive iodine intake, excess-iodine correction, and physiological aging on serum TSH levels.
Materials and Methods
Study design and study population
As previously described, three rural communities with different iodine intake were selected for a long-term follow-up study in 1999.4,18,25,26 Panshan, Zhangwu, and Huanghua were identified as regions with insufficient iodine, adequate iodine, and excessive iodine, respectively. During 1999–2004, residents in Panshan traditionally consumed locally produced salt with low iodine content (<3.4 mg/kg), residents in Zhangwu utilized iodized salt, and residents in Huanghua consumed drinking water with high iodine content (96–228 µg/L). 4 After 2004, the government implemented targeted policies to optimize iodine nutrition, including the introduction of iodized salt in Panshan to correct iodine deficiency and the provision of noniodized salt along with improvements to the local water supply in Huanghua to mitigate iodine excess. By 2019, the median UIC in Panshan, Zhangwu, and Huanghua was 141.9, 167.2, and 266.7 µg/L, respectively. 18
At the beginning of the epidemiological survey in 1999, a two-stage cluster sampling method was used to select participants. In the first stage, three different iodine status regions were selected from North China, and in the second stage, samples of individuals were randomly selected from each of the selected regions. 27 Participants aged ≥14 years and living in the community >10 years were included. Pregnant women and those who were using oral contraceptives were excluded. Each participant completed an oral questionnaire, and their urine and blood samples were collected after an overnight fast. Palpation and B-mode ultrasonography of the thyroid were performed. Initially, 3761 participants were included in 1999. The same protocol was utilized in 2004 and 2019 for local follow-up.4,18,25,26 Owing to residential relocation and migrant work, attrition occurred among Panshan (35.2%), Zhangwu (35.2%), and Huanghua (33.5%). 18 Eventually, 2081 original participants were followed up successfully in 2019.
To explore the associations between iodine-excess transitions and TSH levels accurately, we further excluded participants who met the following conditions: during the initial 1999 assessment, who had an iodine-deficient status or identified thyroid dysfunction; in the 2019 follow-up, who were experiencing overt hyperthyroidism or overt hypothyroidism; currently using iodine-containing medications or levothyroxine; or underwent iodinated contrast agents within the preceding 3 months; had a history of thyroid carcinoma, thyroid adenoma, or prior thyroidectomy.
In our study, the World Health Organization classification was utilized to assess iodine status (Table 1). Iodine-sufficient status (UIC 100–299 μg/L) was defined by combining the categories of adequate iodine and more-than-adequate iodine owing to the nonsignificant differences in the prevalence of various thyroid disorders between these two statuses. 3
Iodine Nutrition Status and Diagnostic Criteria for Thyroid Dysfunctions
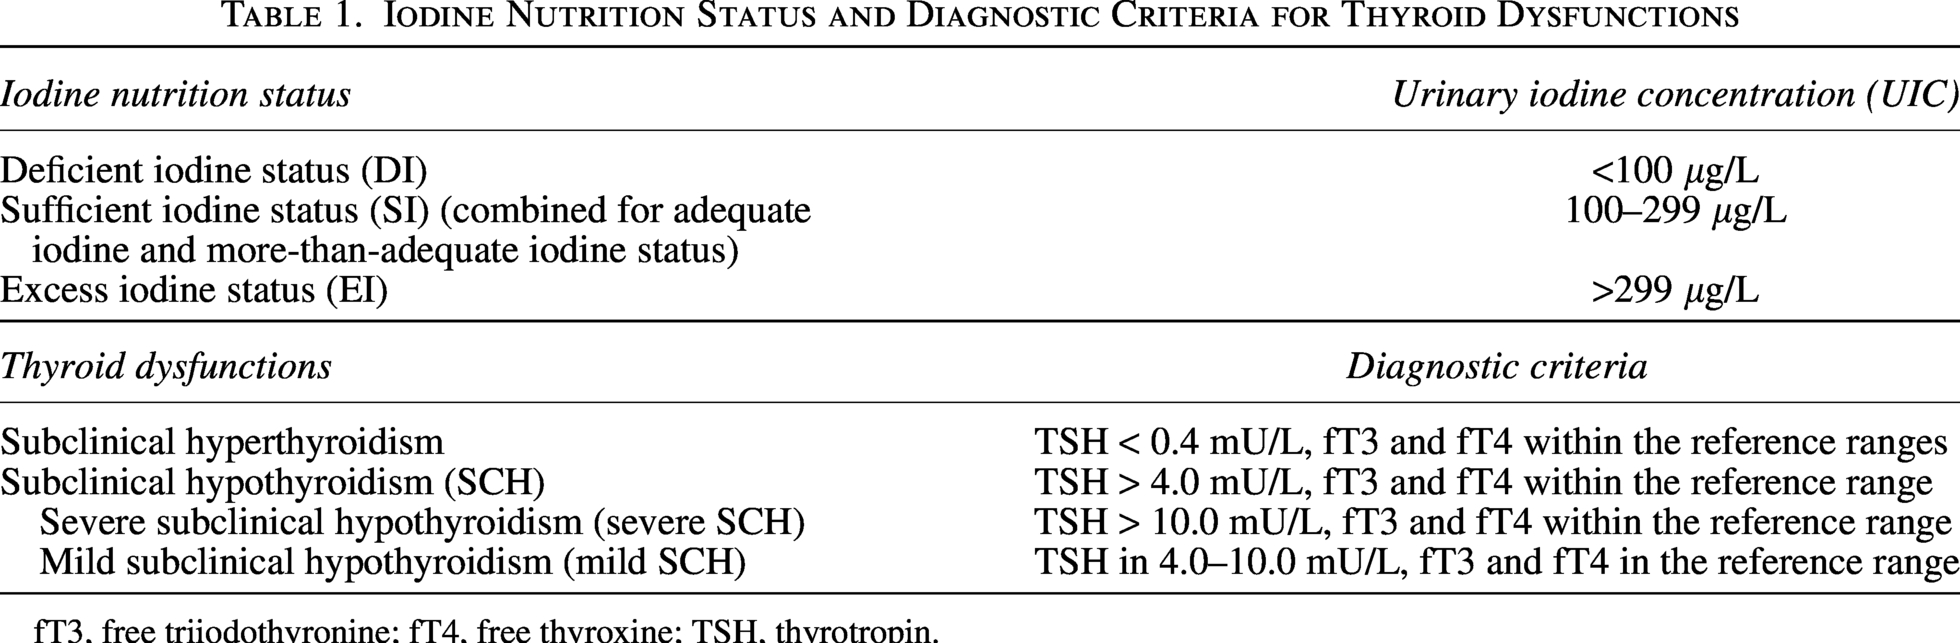
fT3, free triiodothyronine; fT4, free thyroxine; TSH, thyrotropin.
Ultimately, 1176 individuals were included. Based on their iodine status trajectory over the 20-year period, participants were categorized into groups: continuous iodine sufficiency (SI–SI, n = 261), from iodine excess to iodine deficiency (EI–DI, n = 145), from iodine excess to iodine sufficiency (EI–SI, n = 530), and continuous iodine excess (EI–EI, n = 240). The participant enrollment process is detailed in Figure 1.

Participant flow diagram.
Research protocols were approved by the institutional review board of the First Hospital of China Medical University (IRB [2019]122) in accordance with the 2024 Declaration of Helsinki. All participants provided written informed consent after receiving a detailed explanation of the research procedures.
Laboratory methods
With respect to thyroid function tests, chemiluminescence immunoassays were consistently used for measurements at baseline (Immulite 2000, Diagnostic Products Corp.) and during follow-up (Immulite 2000XPi, Siemens). The same reference ranges provided by the kits were applied for serum TSH, free thyroxine (fT4), and free triiodothyronine (fT3), which were 0.40–4.0 mU/L, 10.4–24.5 pmol/L, and 2.3–6.3 pmol/L, respectively.
Thyroid antibodies were also tested by chemiluminescence immunoassays. To ensure the accuracy and comparability of the test results, our laboratory-specific cutoff values were employed instead of the manufacturer’s reference ranges. 28 Throughout the survey, thyroid peroxidase antibody (TPOAb) level >50 IU/mL and thyroglobulin antibody (TgAb) >40 IU/mL were considered positive, in accordance with our previously established and reported criteria.4,18,25,26
With respect to UIC, the colorimetric ceric ion–arsenious acid ash method and inductively coupled plasma–mass spectrometry were used at baseline and follow-up, respectively. The test results of these two methods are directly comparable.29,30
Diagnostic criteria for thyroid diseases
The diagnostic criteria for thyroid disorders are presented in Table 1. 31
Statistical analyses
Statistical analyses were performed using IBM SPSS Statistics 29. All reported p values are two-sided, with p < 0.05 considered statistically significant. The characteristics of the participants are presented as numbers (proportions) for qualitative variables and as either medians (interquartile ranges, IQRs) or means ± standard deviations (SDs) for quantitative variables. The Shapiro–Wilk test was used to evaluate normally distributed data. To analyze the differences among the groups, continuous variables were compared by using one-way analysis of variance or the Kruskal–Wallis H test. Bonferroni correction was applied to all multiple comparisons. For categorical variables, the chi-square test or Fisher’s exact test was used to conduct group comparisons.
The thyrotroph thyroxine resistance index (TT4RI) was used to evaluate central thyroid hormone sensitivity intuitively and was calculated as fT4 (pmol/L) × TSH (mU/L). Higher TT4RI values indicate lower central thyroid hormone sensitivity. 32
The temporal change from 1999 to 2019 was represented as aging (ΔTime). The TSH elevation degree was calculated as follows:
TSH increase value = TSH in 2019 (mU/L) − TSH in 1999 (mU/L).
TSH increase rate = ([TSH in 2019 − TSH in 1999]/TSH in 1999) ×100%.
Biological age (BA) indicates an individual’s physiological aging status. 33 The calculation incorporated 13 biochemical parameters, which were strongly associated with chronological age (CA) during the aging process. 34 Biological age acceleration (BAA) was used to assess the rate of physiological aging 35 (Supplementary Tables S1 and S2 for data).
A generalized linear mixed model (GLMM) was employed to analyze factors influencing TSH elevation, including sex, body mass index (BMI), age, aging, and the four iodine-transition groups. 36 Repeated-measures analysis of variance (RM-ANOVA) was utilized to evaluate the effects of aging, urinary iodine-transition outcome, and their interaction term on TSH variations. Nonlinear associations between TSH rising degree and UIC in 2019 were analyzed using restricted cubic splines (RCSs) in R software. A β coefficient >0 signifies a positive correlation, whereas β < 0 indicates a negative correlation.
Results
Statistical and clinical characteristics
In total, 1176 participants with a mean age of 37 years were included. Basic clinical parameters and biochemical parameters, particularly CA, BA, and BAA in 2019, did not significantly differ across the four groups, indicating consistent degrees and speeds of aging over the 20-year period (Table 2 and Supplementary Table S1).
Baseline Characteristics of the Iodine Nutritional Transition Groups in the Whole Cohort
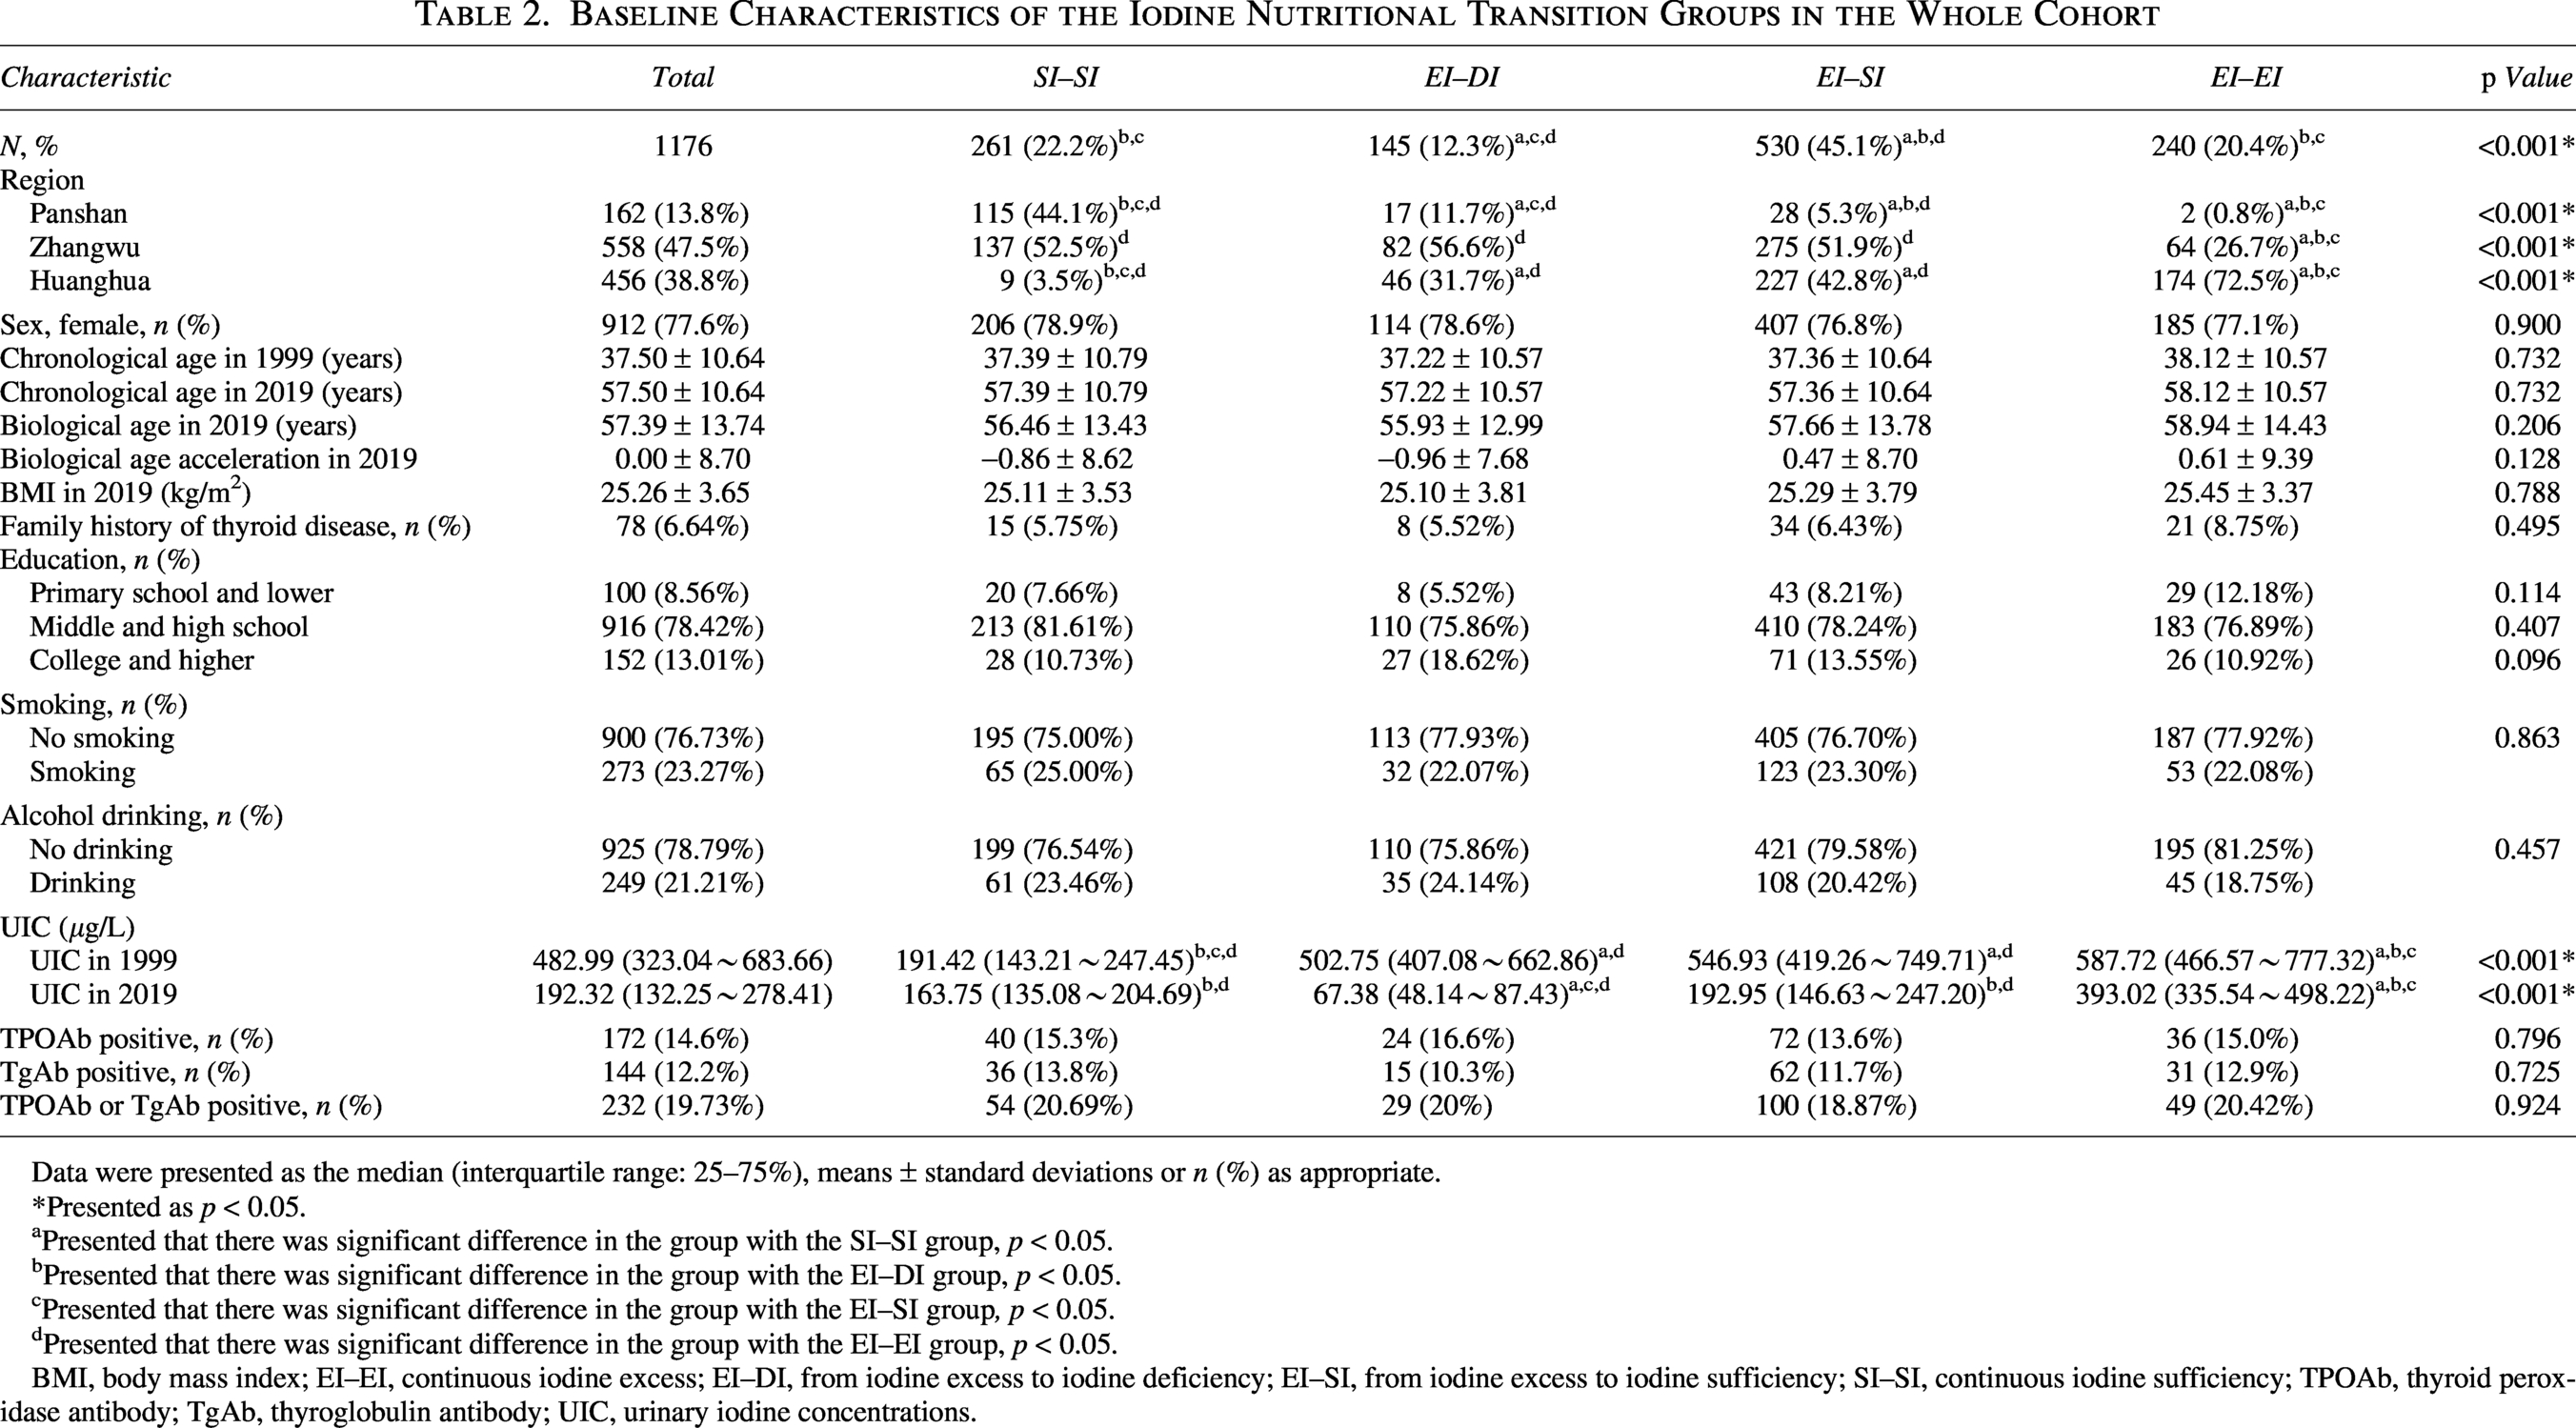
Data were presented as the median (interquartile range: 25–75%), means ± standard deviations or n (%) as appropriate.
*Presented as p < 0.05.
Presented that there was significant difference in the group with the SI–SI group, p < 0.05.
Presented that there was significant difference in the group with the EI–DI group, p < 0.05.
Presented that there was significant difference in the group with the EI–SI group, p < 0.05.
Presented that there was significant difference in the group with the EI–EI group, p < 0.05.
BMI, body mass index; EI–EI, continuous iodine excess; EI–DI, from iodine excess to iodine deficiency; EI–SI, from iodine excess to iodine sufficiency; SI–SI, continuous iodine sufficiency; TPOAb, thyroid peroxidase antibody; TgAb, thyroglobulin antibody; UIC, urinary iodine concentrations.
Part I: Iodine nutritional transitions and thyroid function over 20 years
Impact of iodine transitions on serum TSH levels
As shown in Table 3 and Supplementary Table S3, compared with the SI–SI group, the three original iodine-excess groups exhibited increased median UIC levels and median TSH levels at the 1999 and 2004 baseline (p < 0.05).
Iodine Transition Outcomes and Thyroid Function in Participants with TPOAb and TgAb Negative

Data were presented as the median (interquartile range: 25–75%), means ± standard deviations or n (%) as appropriate.
*Presented as p < 0.05.
Presented that there was significant difference in the group with the SI–SI group, p < 0.05.
Presented that there was significant difference in the group with the EI–DI group, p < 0.05.
Presented that there was significant difference in the group with the EI–SI group, p < 0.05.
Presented that there was significant difference in the group with the EI–EI group, p < 0.05.
SCH, subclinical hypothyroidism; TT4RI, thyrotroph thyroxine resistance index.
In 2019, the SI–SI group maintained the iodine-sufficient range (median UIC 163.75 μg/L), and the median UIC of the iodine-excess groups was converted to the following levels: EI–DI 67.38 μg/L; EI–SI 192.95 μg/L; and EI–EI 393.02 μg/L (Table 2).
With respect to participants with TPOAb and TgAb negative (TPOAb−&TgAb−), the median TSH levels increased in the three iodine-excess groups but did not significantly differ in 2019 (EI–DI 2.19 mU/L; EI–SI 2.08 mU/L; EI–EI 2.01 mU/L). All of these values were greater than those of the SI–SI group did (1.81 mU/L; p = 0.002). The fT3 and fT4 levels were consistent among the four groups (Table 3).
Among the participants with TPOAb or TgAb positive (TPOAb+/TgAb+), the three iodine-excess groups had higher median TSH levels than the SI–SI group did (SI–SI 2.10 mU/L; EI–DI 2.66 mU/L; EI–SI 2.57 mU/L; EI–EI 2.81 mU/L; p = 0.116), and all of them were higher than the participants with TPOAb−&TgAb− did in each group (Supplementary Table S3).
Impact of iodine changes on the prevalence of subclinical thyroid dysfunction
With respect to participants with TPOAb−&TgAb−, the overall prevalence of SCH in 2019 was 10.4%. The prevalence of severe SCH was low (0.3% overall), occurring in the EI–SI and EI–EI groups. In contrast, the prevalence of mild SCH was considerably greater (10.1% overall). The SI–SI group presented a significantly lower prevalence of mild SCH (5.3%) than the iodine-excess groups did (EI–DI 11.2%, EI–SI 12.3%, and EI–EI 9.4%; p = 0.049). The prevalence of subclinical hyperthyroidism was 0.7%, with no difference among the groups (Table 3).
Among the participants with TPOAb+/TgAb+, the overall prevalences of subclinical hyperthyroidism and SCH were separately 1.72% and 25.9%. Regarding severe SCH, the EI–EI group was the primary contributor, with an obvious high prevalence of 10.2%. For mild SCH, the excess-iodine groups had consistently higher prevalence rates (EI–DI 24.1%; EI–SI 22.0%; EI–EI 28.6%) than the SI–SI group did (14.8%). All of them were higher than the TPOAb−&TgAb− participants were (Supplementary Table S3).
Impact of iodine transitions on central thyroid hormone sensitivity
With respect to participants with TPOAb−&TgAb−, the SI–SI group had the lowest TT4RI value in 2019. However, the iodine-excess groups demonstrated elevated TT4RI values (SI–SI 24.43; EI–DI 30.08; EI–SI 27.04; EI–EI 25.92; p = 0.004), indicating that iodine excess reduced central thyroid hormone sensitivity (Table 3).
Among the participants with TPOAb+/TgAb+, the excess-iodine groups demonstrated higher TT4RI levels, particularly the EI–EI group did. Moreover, all these values surpassed those in the TPOAb−&TgAb− participants (Supplementary Table S3).
Part II: Iodine nutritional transitions and TSH elevations over 20 years
Comparison of the TSH rising degree among the four groups
Using the SI–SI group as the control group, which experienced only the effects of aging for 20 years, we compared the increased TSH values and rates in each group.
With respect to participants with TPOAb−&TgAb−, the median of TSH increase values in the EI–DI group (0.47 mU/L) and the EI–SI group (0.45 mU/L) were greater than those in the SI–SI group (0.32 mU/L) with no significant difference. Conversely, the EI–EI group exhibited the smallest increase—0.21 mU/L (p = 0.035). A similar pattern was also observed for the median of TSH increase rate. The increase rate in the SI–SI group was 24.57%, which was no different from those in the EI–DI group (24.56%) and the EI–SI group (37.52%). Conversely, the EI–EI group presented the lowest increase degree (14.18%, p = 0.014) after 20 years (Table 3 and Fig. 2).
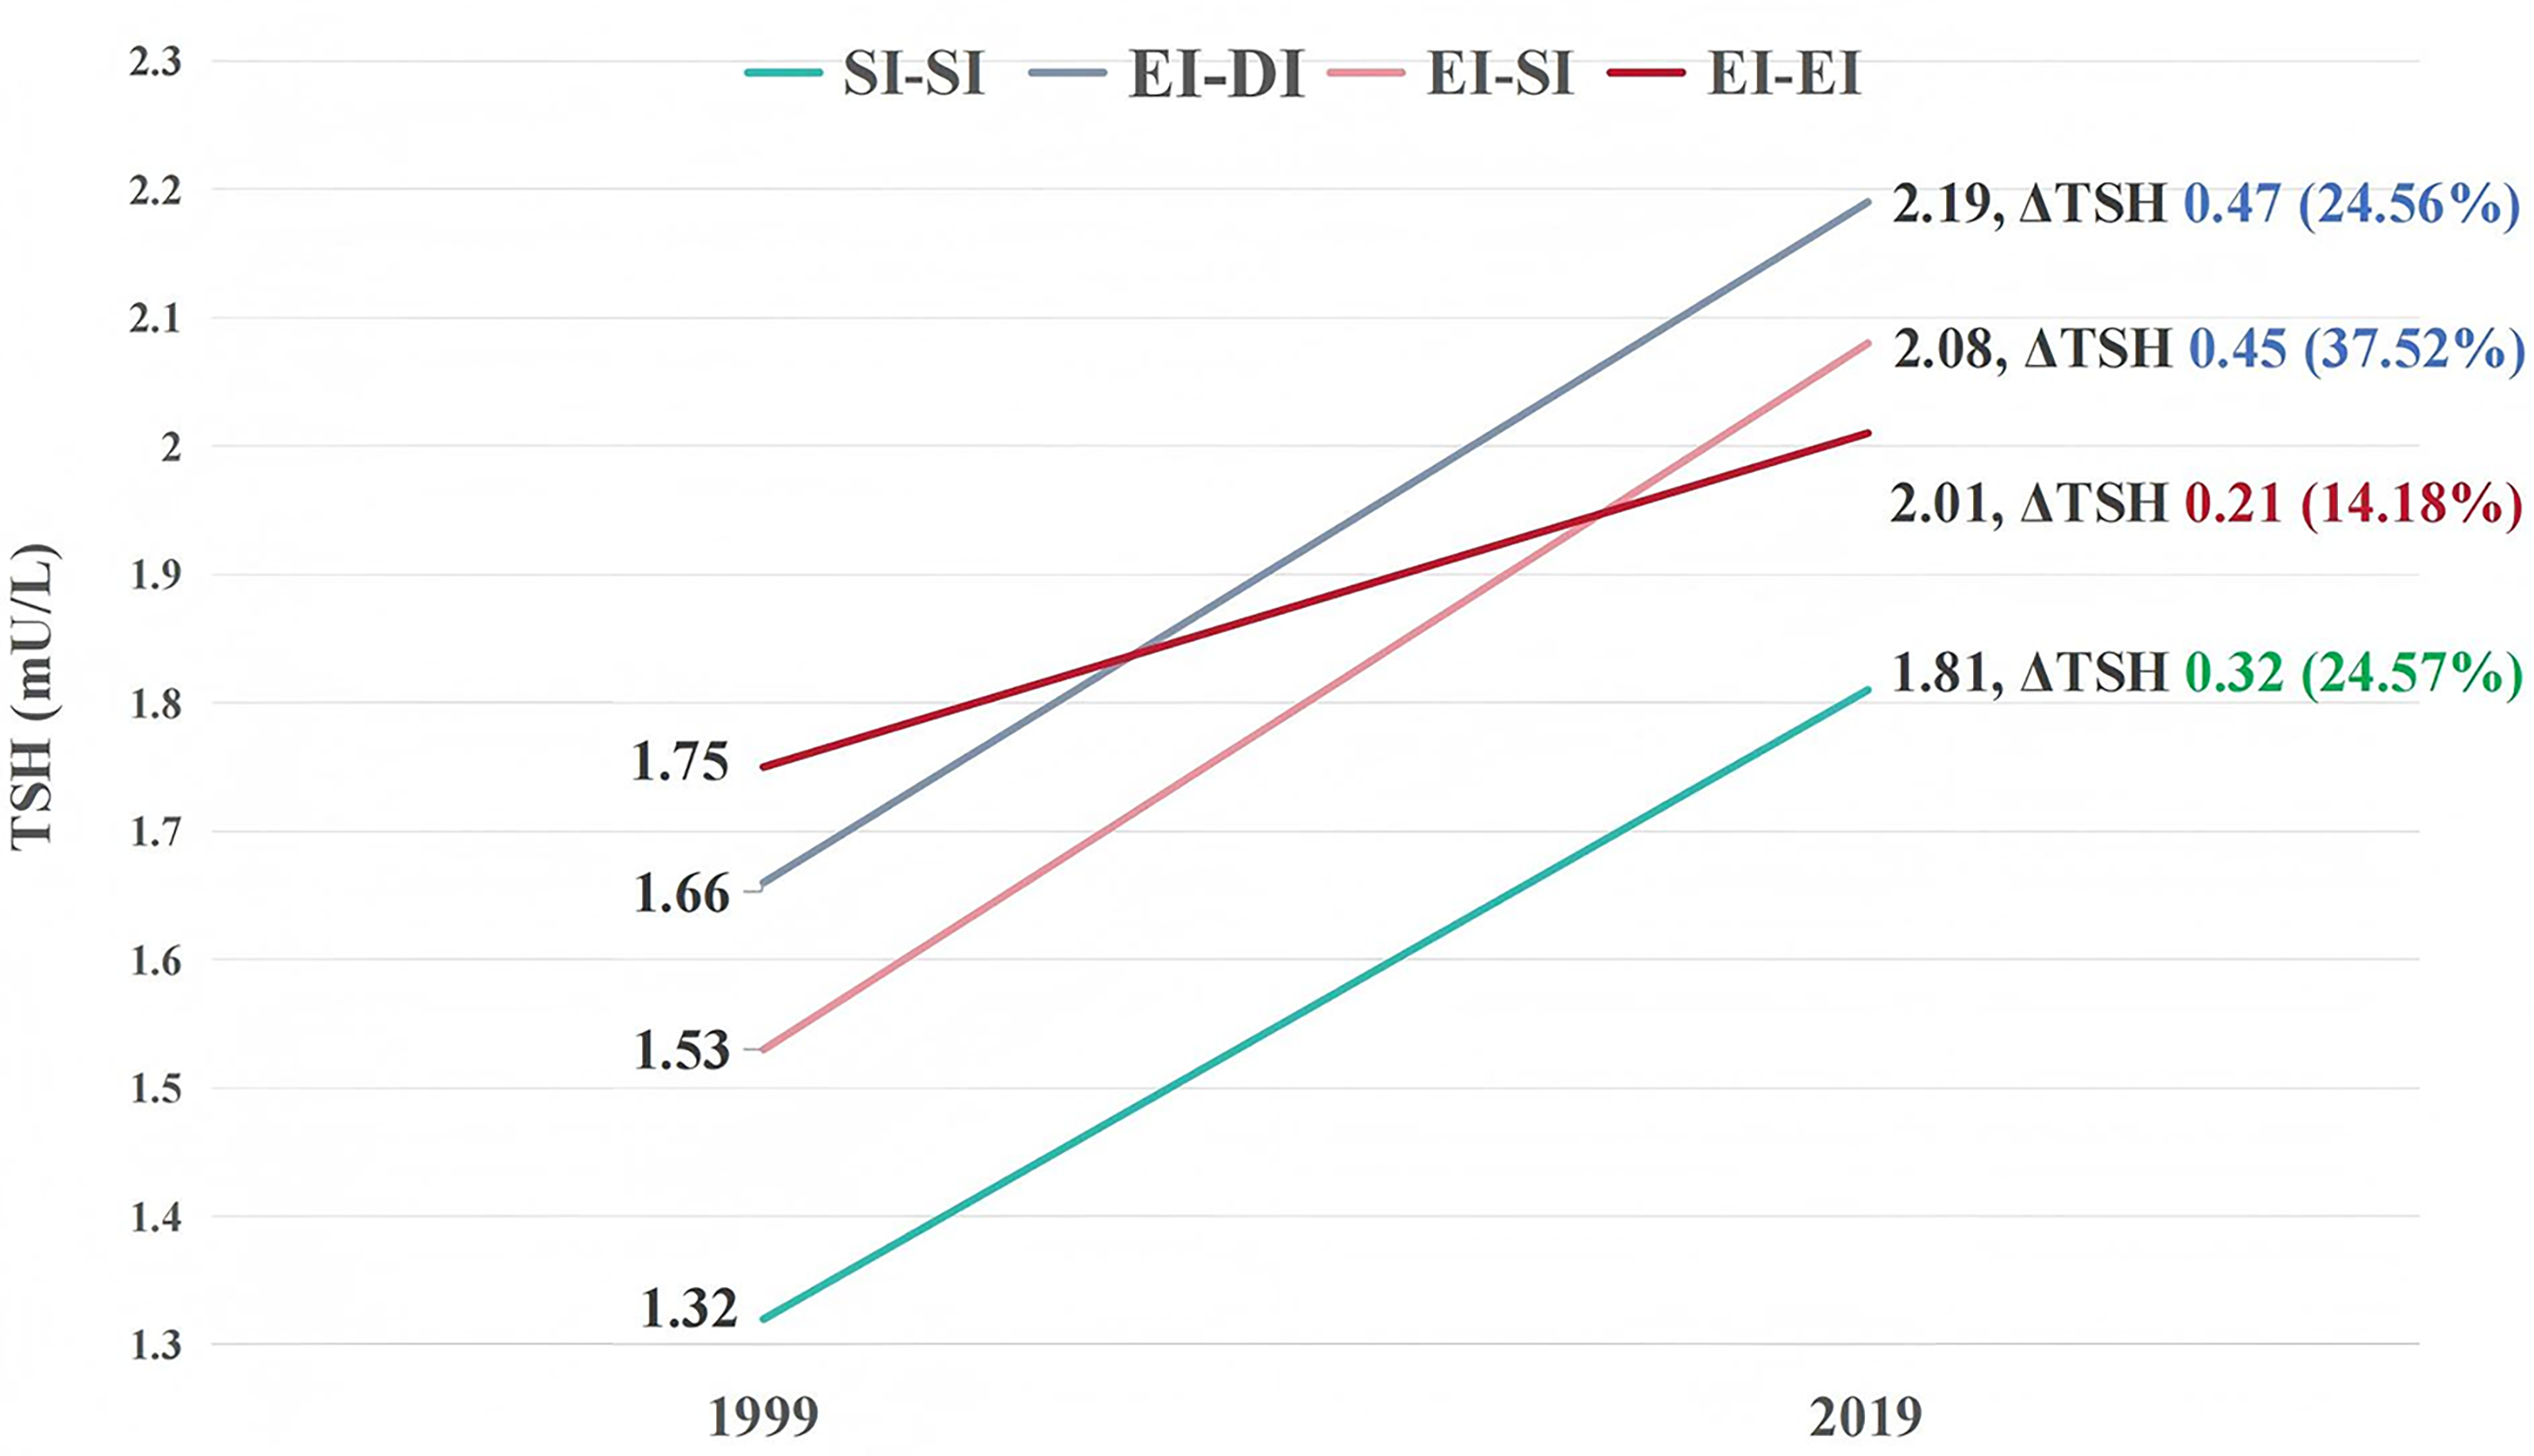
TSH elevations with TPOAb and TgAb negative in different iodine transition outcomes. TSH increase (ΔTSH) value = TSH in 2019 (mU/L) − TSH in 1999 (mU/L); TSH increase (ΔTSH) rate = ([TSH in 2019 − TSH in 1999]/TSH in 1999) ×100%. TgAb, thyroglobulin antibody; TPOAb, thyroid peroxidase antibody; TSH, thyrotropin.
Among the participants with TPOAb+/TgAb+, both the TSH increase values and rates exhibited considerable variability, and no consistent pattern with statistical meaning was observed among the four groups (Supplementary Table S3).
Factors associated with TSH elevation
With respect to participants with TPOAb−&TgAb−, a GLMM was employed to analyze factors associated with the TSH rising degree (Table 4). The analysis revealed sex, aging, and different iodine-transition outcomes as factors associated with the TSH rising degree (p < 0.001 for each). Furthermore, the effects of aging and iodine transitions were more significant in females (Supplementary Table S4).
Linear Correlation Analysis by Generalized Linear Mixed Model for Factors Related to TSH Elevation
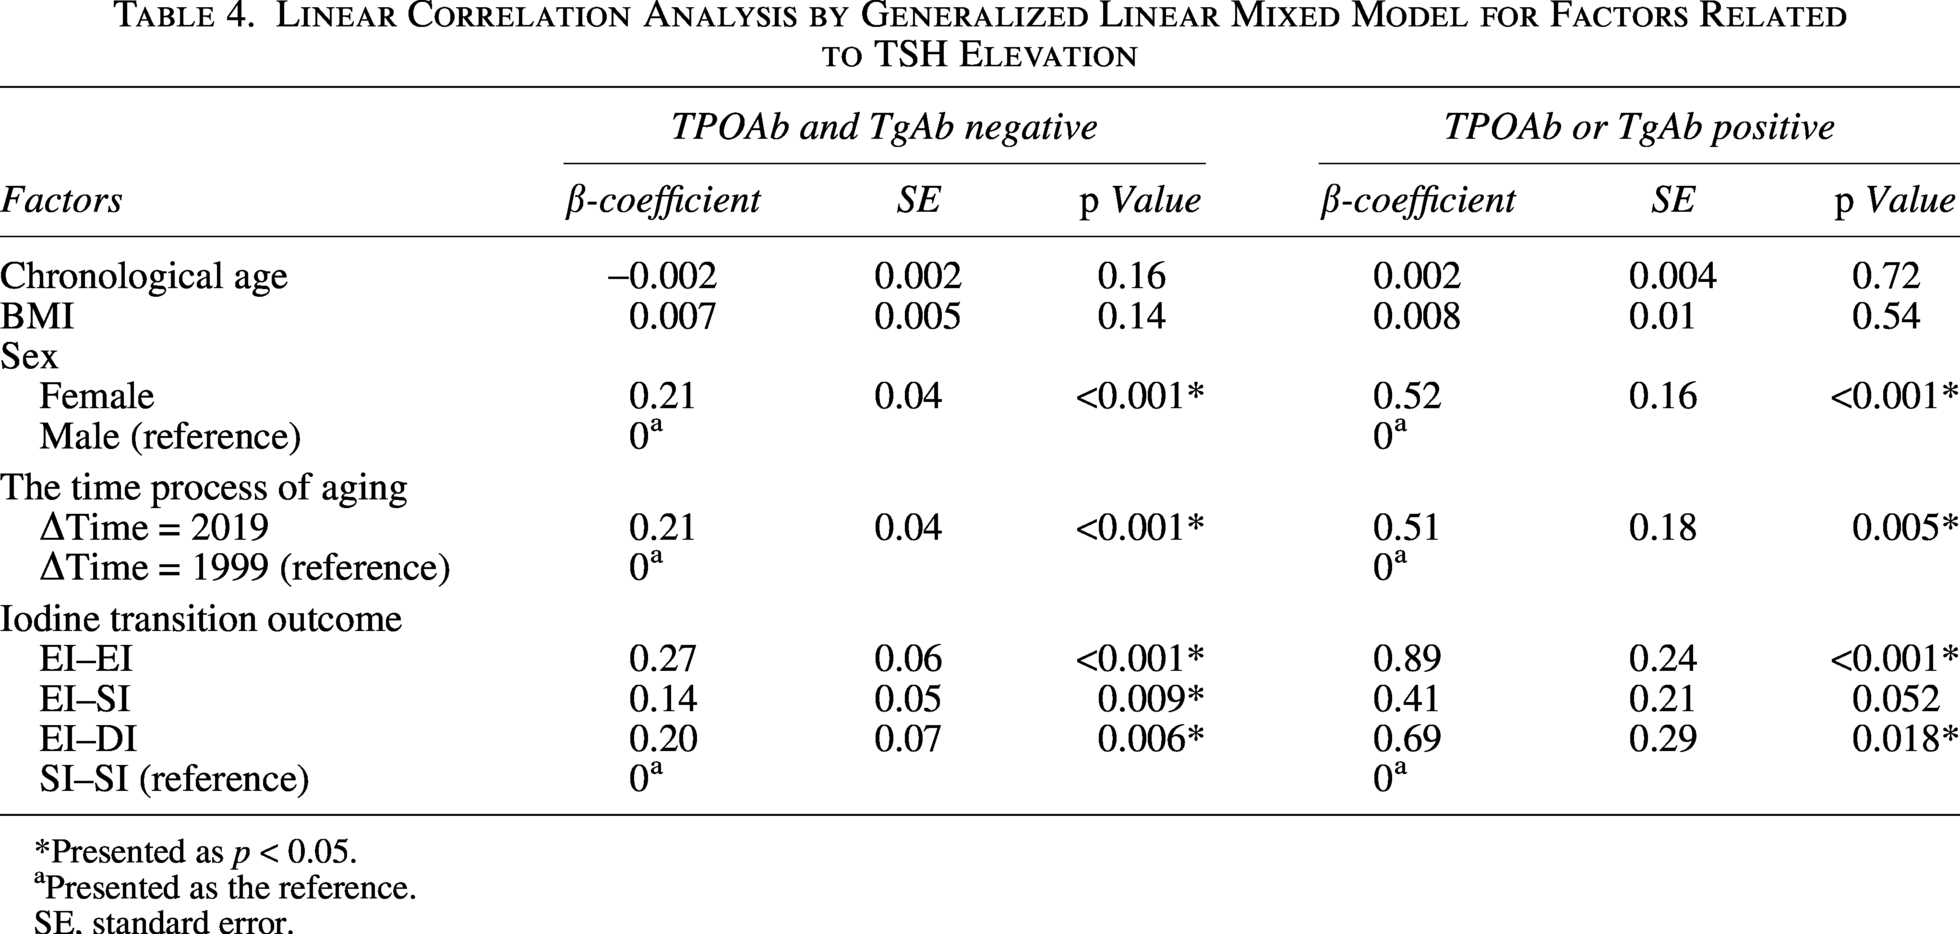
*Presented as p < 0.05.
Presented as the reference.
SE, standard error.
A similar pattern was also observed in the autoimmune participants (Table 4).
Interactive effect of aging and iodine-excess transitions on TSH elevation
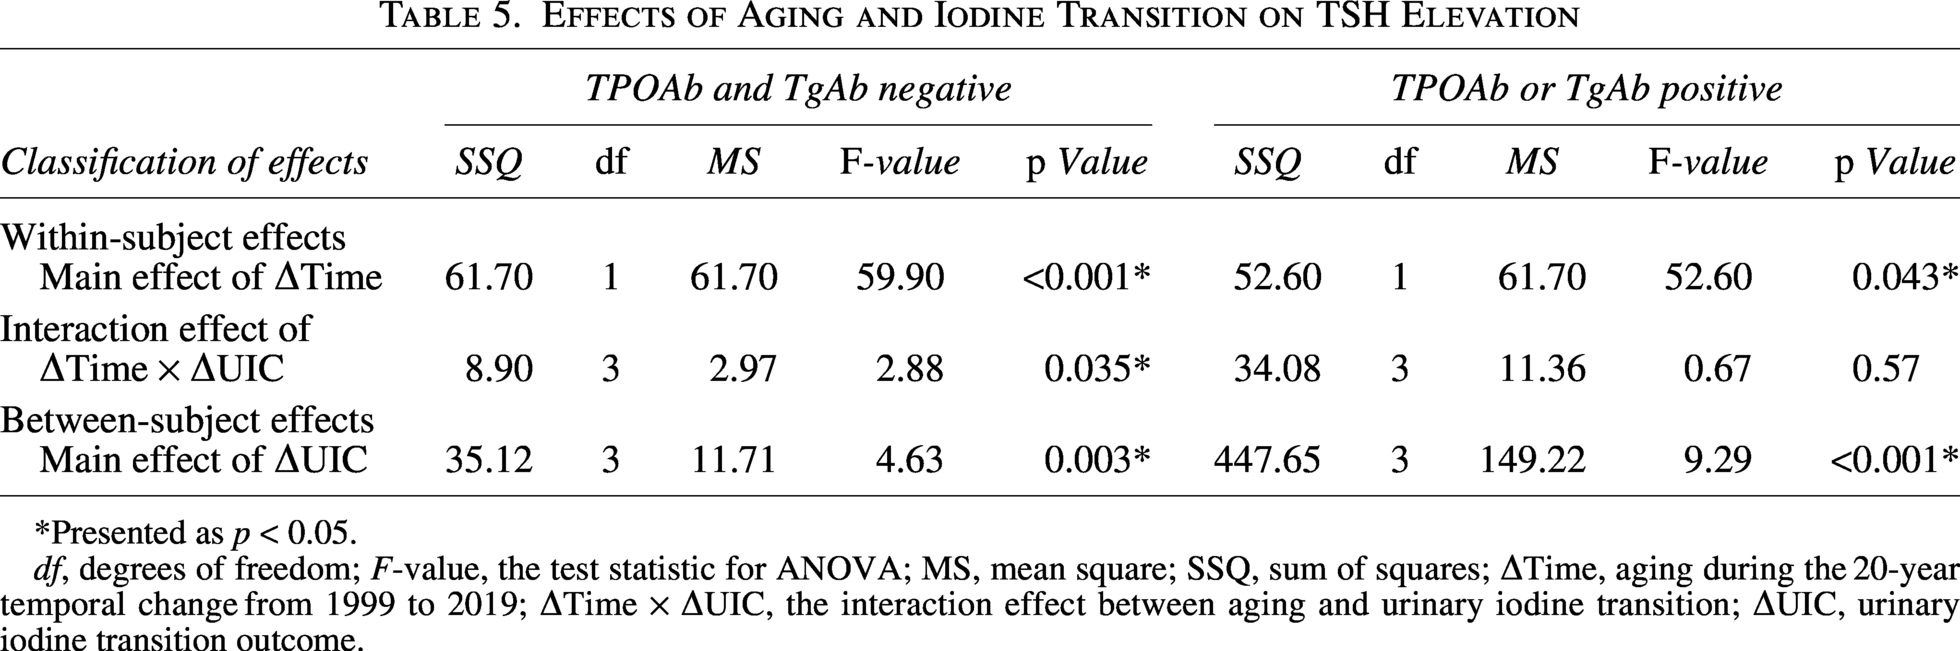
RM-ANOVA was used to assess the influence of aging (ΔTime) and the iodine-transition outcome (ΔUIC) on the TSH rising degree. The analysis further demonstrated that both aging and the iodine-transition outcome independently influenced TSH elevation in the TPOAb−&TgAb− participants and TPOAb+/TgAb + participants (p < 0.05 in Table 5).
Effects of Aging and Iodine Transition on TSH Elevation
*Presented as p < 0.05.
df, degrees of freedom; F-value, the test statistic for ANOVA; MS, mean square; SSQ, sum of squares; ΔTime, aging during the 20-year temporal change from 1999 to 2019; ΔTime × ΔUIC, the interaction effect between aging and urinary iodine transition; ΔUIC, urinary iodine transition outcome.
With respect to participants with TPOAb−&TgAb−, a significant interaction effect on the TSH rising degree was observed between aging and the iodine-transition outcome (ΔTime × ΔUIC, p = 0.035). F statistics were used to quantify the magnitude of the effect for each factor. Aging had the greatest value (ΔTime, F = 59.90), considered as the most important factor associated with the TSH elevation degree. The interaction term (ΔTime × ΔUIC, F = 2.88) and the iodine transition outcome (ΔUIC, F = 4.63) exhibited smaller F values. However, no certain interaction effects were observed in participants with TPOAb+/TgAb+ in Table 5 (ΔTime × ΔUIC, p = 0.57).
Impact of post-transition UIC levels in 2019 on TSH elevation
Further RCS analysis was performed to evaluate the relationships between UIC levels at the 20-year endpoint and the TSH increase rates in the combined iodine-excess groups (EI–DI, EI–SI, and EI–EI).
With respect to participants with TPOAb−&TgAb−, a significant nonlinear association was observed between the endpoint UIC and the TSH rising degree in Figure 3 (p < 0.05). When approximately UIC 200 μg/L was used as the threshold, the UIC was positively correlated with the degree of TSH elevation at UIC <200 μg/L (β > 0), indicating that the transition from initial iodine-excess to iodine-sufficient status or lower UIC levels could promote the TSH rising degree. Conversely, the UIC levels were negatively correlated with the degree of TSH elevation at UIC >200 μg/L (β < 0), indicating that persistent excess UIC levels could suppress the TSH rising degree. In the participants with TPOAb+/TgAb+, the pattern above was not significant (Supplementary Fig. S1).

Correlation between TSH elevation rates and the 2019 endpoint UIC levels in the TPOAb−&TgAb− participants with initial iodine-excess intake. Restricted cubic splines (RCSs) models were constructed to explore the dose–response relationships between the TSH change degree and the endpoint UIC levels with five knots. A significant overall association was observed between the two (p for overall = 0.046). Furthermore, the shape of the curve deviated significantly from a straight line, indicating a nonlinear relationship (p for nonlinear = 0.043). Red lines represent the TSH Change Rate β’ coefficient of Y-axis, and the shaded red area corresponds to the confidence intervals. If β > 0, it signified a positive correlation between the endpoint UIC levels and the TSH elevation degree; whereas if β < 0, it indicated a negative correlation. UIC, urinary iodine concentration.
Discussion
In this prospective study, the long-term effects of chronic iodine-excess transition outcomes on TSH elevations in euthyroid individuals were investigated. The follow-up period spanned 20 years, with participants having a mean age of 37 years in 1999. Assessment of CA, BA, and BAA revealed consistent degrees of aging across all four groups, establishing group comparability.
With respect to participants with TPOAb−&TgAb−, aging for 20 years induced a mild increase in TSH levels in the SI–SI group. The median TSH levels rose from 1.32 mU/L in 1999 to 1.81 mU/L in 2019. Within the iodine-excess groups, higher baseline TSH levels were positively correlated with higher baseline UIC levels. After 20 years, the iodine-excess groups transitioned to iodine deficiency (EI–DI), iodine sufficiency (EI–SI), or remained in a state of iodine excess (EI–EI), and their median TSH levels were 2.19 mU/L, 2.08 mU/L, and 2.01 mU/L, respectively, with no statistical differences among the groups. All of them were significantly greater than the SI–SI group did. We found that regardless of whether iodine excess decreased or not, the TSH elevation induced by chronic iodine excess failed to revert to baseline levels and was accompanied by an increased prevalence of mild SCH and a higher TT4RI value. However, no obvious increase in the prevalence of severe SCH or subclinical hyperthyroidism was observed.
The results demonstrated that aging was the primary factor driving the stable increase in TSH levels. Sex and iodine-transition outcomes also significantly influenced the TSH rising degree. Furthermore, an obvious interaction effect existed between iodine status and aging, reflecting the impact of iodine-excess transitions on aging-related TSH elevation with negative thyroid antibodies. When iodine excess was alleviated to UIC <200 μg/L, a mild promoting effect on aging-related TSH elevation was observed. Conversely, persistent iodine excess (UIC >200 μg/L) suppressed the aging-related TSH elevation. Consequently, the EI–DI and EI–SI groups separately exhibited increased TSH elevations of 0.47 mU/L (increase rate 24.56%) and 0.45 mU/L (increase rate 37.52%), marginally higher than the SI–SI group did (increase value 0.32 mU/L; increase rate 24.57%). In contrast, the EI–EI group demonstrated the lowest degree of TSH elevation (increase value 0.21 mU/L; increase rate 14.18%).
This longitudinal study revealed that, for euthyroid individuals without thyroid autoimmune diseases, despite the UIC levels in the original iodine-excess groups clearly decreasing after 20 years, with some even transitioning to iodine-deficiency status, serum TSH levels remained significantly higher than those in the iodine-sufficient group, accompanied by the central thyroid hormone sensitivity decreased and the TSH elevation irreversibly persisted. The overall prevalence of SCH was 10.4%, in which mild SCH accounted for the majority, with a significantly higher prevalence in the iodine-excess groups (EI–DI 11.2%; EI–SI 12.3%; EI–EI 9.4%) than the iodine-sufficient group did (SI–SI 5.3%). Therefore, chronic iodine excess mainly increases the risk of mild SCH, and this risk persists irrespective of whether the iodine-excess status is ameliorated. However, the prevalence of severe SCH, which can pose greater health risks, is relatively low—0.3%.37,38
This study confirms that aging is the predominant factor driving TSH elevation. Among the participants with TPOAb−&TgAb−, the progression from 37 to 57 years of age resulted in a mild increase in median TSH levels, from 1.32 to 1.81 mU/L, an absolute increase of 0.32 mU/L (increase rate 24.57%). This phenomenon aligns with the physiological pattern of aging-related TSH upregulation.19–24 Research by Alexandra P et al. in Australia similarly demonstrated this aging effect: the TSH levels increased from 1.49 to 1.81 mU/L over 13 years (ages 45–57), representing a gain of 0.32 mU/L (increase rate 21.5%). 39 Our findings also confirmed that sex is one of the objective factors influencing TSH levels.5,40 Specifically, in females, the effects of aging and iodine transitions on the TSH rising degree are more significant.
Furthermore, this is the first study to identify a significant interaction effect between iodine status and aging in TPOAb−&TgAb− contexts, in which iodine transitions modulate the TSH-elevating effect of aging. Considering a UIC of 200 μg/L as the threshold, a transition to sufficiency or deficiency (UIC <200 μg/L) exerted a mild promoting effect on aging-related TSH elevation; this may explain the persistently high SCH prevalence despite the amelioration of iodine excess. 18 Conversely, higher post-transition UIC levels (UIC > 200 μg/L) progressively suppressed aging-related TSH elevation. Therefore, we considered that persistent iodine excess may activate protective mechanisms that mitigate age-dependent TSH elevation to prevent further increases based on preexisting high baseline TSH levels. Therefore, we suggest that maintaining a more-than-adequate iodine status (UIC 200–299 μg/L) could be optimal for individuals with excessive iodine intake. Within this range, UIC levels remain within the suppressive regulatory range for TSH elevation; thus, aging-related increases in TSH could be effectively weakened. Moreover, the risk of other thyroid disorders is unlikely to increase. 3
In our study, compared with the TPOAb−&TgAb− participants, participants with TPOAb+/TgAb+ had higher TSH levels, a greater prevalence of SCH, and lower central thyroid hormone sensitivity two decades later; these phenomena were particularly prominent in the EI–EI group. The TSH elevations also could not be downregulated by excessive iodine amelioration. And the TSH increasing trend was also influenced by aging and iodine transitions. However, the TSH rising degree did not consistently differ across groups, and no significant interaction effect was observed between aging and iodine transitions. Under similar autoimmune conditions, persistent iodine excess significantly increased the prevalence of severe SCH.5,6,41
Strengths and limitations
This study presents the first characterization of longitudinal TSH changes in euthyroid individuals following transitions from iodine excess over a 20-year follow-up period. Moreover, it reveals a novel interaction effect between iodine status and aging in modulating the TSH rising degree with TPOAb−&TgAb− contexts.
However, the study has several limitations. First, both urine and blood samples were single-point measurements, which may weaken the persuasiveness of the analytical results. To minimize measurement error, samples were collected in the early morning after an overnight fast, and consistent assay methods and kits were used to reduce the influence of daily fluctuations and quality control variations. By implementing strict exclusion criteria, we avoided interference from overt thyroid diseases, thyroidectomy, and relevant medications. Additionally, analysis of the average levels of blood pressure, metabolic parameters, and BMI revealed that all of them were within the normal range and demonstrated no significant differences across groups (Supplementary Table S2). Thus, the potential impacts of intercurrent illnesses, chronic morbidities, and abnormal weight changes were small. Second, there were considerable time intervals between follow-ups, and a certain amount of attrition rate limited the sample size; thus, future larger-scale investigations into iodine nutritional transitions and their associations with various thyroid disorders are warranted.
Conclusion
Elevated TSH levels induced by chronic iodine excess cannot be ameliorated by reducing iodine intake concentrations. In populations without thyroid autoimmune diseases, an interaction effect between iodine transition status and aging modulates the degree of TSH elevation: alleviation of iodine excess promotes the TSH-elevating effect of aging, whereas persistent iodine excess suppresses this aging-related TSH elevation. And iodine excess contributes primarily to mild SCH, which is correlated with baseline TSH elevation induced by initial excessive iodine intake. These findings partially explain the persistently high SCH prevalence in China.
Footnotes
Acknowledgments
The authors thank the participants of this study. For continuous support, assistance, and cooperation, the authors thank the investigators for Zhangwu County Center for Disease Control and Prevention and the Cangzhou Center for Disease Control and Prevention.
Authors’ Contributions
X.G.: Conceptualization (lead), writing—original draft (lead), and formal analysis (lead). W.L.: Methodology (lead), software (lead), and formal analysis (lead). Q.G.: Data curation (lead), methodology (equal), and writing—original draft (equal). Yushu L., Yongze L., H.W., X.T., D.T., and S.D.: Responsible for resources (equal) and access to the raw data (equal). W.T.: Conceptualization (equal), responsible for resources (lead), and access to the raw data (lead). Z.S.: Conceptualization (lead), writing—review and editing (lead), funding acquisition (lead), and responsible for resources (lead). All authors had access to all data in the study, and the corresponding author had final responsibility for the decision to submit for publication.
Data Availability Statement
The data are available from the corresponding author upon reasonable request.
Author Disclosure Statement
The authors have no potential conflicts of interest to declare.
Funding Information
This work was supported by the National Natural Science Foundation of China (nos. 81970682 and 82400921) for Z.S. and X.G., respectively, and the NHC Key Laboratory of Thyroid Diseases Management (China Medical University, grant no. 2019PT330001) for Z.S. W.L., Q.G., Yushu L., Yongze L., H.W., X.T., D.T., S.D., and W.T. declare that they have no funding information to disclose.