
Abstract
Background:
Suboptimal treatment of hypothyroidism with levothyroxine (LT4) is common and associated with adverse cardiovascular outcomes. Patients treated with LT4 doses >100 µg may be at increased risk of under- and overtreatment and therefore may benefit from more frequent thyroid stimulating hormone (TSH) surveillance. Our study aim was to determine the association between LT4 dose and the occurrence of suboptimal treatment within 6 months of a normal TSH value.
Methods:
A total of 4449 LT4-treated adults were included in a 6-month longitudinal study. All included patients were required to have at least 2 TSH collections over the study period at least 30 days apart. Patients were grouped according to LT4 dose (≤50, 51–100, 101–150, and >150 µg), which served as the primary exposure. Outcomes included the occurrence of TSH values outside an age-adjusted normal range and a wide range (0.1–10.0 mIU/L). Model covariates included sociodemographics, index TSH value, and a range of codiagnoses and comedications that were prevalent in the population and/or known to impact LT4 treatment. Longitudinal data were analyzed using both repeated measures (generalized estimating equations) and time-to-event (Cox proportional hazards models) methodologies. Kaplan–Meier curves were plotted to examine the incidence of out-of-range TSH values stratified by LT4 dose class.
Results:
The incidence of at least one out-of-range TSH value approached 25% across the entire population and exceeded 45% in the LT4 > 150 µg group. In the repeated measures analysis, a dose-dependent relationship between LT4 dose and the occurrence of TSH outside the age-adjusted range (OR: 1.98, 3.39, and 5.65 for LT4 doses of 51–100, 101–150, and >150 µg, respectively, p-values <0.001). Results were similar when the outcome was defined as a TSH outside 0.1–10.0 mIU/L. In the time-to-event analysis, the hazard ratios were 1.58, 2.73, and 3.08, respectively (p-values <0.001).
Conclusions:
We identified a dose-dependent relationship between LT4 dose and suboptimal treatment over a 6-month study period. It may be beneficial for medically complex patients taking high doses of LT4 to increase TSH surveillance, in particular for those with a history of suboptimal treatment.
Introduction
Maintaining thyroid stimulating hormone (TSH) within the reference range is one of the principal goals of hypothyroidism treatment with levothyroxine (LT4). Suboptimal LT4 treatment may fail to resolve symptoms consistent with the presence of hypothyroidism and can expose patients to the harms of hypothyroidism and thyrotoxicosis. Population studies have found that TSH values during LT4 treatment have a J-shaped relationship with cardiovascular disease (CVD) and mortality, in particular with TSH < 0.1 and >10 mIU/L.1–5 Cross-sectional studies estimate the prevalence of abnormal TSH values amongst LT4-treated patients to be 20–40%.6–10 Given the long duration of LT4 treatment in many patients, current evidence suggests that many patients experience abnormal TSH values intermittently throughout treatment. 11 The elevated prevalence of suboptimal LT4 treatment reinforces the need to target TSH maintenance in LT4 treatment as a public health goal.
To date, recommendations for the monitoring of hypothyroidism treatment largely consist of expert consensus based on clinical judgment. Typically, it is recommended to check TSH annually during “stable” LT4 therapy (or 6–8 weeks after a dose change).12–15 Some recommend specific situations in which TSH should be checked, such as the emergence of hypothyroid symptoms, significant weight loss, or initiation of an interfering medication. 12 However, there may be additional clinical features that put patients on stable LT4 treatment at higher risk for future suboptimal treatment. Prior studies, including from our team, suggest that LT4 dose may be a strong predictor of overtreatment and undertreatment.16–21 We hypothesized that the LT4 daily dose would be associated with increased likelihood of a future out-of-range TSH value in a dose-dependent fashion. Furthermore, we hypothesized that those values would occur sooner than the routine 12 month follow up. Thus, more frequent TSH surveillance (e.g., every 6 months) could allow for earlier detection and correction of suboptimal treatment.
Using electronic health record data from our medical center, we have constructed a longitudinal, real-world dataset of LT4-treated adults with hypothyroidism with TSH values recorded throughout treatment, many of which were collected within 6 months of a normal TSH value. Using this dataset, we conducted a longitudinal study to determine the risk, stratified by LT4 dose, of having an out-of-range TSH value within 6 months of an in-range value. We used two analytical approaches (repeated measures and time-to-event) and two TSH ranges (an age-adjusted normal range and TSH 0.1–10.0 mIU/L) in an effort to enhance study robustness.
Materials and Methods
Data source
The source of these patient data has been described previously. 18 Briefly, clinical data were extracted from the University of Chicago Medicine electronic health record including patient demographics, lab values, diagnosis codes, medications, and visit information. Limited patient data were extracted across the entire University of Chicago Medicine health system, including inpatient and outpatient records, from January 1, 2008, to December 31, 2023. The study was approved by the University of Chicago Biological Sciences Division Institutional Review Board (IRB22-1814).
Inclusion and exclusion criteria
Only patients meeting the following inclusion criteria were eligible for study inclusion: age ≥ 18 years, having a diagnosis of hypothyroidism (defined by ICD 9/10 code: 244.x, 245.2/E03.x, E06.3, E06.5, E89.0), having at least two TSH values within a 180-day period that were separated by 30+ days, and having a stable LT4 dose at the time of both TSH collections. Included patients were required to have LT4 prescribed between 30–180 days prior to the first TSH value and no new dose prescriptions before the second TSH collection. Patients with a history of thyroid cancer, hypopituitarism, or hyperthyroidism/treatment with methimazole or propylthiouracil were excluded. Patients treated with other forms of thyroid hormone (e.g., liothyronine or desiccated thyroid extract) were also excluded. Patients with prescriptions for medications known to potentially interfere with thyroid function tests or LT4 absorption prior to or during study enrollment were included to reflect the real-world conditions of the study. We also did not use pregnancy-related ICD codes to exclude patients. Included patients were required to have an initial TSH value that was within the age-adjusted normal range. In the repeated measures analysis, patients could have multiple 6-month periods in which the requirements were met (resulting in repeated measures). In the time-to-event analysis, patients were followed starting at first normal TSH value for a maximum of 180 days.
TSH collection and the primary outcomes and exposures
All TSH labs during the study period were performed on an automated analyzer platform using the Elecsys® TSH assay kit (Roche). TSH labs collected in the inpatient and outpatient settings were included to maximize observations using TSH collections outside the routine LT4 treatment surveillance. The age-adjusted upper limit of the normal range (aaULN) was adapted from the Roche assay results from Jansen et al. 22 For those aged 50 years and below, the ULN was fixed at 4.5 mIU/L. The ULN was allowed to increase by 0.5 increments per decade up to 7.0 mIU/L for those ≥90 years of age. We used the aaULN given the evidence from national samples that mildly elevated TSH values in older age are common, likely to have little clinical impact, and may not require LT4 adjustment. That said, utilizing an aaULN is not a universal clinical standard.22,23 The primary exposure was dose of LT4 within four groups: ≤50, 51–100, 101–150, and >150 µg. The primary outcome was the occurrence of a TSH value defined as < 0.4 mIU/L or > the aaULN (i.e., out-of-range). We also separately modeled TSH < 0.4 mIU/L and TSH > aaULN given that the causes of under- and overtreatment are likely different.
Sociodemographic and clinical covariates
Sociodemographic covariates included patient age, sex, and race and ethnicity as reported in the electronic health record. All available diagnoses (as 3-character ICD-10 codes) and medications that were prevalent in at least 0.5% of the study population at baseline were considered as potential covariates (rarer covariates are less likely to impact model performance). 24 Of note, only prescriptions ordered within 2 years of the index date were considered. Diagnoses and medications were then listed by frequency and evaluated for potential relevance to LT4 treatment and/or TSH testing. Selected diagnoses were then grouped into larger clinical categories (e.g., CVD, malignancy, gastrointestinal disease, etc.) Selected medications were then grouped according to therapeutic class (e.g., anticonvulsants, antineoplastic agents, corticosteroids, etc.). The complete lists of diagnosis and medication covariates are included in Supplementary Tables S1a and S1b. The initial TSH value (0.4–2.0, 2.0–4.0, 4.0–6.0, and 6.0 + mIU/L) was included as a covariate. Days since the initial TSH collection was also included as a covariate (in the repeated measures analysis only). To account for a secular trend, the period of study enrollment (e.g., “2008–2013”) was also included as a categorical covariate in both analyses.
Statistical analysis
Summary statistics for sociodemographic and clinical characteristics were calculated for the overall study population and stratified by LT4 dose group. Sociodemographic and clinical covariates were compared between groups using Wilcoxon rank-sum (continuous) and Chi-square or Fisher’s exact test (categorical), as appropriate. The primary analysis was conducted with two longitudinal analytical methodologies to assess the robustness of findings. First, 6-month time periods were modeled using generalized estimated equations (GEE) as repeated measures. The GEE approach allowed for the analysis of multiple time periods per participant while efficiently estimating a population mean response stratified by LT4 dose. We selected an autoregressive correlation structure (“AR[1]”), which assumes a higher degree of correlation between measures that were collected more closely in time. In the multivariable models, sociodemographic variables (except age) were time-fixed, otherwise all other variables were allowed to vary between measurements. In a similar fashion, we constructed individual GEE models of low TSH (<0.4 mIU/L) and high TSH (>aaULN). We performed sensitivity analyses in a similar fashion with a wide TSH range (0.1–10.0 mIU/L). The wide TSH range was analyzed because TSH excursions outside this range would be less likely to be caused by nonthyroidal illness and may be of greater clinical importance for cardiovascular event outcomes. Additional sensitivity analyses were performed with the age-adjusted TSH range but excluding those with LT4 doses ≤50 µg (due to the possibility that a substantial portion (25–30%) of these patients may not have hypothyroidism).25–29
The second phase of the analysis was the time-to-event study. Initially, the relationship between LT4 dose and time to an out-of-range TSH value was evaluated using Kaplan–Meier curves and the log-rank test. This was repeated for each outcome variation as described in the GEE analysis (including the wide TSH range). Next, multivariable Cox proportional hazards models were built with the same exposures and covariates as in the GEE models (and with the same sensitivity analyses). In this study, each patient was “enrolled” at the time of the first qualifying TSH value and followed for a maximum of 180 days. Censorship occurred at the point when the outcome occurred, the LT4 dose was changed (after the second TSH collection), or at the completion of the study period. The proportionality assumption was evaluated via testing the independence of scaled Schoenfeld residuals and time. Each model was stratified on those covariates that violated the assumption. The plots of LT4 dose in some models did demonstrate some mild time-dependence (mostly in the 30–60 day window), but no systematic trend was identified in any plot. All analyses and data processing were conducted using the R statistical platform (version 4.5.2). The “geepack,” “survival,” and “survminer” packages provided essential functions to complete the analyses.
Results
A total of 4449 adult LT4-treated patients were included in the repeated measures analyses, of which 69.1% were female, 62.2% were reported as White, and 69.0% were 55+ years of age. Approximately 39.5% of the study population had a baseline LT4 dose of ≤ 50 µg, followed by 35.5%, 19.9%, and 5.1% for the 51–100, 101–150, and >150 µg dose classes, respectively. The comparisons of the study groups by baseline sociodemographic and clinical characteristics are summarized in Table 1 and Supplementary Table S2. The mean numbers of co-diagnoses and co-medications were 2.6 (±2.7) and 3.3 (±4.8), respectively. Although there were some statistically significant differences in co-diagnoses between the groups, only diabetes and obesity presented a clear trend of increased prevalence with increasing doses of LT4. Only minor differences in co-prescribed medications between the groups were noted.
Baseline Sociodemographic Characteristics and Initial TSH Values Stratified by Levothyroxine Dose
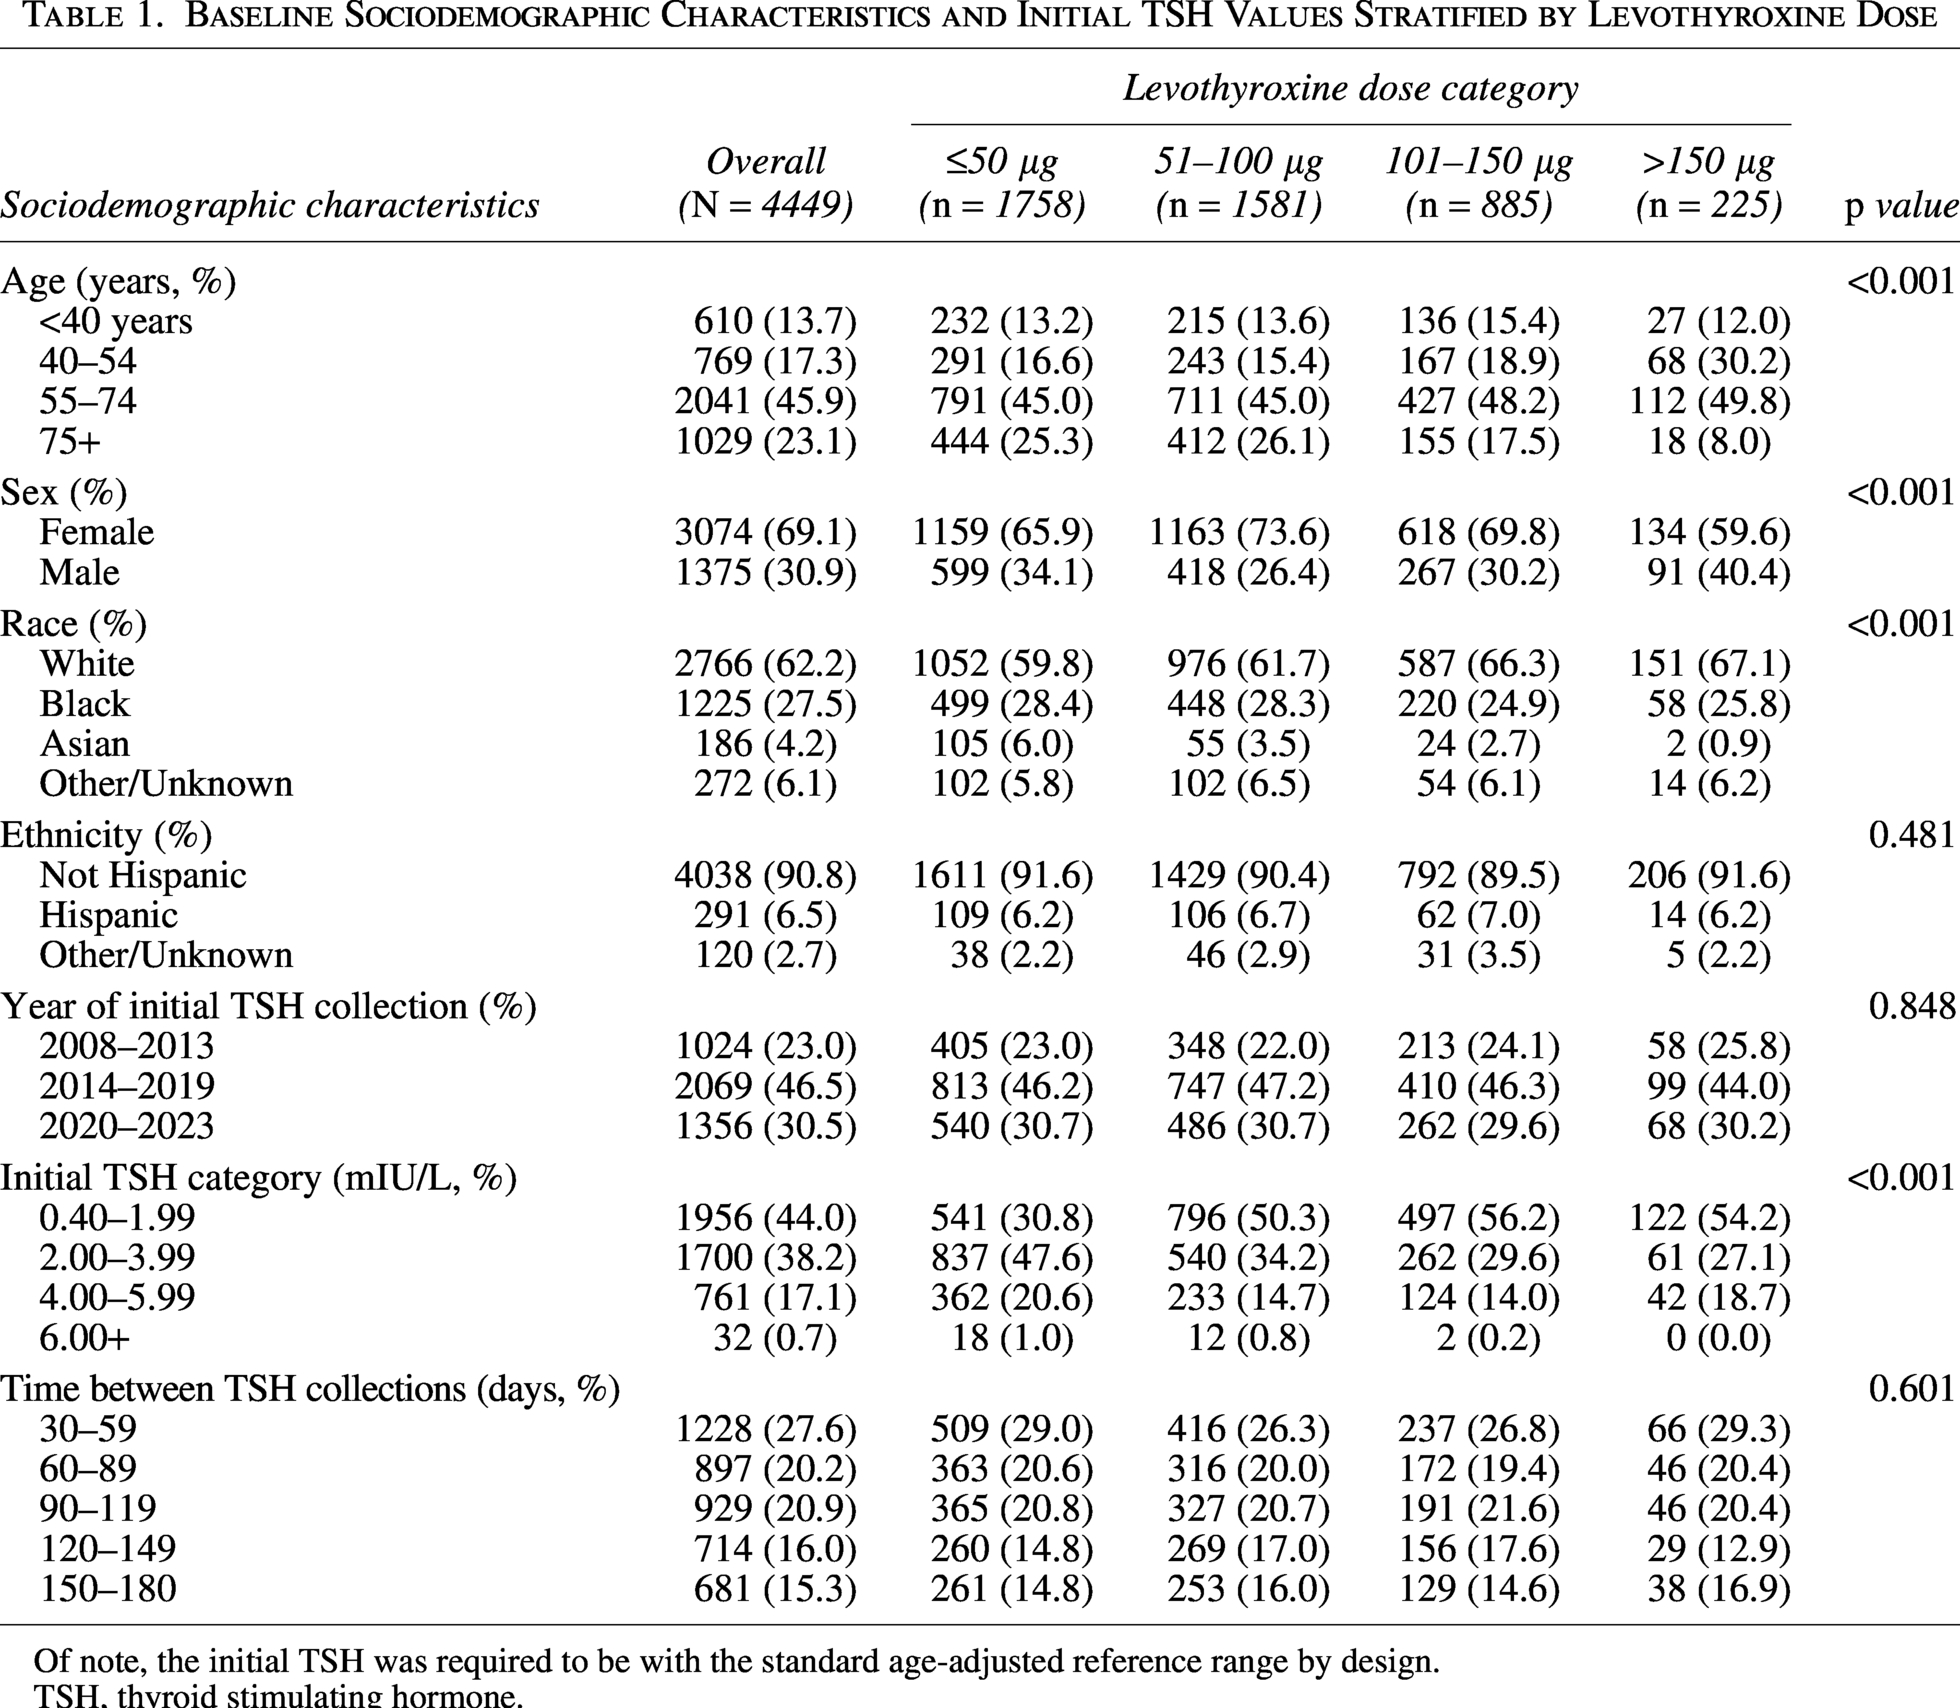
Of note, the initial TSH was required to be with the standard age-adjusted reference range by design.
TSH, thyroid stimulating hormone.
Multivariable repeated measures analysis
LT4 dose > 50 µg was associated with increased odds of the second TSH value being outside the age-adjusted range, and the odds increased in a dose-dependent fashion. LT4 doses 51–100 µg were associated with a 98% greater likelihood of a TSH value outside the age-adjusted range within the 6-month timeframe (OR: 1.98, CI: [1.73–2.26], p value < 0.001) (Table 2). The estimated odds ratios (ORs) for LT4 dose 101–150 µg and >150 µg were 3.39 (CI: [2.94–3.91], p value <0.001) and 5.65 (CI: [4.54–7.02], p value < 0.001), respectively. Similar patterns were observed with TSH > 4.5 mIU/L or the aaULN and TSH < 0.4 mIU/L. Compared to LT4 doses of ≤ 50 µg, the strongest associations were observed between LT4 doses > 100 µg and TSH levels < 0.4 mIU/L. The sensitivity analyses examining the wide TSH range demonstrated similar results for LT4 doses between 51–100 µg and 101–150 µg (Supplementary Table S3). Of note, the odds of a patient with an LT4 dose > 100 µg of having a follow-up TSH > 10.0 mIU/L or < 0.01 mIU/L were at least four times greater than a patient with an LT4 dose of ≤ 50 µg. The sensitivity analysis excluding low dose (≤50 µg) LT4 users demonstrated a similar dose response pattern to the primary analysis, albeit with more modest ORs (Supplementary Table S4).
The Association between LT4 Dose and out-of-Range TSH Values within 6 Months of an in-Range TSH Value (GEE Analysis)
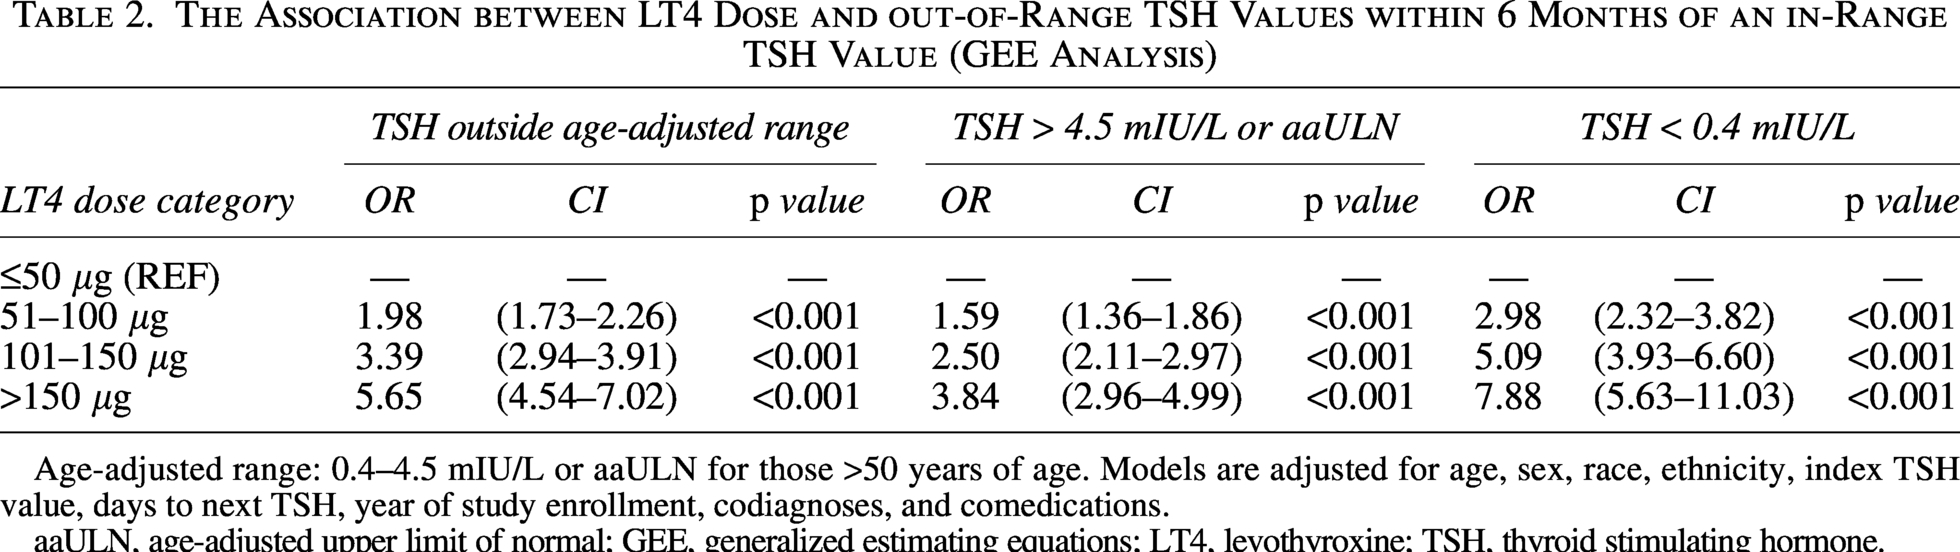
Age-adjusted range: 0.4–4.5 mIU/L or aaULN for those >50 years of age. Models are adjusted for age, sex, race, ethnicity, index TSH value, days to next TSH, year of study enrollment, codiagnoses, and comedications.
aaULN, age-adjusted upper limit of normal; GEE, generalized estimating equations; LT4, levothyroxine; TSH, thyroid stimulating hormone.
Time-to-event analysis: Kaplan–Meier plots
Consistent with the repeated measures analysis, the Kaplan–Meier plots demonstrated a dose-dependent pattern with the proportion of patients within the age-adjusted range declining more rapidly as LT4 dose increased (Fig. 1A and B). In both cases, the curves across LT4 dose classes were statistically distinct (p value < 0.0001). The proportion of patients with LT4 doses of 101–150 µg with a TSH outside the age-adjusted range approached 40%, and the proportion exceeded 45% for those taking > 150 µg. The additional plots are included in Supplementary Figures S1 and S2. Of note, TSH values outside the wide range were much less common. The proportion of patients across all LT4 dose classes who experienced a TSH outside the wide TSH range was approximately 14% (Fig. 1B).
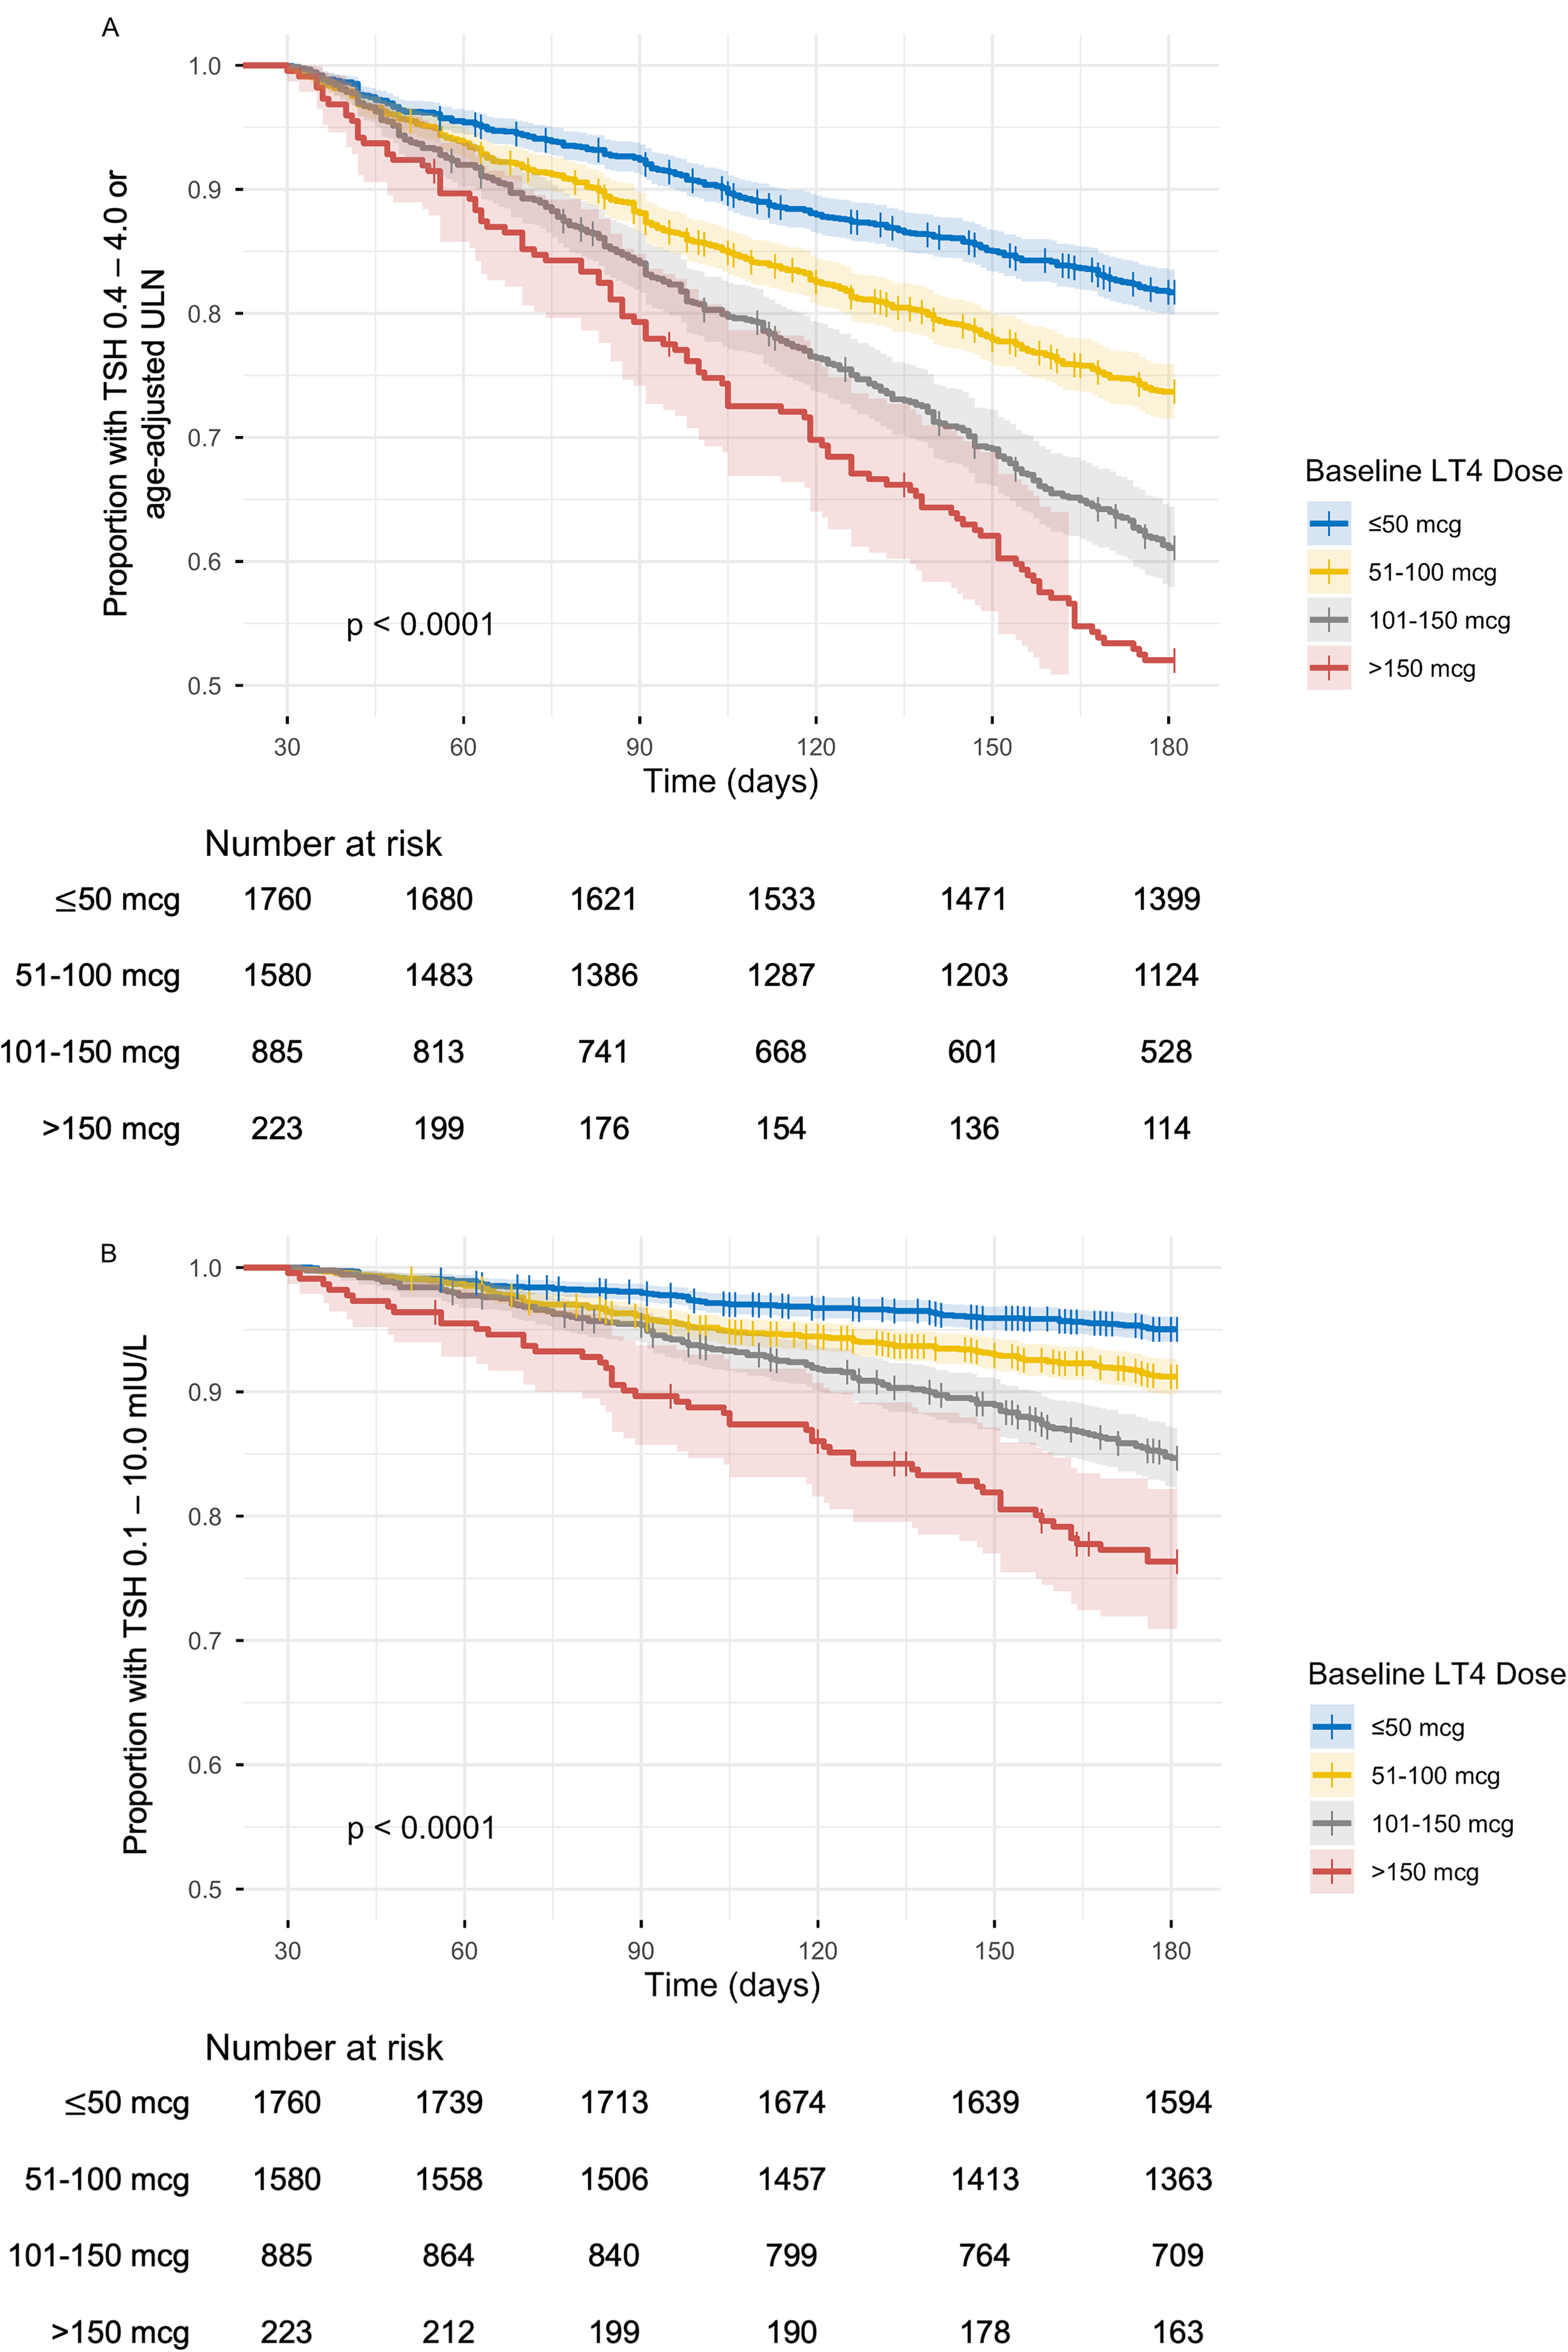
Kaplan–Meier curves of proportion of each LT4 dose group to have no TSH value outside the age-adjusted normal range
Time-to-event analysis: Cox proportional hazard ratios
Supporting the prior analyses, the Cox proportional hazard modeling demonstrated a similar dose-dependent increase in risk of follow up TSH values outside the age-adjusted range as LT4 dose increased. The associations were slightly more modest compared with the GEE results. The estimated hazard ratios (HRs) for the respective LT4 doses classes for a TSH outside the age-adjusted range were 1.58, 2.73, and 3.08 for LT4 doses of 51–100, 101–150, and >150 µg, respectively (p value <0.001 for all). The remaining results are summarized in Table 3, and the results of Cox sensitivity analyses with the wide TSH range and LT4 dose ≤50 µg excluded are summarized in Supplementary Tables S5 and S6. In the wide TSH range analysis, the strongest association was seen between LT4 doses > 150 µg and follow-up TSH values < 0.1 mIU/L (OR: 9.66, CI: [5.42–17.22], p value <0.001), with ∼12% experiencing a TSH < 0.1 mIU/L during the study period (Supplementary Fig. S2B).
The Association between LT4 Dose and out-of-Range TSH Values within 6 Months of an in-Range TSH Value (Cox Proportional Hazards Analysis)
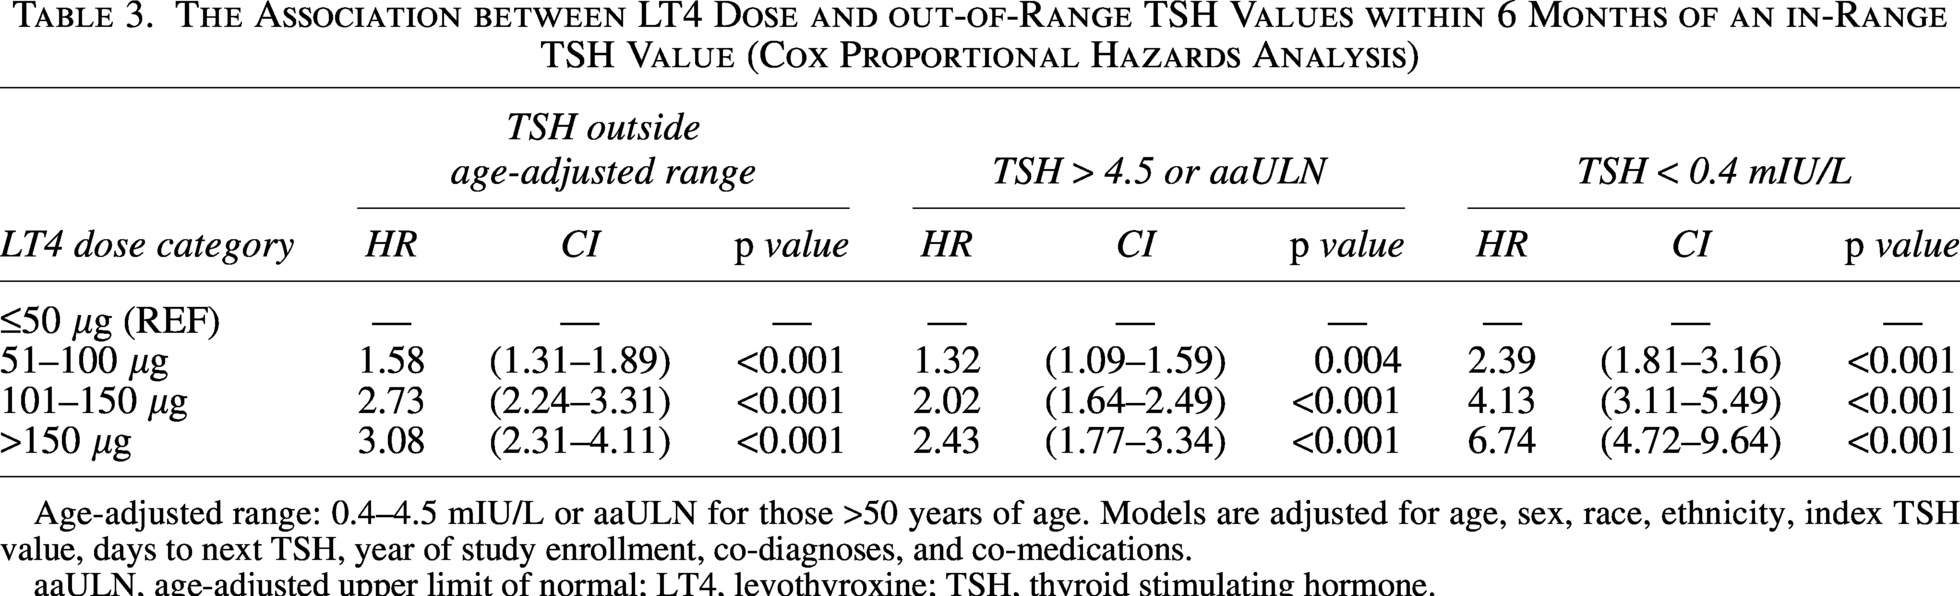
Age-adjusted range: 0.4–4.5 mIU/L or aaULN for those >50 years of age. Models are adjusted for age, sex, race, ethnicity, index TSH value, days to next TSH, year of study enrollment, co-diagnoses, and co-medications.
aaULN, age-adjusted upper limit of normal; LT4, levothyroxine; TSH, thyroid stimulating hormone.
Discussion
In this study of a medically complex cohort of LT4-treated adults following a TSH value within the age-adjusted normal range, we found a dose-dependent increase in risk of an out-of-range value within 6 months for those treated with LT4 doses > 50 µg. The 6-month incidence of suboptimal treatment for those treated with doses > 150 µg approached 50%. The dose-dependent pattern was robust across both analytical methodologies and sensitivity analyses. The stronger associations identified in the repeated measures analysis suggest a general trend that out-of-range TSH values tended to recur in the same individuals over time. Of note, the Kaplan–Meier curves demonstrated that the absolute risks of TSH values <0.1 mIU/L or >10.0 mIU/L were low, especially for LT4 doses ≤ 100 µg. In general, elevated TSH levels occurred more frequently than low TSH levels. All models were adjusted for co-diagnoses and co-medications, the initial in-range TSH value, and sociodemographic characteristics.
This study is most closely related to the study by Pecina et al. examining a group 715 LT4-treated adults in a family medicine practice, although their study period was 6 years. 17 The authors examined LT4 dose and several other covariates in a Cox proportional hazards model. They found LT4 dose > 125 µg to be associated with increased risk of an abnormal TSH level (HR 2.43, p value < 0.0001). A marked difference in their study population was the proportion of patients who had a normal TSH value at 6 months, which was ≥90% across all LT4 dose classes. Because the Pecina study did not include codiagnoses or comedications, we cannot compare the relative degree of comorbidity and polypharmacy between the two study populations. However, the Pecina study population comprised of individuals seen in a family medicine department, thus those patients may have been less medically complex and/or had more consistent TSH surveillance. Additionally, our study only included individuals with at least two TSH checks within 6 months, possibly selecting for a higher-risk patient group. Ultimately, Pecina et al. concluded that TSH surveillance every 2 years may be sufficient for patients who received LT4 doses ≤125 µg, aligning with other studies questioning the need for annual TSH checks during low-dose treatment.16,20
Our results more closely align with a retrospective study of adult LT4-treated patients from a group of primary care clinics in Singapore. 21 Approximately 22% of those with a normal index TSH value had an abnormal TSH value at 6 months, compared with 25% in our study. Those authors did find a positive association between LT4 dose/kg and the likelihood of suboptimal treatment. However, their analyses did not compare groups by LT4 dose. Uniquely, our study examines real-world data on the stability of LT4 treatment by dose over a relatively short time period from a medically complex patient population. These data would suggest that closer TSH monitoring (e.g., every 6 months) may be appropriate for similar patients treated with LT4 doses > 100 µg. Of note, elevated risk of both high and low TSH values associated with higher LT4 doses is consistent with our prior time-in-range analysis 18 and may reflect a trend to compensate for poor treatment adherence (resulting in high TSH values) by increasing the dose. Regardless of the cause of suboptimal treatment, routine TSH monitoring obtained more frequently than once a year would exceed what is often encouraged in guidelines and expert opinion,12–15 which may increase direct and indirect health care costs and could conflict with payer guidelines. The costs of hypothyroidism under the current standard of care are already likely underappreciated. 30 However, the potential savings by identifying suboptimal treatment early and avoiding an additional 6 months of exogenous thyrotoxicosis or hypothyroidism may be significant. Formalized cost-benefit analysis may be beneficial in this area.
While this study represents a uniquely large population accounting for a broad range of sociodemographic and clinical covariates, there are several important limitations to acknowledge. First, this is a retrospective, single center study that is subject to selection bias in that only patients with multiple TSH collections within a 6-month period were included. Included patients may have been deemed “high risk” by their providers or had a history of suboptimal treatment, thus triggering more frequent testing. Repeat testing may have also been done in the setting of acute illness or hospitalization, which may have skewed the population toward a “sicker” status. We were unable to determine the proportion of TSH collections that occurred in the inpatient setting, and follow-up TSH testing outside the normal range may have been due to nonthyroidal illness. These limitations impact the generalizability of the study. However, this effect would be expected to be systematic and not varied based on LT4 dose. We also found the dose-dependent pattern to persist with the wide TSH range, which would be less sensitive to changes due to nonthyroidal illness. These findings support the internal validity of the study.
Second, the degree of missing physical exam data precluded weight or body mass index as a covariate in the analyses. LT4 dose relative to weight may be a better reflection of effective dose, with a recent study suggesting dose by lean body mass may be a better measure of risk for overtreatment dose.31,32 Third, the aaULN calculation was based on data from a Dutch population which may not generalize perfectly to the more heterogeneous study population. 22 Finally, the LT4 dose group of ≤ 50 µg used as the reference group likely represents treatment of mildly elevated TSH levels (or even normal TSH levels for some individuals), some of which may represent only transient deviations and not true subclinical hypothyroidism.25–29 Thus, the risk of overtreatment and undertreatment may be particularly low for this group of patients, which could have led to overestimation of estimated effect sizes in the analyses. The sensitivity analyses with this group excluded did demonstrate more modest ORs but the dose-dependent pattern persisted.
Conclusion
LT4 dose does appear to be associated with suboptimal treatment in this study population, and the strength of that association appears to be dose-dependent. The incidence of suboptimal treatment over 6 months, in particular in individuals with LT4 doses > 100 µg, was higher than expected (elevated TSH: ∼23%, low TSH: ∼21%). This medically complex study population may have an above-average risk of suboptimal treatment at baseline. Acknowledging this, clinicians may consider increasing the frequency of TSH monitoring in LT4-treated individuals who are medically complex and on high doses of LT4. A cost-benefit analysis of more frequent monitoring in a representative sample population may be informative.
Authors’ Contributions
M.D.E.: Conceptualization (lead); writing—original draft (lead); statistical analysis (lead). W.W.: Statistical analysis (support). N.L.: Writing—review and editing (supporting). B.W.K.: Writing—review and editing (supporting). A.C.B.: Conceptualization (supporting); writing—review and editing (supporting).
Footnotes
Disclosure Statement
M.D.E., W.W., B.W.K., N.L., and A.C.B. have nothing to disclose.
Funding Information
The study was supported by the National Institute of Diabetes and Digestive and Kidney Disease (NIDDK) of the National Institutes of Health (NIH) through the Diabetes Research and Training Center (DRTC) (
Supplemental Material
Supplemental Material
Supplemental Material
Supplemental Material
Supplemental Material
Supplemental Material
Supplemental Material
Supplemental Material
References
Supplementary Material
Please find the following supplemental material available below.
For Open Access articles published under a Creative Commons License, all supplemental material carries the same license as the article it is associated with.
For non-Open Access articles published, all supplemental material carries a non-exclusive license, and permission requests for re-use of supplemental material or any part of supplemental material shall be sent directly to the copyright owner as specified in the copyright notice associated with the article.