
Abstract
Background
In healthcare applications and organizations, perceptions of patients or the public in research play an important role in accepting artificial intelligence (AI) technologies.
Objective
The aims of the study were to develop: (1) to psychometrically adapt the AI in healthcare perception scale to the Turkish sample and (2) to examine statistical differences in positive and negative perceptions of AI in healthcare with the medical mistrust index, physician trust, age, and years of education, as well as the association with AI-knowledge and feelings.
Methods
For the psychometric design, the adaptation followed Beaton's cross-cultural translation stages to ensure conceptual and linguistic equivalence of the Turkish version. A correlational and cross-sectional designs were employed to examine relationships among variables. The study questionnaire was divided into four sections: a demographic form, the Perception of AI in Healthcare Scale (PAIHS), the Medical Mistrust Index (MMI), and the Trust in Physician Scale (TPS).
Results
Exploratory and confirmatory factor analyses (EFA and CFA) revealed a two-factor structure representing independent positive and negative perceptions. Goodness-of-fit indices indicated an acceptable to good model fit
Conclusions
Two independent scales were adapted and found to be psychometrically valid. Different categorizations of the scale scores were used to reveal the true nature of the neutral tendency toward AI.
Keywords
Introduction
Healthcare is greatly influenced by artificial intelligence (AI) technologies, which have the potential to create rapid and radical change, especially in medicine. AI in healthcare offers significant potential for transformative improvements. Therefore, healthcare is a sensitive and vital field in which AI development and application benefits are expected. 1 Shortly, AI will become an integral part of healthcare and be incorporated into various aspects of clinical care. 2 Experts believe AI will play an essential role in future healthcare delivery, with limited clinical application expected within five years and widespread use within ten years, 3 and it is also projected to revolutionize healthcare for patients and communities. 4
Like health professionals and healthcare organizations, patients and society are the most critical stakeholders, who play important roles and contribute to the functioning of health systems by affecting the success, quality, and sustainability of health services. For AI to fulfill its potential in healthcare, it must be accepted by healthcare professionals, patients, and other members of society. 1 Patients and society are not just users but the most critical stakeholders at the heart of healthcare. The interactions with AI applications are pivotal for successfully implementing AI in healthcare. Therefore, it is crucial to understand and consider their perspectives, perceptions, expectations, feelings, and attitudes about AI. 5 The input is valuable and integral to the process, and their concerns and expectations should be at the forefront of the considerations. 6 Studies carried out in the direction can provide users with important information about the benefits, concerns, and risks of AI applications in healthcare services. AI applications can both fulfill their potential and increase their potential in healthcare services. In a study by Richardson et al. (2021) examining patients’ perspectives on some AI applications in healthcare, patients expressed several concerns that need to be mitigated for AI adoption. The concerns pose a significant obstacle to using and spreading AI applications. 7 Additionally, patient-centered research and patient engagement in AI tools are critical to ensuring fair and equitable applications of AI in healthcare.
In parallel with the developments in technology and health services, AI applications used in health services have positive contributions to the health level of individuals and society. Due to the noteworthy characteristics of the applications, such as their potential to improve diagnosis accuracy and treatment outcomes, differences can be observed in individuals’ attitudes and perceptions. Some approaches and methods brought by AI-supported applications used in health services have been perceived positively due to their benefits, such as increasing the quality of the service provided, improving doctor-patient relations, and reducing doctors’ workloads.
Some individuals have been seen to have anxious and negative perceptions of AI applications on issues such as ethical concerns, privacy violations, wrong diagnoses, and security issues. On the other hand, some individuals have positive perceptions of AI, seeing it as a tool that can improve healthcare quality and access. Thus, the literature revealed that individuals experience two different emotional states, positive and negative perceptions, towards AI, which can be observed in individuals’ attitudes and perceptions.8–11 Upon examining the relevant literature, the motivation for the study was the lack of a valid and reliable measurement instrument to measure individuals’ perceptions of AI applications in healthcare, especially in Turkish. Cultural factors such as the Turkish healthcare system and patient-doctor dynamics, access to healthcare, individuals’ level of trust in technology, and the perspectives on authority figures (such as doctors) can create a unique context for shaping AI perceptions.
An examination of the international literature reveals that attitudes toward AI vary significantly across countries. For example, in a large-scale study conducted in the United States, 52% of participants expressed a positive view of AI in healthcare, while 28% expressed a negative perception. 1 Studies in Asian countries report positive perception rates exceeding 60% due to high adoption of technology. 12 In European countries, the rates are more balanced, with positive perceptions ranging from 40% to 55%. 13 For instance, studies in Germany reported a high prevalence of positive perceptions towards AI in healthcare among patients, with over 80% expressing optimism about its benefits for diagnostics and treatment efficiency.5,14 In contrast, research focusing on dental patients in the same region revealed a more cautious stance, where a significant portion expressed concerns about data privacy and the loss of human interaction, influencing their overall acceptance.15,16 These differences are reported to be influenced by factors such as a country's level of technological development, healthcare system organization, data security culture, and frequency of exposure to AI in daily life. 17
In Türkiye, initial explorations among healthcare professionals, such as nurses, indicate a majority-positive attitude, yet public and patient-specific data remains scarce. 18 Therefore, measuring the positive and negative perceptions of AI among healthcare providers in Türkiye is crucial for understanding country-specific dynamics and providing data for healthcare policies. Accordingly, the study aimed to first psychometrically adapt the Perception of Artificial Intelligence in Healthcare Scale to the Turkish version and secondly analyze the statistical differences in positive and negative perceptions of AI in healthcare with the effects of the medical mistrust index, trust in the physician, age, and years of education, as well as the association with AI-knowledge and feelings.
Methods
The quantitative study involved the psychometric design to adapt the Perception of Artificial Intelligence in Healthcare Scale to Turkish. Furthermore, correlational and cross-sectional designs were used to unveil the relationships between variables. The Ethics Committee (HBV- 2024/20) approved the study. After ethical approval, the data were collected through a Google online questionnaire between 2.02.2024 and 22.06.2024. Records of individuals who received treatment at university hospitals in the last six months were accessed, and the study details were shared with them. Those who wished to participate voluntarily in the survey were invited to complete an online questionnaire. Before the questionnaire, a detailed explanation was provided, reiterating the research's purpose, the absence of any risks, the scientific use of the results, the freedom to withdraw from the research at any time, and the absence of any financial burden. To ensure accuracy, transparency of results, and the caliber of observational research, the study adhered to STROBE guideline requirements. 19
The cross-cultural adaptation process
The five stages of the cross-cultural adaptation guide were used in the Turkish adaptation of the scale. 20
(Step-1) Forward translation: The scale was translated into Turkish by two independent native speaker translators. (Step-2) Synthesis: The translations were combined by an expert panel to create a single Turkish version. (Step-3) Back translation: The Turkish version was back-translated into English by two independent native speaker translators proficient in the original language, and semantic equivalence was compared with the original. (Step-4) Expert committee review: A five-person expert committee conducted an item-by-item review for linguistic and conceptual equivalence. (Step-5) Pretesting and cognitive debriefing: Cognitive interviews were conducted with 17 participants, and the items were assessed for comprehensibility, cultural appropriateness, and content validity. During the pre-test phase, participants provided open-ended feedback on the comprehensibility, suitability for everyday language use, and cultural appropriateness of the scale items. Based on the feedback, three items were rephrased to improve clarity.
At the end of the process, the necessary linguistic adjustments were made, and the Turkish version of the scale was finalized.
Participants
According to the study's first aim, the adaptation process was designed into two phases: (1) Pre-test: In studies, pre-test sample sizes were not specified, and did not rely on sampling methods.
21
Some studies used non-probabilistic sampling methods, which do not fit the nature of statistics and statistical analysis. To solve the problems, the sample size of the pre-test was determined using power analysis according to Cronbach's alpha with the expected power.
22
Considering the previous study,
5
the Expected Cronbach's alpha was set at .85, and the power was .95 with k (items) = 25, calculated as a sample size of 77. (2) Sample: After the pre-testing, the sample was taken for further analysis, such as Confirmatory factor analysis (CFA) and Exploratory factor analysis (EFA). Therefore, the power analysis of CFA was conducted again to calculate the sample size.
23
In the interpretation of goodness-of-fit indexes, root mean square error of approximation (RMSEA) is one of the important indexes to indicate excellent
To reduce potential bias, the following exclusion criteria were applied: (a) being under 18 years old, (b) not having been treated within six months, (c) not having been to any healthcare organization within six months, (d) not being a medical professional and (e) not living in Türkiye, (f) who gave an unrealistic answer to demographic questions, and (g) who answered the demographic questions and did not answer the other questions. Accordingly, everyone in Türkiye who did not meet the criteria was a potential participant (with an equal probability of participating) and was also a study population for the research.
In the beginning, 114 participants filled out the questionnaire for pretesting. As mentioned, some participants did not fit the criteria (
Measures
The study questionnaire was designed in four sections. The first section of the questionnaire was a demographic form; the second section was the Perception of AI in Healthcare Scale (PAIHS) 5 ; the third section was the Medical Mistrust Index (MMI) 25 ; and the last section was the Trust in Physician Scale (TPS). 26 The demographic form was designed with multiple-choice or open-ended questions.
The Perception of Artificial Intelligence in Healthcare Scale (PAIHS) was developed to investigate the perception of AI in healthcare. 5 The scale incorporates 25 items. The original 25-item scale comprises four sub-dimensions: ‘AI brings advantages for patients’ consisted of six items (Cronbach's alpha = .73), ‘Patients fear AI’ consisted of four items (Cronbach's alpha = .73), ‘Patients are worried about physicianś low AI competence’ consisted of five items (Cronbach's alpha = .75) and ‘AI needs to be controlled’ consisted of three items (Cronbach's alpha = .62)—scores on the scale range between 18 and 90, with high scores, indicating a higher perception of AI. The scales’ response codes are between (1) strongly disagree and (5) strongly agree.
The Medical Mistrust Index (MMI), which has 17 items and a Likert-type scale, was developed to examine mistrust in healthcare organizations.
25
A shortened version (the seven-item version) was also mentioned.
25
The reliability coefficient (Cronbach's-
The Trust-in-Physician Scale (TPS), which contains 11 items, was developed to understand patient trust and the doctor-patient relationship. 26 As a result of the study, Cronbach's alpha coefficient was determined as .90. The trust scale is a five-point Likert-type scale, with the responses ranging from (1) strongly disagree to (5) strongly agree. Scores on the scale range between 11 and 55, with high scores showing high levels of trust-in-physician. For further validation, the trust scale scores were transformed between 0 and 100, and Cronbach's alpha was found to be .89. 27 In the study, the Cronbach's alpha reliability coefficient of the scale was found to be .714.
Statistical analysis
The study's data were analyzed using R 4.2.3, IBM SPSS Statistics Version 23, and LISREL Version 8.80 statistical programs. Descriptive statistics were calculated to provide distributional information about the variables and their groups. The principal components of a measurement instrument are its psychometric properties, which reveal information about adequacy, relevance, and usefulness using validity and reliability. To evaluate psychometric properties, a validity-reliability analysis was conducted on the perception of AI in healthcare scales. 28 The p-values were two-sided and considered significant at .05 for all statistical analyses.
Therefore, some steps were followed, such as (step-1) The scale's content validity analysis was conducted following forward-backward translation, a five-expert committee evaluation, and cognitive feedback processes conducted in accordance with Beaton's guidelines to ensure the scale's cultural and linguistic adaptability. The steps strengthened the scale's suitability for Turkish culture and its conceptual equivalence. The content validity indices (CVI) were calculated to examine whether there was consistency across the experts’ feedback. The expert's feedback was based on the rating for each item between 1 and 3 (1 = “not necessary”, 2 = “ useful not essential”, 3 = “essential”).
29
(step-2) investigating the scale's construct validity. EFA was used to extract the unknown factors and items with factor loading values (
Results
Description of participants
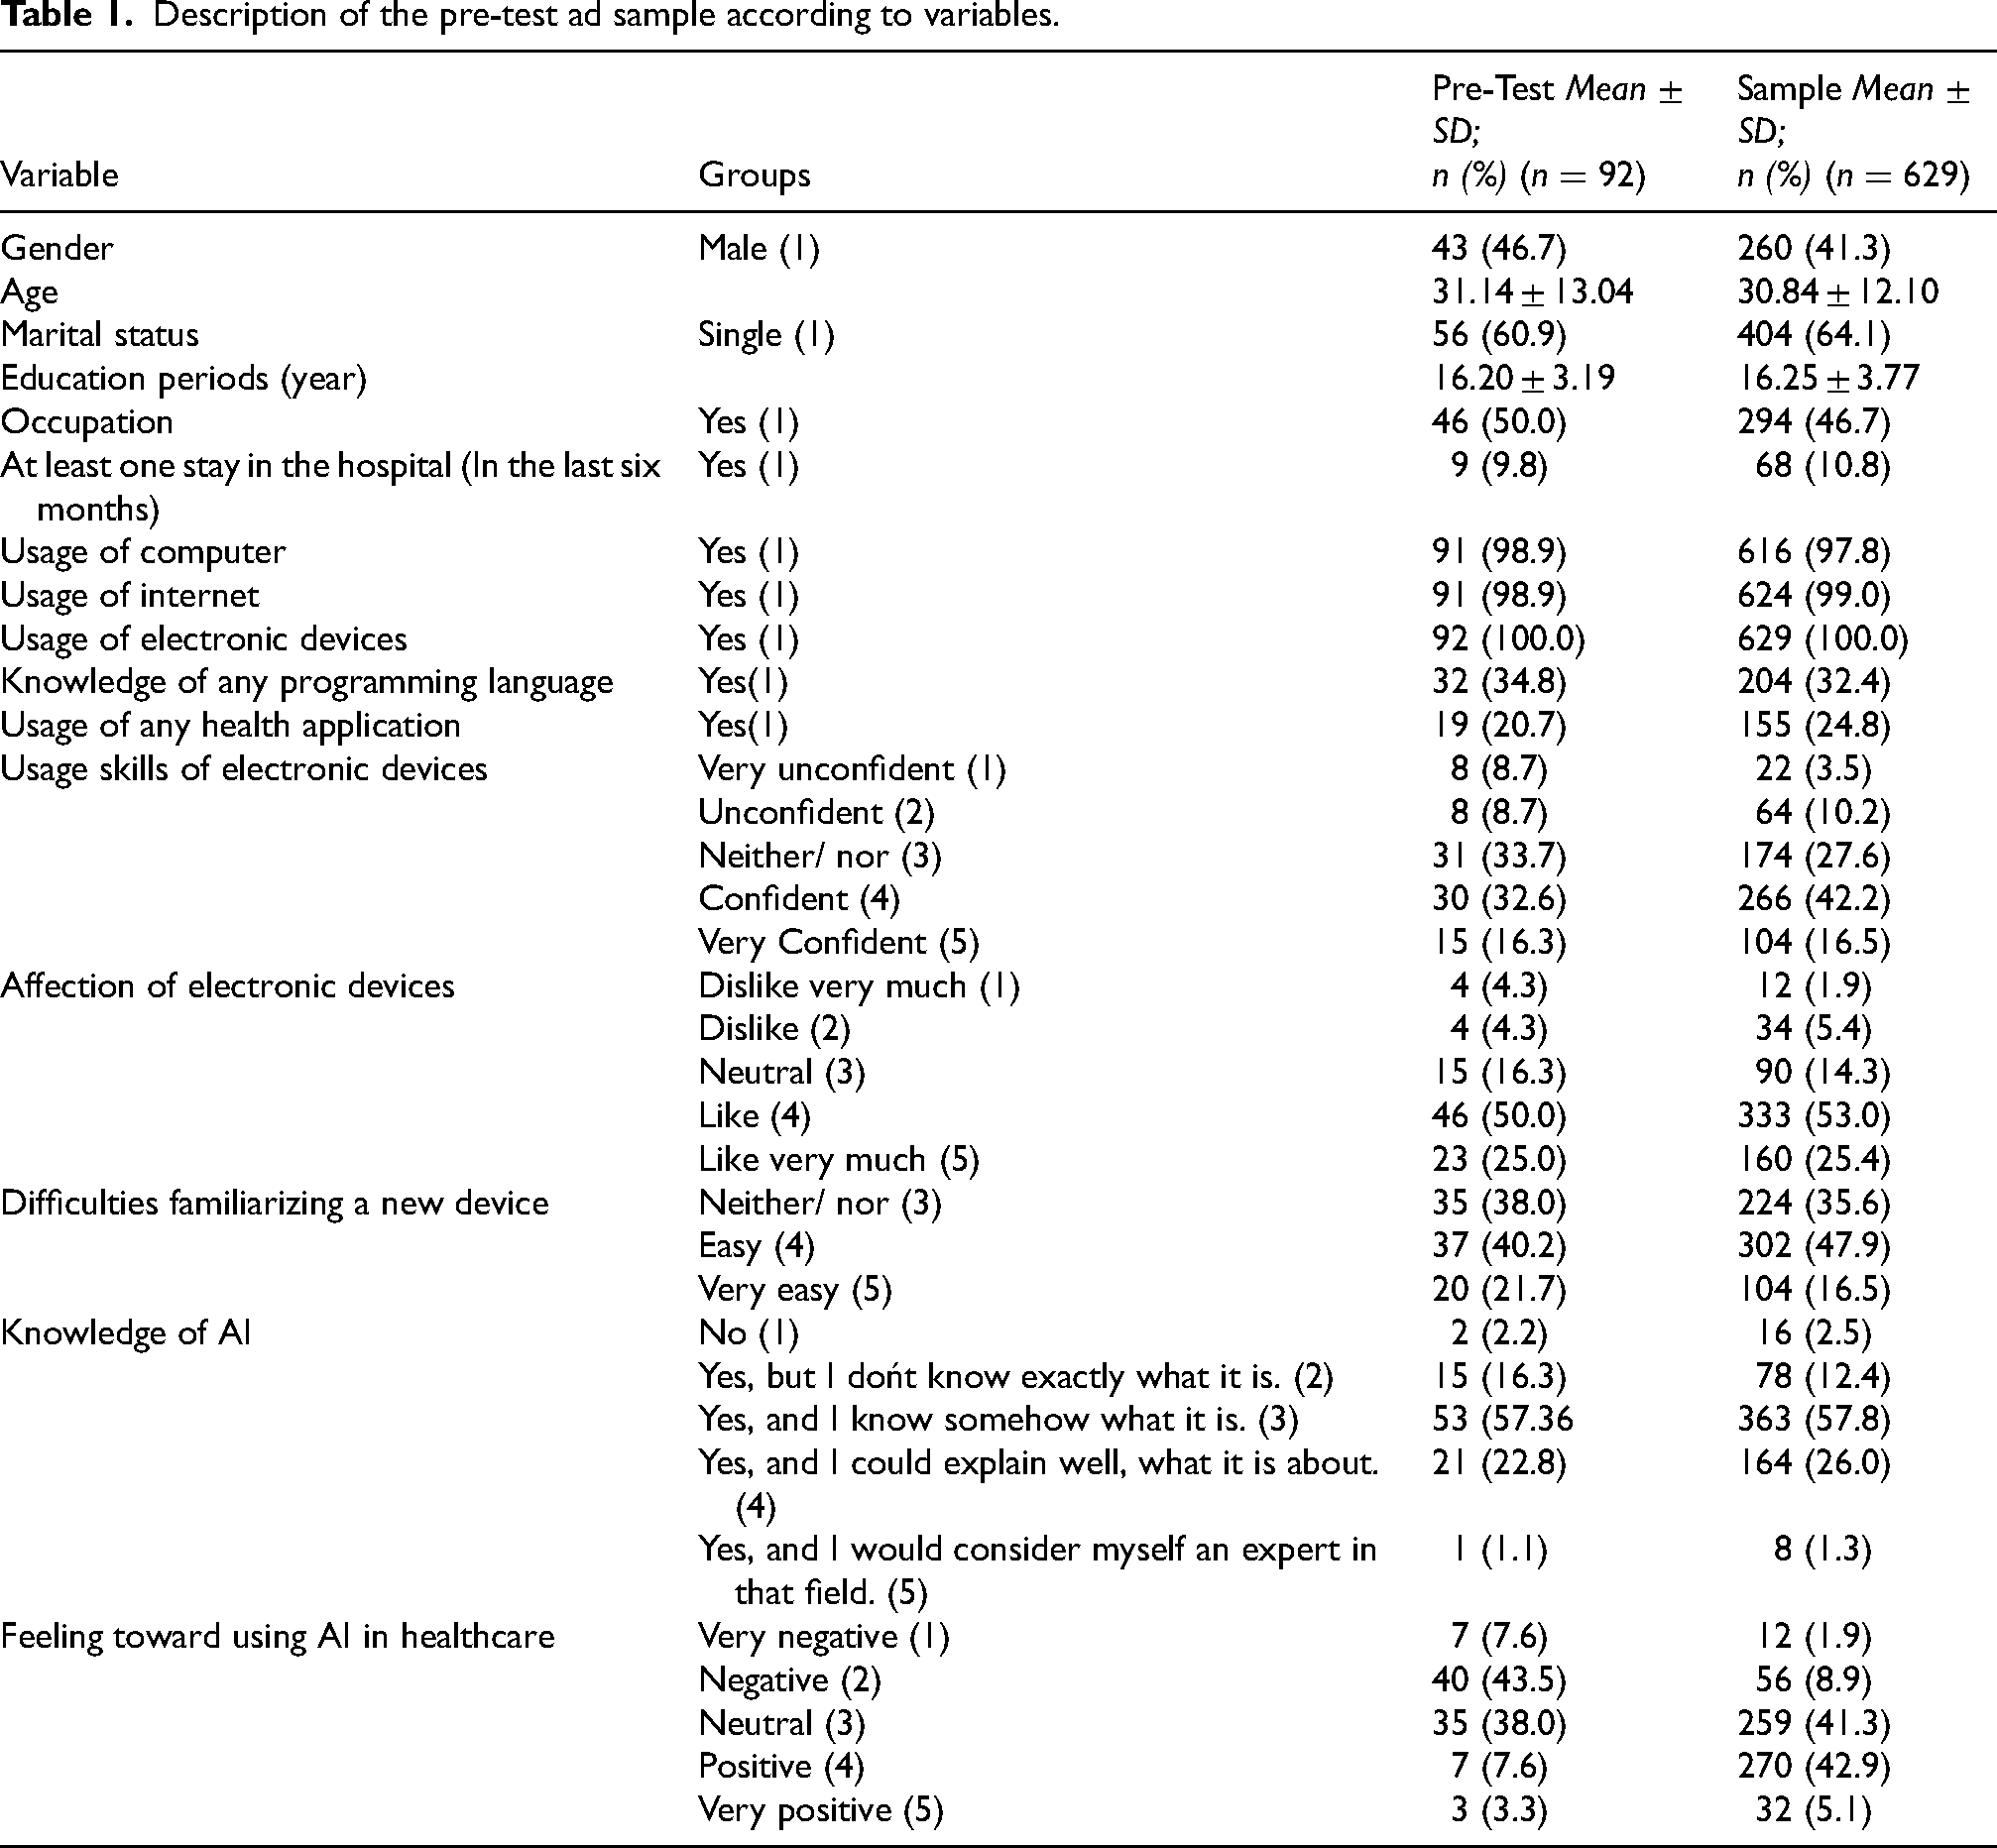
The participants’ ages varied between 18 and 68 (in the pretest: Mean = 31.14, SD = 13.04; in the sample: Mean = 30.84, SD = 12.10). Most participants were female,
Description of the pre-test ad sample according to variables.
Psychometric properties of PAIHS
Content validity was assessed using the pretest sample.. For content validity, five experts (from the fields of linguistics, psychometrics, health services, and nursing) scored the scale on a scale of 1 to 3. The item content validity index (I-CVI) was calculated to be over .80, and the scale content validity index (S-CVI) was calculated to be .87, which was excellent. Construct validity was conducted on the first collected sample group (
Results of exploratory factor analysis (EFA) and confirmatory factor analysis (CFA).
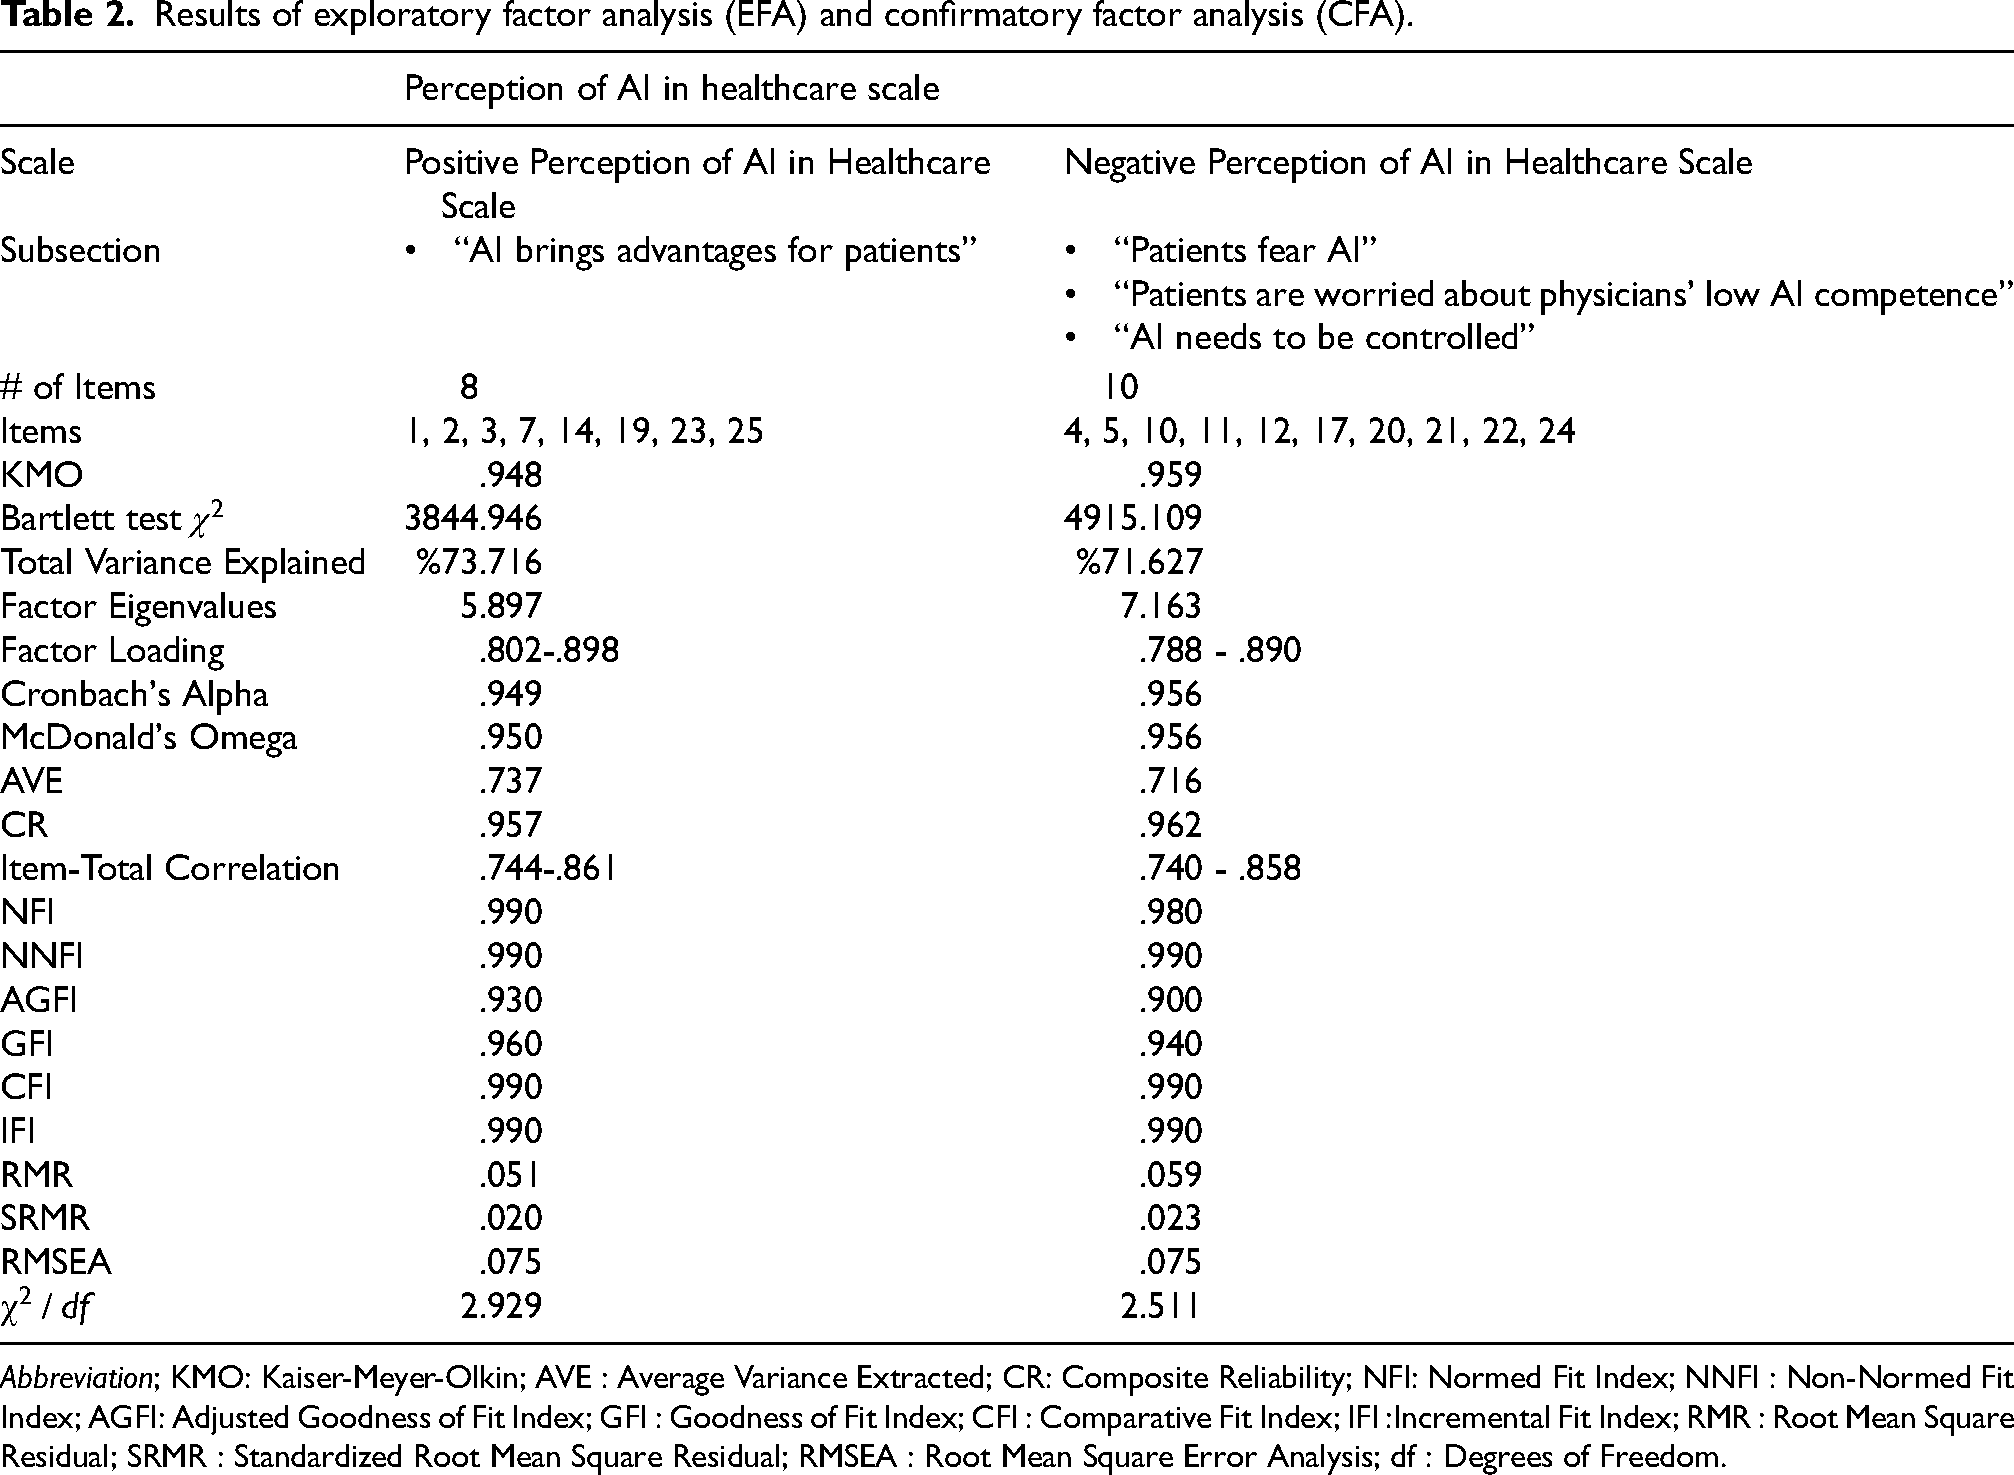
Abbreviation; KMO: Kaiser-Meyer-Olkin; AVE : Average Variance Extracted; CR: Composite Reliability; NFI: Normed Fit Index; NNFI : Non-Normed Fit Index; AGFI: Adjusted Goodness of Fit Index; GFI : Goodness of Fit Index; CFI : Comparative Fit Index; IFI :Incremental Fit Index; RMR : Root Mean Square Residual; SRMR : Standardized Root Mean Square Residual; RMSEA : Root Mean Square Error Analysis; df : Degrees of Freedom.
Cronbach's Alpha and McDonald's Omega reliability coefficients of positive-PAIH-TR were .949, .950, and negative-PAIH-TR were .956, and .956. Both of the scales’ reliabilities were high. Construct validity of positive-PAIH-TR and negative-PAIH-TR was tested with CFA on the sample group in Table 2. The model fit indices for the positive-PAIH-TR scale indicated a good fit to the data:
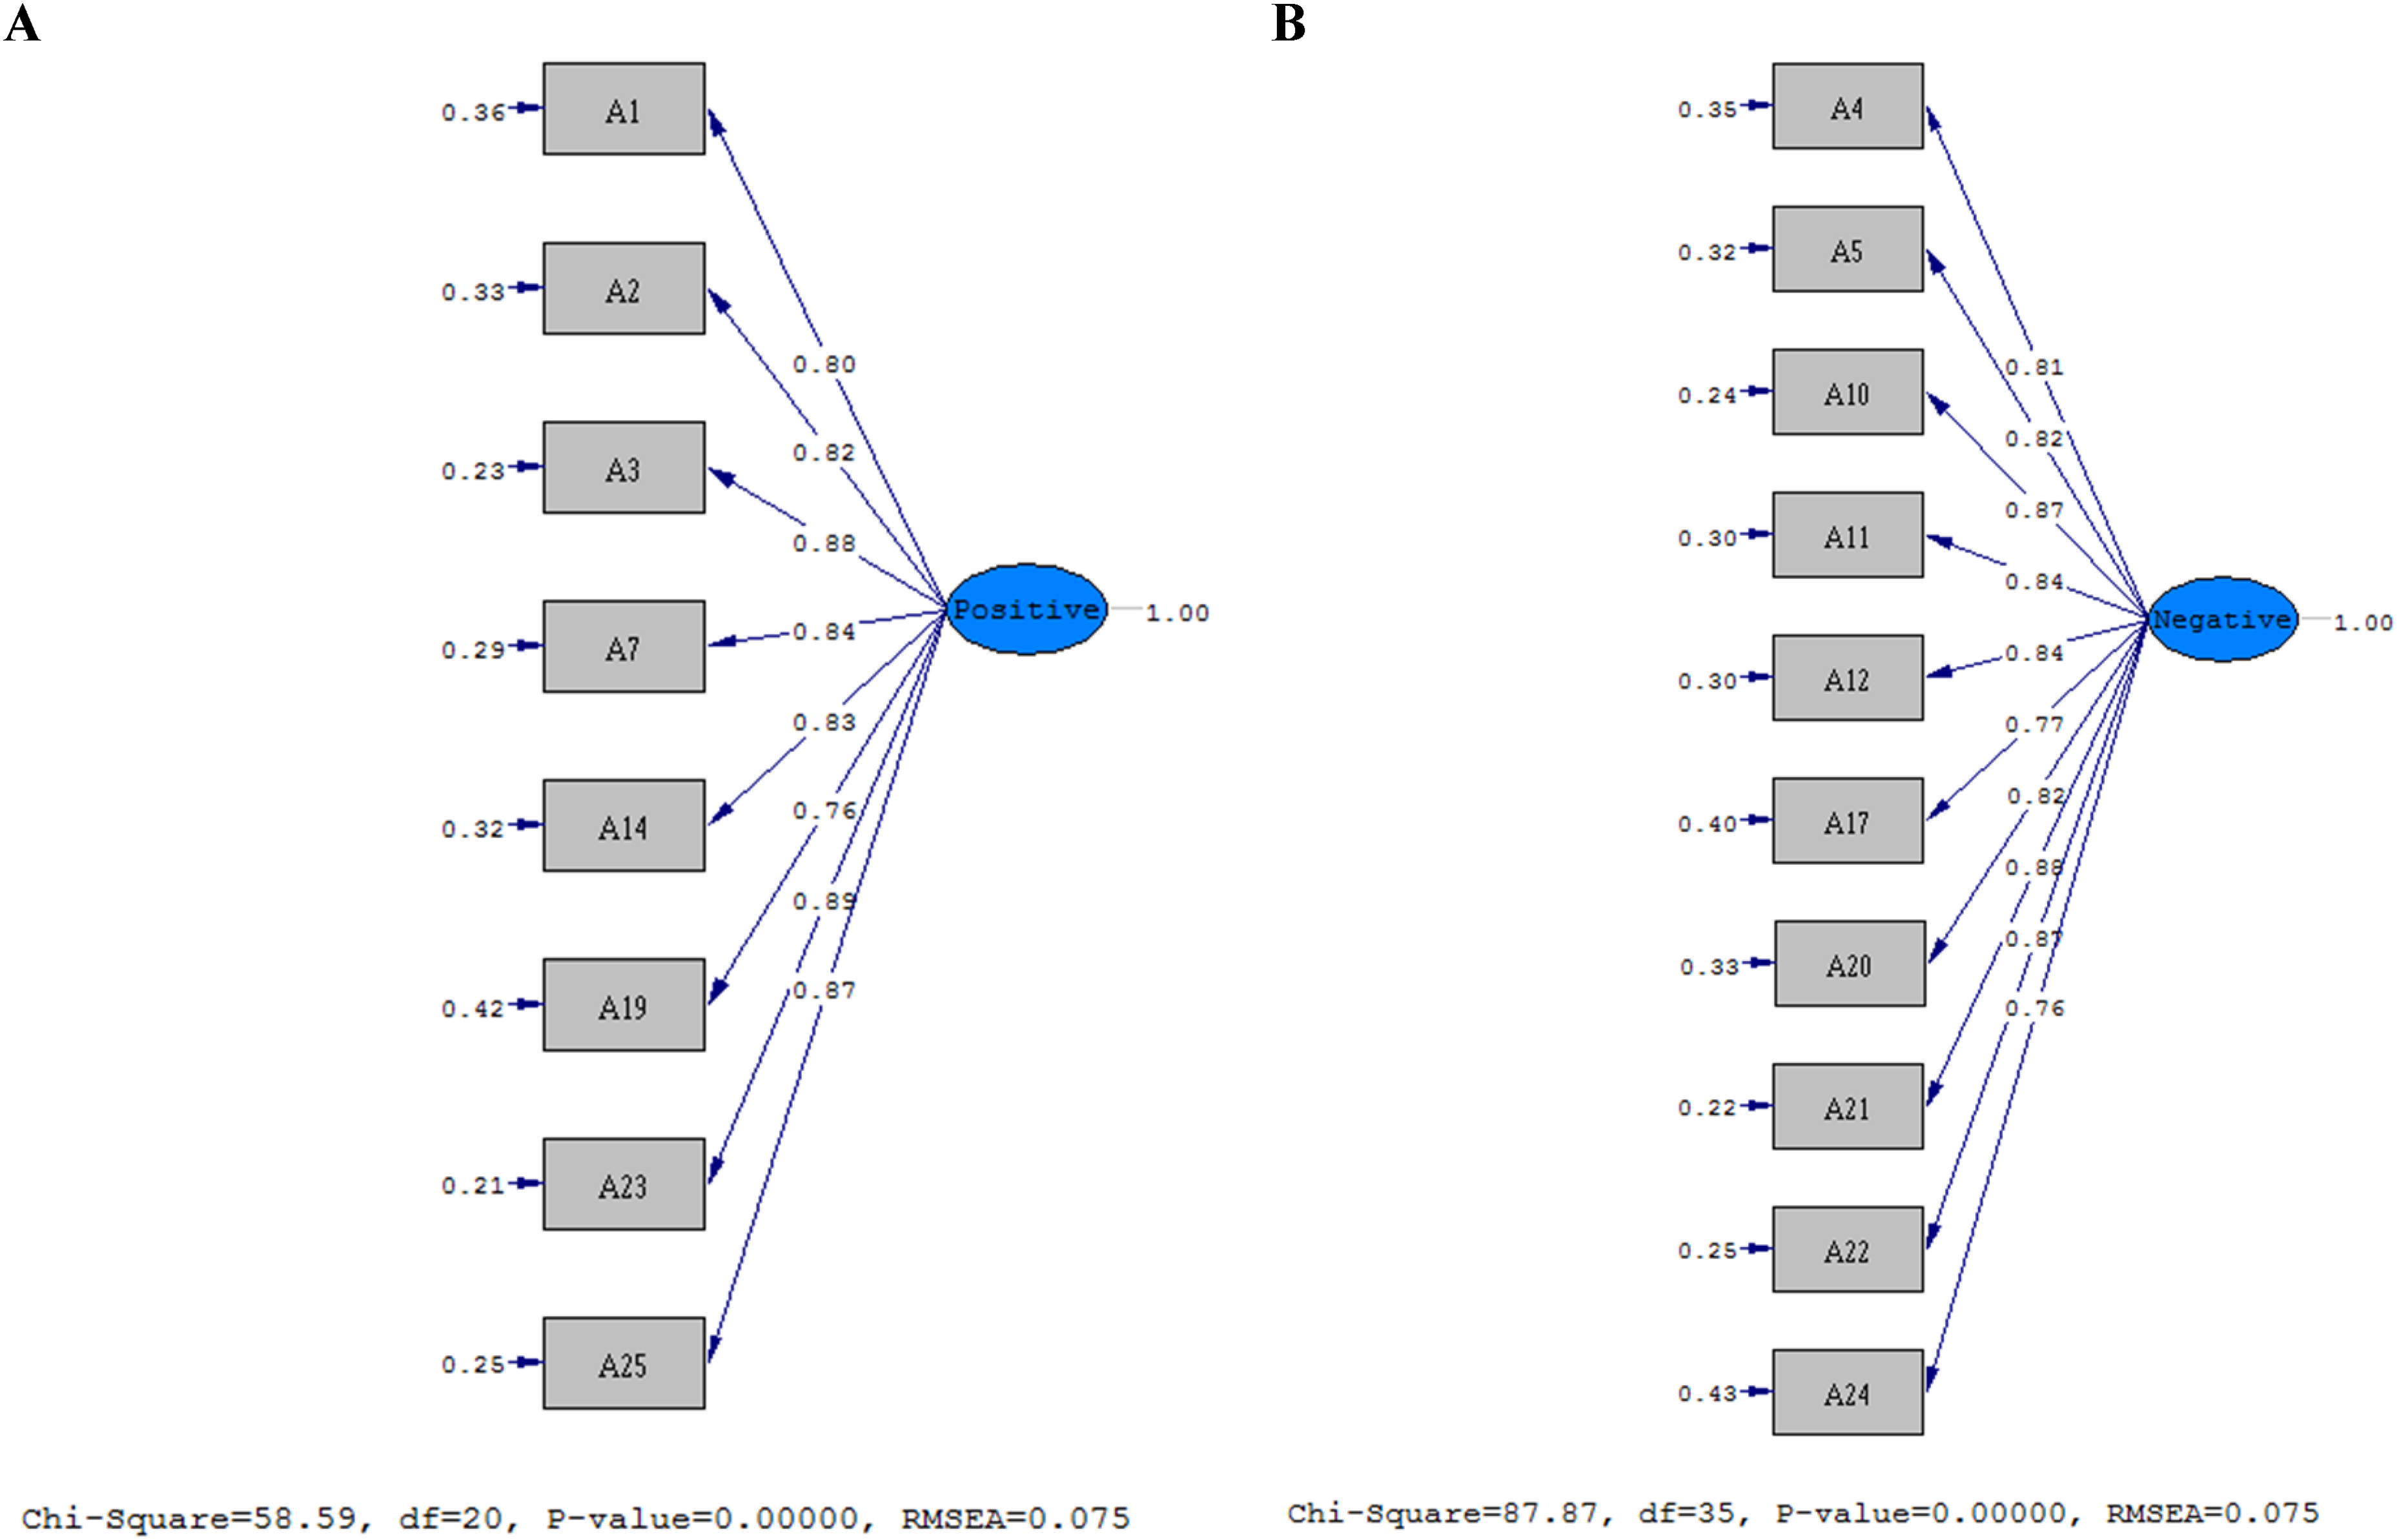
The path diagrams of positive (A) and negative (B) perceptions of AI in healthcare.
In addition, the AVE of positive-PAIH-TR was .74, and the AVE of negative-PAIH-TR was .72, which is adequate for convergent validity. The CR of positive-PAIH-TR was .96, and the CR of negative-PAIH-TR was .96, which were acceptable values. The coefficients were evaluated according to good fits and acceptability, and both measurements were psychometrically valid.
The scale's scores mean categorization is done into three categories: negative, positive, and neutral perception. Participants were categorized based on their mean perception scores: those scoring higher on the positive dimension (52.9%) were classified as having a positive perception, while 44.9% and 2.2% represented negative and neutral perceptions, respectively.
In Figure 2, the first vertical bar represents the participants’ self-reported emotions about the use of AI in healthcare, while the second vertical bar displays the categorized PAIH-TR scores. The colors in the first vertical bar illustrate participants’ emotional reactions to AI usage, ranging from very negative to very positive. In contrast, the colors of the second vertical bar indicate the perception types (positive, neutral, negative) based on the comparison of scale scores. The visualization demonstrates how emotional attitudes correspond with the calculated perception categories. Essentially, the figure reveals participants’ true intentions, especially when they were hesitant to share their perceptions and tried to conceal their feelings when asked to disclose them. 1.6% and 6.3% negative and very negative feelings were still in the negative perception, and 1.7% neutral feelings were still in the neutral perception. 32.4% and 4.8% have positive and very positive feelings and still have positive perceptions, which means 46.8% fall into the same categories. However, 26.7% of neutral feelings fall into negative perception. It was perceived that the feelings towards AI, which were tried to be hidden with neutrality, actually interpreted and defined the sensory information as negative.
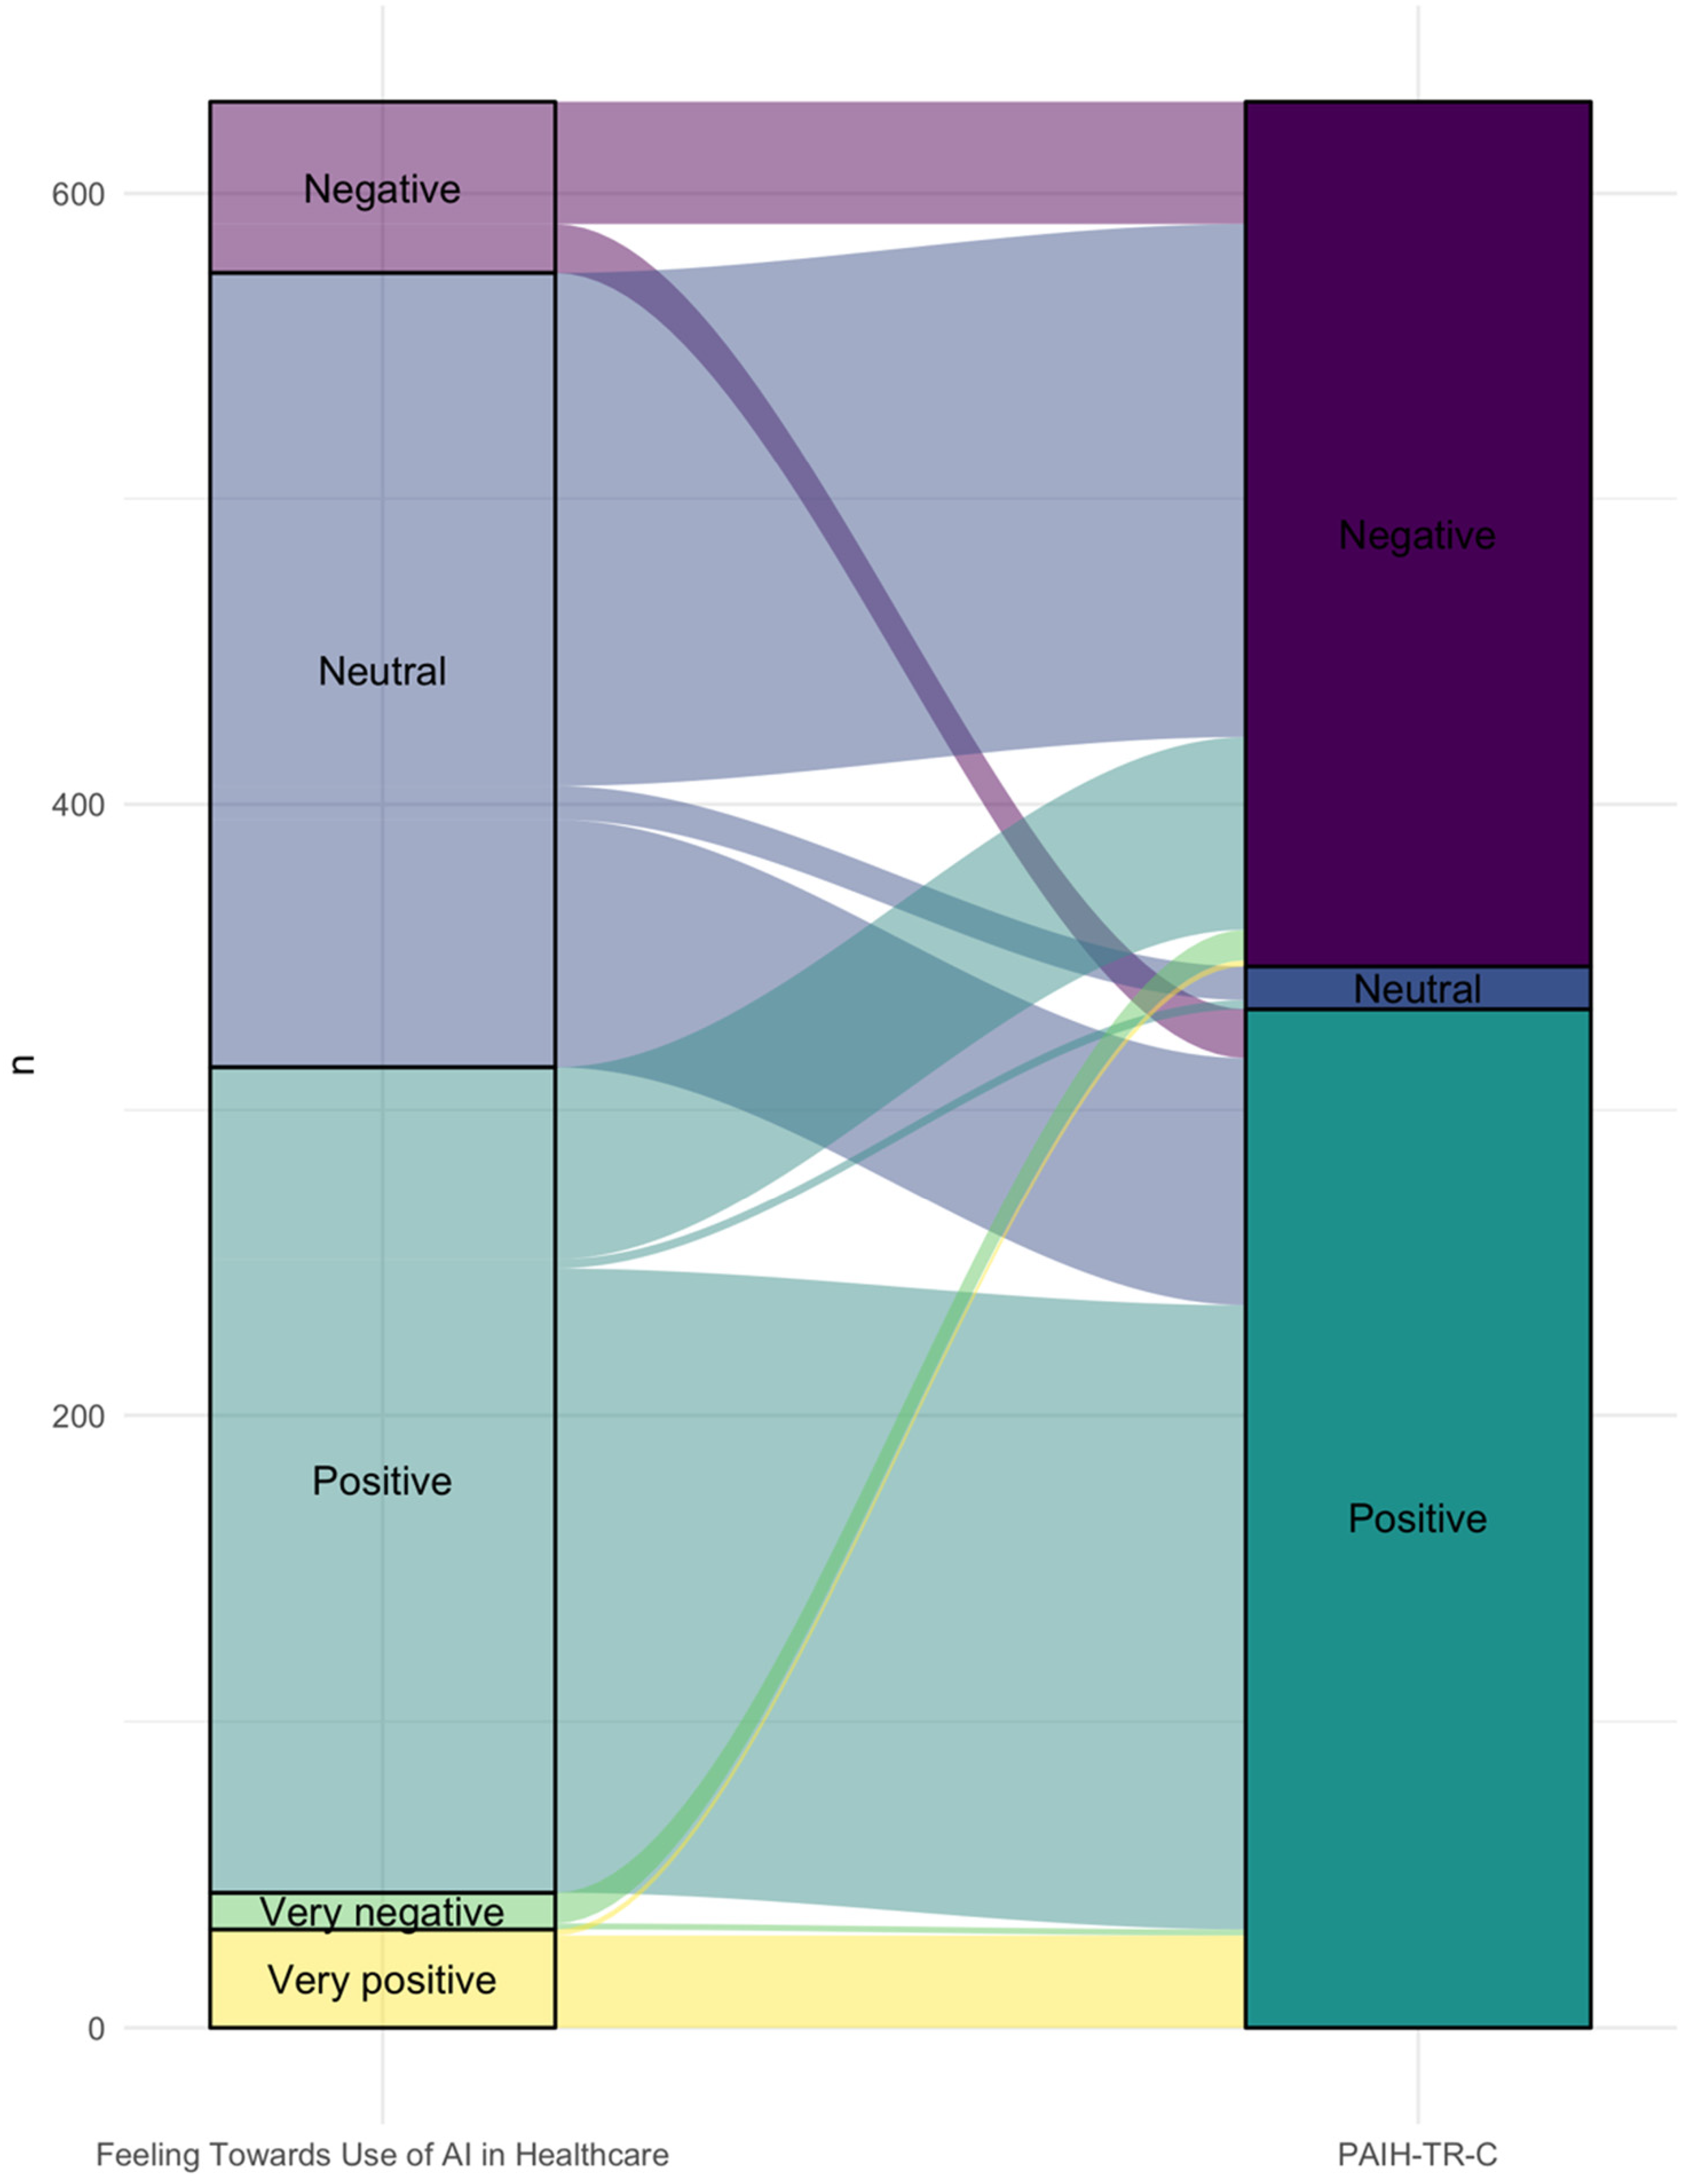
The transition between the feeling towards use of AI in healthcare and the categorize of PAIH-TR scoring quantities plot.
Group comparisons
One-way MANCOVA was used to compare group means with covariates. One assumption of the covariates is that covariates could be either continuous, ordinal, or dichotomous; continuous variables such as age, education years, MMI, and TPS were considered as covariates. Participants’ answers to some variables were not distributed homogeneously.
––Therefore, statistical analysis was not used, especially if 90% of the answers were concentrated in one group of variables. Only two questions (variables) about AI were asked. Since AI was the main aim of the research design, the group comparison was also concentrated on the variables (Figure 3A and B).
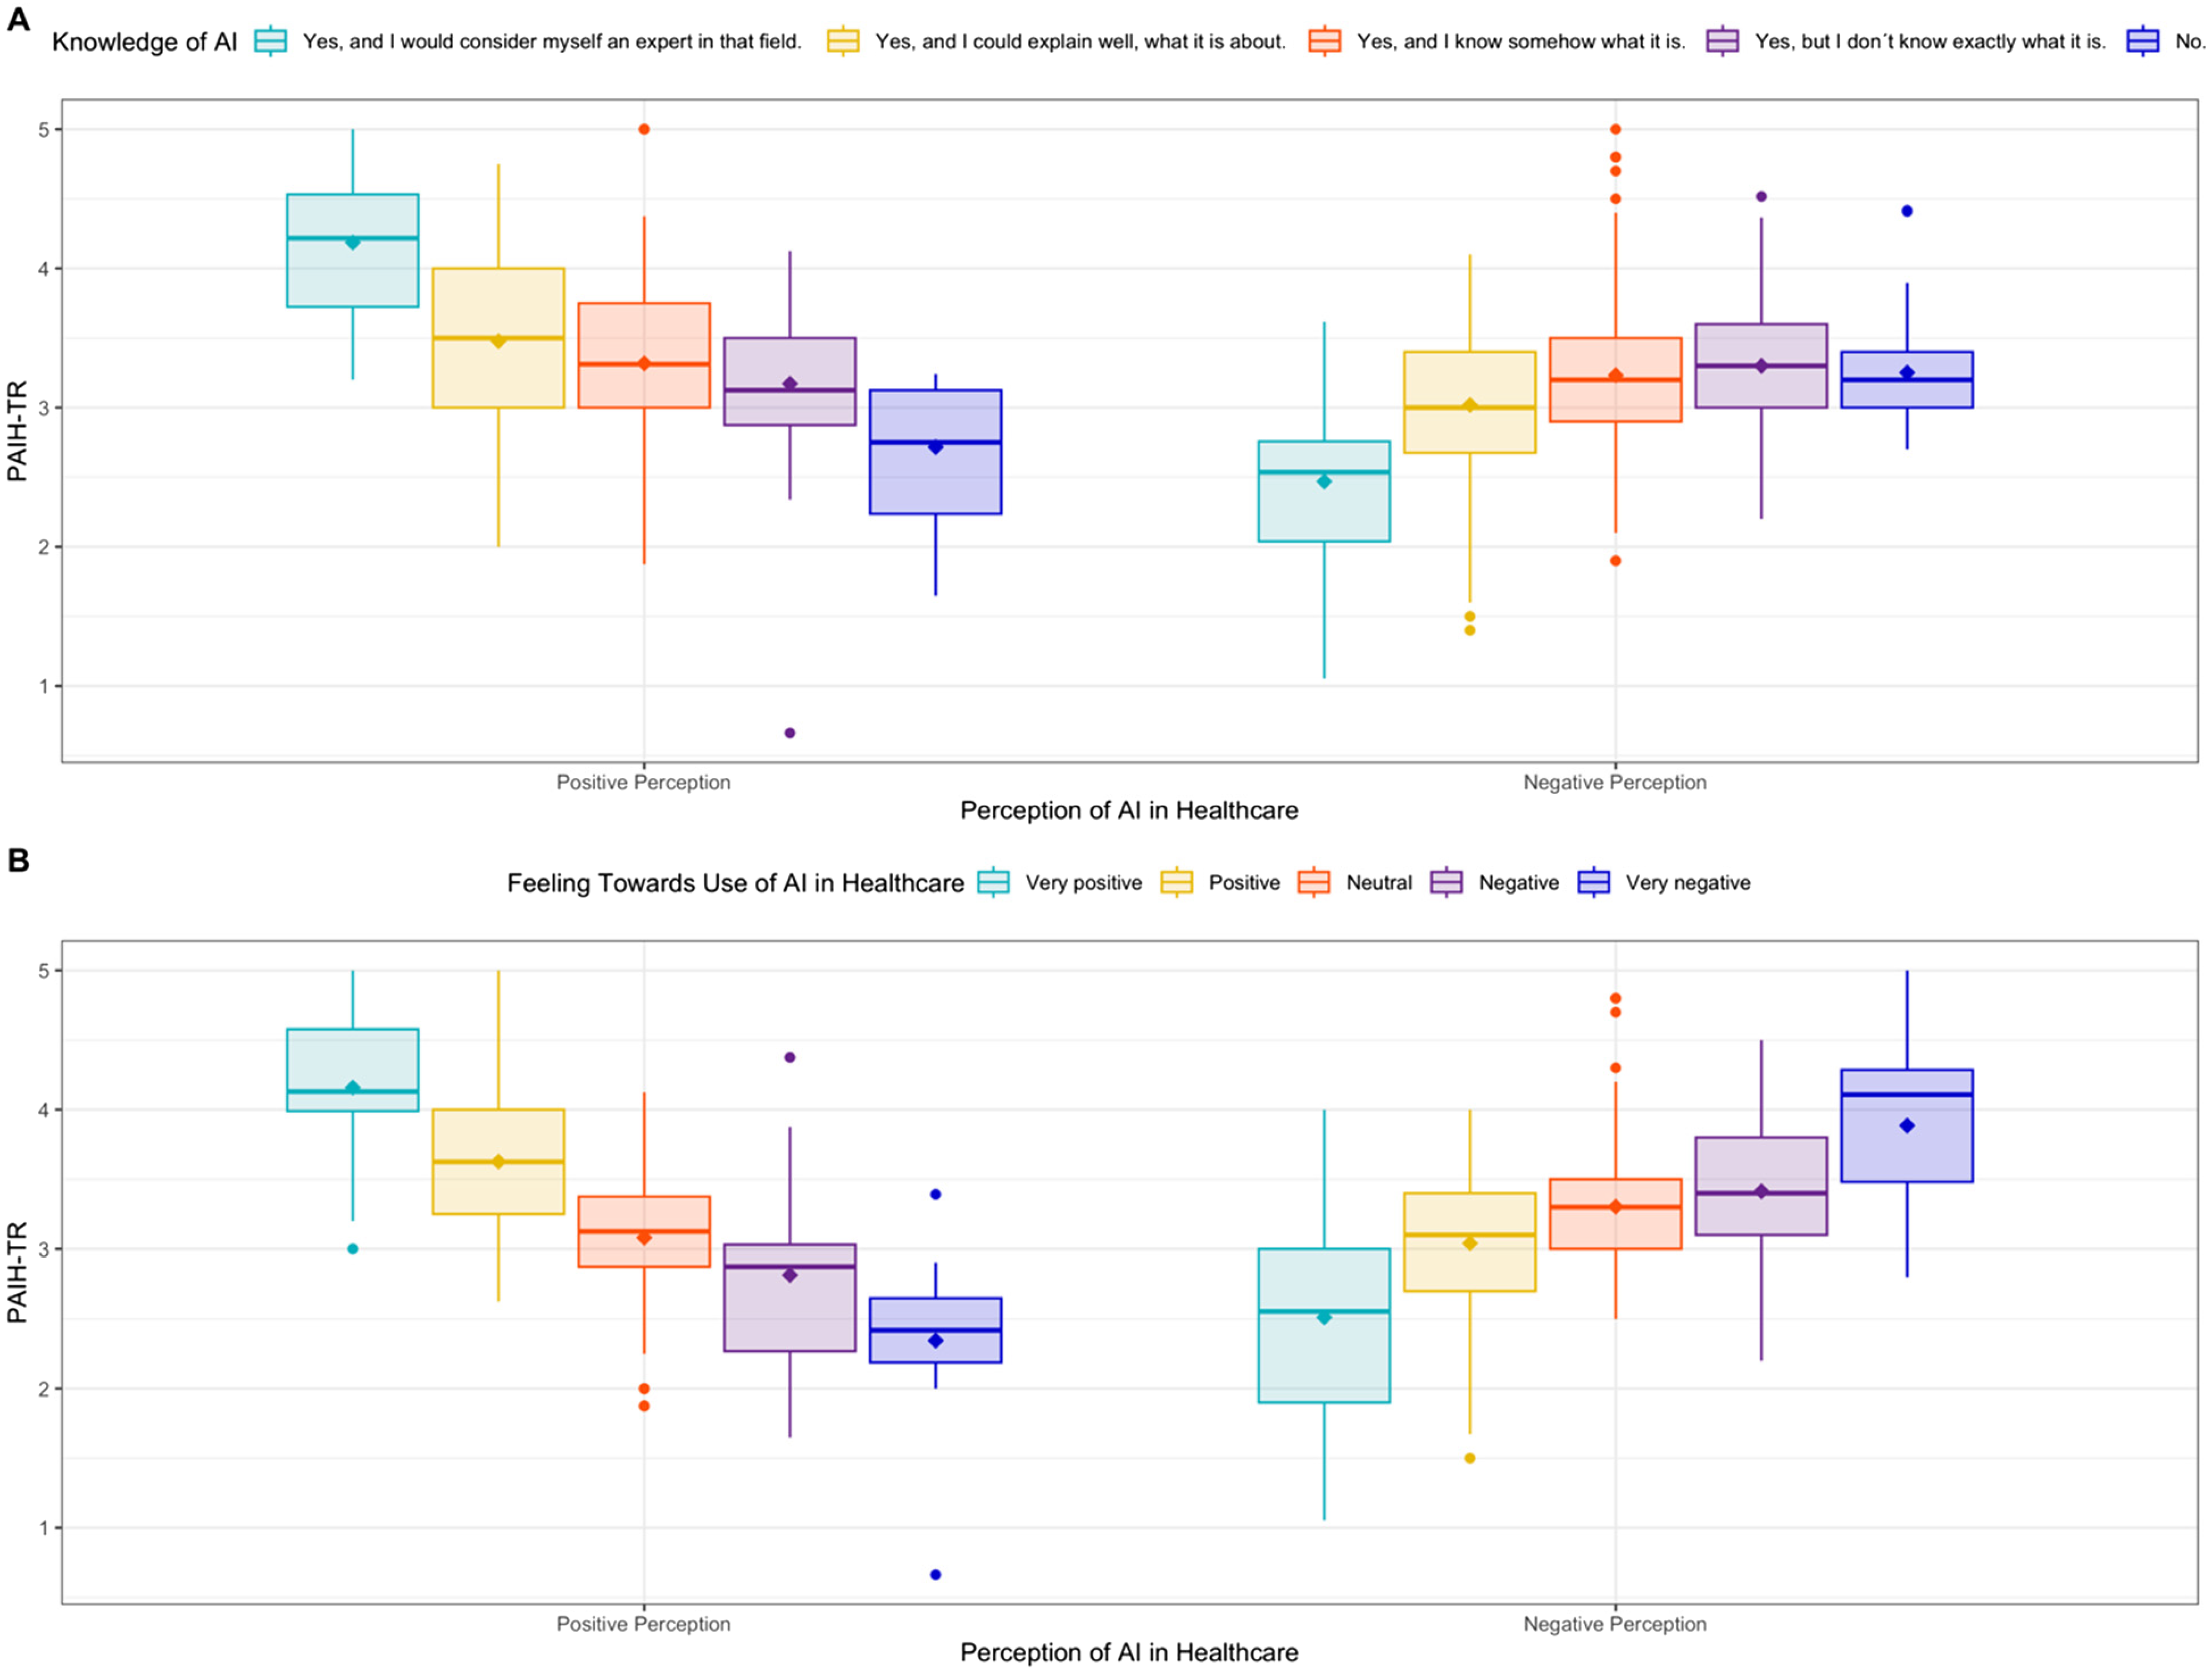
A box and whisker plot displays positive and negative perceptions of AI in healthcare by feeling towards use of AI in healthcare (A) and knowledge of AI (B)- (the diamond shape demonstrates the mean).
MANCOVA results showed significant differences between groups in AI knowledge and feelings toward AI use, even when controlling for variables such as MMI, TPS, age, and years of education. Furthermore, MMI was found to be a significant covariate on both positive and negative perceptions.
MANCOVA showed significant differences between knowledge of AI (Wilks’-Λ = .67, F (10,1240) = 26.93,
There was a statistically significant difference between the feeling towards using AI in healthcare groups on the combined dependent variables after controlling for covariates, F (10,1240) = 69.37,
The psychometric adaptation of the instrument ensured its cultural and linguistic validity. Additionally, the statistical analyses—including Exploratory Factor Analysis (EFA), Confirmatory Factor Analysis (CFA), and Multivariate Analysis of Covariance (MANCOVA)—revealed how perceptions of AI differ among various demographic groups. Together, the steps provide a comprehensive understanding of how cultural context and personal experience influence AI perception in Turkish healthcare.
Discussion
Many studies have examined the perspectives and expectations of healthcare professionals, especially physicians, regarding AI in healthcare.33–38 The study, which focused on the perceptions of individuals who were treated in healthcare organizations within six months, provided important information. In the study conducted by Fritsch et al. (2022) on a sample of patients and companions (
One primary hurdle in integrating AI into healthcare is the lack of a patient-centered approach. The study, which underscores the significance of the approach, delved into participants’ sentiments about AI in healthcare. 39 The majority of participants expressed positive or very positive feelings (48.0%), with a significant number also reporting neutral feelings (41.3%). However, a small number of participants rated the use of AI in healthcare as negative or very negative feelings (10.8%). The diversity of feelings highlights the need for a nuanced approach to integrating AI into healthcare, one that takes into account the concerns and reservations of a significant portion of the population. Emphasizing the need for a patient-centered approach should make the audience feel involved and valued in the process of integrating AI into healthcare. Understanding the perceptions is crucial for the successful integration of AI in healthcare.
The presence of participants in the study who had mostly positive/very positive feelings toward using AI in healthcare is consistent with the results of other studies that reported that most participants had positive perceptions.5,14,15,40,41 The similarity in findings across studies provides a strong foundation for the positive potential of AI in healthcare. 18 However, what makes the study distinctive is the presence of participants with neutral feelings, and the majority of the participants highlighting the urgent need for a more comprehensive understanding of public perceptions of AI in healthcare. Stressing the importance of understanding public perceptions should make the audience feel informed and aware of the complexities involved in the integration of AI in healthcare. Failure to obtain adequate knowledge about the benefits of AI technologies is a potential barrier to adopting AI applications. 2 Therefore, participant perspectives could change significantly if more knowledge and understanding of AI are gained. 42 The understanding is crucial for the successful integration of AI in healthcare.
A key result of the study is that the four-dimensional structure of the original scale was replaced by independent Positive and Negative Perception dimensions. The reduction of the study's scale to two factors is not only a statistical simplification but also a reflection of the cultural and cognitive context. The literature has shown that in societies with high awareness of AI, perceptions are differentiated into more multidimensional themes such as ethical risk, performance expectations, data security, and impact on clinical relationships; whereas in samples with lower knowledge levels, perceptions are concentrated more around the ‘benefit–risk’ dichotomy.8,9,11,43 The two-factor structure obtained in the Turkish sample appears to be consistent with the trend. The finding demonstrates the importance of targeting knowledge gaps and risk perceptions in the dissemination of AI applications and of strengthening transparent communication strategies for patient-centered AI integration. 1 In the study, items from the original sub-dimensions of ‘AI brings advantages for patients’ and ‘AI needs to be controlled’ loaded together under the positive perception factor, while ‘Patients fear AI’ and ‘Patients are worried about physicians’ low AI competence’ converged under the negative perception factor. The dimensionalization will also benefit participants by creating a dominant framework for shaping AI perceptions, with dialectical dimensions such as perceived benefit and perceived risk, which are core components of the TAM.44,45 Participants likely evaluated AI within a general benefit/positive or risk/negative dichotomy, rather than complex sub-dimensions. Therefore, the resulting two-factor structure, beyond being merely a statistical result, reflects an implicit theoretical framework, suggesting that AI perception can be conceptualized in a simpler, dichotomous structure. The scales, the Positive Perception of AI in Healthcare Scale and the Negative Perception of AI in Healthcare Scale, were designed to provide clear categorization of participants’ perceptions. The high reliability of the scales, as indicated by the Cronbach α value, and the good fit to the data, as shown by the CFA goodness of fit coefficients, assure the validity of the findings. The positive-PAIH-TR consists of a total of 8 items, and the negative-PAIH-TR consists of a total of 10 items. To calculate positive and negative perception scores, the arithmetic mean of the item-total scores for each scale was used. Higher mean scores on the positive-PAIH-TR indicate stronger positive perceptions, while higher mean scores on the negative-PAIH-TR indicate stronger negative perceptions. Both scales are 5-point Likert-type (1 = Strongly Disagree, 5 = Strongly Agree); the positive perception score was calculated by averaging eight items, and the negative perception score was calculated by averaging ten items. No weighting was applied based on factor loadings. By calculating the Cronbach α value for the reliability of the scales, we determined that the positive-PAIH-TR (.83) and the negative-PAIH-TR (.74) were highly reliable. Additionally, since both scales’ CFA goodness of fit coefficients were within acceptable ranges, the model generally fits the data well. The results showed that psychometrically evaluated measurement tools could be suitable for use. Threshold rule: This is calculated using participants’ self-reported responses to the scale items. Total scores based on the scale responses, or the average of the total scores, are calculated. After the comparison of calculations, categorization (negative, positive, and neutral) is obtained. The comparison rule is: scores for positive-PAIH-TR are greater than the scores for negative-PAIH-TR, indicating the presence of positive perception; if scores for positive-PAIH-TR are less than scores for negative-PAIH-TR, it indicates negative perception; and if scores for positive-PAIH-TR are equal to the scores for negative-PAIH-TR, it indicates neutral perception. Considering the high percentage of participants responding neutrally, the categorization revealed the direction of perception in AI and the difficult-to-discover neutral perception. While the findings present a clear dichotomy, literature suggests that populations with higher AI literacy often exhibit more nuanced, multidimensional perceptions rather than a simple positive-negative split.5,42 The sample's dominant two-factor structure might indicate a current stage of AI understanding among the Turkish public, in which distinctions between sub-concepts (such as fear of AI vs. fear of physician incompetence with AI) are not yet fully differentiated. According to the scale scores categorization, 52.9% of the participants had a positive perception of using AI in healthcare, 44.9% had a negative perception, and 2.2% had a neutral perception. The results are very important in revealing the actual perceptions of participants with neutral feelings. Thus, a scale was adapted to distinguish between what is felt and what the participants perceive.
The results of the MANCOVA were examined; there was a statistical difference between the means in the AI knowledge groups, and the variable that supported the statistical difference was MMI. When the means were examined, the mean of the participants who said: “Yes, and I would consider myself an expert in that field.” was the highest in terms of positive -PAIH-TR (
A further finding was that there was a statistical difference between the means of feelings towards the use of AI in healthcare, and the significant covariates were age, MMI, and TPS. When the means were examined, the means of the participants’ very negative feelings were the lowest in terms of positive-PAIH-TR (
Starting a few years ago, AI is rapidly settling into healthcare. 47 AI continues to attract attention due to its potential health applications. 2 It is essential to determine perspectives or perceptions by including patients or public members in research to ensure the acceptance of AI tools and applications in healthcare and increase the potential. Individuals who received treatment in a healthcare organization within six months were included in the study. As a result of the study, two scales that provide psychometric properties, independent of each other and measuring positive and negative perception separately, were created. The study is critical because it is the first to measure specific perceptions, namely positive and negative perceptions, and reveals the actual perceptions of people with neutral perceptions. Additionally, it is among the few studies in the national and international literature. In addition to providing a valid and reliable scale for Turkish, the study makes an original contribution by revealing the true emotional orientation underlying neutral perceptions. Another strength of the study is that the scale was adapted cross-culturally according to Beaton's guidelines. However, cultural differences may influence the interpretation of scale items, and future studies should further enhance cross-cultural validation processes supported by cognitive interviews and qualitative data.
The study was limited by a cross-sectional design and reliance on self-reported data. Another limitation is that the survey was conducted online. Since some participants in the research population may have yet to take the online questionnaire, the impacts the sample's representativeness. Another significant limitation is that the study is a cross-sectional survey that provides a snapshot of participants’ views. On the other hand, perceptions change over time, so longitudinal surveys adequately demonstrate the perceptions. This is another reason for the rapid change in technology. Although AI technologies are increasingly integrated into Turkish healthcare—particularly in radiology, diagnostics, and administrative processes—a clear lack of systematic data on public or patient perceptions is evident. The current study is both timely and necessary, providing empirical evidence to guide policymakers and health institutions in the implementation of AI.
The determined criteria have become an advantage in eliminating the study bias. By working with a homogeneous group, the generalizability of the results to many different groups can be assessed. Specifically, students were excluded from the study because they are naturally active technology users. Additionally, the study results found that physicians’ perspectives or expectations towards using AI in healthcare were significantly majority-positive.33,35,37,38
Conclusion
The study goes beyond a simple scale adaptation and offers methodological and contextual integrity for understanding perceptions of AI in healthcare. First, the psychometric properties of the Turkish version of the PAIHS were evaluated and validated as a reliable measurement tool for the Turkish population. Second, using the newly adapted scales, the relationship between AI perceptions and key variables, including medical mistrust, trust in physicians, age, and education, was examined. The combination of the two stages not only provides a scale but also reveals how the scales can be used in practice and which factors may shape AI perceptions. Ultimately, the research serves as both a measurement tool and a guide for researchers, practitioners, healthcare administrators, and policymakers seeking to understand the barriers and facilitators to AI adoption in healthcare.
In future studies, investigating the perceptions of individuals with different diseases can determine the source of positive and negative perceptions towards the clinical applications of AI. Thus, perceptions of AI applications in various healthcare processes can be revealed. Additionally, more comprehensive studies should be conducted to determine and understand perceptions of AI in healthcare according to demographic characteristics, focusing on the perceptions of different groups, such as healthcare professionals and a wide range of age groups of individuals. The adaptability of the scales we created to various study groups and the possibility of regional evaluations throughout the country ensure the applicability of the research to diverse healthcare settings. While the restructuring from four to two dimensions simplified interpretation and improved internal consistency, future studies should examine whether the change influences the multidimensional nuance of AI perceptions in other cultural contexts.
Supplemental Material
sj-docx-1-wor-10.1177_10519815261429412 - Supplemental material for Positive and negative perception of artificial intelligence in healthcare: Psychometric adaptation and validation of the Turkish version
Supplemental material, sj-docx-1-wor-10.1177_10519815261429412 for Positive and negative perception of artificial intelligence in healthcare: Psychometric adaptation and validation of the Turkish version by Nihan Potas, Cemre Eda Erkılıç, Selahattin Caner and Sebastian Johannes Fritsch in WORK
Footnotes
Acknowledgements
The authors thank all participants for their contribution to the study.
Ethical approval
The study was approved by the Ethics Committee (approval number: Ankara Haci Bayram Veli University −2024/20), demonstrating a commitment to high ethical standards in the research.
Informed consent
Informed consent was obtained electronically from all participants after they were provided with detailed information about the study, including its purpose, voluntary participation, the right to withdraw at any time, and the absence of risks or financial burden.
Funding
The authors received no financial support for the research, authorship, and/or publication of this article.
Declaration of conflicting interests
The authors declared no potential conflicts of interest with respect to the research, authorship, and/or publication of this article.
Data availability statement
The datasets generated during and/or analyzed during the current study are available from the corresponding author on reasonable request.
Author agreement
All authors have seen and approved the final version of the manuscript being submitted. We warrant that the article is our original work, has not received prior publication, and is not under consideration for publication elsewhere.
Supplemental material
Supplemental material for this article is available online.
References
Supplementary Material
Please find the following supplemental material available below.
For Open Access articles published under a Creative Commons License, all supplemental material carries the same license as the article it is associated with.
For non-Open Access articles published, all supplemental material carries a non-exclusive license, and permission requests for re-use of supplemental material or any part of supplemental material shall be sent directly to the copyright owner as specified in the copyright notice associated with the article.