
Abstract
Background
Accurate assessment of operator mental workload (MWL) is critical for ensuring safety in closed-cabin environments, yet traditional contact-based sensors are intrusive.
Objective
This study aimed to develop and validate a fully non-contact, multimodal physiological monitoring framework for assessing levels of Mental Workload in closed-cabin environments.
Methods
This study employed a millimeter-wave radar and a camera to non-contactually acquire ECG, respiration, and eye movement signals from 30 participants performing a four-level monitoring task.
Results
Physiological features demonstrated a significant correlation with task difficulty. A Random Forest classifier built on these features achieved 83.33% accuracy in distinguishing the four MWL levels.
Conclusions
This study validates a fully non-contact, multimodal physiological monitoring framework, providing a practical paradigm for non-intrusive, continuous cognitive state assessment in safety-critical domains.
Keywords
Introduction
With the increasing automation of modern human-machine systems, particularly in enclosed cabins within high-stakes domains, crew responsibilities have shifted toward continuous monitoring relying heavily on visual information. 1 This sustained cognitive demand elevates mental workload (MWL), increasing susceptibility to mental fatigue and safety risks.2,3
Accurate MWL assessment is critical, as suboptimal levels (overload or underload) degrade operational performance—manifested as increased errors, slower reaction times, and reduced situational awareness4,5—which can lead to catastrophic consequences in safety-sensitive environments. 6 Furthermore, prolonged high MWL negatively impacts crew members’ long-term stress levels and overall well-being. 7 Establishing robust MWL detection methods is essential for understanding the causal link between cognitive load and human error.5,8 Ultimately, reliable MWL evaluation not only enhances system safety but also facilitates the development of adaptive systems that dynamically adjust task demands, maintaining operators within a safe and efficient cognitive operating range. 9 Therefore, the development and validation of robust methods for MWL detection remains a key imperative for advancing system safety, efficiency, and crew member well-being in modern workplaces.
As cognitive demands increasingly outweigh physical ones in modern computerized systems, MWL evaluation has become crucial in ergonomics. While definitions vary—focusing on information processing capacity, 10 finite cognitive resources, 11 or processable information limits 12 —MWL is generally influenced by task requirements, individual capabilities, and performance outcomes. 13 Currently, MWL is primarily assessed via three methods: subjective reports, physiological signals, and behavioral performance.9,14,15
In subjective approaches, crew members evaluate workload based on task experience. 16 The NASA-TLX is the most widely adopted tool due to its simplicity and cost-effectiveness. 4 However, self-reports are susceptible to external biases 17 and rely on conscious awareness, which may fluctuate. Crucially, these post-hoc methods lack the temporal resolution to capture dynamic, real-time workload variations, highlighting the need for objective, continuous assessment.
To overcome subjective limitations, physiological methods offer objective, continuous workload assessment18,19 through indicators like EEG, cardiac/respiratory activity, and eye movements.20–24 In closed cabins, heart rate variability (HRV) is particularly dominant and highly sensitive to MWL changes.21,22,25–27 However, traditional contact-based sensors (e.g., ECG electrodes) are intrusive and may alter crew behavior, undermining data validity. Consequently, non-contact alternatives are gaining traction. For example, camera-based eye movement systems have shown promise in driver monitoring, 28 while respiratory parameters, especially respiratory rate, are increasingly utilized for workload assessment. 29 While physiological metrics are highly objective, they can be confounded by extraneous environmental or emotional factors. Additionally, even newer portable neuroimaging tools like functional near-infrared spectroscopy (fNIRS) 30 still require head-mounted sensors, restricting their use in dynamic, constrained environments. The third MWL assessment method, task performance, directly evaluates operational outcomes.31,32 However, its effectiveness is limited by non-linear ambiguity—since performance degrades under both overload and underload conditions 33 —making it essential to combine performance metrics with continuous physiological monitoring.
While existing literature acknowledges the potential of non-contact monitoring, most studies rely on single physiological modalities or have not effectively integrated emerging bio-radar with vision-based sensing. Consequently, a significant research gap exists in the form of an empirically validated framework that fuses multiple non-contact signals to accurately classify granular levels of MWL during complex tasks. To address this gap, the present study introduces and validates a fully non-contact, multimodal system that innovatively combines millimeter-wave radar (for ECG and RSP signals) with a standard camera (for eye movements). By developing a Random Forest classifier, we demonstrate that this integrated approach can accurately distinguish four distinct MWL levels, thereby providing a practical framework for non-intrusive, continuous cognitive state monitoring in safety-critical domains.
This paper is divided into several sections: Chapter 2 describes the experimental process and introduces the adopted signal processing algorithm. Chapter 3 presents the experimental results along with the outcomes of the cross-validation method. A discussion of these results is provided in Chapter 4. Finally, Chapter 5 presents the conclusion.
Methods
The methodology of this study comprised four primary stages (Figure 1). (1) Experimental Design and Data Acquisition: We designed an instrument monitoring task with four graded difficulty levels to induce varying MWL states in 30 participants. During task execution, we synchronously collected subjective data (NASA-TLX), behavioral performance data (RT, accuracy), and multimodal physiological data. (2) Non-contact Signal Processing and Feature Extraction: Physiological signals were acquired non-intrusively, using a 77 GHz bio-radar for ECG and RSP signals and a standard camera for eye movement data. These raw signals were then processed to extract 15 distinct physiological features related to MWL. (3) Statistical Validation: One-way ANOVA was employed to statistically validate whether the four task difficulties resulted in significant differences across the subjective, performance, and physiological measures. (4) MWL Classification Modeling: Finally, the 15 extracted physiological features were used as inputs to construct and train a Random Forest (RF) classifier to identify the four MWL levels, and its classification performance was evaluated.
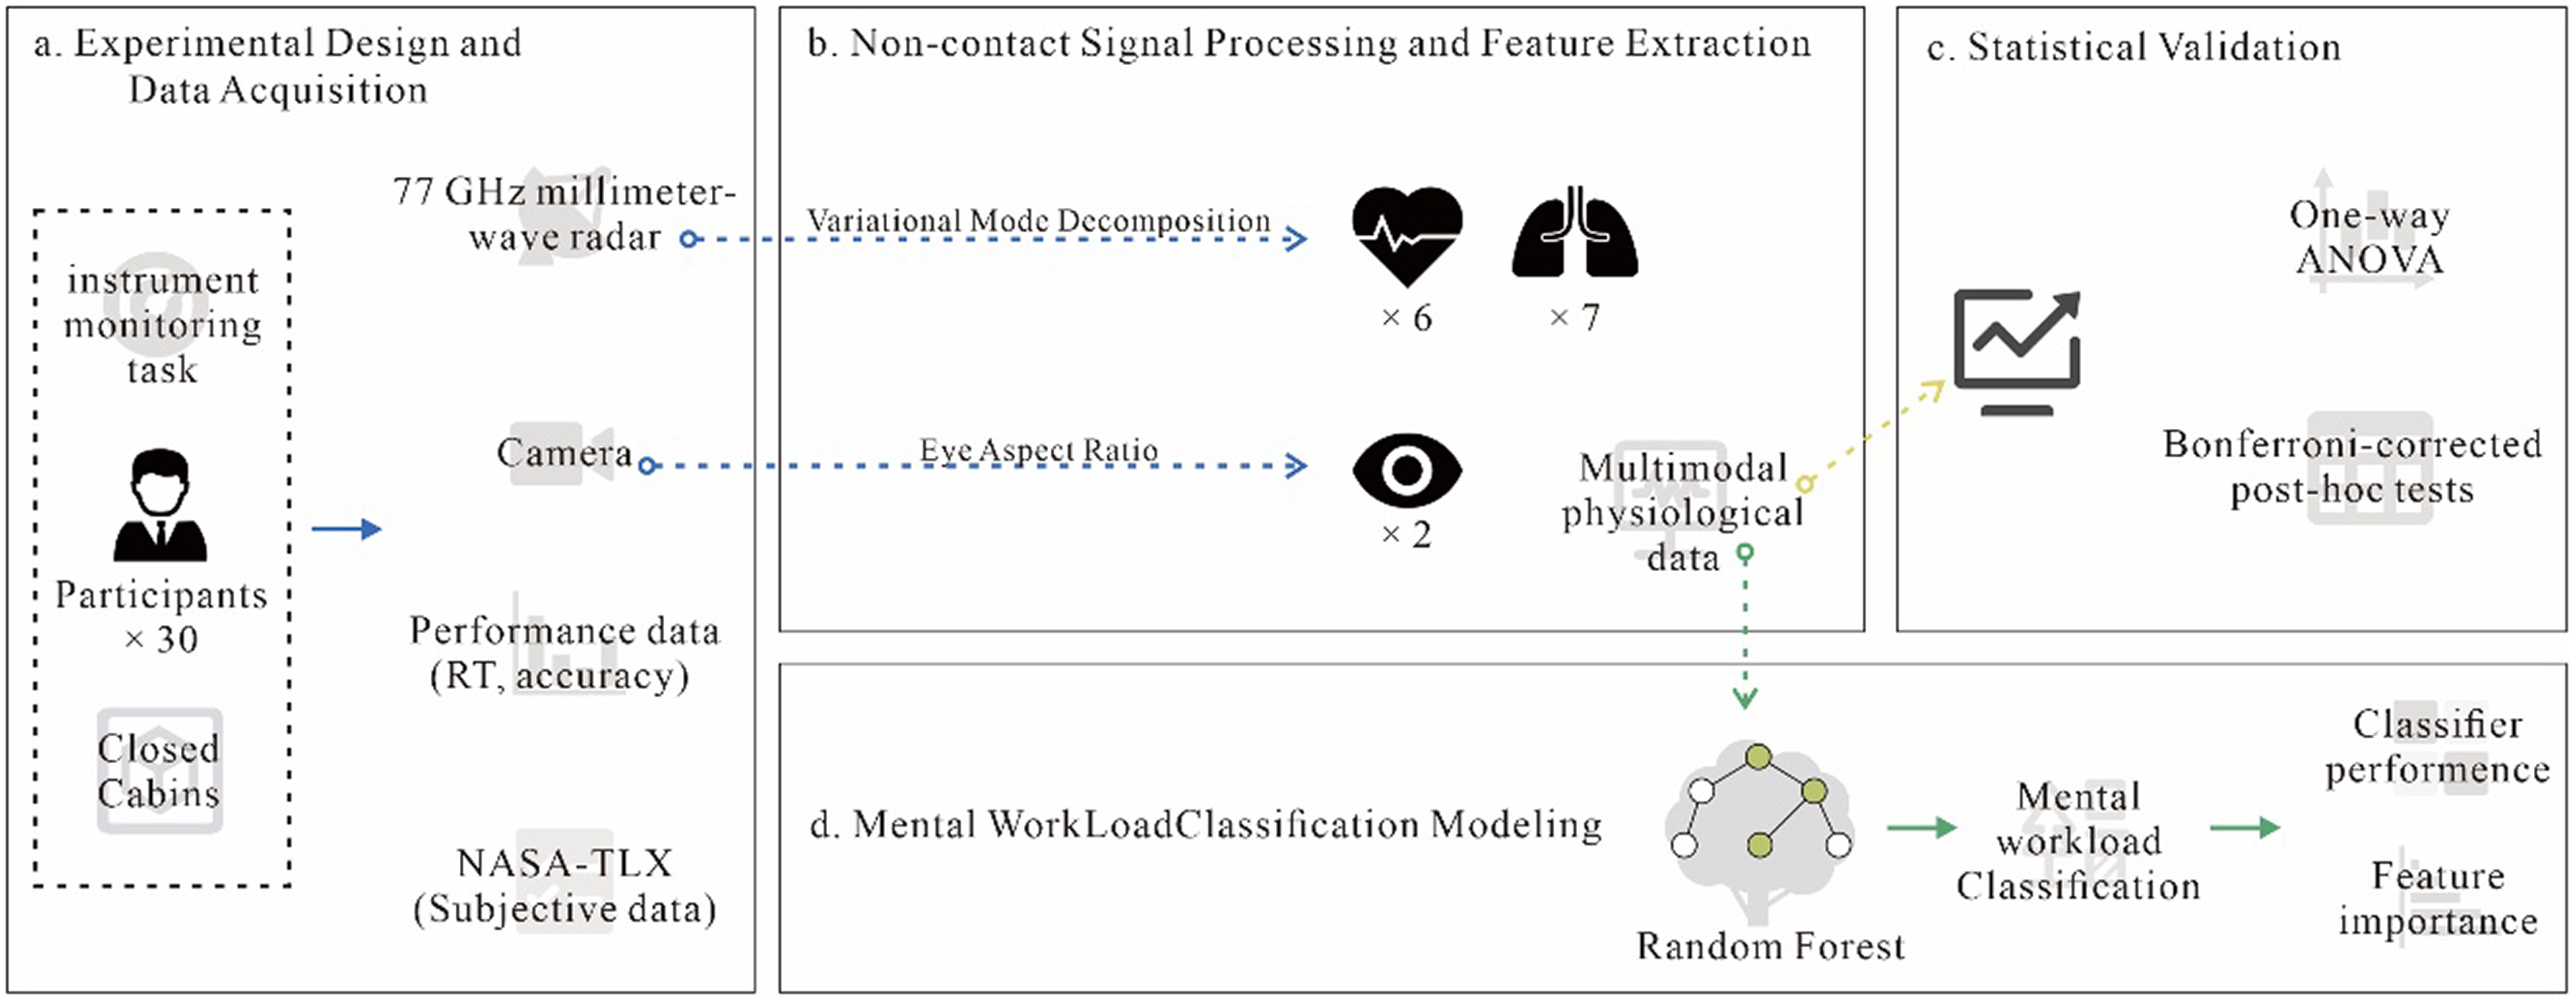
Overall schematic diagram of methodology.
Selection of mental workload measures
(1) NASA-TLX
The NASA-TLX was selected as the subjective instrument for evaluating MWL. The assessment process comprises two steps. First, participants engage in a task analogous to the main experimental procedure. Following task completion, they rate their perceived workload across six dimensions: mental demand, physical demand, temporal demand, performance, effort, and frustration. 34 The final workload score is computed as the unweighted mean of these six subscales. This approach has been shown to be psychologically equivalent to the original weighted scoring method proposed by the NASA-TLX developers. Prior research indicates that the weighted average offers no substantial advantage over the simple mean in terms of sensitivity or reliability.35,36
(2) Physiological Features
Considering insights from existing literature and the practical challenges of data acquisition, ECG, respiratory, and ocular movement signals were selected as the primary physiological modalities, from which a range of features were extracted.
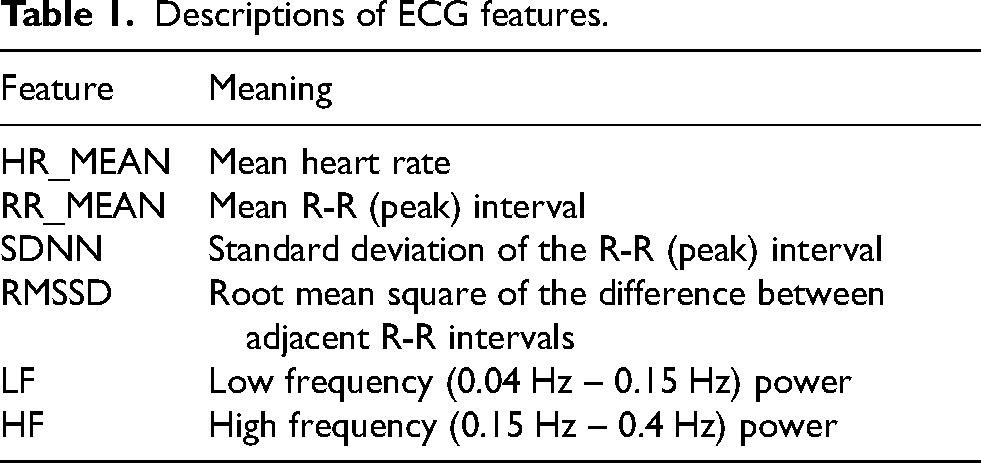
ECG technology employs multiple sensors to measure the electrical activity of the heart. This repetitive electrical signal indicates the moments when the heart pumps blood into the surrounding parts of the body. Different features associated with this waveform can be utilized to assess heart activity, thereby providing a deeper understanding of MWL. Heart activity can also be analyzed in both the time and frequency domains, specifically through HRV. 26 As such, six features that could be derived from the bio-radar ECG data were selected (Table 1).
Descriptions of ECG features.
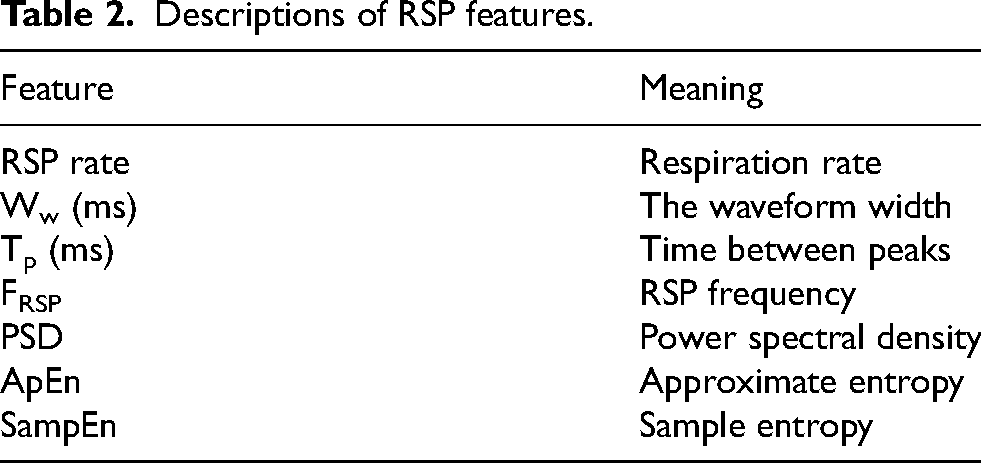
In the context of respiratory analysis, MWL is typically assessed through features such as respiratory amplitude, respiratory rate, airflow, and ventilation volume. The measurement of MWL relies heavily on variations in these respiratory-related features, which are crucial for detecting MWL. 37 In the present study, the focus was exclusively on features that could be measured using bio-radar technology (Table 2).
Descriptions of RSP features.
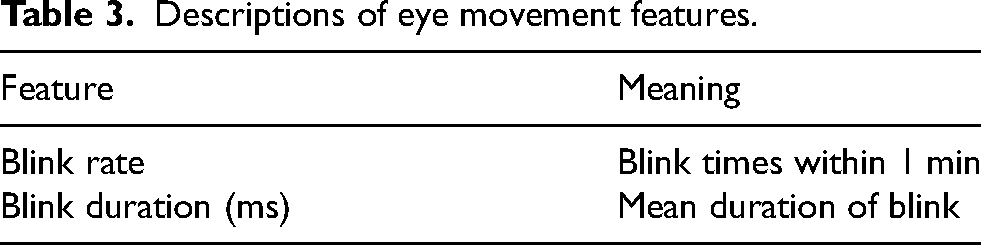
Eye movement measurement is a technique employed to assess features related to eye movements. In the literature, features related to eye movements are frequently considered indirect indicators of mental workload.38,39 For instance, blink duration and pupil diameter can indicate the level of attention during tasks. However, due to the challenges associated with measuring pupil diameter using non-contact equipment, this metric was excluded from the present study. Further, evidence from the literature suggests that blink rate may also be related to MWL. 40 Consequently, blink duration and blink rate were selected (Table 3).
Descriptions of eye movement features.
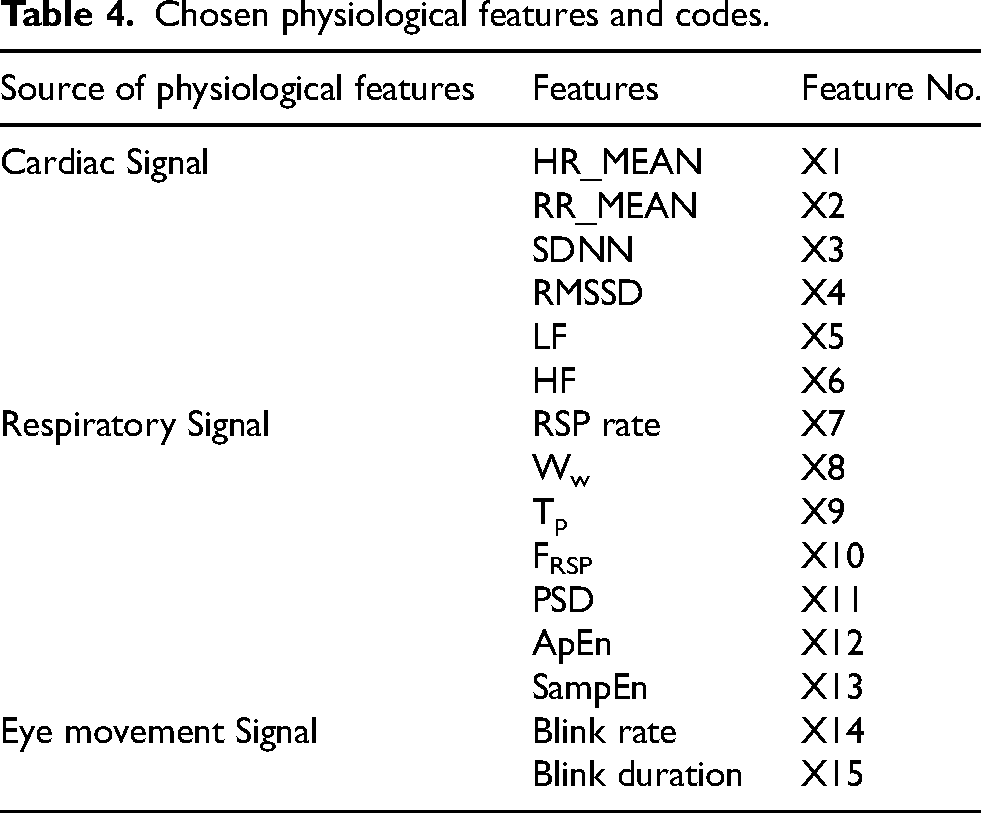
In summary, 15 physiological features related to MWL were selected from electrocardiograms, respiration, and eye movement, as presented in Table 4.
Chosen physiological features and codes.
Experiment design and data acquisition
Task design
Enclosed cabins, such as those found in manned submersibles and similar equipment, are characterized by a high level of automation. Within these environments, crew members primarily oversee the autonomous operation of systems and intervene only when necessary. Given the complexity of the associated information processing, monitoring tasks can be classified into three sequential stages: perception, judgment and decision-making, and execution. Instrument monitoring serves as a representative example of such tasks, involving all three stages. According to attention resource theory, cognitive demand increases proportionally with the number of monitored information sources. 41 To simulate real-world conditions associated with closed-cabin operations and to isolate task components relevant to the research focus, human-computer interaction processes in modern systems were examined. By extracting corresponding cognitive models and analyzing neural mechanisms, particularly those related to information processing, cognition, and decision-making, instrument monitoring tasks were identified as representative examples.
To support this investigation, instrument monitoring software was developed using PsychoPy, 42 based on the framework proposed by Fan et al. 31 In contrast to the original study, the present implementation incorporated four difficulty levels to elicit varying degrees of mental workload. Figure 2(b) presents the task interfaces corresponding to difficulty levels 1 through 4. Each task comprised multiple trials, with each trial lasting 6000 ms, during which a maximum of one target stimulus could appear. In these trials, a single instrument parameter occasionally exceeded the predefined normal range, with the ratio of target to non-target stimuli maintained at 1:1. The normal operating ranges and the associated response actions for out-of-range parameters were specified in advance. During the experiment, participants were instructed to monitor the displayed parameters and determine whether they fell within the normal range. Upon detecting an anomaly, participants were required to respond as quickly and accurately as possible using either designated response keys or the space bar. The software automatically recorded both reaction time (RT) and response accuracy throughout the experiment.
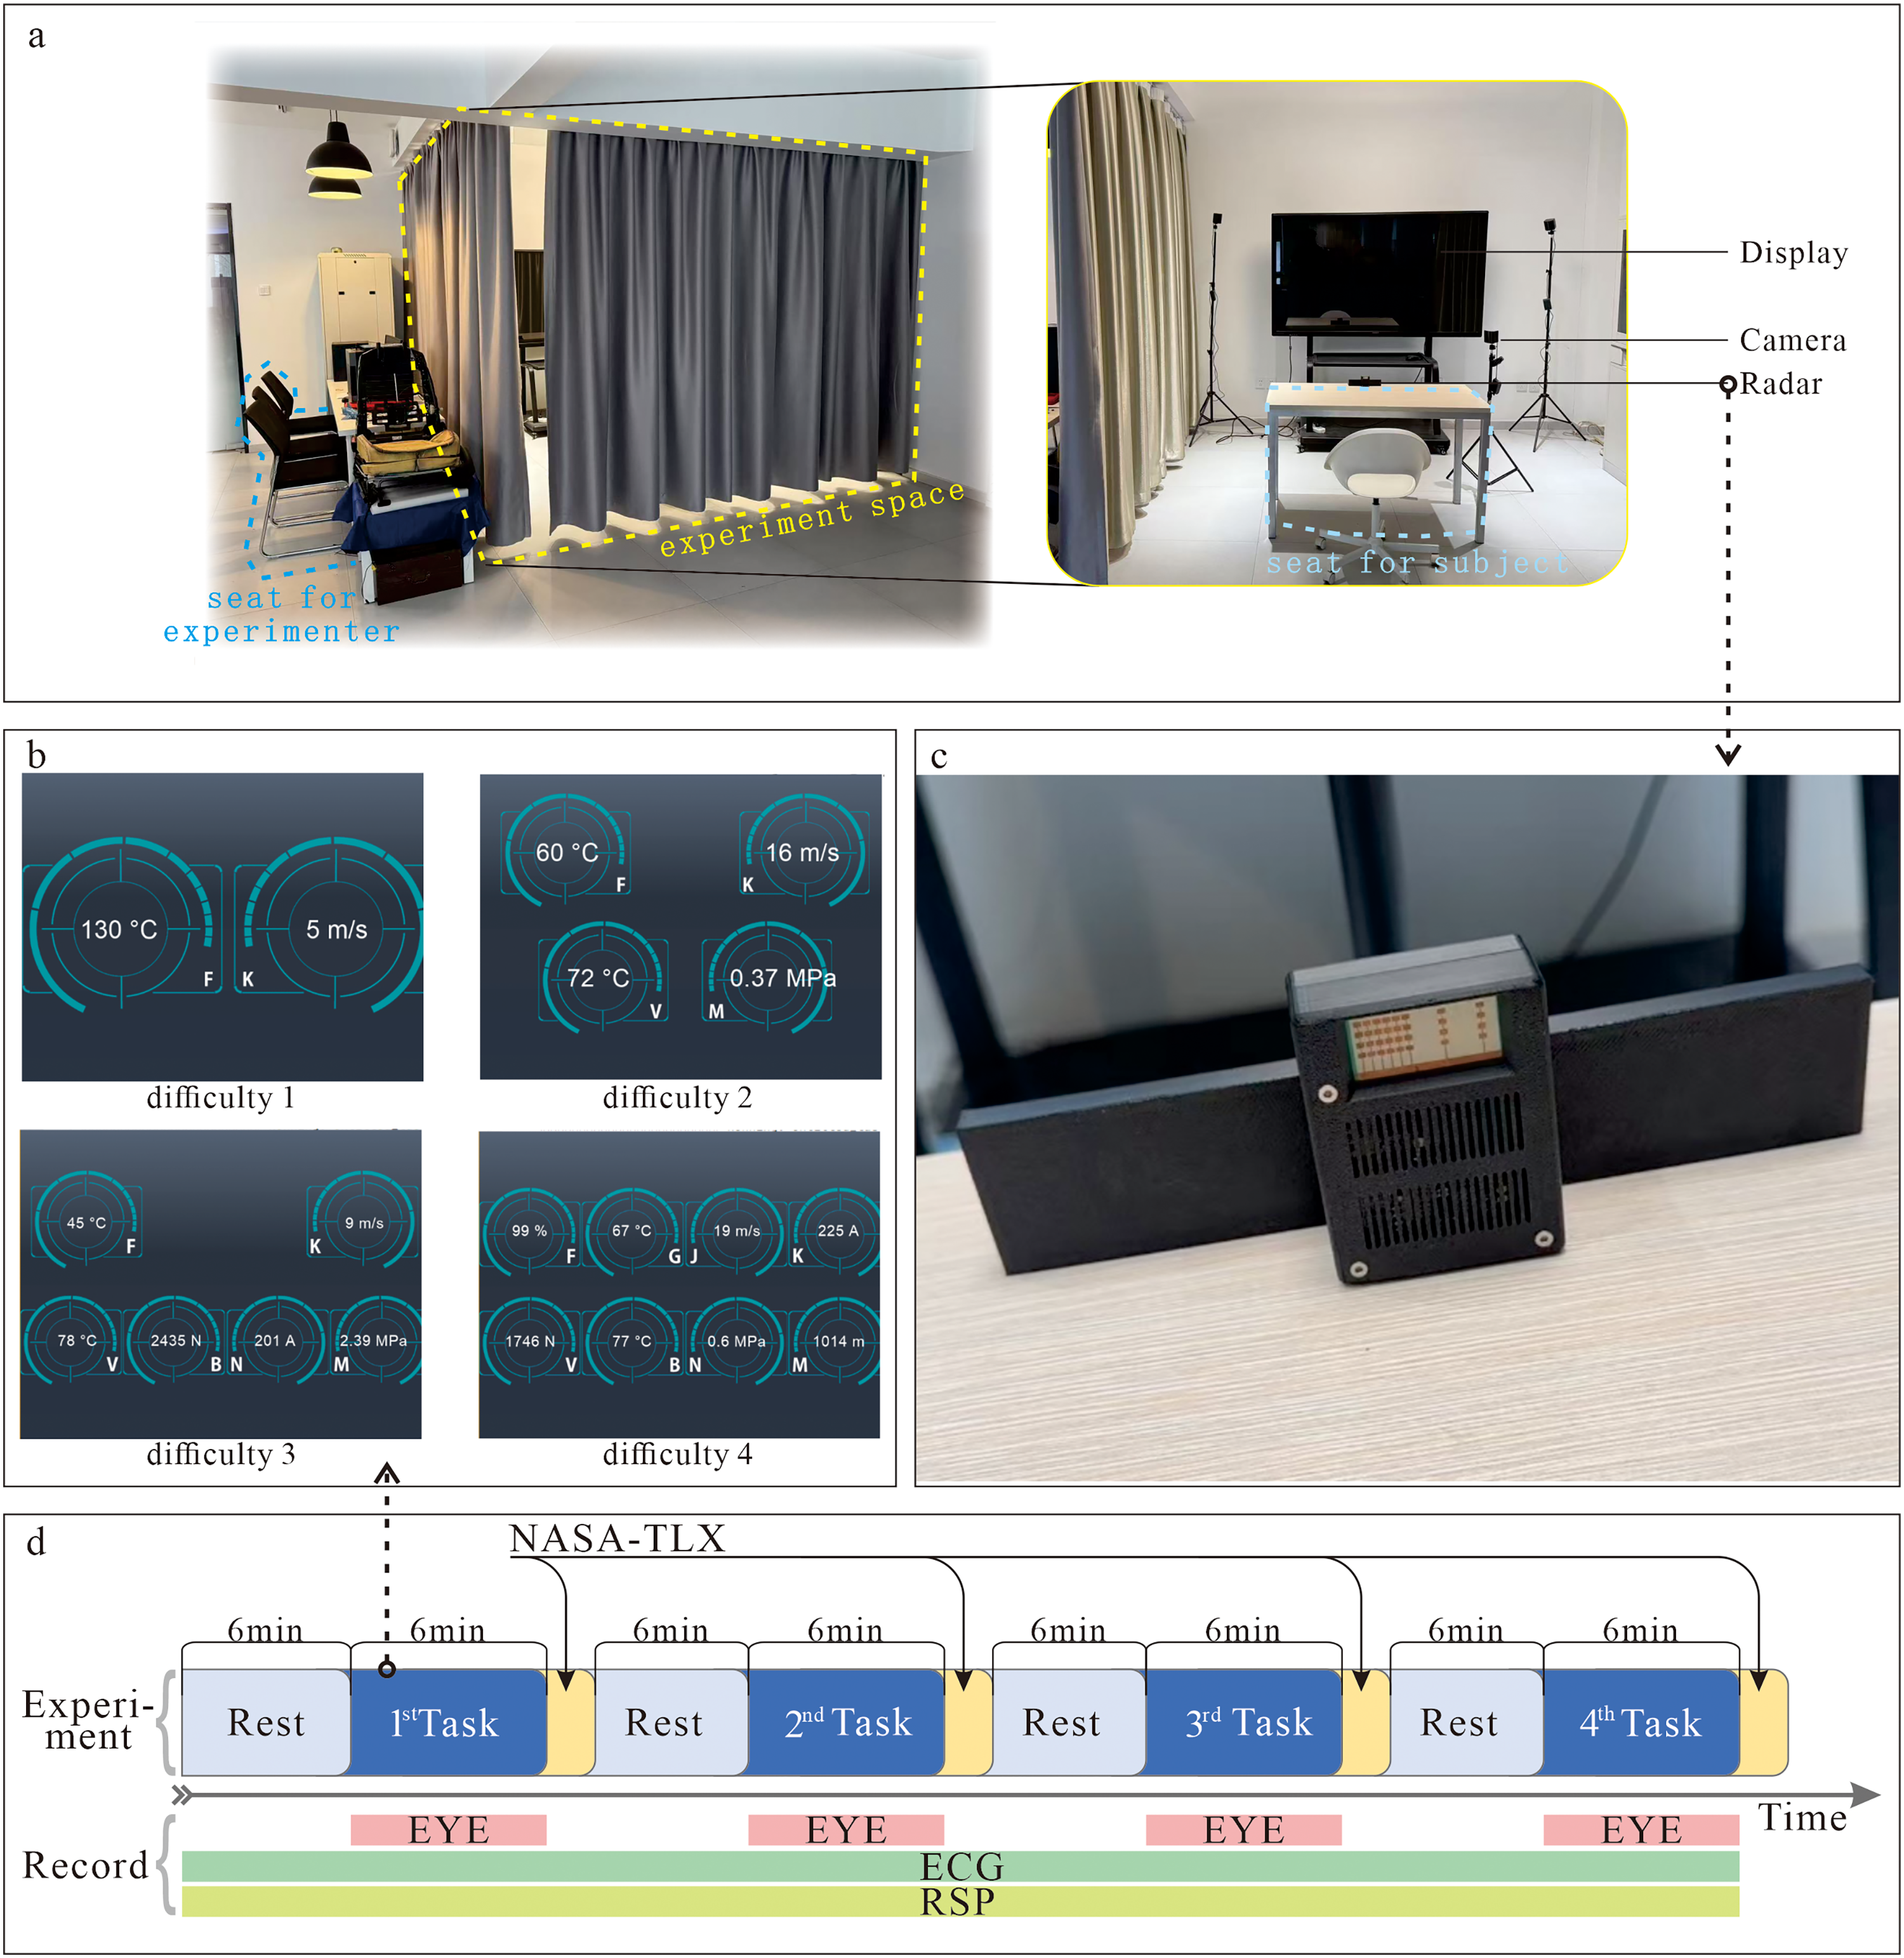
(a) Experiment scenario used in this study; (b) Interfaces of instrument-monitoring tasks with 4 different difficulties; (c) Bio-radar device and (d) Flowchart of experiment.
Subjects
Thirty participants were recruited as subjects (Mean age = 25.2, SD = ± 1.43, with a male to female ratio of 2:1). To facilitate the collection of eye movement data, all subjects had normal vision, did not wear glasses or contact lenses, and were accustomed to using computer keyboards. The sleep schedules of all subjects were normal, and none had worked night shifts. There was no reported history of neurological diseases, heart diseases, or other medical contraindications. Each subject was required to sleep for more than seven hours the night before the formal experiment and was prohibited from ingesting tobacco, alcohol, tea, coffee, or other caffeine-containing substances. All subjects were informed of their rights and provided with written informed consent forms prior to the experiment (XXX IRB No. 201502024 & 202002024).
Experiment procedure
The experiment was conducted in the closed-cabin laboratory of the XXX XXX. The laboratory environment is both electrically shielded and soundproof. Experimental tasks were presented to participants on a computer monitor positioned directly in front of them. Figure 2(a) depicts the experimental scenario, which comprised four tasks of increasing difficulty. To minimize potential order effects, task sequences were counterbalanced using a Latin square design. For example, the task order for the first participant was 1–2–4–3, while that for the second participant was 2–3–1–4, and so on. Each task had a duration of six minutes. To reduce the influence of fatigue on performance, a five-minute rest period was provided between tasks. Throughout the experiment, ECG, respiratory, and eye movement data were continuously recorded. In addition, the software automatically logged (RT and response accuracy for each task. Upon completion of each task, participants were also asked to subjectively assess their perceived workload using the NASA-TLX scale.
To minimize external environmental confounds, all sessions were conducted sequentially in a controlled indoor setting (consistent lighting and temperature) between 9:30 AM and 11:30 AM. After a detailed briefing, participants completed a minimum 10-min familiarization and practice phase with the experimental software. Following this, a 6-min rest period was provided. The formal experiment consisted of four stages of instrument monitoring tasks, each lasting 6 min and conducted within a closed cabin environment. A 6-min rest period was scheduled between each task stage to mitigate fatigue. Participants completed the NASA-TLX workload assessment both before and after each task stage. Data acquisition ceased upon completion of the final task, marking the end of the experimental procedure (Figure 2(d)).
Physiological signal recording and processing
ECG and RSP signal
In the present study, a 77 GHz millimeter-wave radar sensor was employed to extract respiratory and cardiac signal components based on chest wall displacements induced by breathing and heartbeat activity, following the methodology described in previous research, 43 From the acquired signals, respiratory features and HRV features were subsequently derived. The radar device used in the experiment is depicted in Figure 2(c). Specifically, the radar was deployed on the experimental table, positioned directly facing the participant's anterior chest wall at a distance of 0.5 m. To ensure high-fidelity signal acquisition, the device was configured with a sampling rate of 500 Hz and a frame rate of 50 Hz.
The chest wall displacement signal was subjected to a series of preprocessing steps, including background noise removal, polynomial trend correction, and bandpass filtering. Stationary background noise was removed by subtracting the mean of the raw radar echo data. Polynomial trends were corrected by subtracting a fitted curve obtained via the least squares method. Considering that the typical respiratory frequency range lies between 0.1 Hz and 0.3 Hz, and the heart rate range spans from 1 Hz to 3 Hz, a Butterworth bandpass filter was applied to x(t) after noise removal to obtain the preprocessed signal x∼(t).
The variational mode decomposition (VMD) method was employed to adaptively decompose the signal. As a completely non-recursive adaptive signal processing algorithm, this method determines the optimal solution of the variational mode model by iteratively calculating the center frequency and bandwidth of each intrinsic mode component, with the sum of the estimated bandwidths of each mode serving as the criterion.
Finally, the chirp Z-transform (CZT) method was utilized to estimate the signal spectrum. The CZT enables narrowband analysis of the signal, significantly enhancing the accuracy of frequency estimation.
According to previous research 43 and preliminary experiments by the present authors, 44 this method can yield relatively accurate ECG and RSP signals while circumventing the complex installation of professional equipment.
Eye movement signal
Facial video recordings obtained during the experiment were processed using the OpenCV and DLib libraries to detect 68 facial landmark points. Key point detection was performed with a focus on calculating the Eye Aspect Ratio (EAR) to analyze eye movement characteristics.45,46 This approach allowed us to extract the required physiological features. Specifically, each eye in the video frames was annotated using six key points: two on the upper eyelid, two at the eye corners, and two on the lower eyelid (Figure 3).
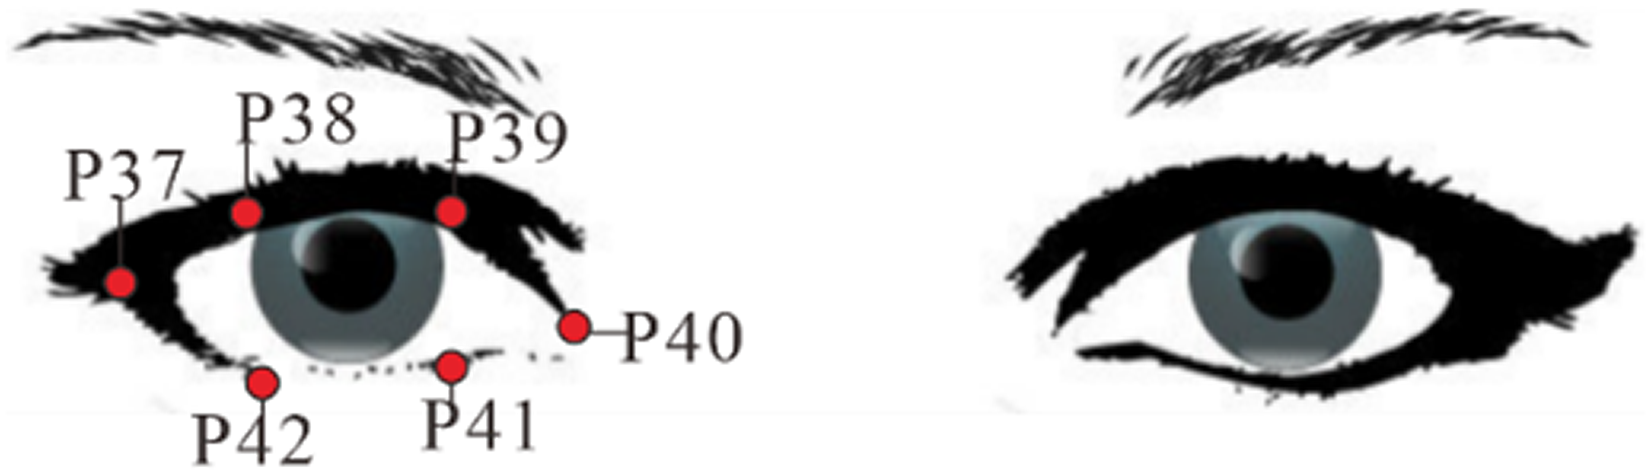
Key points of eye.
Variations in the coordinates of six specific facial landmarks can be analyzed to assess the degree of eye opening. When the eyes are fully open, the vertical distance between the upper and lower eyelid landmarks is relatively large. In contrast, when the eyes are closed, these landmarks converge, resulting in minimal vertical separation. The EAR provides a quantitative measure of this change and is calculated using the following formula: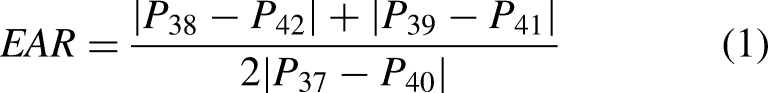
In the formula, the EAR is calculated by taking the sum of the vertical distances between the upper and lower eyelid landmarks and dividing it by twice the horizontal distance between the eye corner landmarks. This ratio reflects the degree of eye openness, with smaller EAR values indicating eye closure and larger values corresponding to eye opening.
Mental workload classification model based on random forest
Given the high-dimensional nature of the multimodal physiological dataset, this study employed the Random Forest (RF) algorithm as the classification model. As illustrated in Figure 4, the model leverages bootstrap aggregation and random subspace methods to construct an ensemble of decision trees, determining the final classification result through a majority voting mechanism. 47 RF is well-suited for handling complex biomedical data, demonstrating strong resistance to overfitting and intrinsically providing valuable feature importance evaluations via out-of-bag (OOB) error estimations. 48
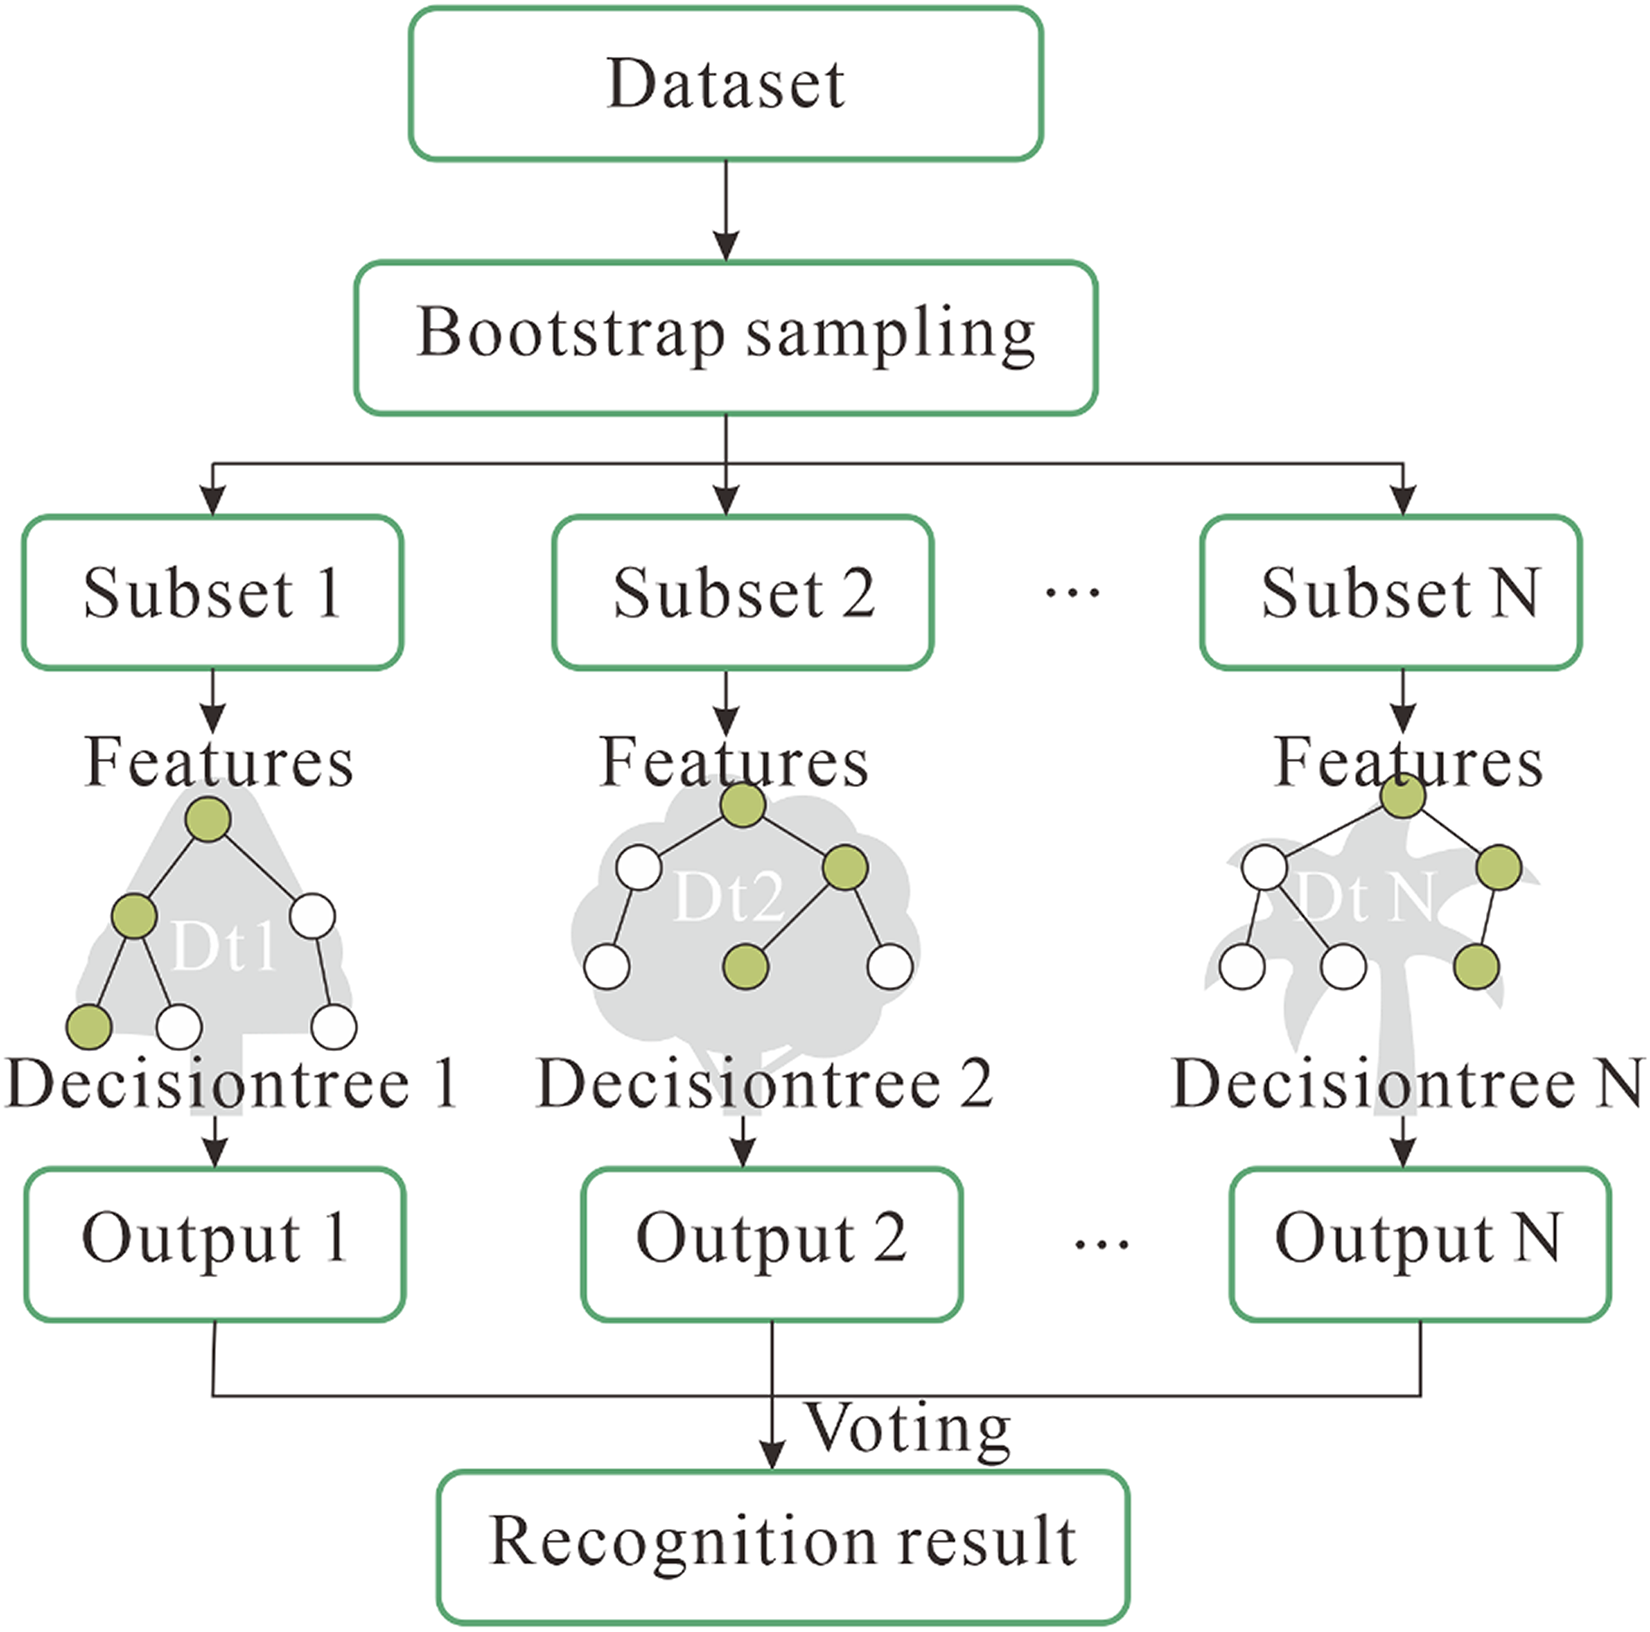
The principle of random forest.
The primary concept of RF involves taking n training samples from the training set to create a new training set. Through this process, m submodels are generated to form a RF, where decision trees serve as the fundamental units. This approach extracts partial features to mitigate the correlation among features across different decision trees. 47
To optimize predictive capability and computational efficiency, the model's hyperparameters were systematically determined: the number of decision trees was set to 102, the maximum tree depth to 12, the minimum samples required to split an internal node to 5, and the minimum samples in a leaf node to 2. Finally, to mitigate stochastic variability inherent in ensemble-based predictions, the classification results were obtained by averaging the outputs across 20 independent model training iterations.
Data analysis
One-way ANOVA and Bonferroni-corrected post-hoc tests were utilized to determine whether significant differences existed in the NASA-TLX scores of mental workloads, accuracy rates, and physiological features across four distinct difficulty levels. The threshold for statistical significance was established at a p-value of 0.05.
Results
NASA-TLX
The NASA-TLX scores for the four levels of mental workload are presented in Figure 5(a). The ANOVA results indicated that as the task difficulty increased, the scores rose significantly (F = 22.58, p < .0001). Bonferroni-corrected post-hoc tests revealed significant differences between any two tasks with varying difficulty levels (all p < .05). Bonferroni-corrected post-hoc test results demonstrated that the differences between each stage increased significantly (all six groups of comparison results were p < .05).
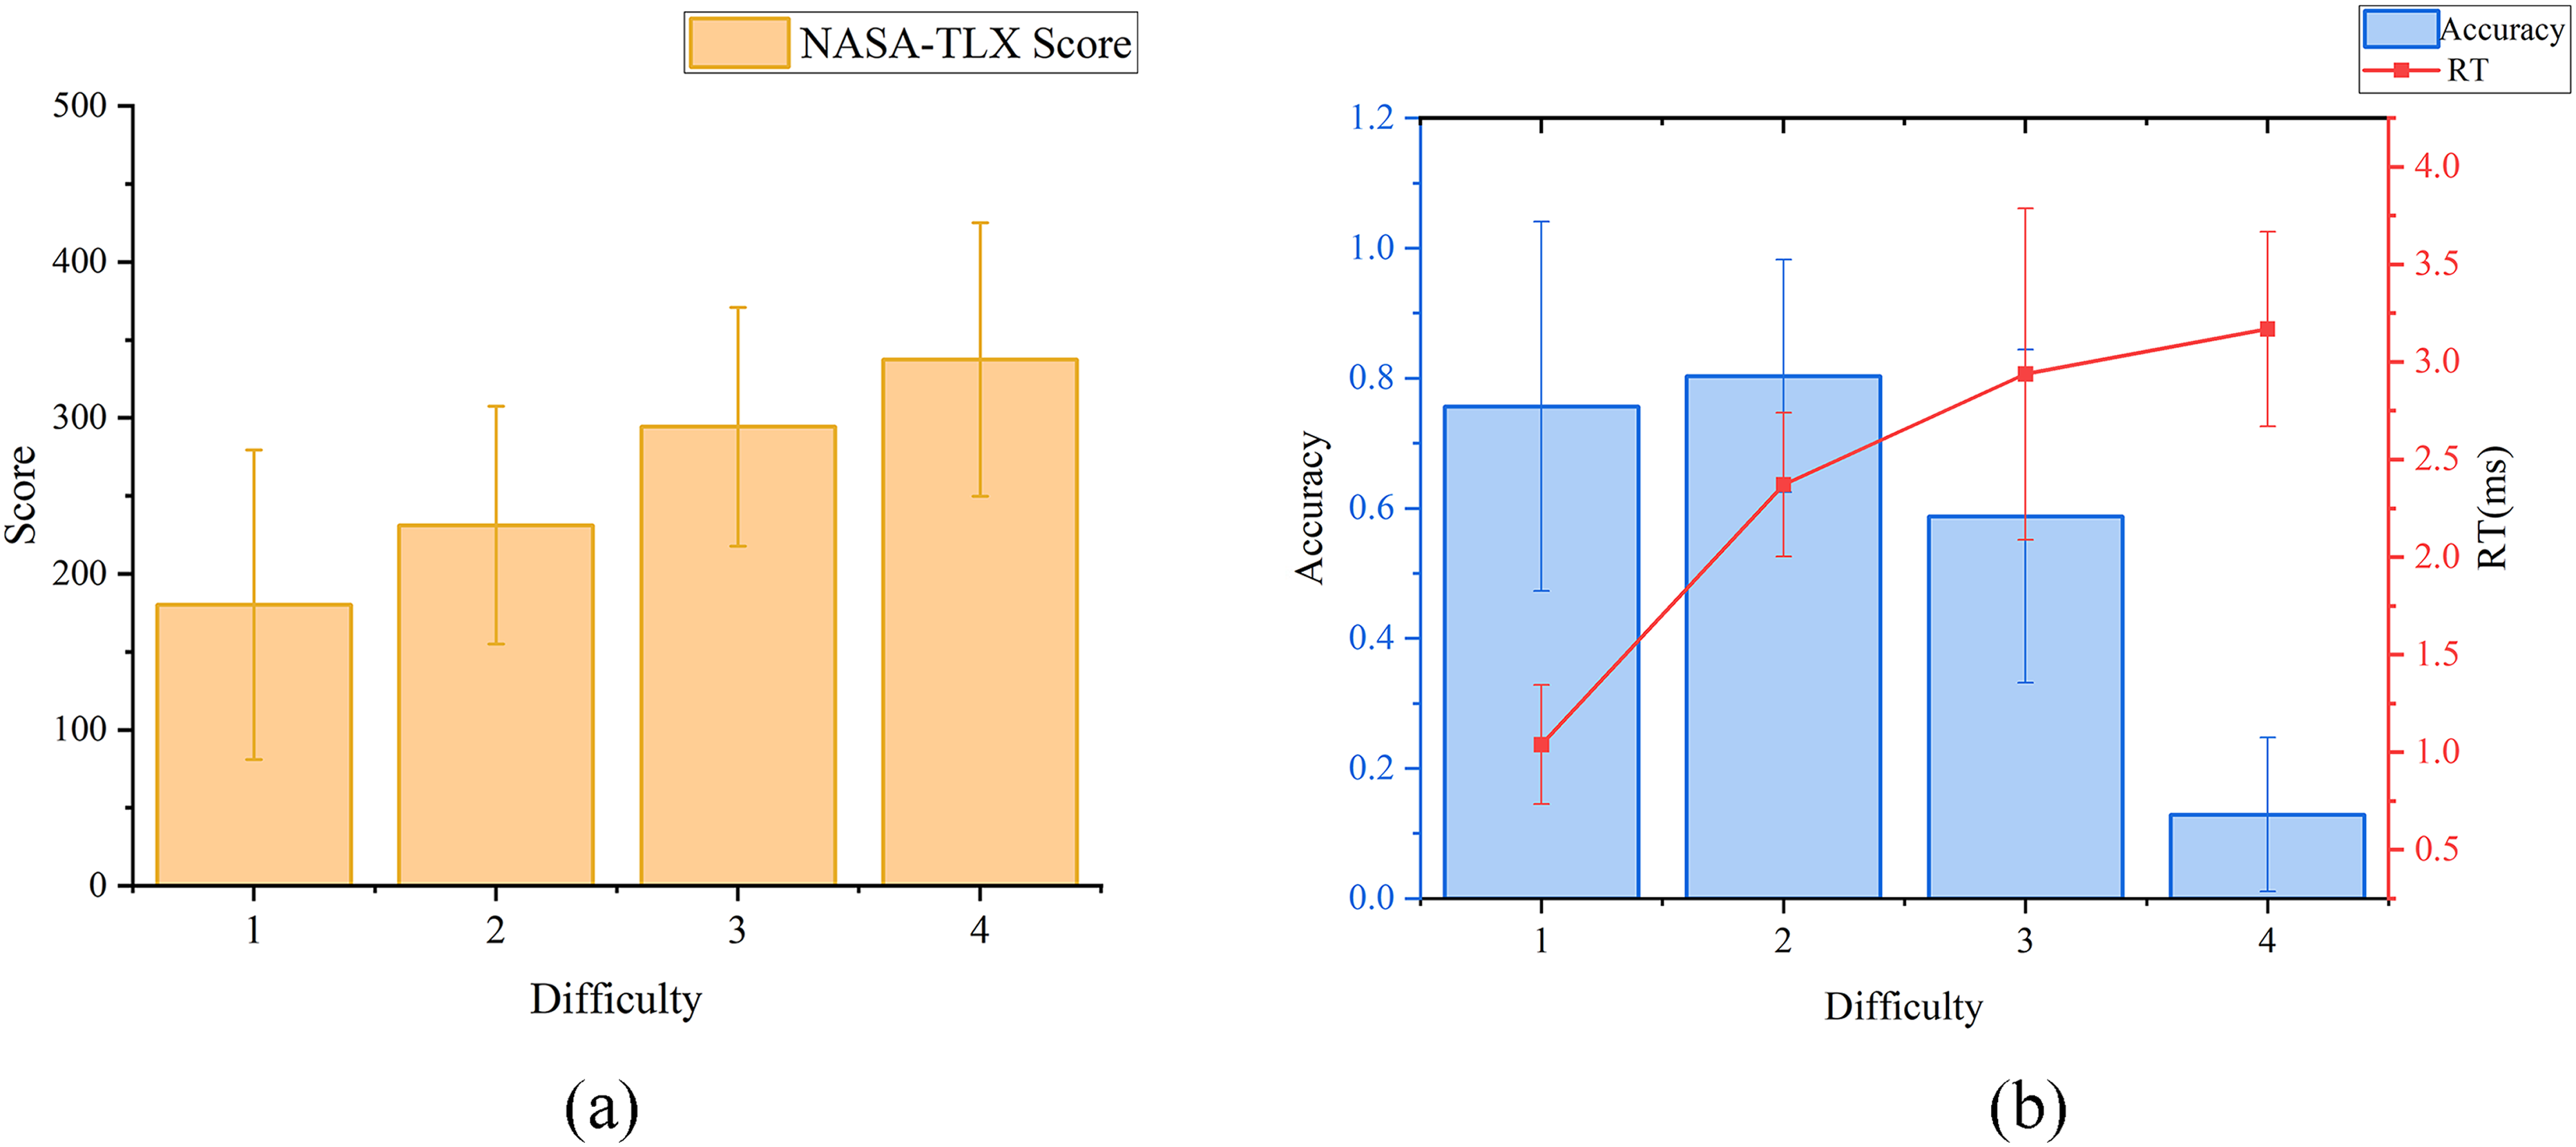
Results of NASA-TLX and task performance across four difficulties: (a) NASA-TLX scores and (b) Performance result.
Performance
Figure 5(b) illustrates that as the task difficulty increased, the accuracy rate first rose at difficulty level 2 before declining in subsequent levels. Concurrently, the average RT increased with rising task difficulty. This phenomenon can be attributed to the greater number of perceptual signal sources associated with increased task difficulty. The ANOVA results indicated a significant difference in accuracy rates as task difficulty increased (F = 2.24, p < .05). Bonferroni-corrected post-hoc tests further revealed significant differences between any pair of tasks with differing difficulties (all p < 0.05).
ECG
As shown in Table 5, the analysis of variance revealed that most ECG features were significantly affected by task difficulty. Specifically, HR_MEAN and LF increased significantly with rising difficulty, while RR_MEAN, RMSSD, and HF exhibited significant progressive decreases (all p < .05). Detailed pairwise comparisons can be found in Table 5. As task difficulty increased, sympathetic nerve activity was significantly enhanced (indicated by the rise in LF), while parasympathetic nerve activity was inhibited (evidenced by the decrease in RMSSD and HF), suggesting activation of the autonomic nervous system's (ANSs) ‘fight or flight’ response. In contrast, the global HRV metric SDNN did not demonstrate significant differences across the varying mental workload levels (p = .132).
Statistical analysis results of ECG features.
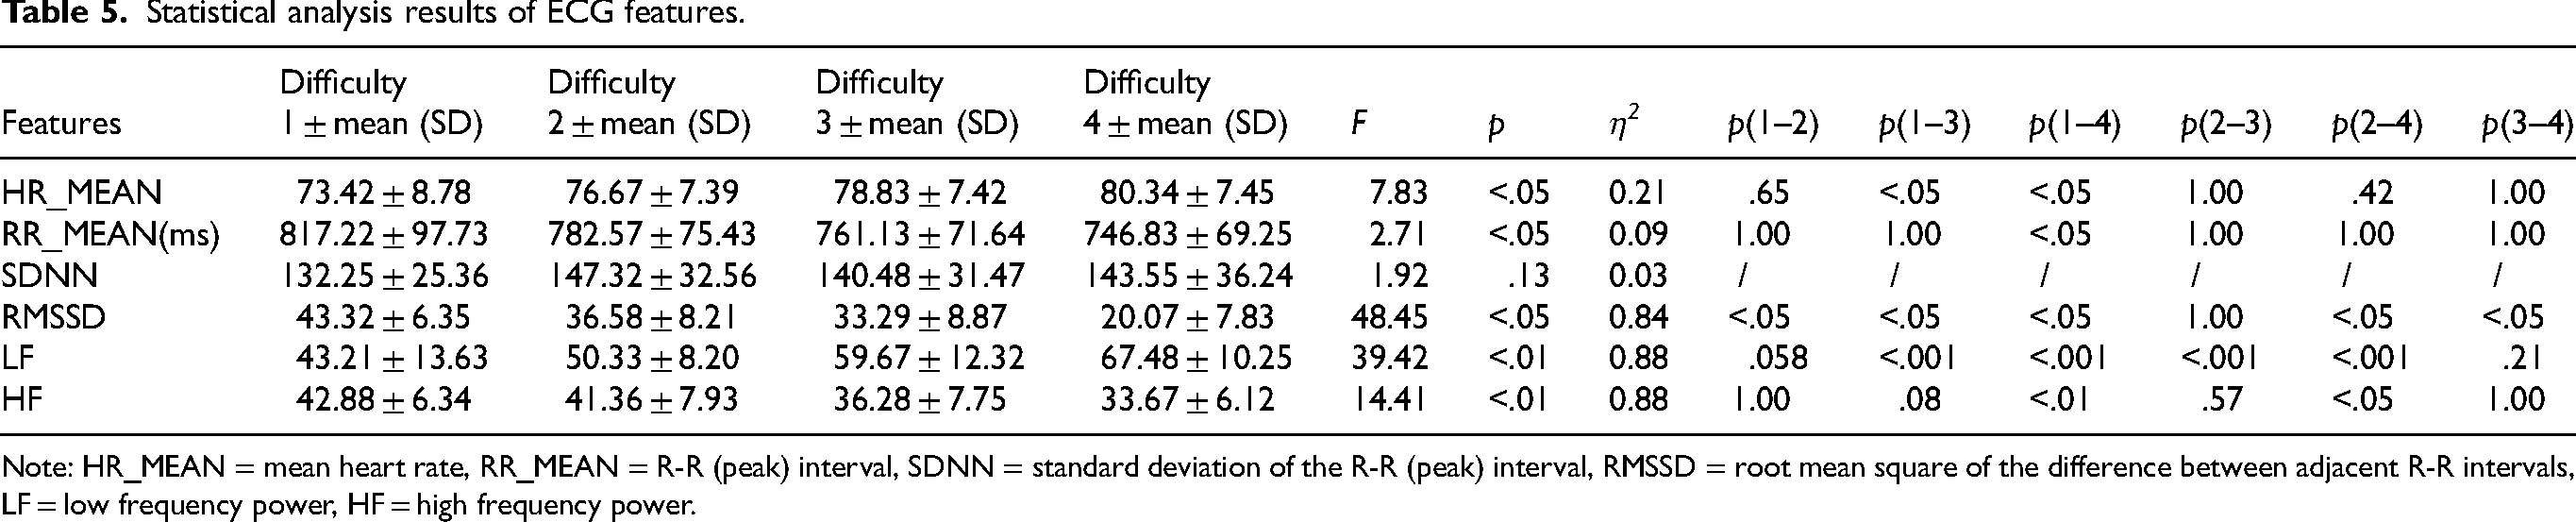
Note: HR_MEAN = mean heart rate, RR_MEAN = R-R (peak) interval, SDNN = standard deviation of the R-R (peak) interval, RMSSD = root mean square of the difference between adjacent R-R intervals, LF = low frequency power, HF = high frequency power.
RSP
The ANOVA results for RSP features are summarized in Table 6. Significant differences were observed across difficulty levels for RSP Rate, peak time (Tp), frequency index (FRSP), power spectral density (PSD), approximate entropy (ApEn), and sample entropy (SampEn) (all p < .05). Generally, as task difficulty increased, the RSP Rate and PSD consistently rose, indicating that the energy of the RSP signal concentrated in the low-frequency band under higher loads. Conversely, Tp, FRSP, and both entropy measures (ApEn and SampEn) significantly decreased, reflecting a stepwise reduction in the complexity of the respiratory pattern and an inhibition of high-frequency respiratory components. Detailed post-hoc comparisons across difficulty levels are provided in Table 6. Notably, waveform width (Ww) showed no significant difference (p = .07), lacking sensitivity to changes in task difficulty.
Statistical analysis results of RSP features.
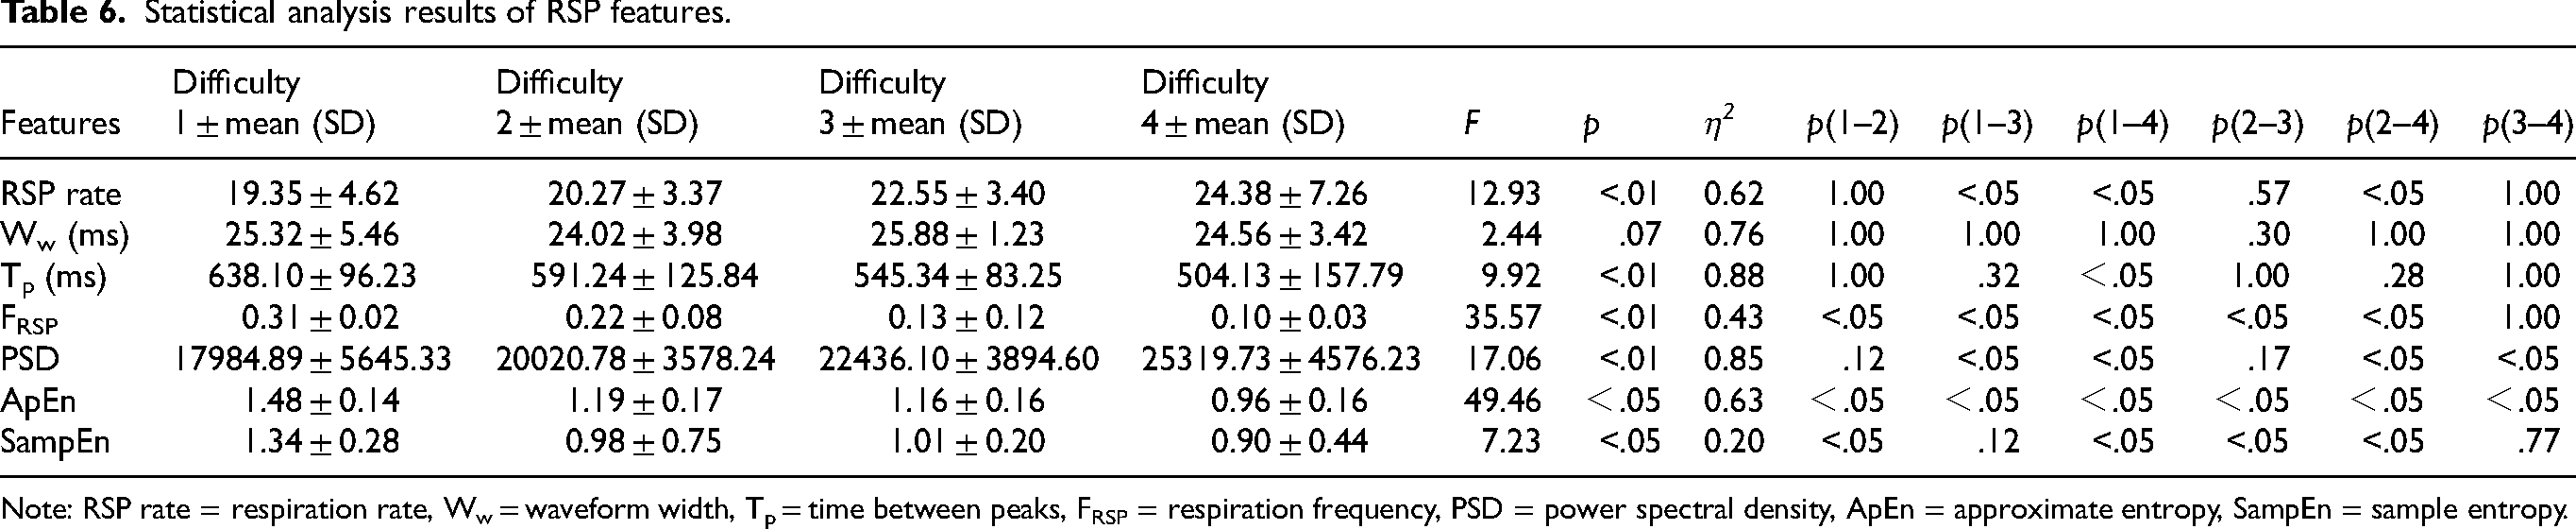
Note: RSP rate = respiration rate, Ww = waveform width, Tp = time between peaks, FRSP = respiration frequency, PSD = power spectral density, ApEn = approximate entropy, SampEn = sample entropy.
Eye movement
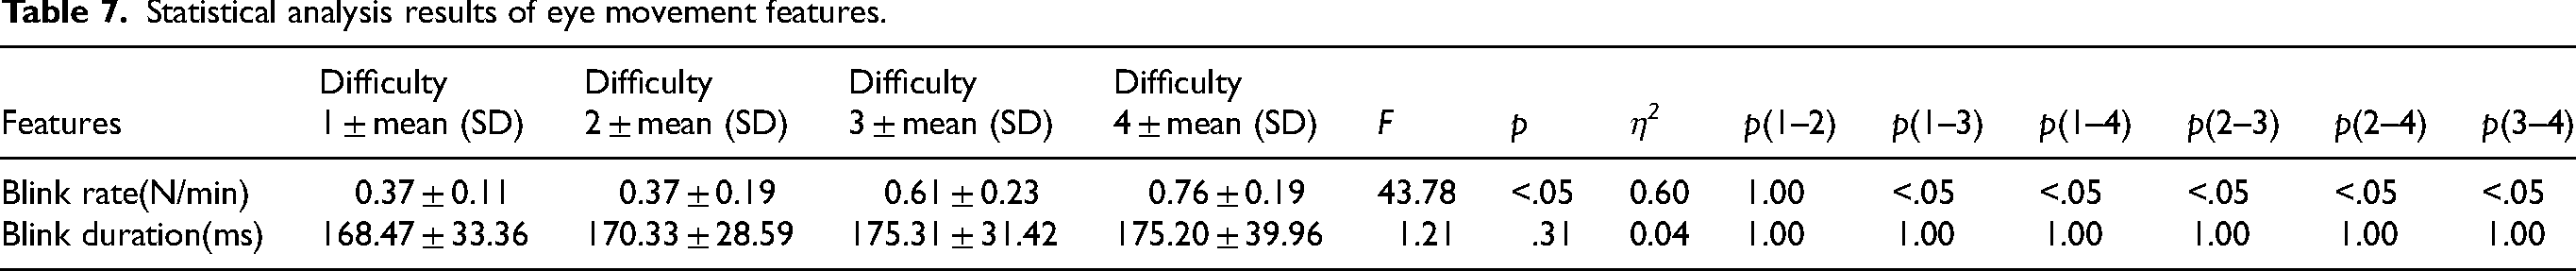
The analysis of eye movement data (Table 7) revealed that blink rate was highly sensitive to variations in mental workload (p < .05). The blink rate increased markedly with rising difficulty levels, escalating from 0.37 times/minute at difficulty 1 to 0.76 times/minute at difficulty 4. Significant increases were primarily observed as tasks transitioned to moderate and high difficulty (see Table 7 for post-hoc details), indicating that greater cognitive demands exacerbated blinking behavior. In contrast, blink duration fluctuated only slightly (168.47 to 175.20 ms) and exhibited no significant differences among the difficulty levels (p = .312), suggesting that it remained unaffected by the operational task load.
Statistical analysis results of eye movement features.
Classifier performance
In the task of assessing MWL based on physiological signals within a confined cabin environment, a RF classifier was utilized to analyze ECG, RSP, and eye movement data. The dataset was divided such that training was conducted on randomly selected data from 24 individuals (80%), while data from an additional 6 individuals (20%) were reserved for testing. The model achieved an accuracy of 83.33%, as depicted in Figure 6. After verification, the kappa coefficient K (Cohen's Kappa) of the model was found to be 0.78, indicating a high level of consistency.
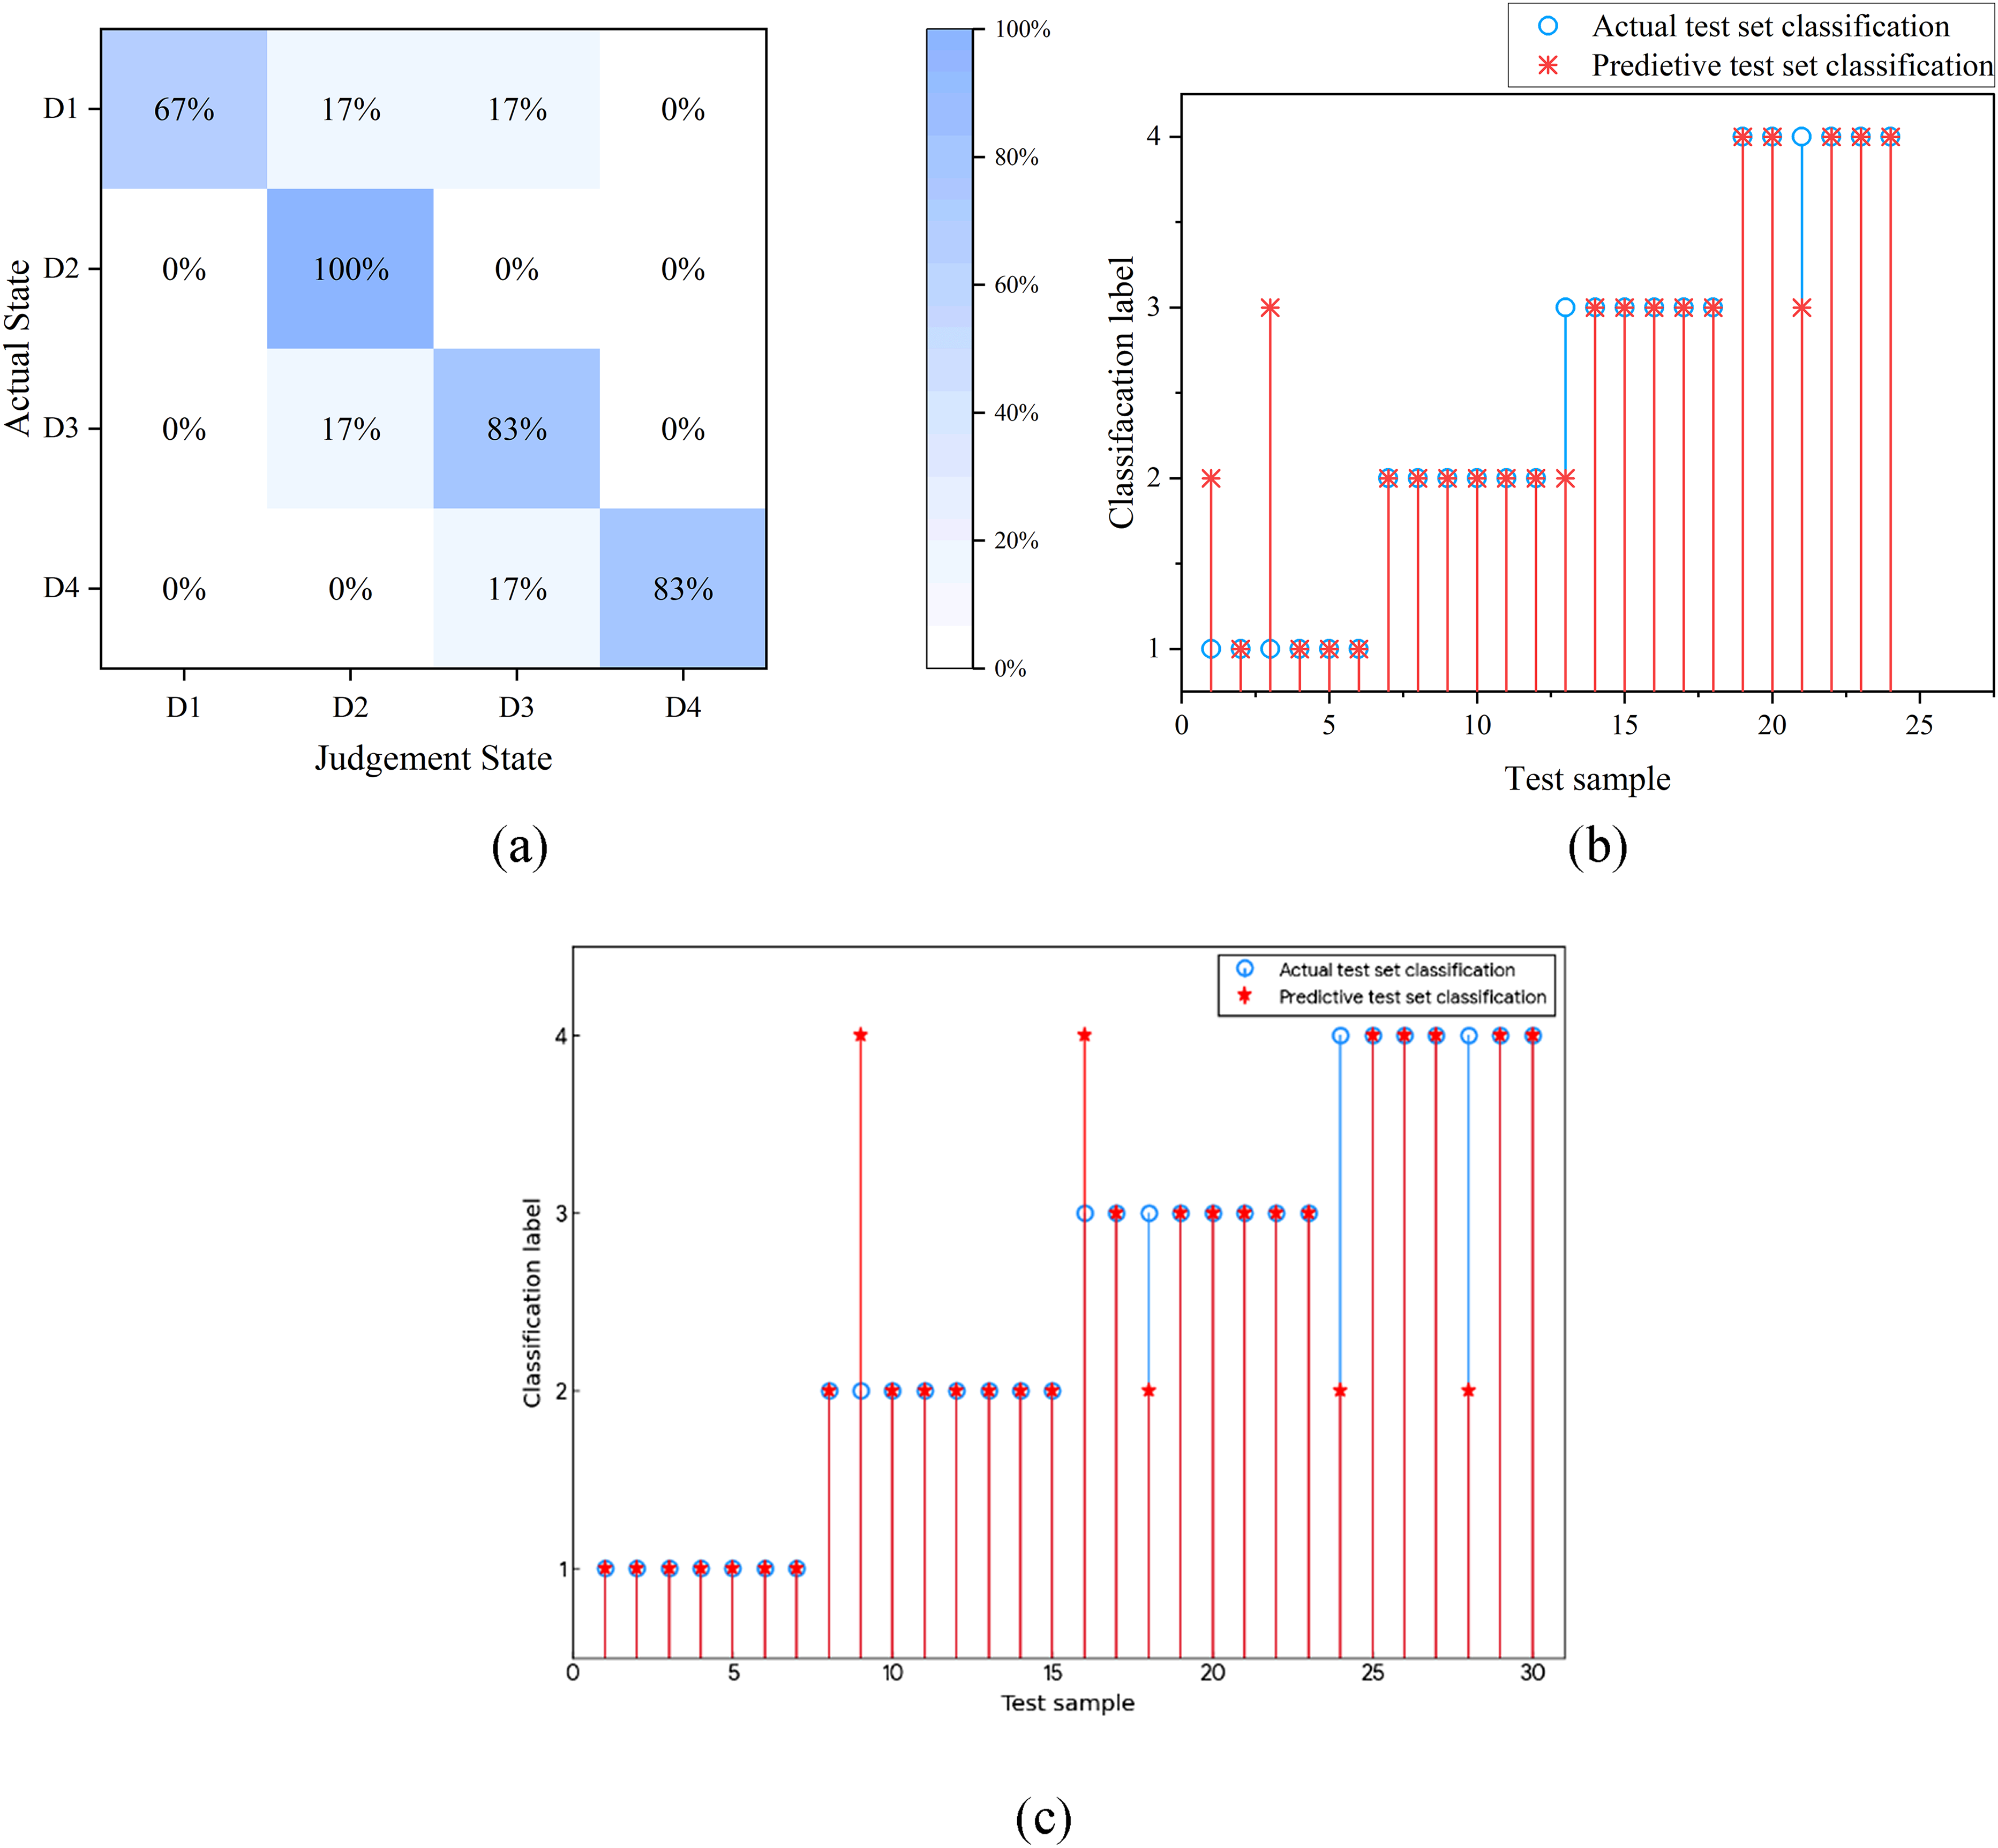
Results of classifier performance: (a) Confusion matrix for classification; (b) Actual and predictive classifications of test set and (c) Result of Leave-One-Subject-Out cross-validation.
To further validate the robustness and generalizability of the proposed model across different individuals, a Leave-One-Subject-Out (LOSO) cross-validation strategy was adopted. In this process, the model was trained on 29 subjects and tested on the remaining one, iterated for all 30 participants. The experimental results demonstrated that the model achieved an average classification accuracy of 80.00% (Figure 6(c)). Although slightly lower than the single-split test set accuracy (83.33%), this performance indicates that the proposed method possesses stable generalizability and can effectively classify mental workload levels for independent subjects even without subject-specific calibration.
Subsequently, the RF model evaluated the importance of each feature by aggregating the classification results of individual decision trees and the features selected at each split. This process enables the quantification of each feature's contribution to the overall classification performance. As demonstrated in Figure 7, the eight most important features are identified and presented along with their corresponding importance ratios.
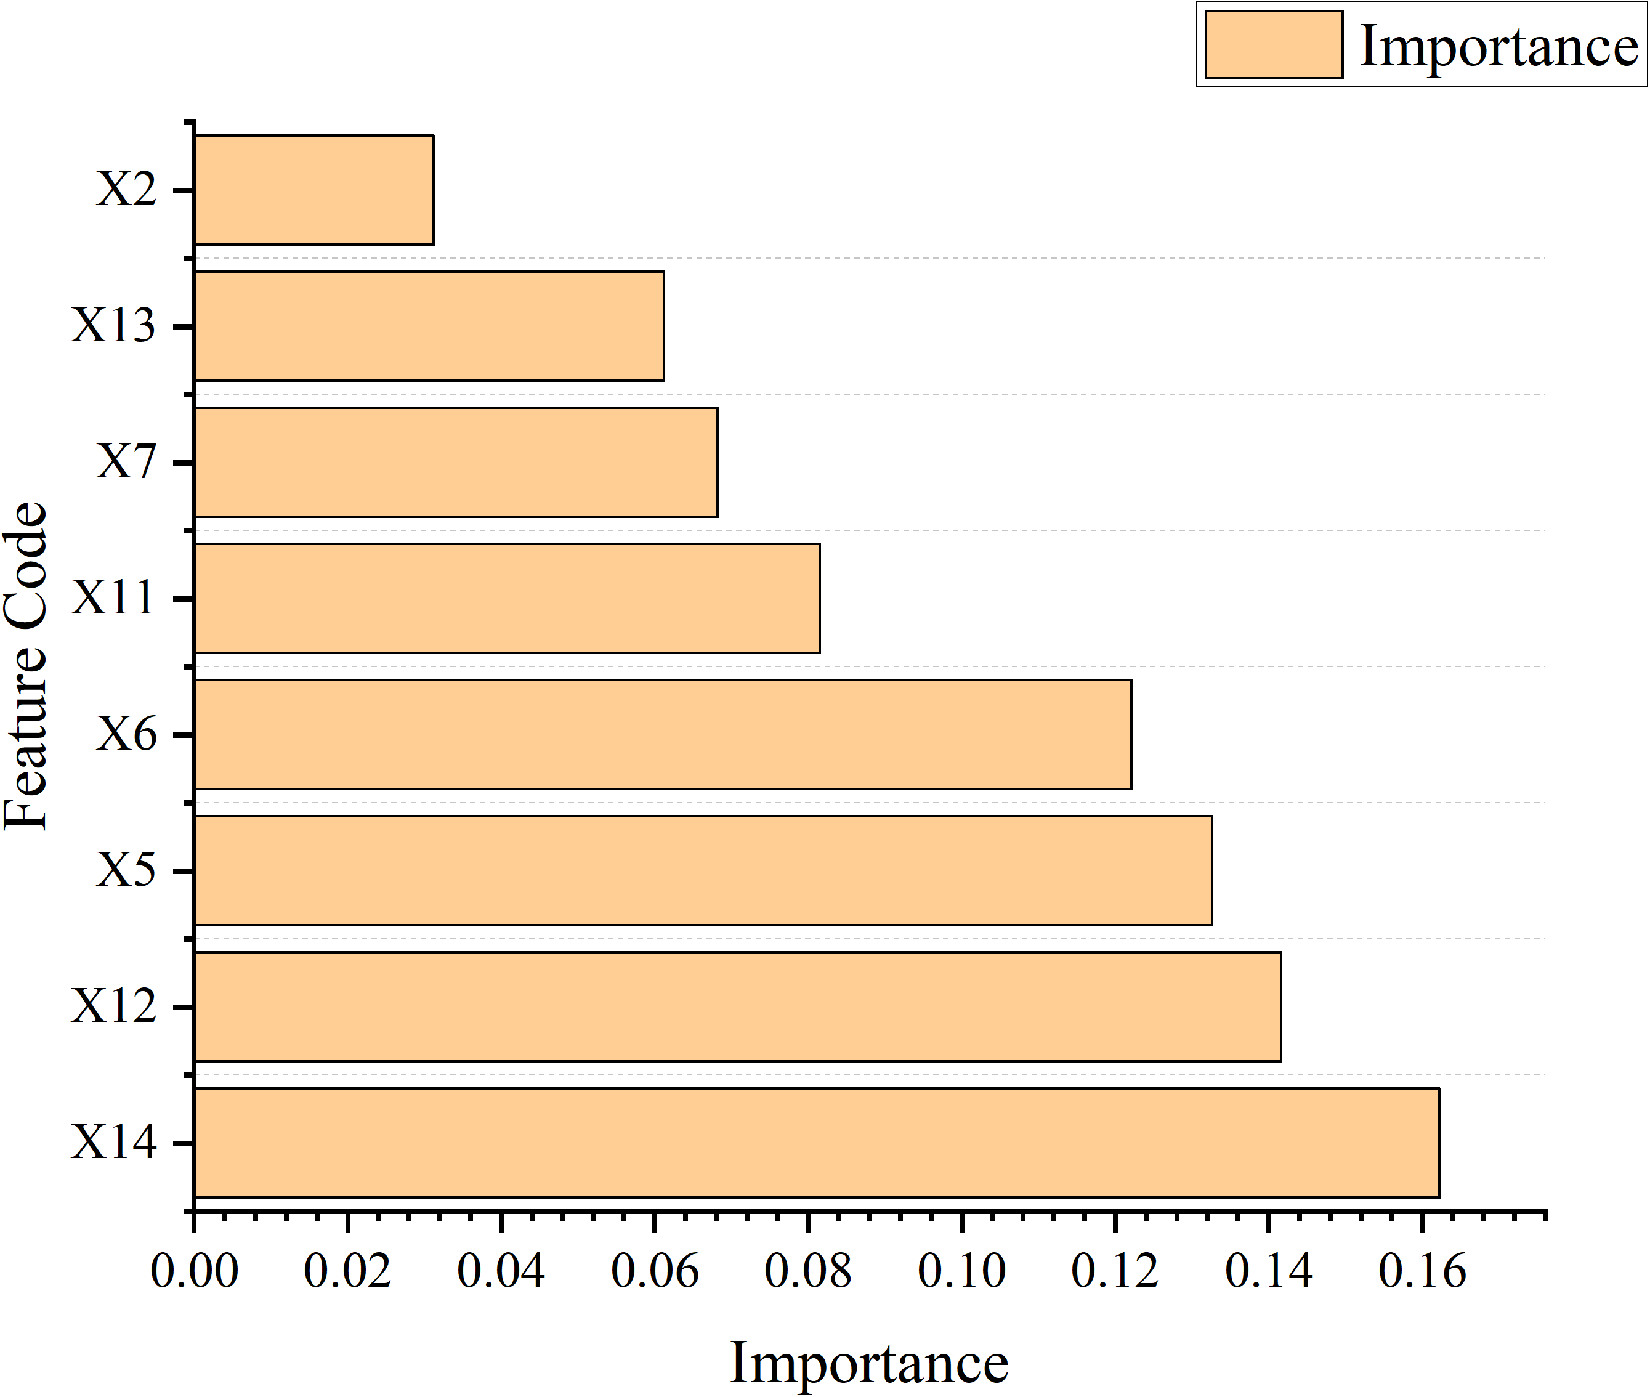
Importance ranking of feature importance.
Since the cumulative importance of these eight features exceeded 80%, only these features were utilized for further classification. Consequently, the accuracy rate decreased to 70.83%. Additionally, the classifiers that employed physiological signal features from a single source were compared with those that utilized a mixture of multiple sources. The accuracy rate for classification using eye movement features was 54.17%, while the accuracy rates for RSP and ECG features were 41.67% and 33.33%, respectively. Notably, the classification accuracy when using eye movement features alone was superior to that of either ECG or RSP features used independently.
Comparison with other classifiers
To validate the selection of the Random Forest (RF) classifier and address potential concerns about algorithmic bias, we compared its performance against several other commonly used machine learning models: Support Vector Machine (SVM), XGBoost, AdaBoost, and a basic Neural Network (NN). All models were trained and evaluated using the identical dataset, feature set, and train/test split employed for the RF model reported in Section 3.6. The performance comparison, focusing on training and test set accuracy, is summarized in Table 8.
Performance comparison of different classifiers.
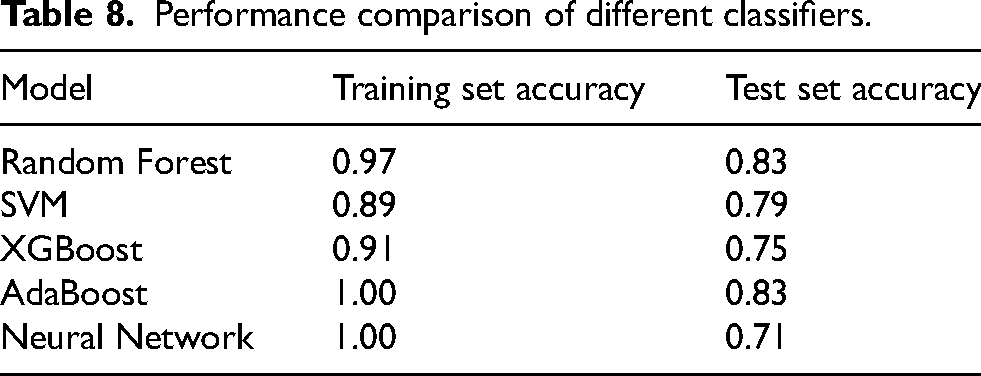
As shown in Table 8, both Random Forest and AdaBoost achieved the highest test set accuracy (83.3%), significantly outperforming SVM (79.2%), XGBoost (75.0%), and particularly the Neural Network (70.8%). However, both AdaBoost and the Neural Network exhibited perfect accuracy (100%) on the training set, indicating potential overfitting. The Random Forest model demonstrated strong performance on both the training (96.5%) and test sets, suggesting a better balance between learning the data patterns and generalization capability.
Discussion
The core objective of this investigation was to explore a new paradigm for cognitive monitoring that transcends traditional, intrusive assessments. We sought to determine the feasibility and effectiveness of an integrated system—one that fuses disparate, non-contact sensing technologies —in reliably decoding granular MWL states within a simulated, high-demand operational environment. This discussion is therefore structured around this objective, critically evaluating the success of our proposed method by contextualizing our primary findings, including the physiological trends and classification performance, within the established literature, and elucidating the theoretical and practical contributions of this work.
A critical analysis of our findings reveals more than just isolated physiological reactions; it paints a coherent, cross-system portrait of the body's response to escalating cognitive demand. As task difficulty increased, our data strongly suggest a classic activation pattern of the ANS. We observed a clear shift toward sympathetic dominance, indicated by the significant rise in LF, and a simultaneous withdrawal of parasympathetic modulation, evidenced by decreased RMSSD and HF. This central nervous system response was mirrored in peripheral systems. Respiration became faster (RSP rise) and significantly rhythmically “simplified,” as shown by the sharp decrease in approximate entropy (ApEn). Concurrently, the increased visual processing load and cognitive demand manifested as a significant increase in blink frequency, a well-documented indicator of cognitive resource expenditure.
What is novel here is that our fully non-contact system was sensitive enough to capture this complex, integrated, multi-system response. The success of the Random Forest classifier in achieving 83.33% accuracy is built upon this fusion. This is unequivocally supported by the feature importance analysis (Figure 7), where the top-ranked features were drawn from all three modalities: X14 (Blink rate), X12 (ApEn), and X5 (LF). This finding provides strong empirical evidence that this multimodal approach is superior to the single-modality systems (which achieved only 33%–54% accuracy in isolation). It demonstrates that these disparate signals provide complementary, not merely redundant, information, allowing the model to form a robust and accurate classification of MWL that would be impossible to achieve from any single non-contact source alone.
The contributions of this paper can be summarized in the following aspects. Firstly, a variety of non-contact measurement devices were utilized to collect and statistically analyze the physiological signals of individuals performing specific tasks in a confined cabin environment. Secondly, taking into account the data complexity of various physiological data characteristics and the nature of machine learning, RF was introduced as a classifier for determining mental workload levels. Further, the experimental results demonstrate that multi-channel physiological signal data can be effectively applied to the recognition of mental workload levels without relying on more complex physiological signals, such as EEGs. Although machine learning requires substantial computational resources during model training, it takes significantly less time during testing.
Physiological signal and mental workload
ECG signal
In the present study, an increase in average heart rate was observed (Table 5). Previous studies have also reported that HR increases with task demands and under multi-task conditions.49,50 Compared to low-demand tasks, high-demand multi-attribute tasks are associated with a decrease in the RR interval. 51 Veltman and Gaillard (1998) noted that during simulated flight tasks, as the task difficulty increased, the RR interval systematically decreased.
In the present experiment, the mean standard deviation of NN intervals (SDNN) of the HRV time-domain index gradually decreased across different mental workload conditions; however, the differences were not statistically significant (Table 5). Previous studies have reported that the SDNN tends to increase with rising task difficulty. The discrepancy observed in the present findings may be attributed to differences in task design and experimental conditions. In contrast, the RMSSD, which reflects short-term variability in RR intervals, and HF, an indicator of parasympathetic nervous system activity, were both found to decrease with increasing mental workload. This trend suggests a reduction in parasympathetic modulation under higher cognitive demand. 52
In the frequency domain features, a significant increase in the low frequency power (LF) with increasing difficulty was observed, as shown in Table 5. This pattern suggests an elevation in sympathetic nervous system activity in response to heightened cognitive demand. 53 Previous research has noted that heart rate increases while HF decreases during the Stroop test. 54 Backs et al. 55 reported a significant reduction in HF under medium task load conditions compared to baseline, which aligns with the present findings.
Earlier studies have suggested that HF is also associated with respiratory patterns. 56 This correlation was further supported by Gao et al., 57 who posited that HRV increases during high-complexity tasks. During task execution, deep and slow breathing can enhance HRV. 58 Veltman, 59 also noted that HRV fluctuates over time, attributing these variations to respiratory activity.
Consequently, Heine et al., 60 proposed that both mental workload and the level of attentional focus are characterized by an initial increase in sympathetic nerve activity and a subsequent reduction in parasympathetic nerve activity as mental workload decreases.
RSP signal
According to existing literature, as task difficulty increases, the RSP rate also rises. 61 This observation was further corroborated by Backs et al.. 55 The rise in RSP rate may be a direct consequence of the heightened metabolic demands necessary for task performance.
Similar phenomena were also identified in the present study, as shown in Table 6. As task difficulty increased, the respiratory rate rose significantly (p < .05). Concurrently, the complexity of the respiratory signal decreased (ApEn decreased, p < .05), and the energy spectrum concentrated towards lower frequencies (PSD increased, p < 0.01). This indicates that the respiratory system responded to the load through ‘rhythm simplification’ and ‘energy redistribution.’ Notably, the waveform width (Ww) did not change with increasing difficulty (p = .07), likely because the morphological characteristics it reflects are less influenced by central regulation. The significant suppression of high-frequency components (FRSP) (p < .05) further supports the hypothesis that a shallow and rapid respiratory pattern may serve a compensatory function under increased cognitive load. During task segments perceived as more effortful within the simulated flight mission, elevated RSP rates were recorded. 58 Similar findings have been reported in studies involving a range of cognitively demanding tasks, such as mental arithmetic and tasks requiring additional memory load and time-constrained responses.62,63
Several studies have suggested that while the RSP rate increases with elevated pressure and workload, the respiratory volume tends to decrease. However, the gas analysis method, which necessitates the use of a mask covering the mouth and nose, may adversely affect task performance. Additionally, the air quality within an enclosed cabin environment could influence respiratory volume. As such, respiratory volume was not included in the data collection scope of the present study.
Further, the variation in the approximate entropy (ApEn) of the respiratory signal reflects the regulatory intensity of the prefrontal cortex (Table 6). When combined with other physiological characteristics to assess mental workload, we propose that it can provide comparable insights to traditional EEG measurements.
Eye movement signal
In the present study, there was a significant increase in blinking frequency with the rise in task difficulty, as presented in Table 7. The increase in task difficulty notably influenced eye movement behavior, with blinking frequency escalating progressively from medium difficulty (difficulty level 2) (p < .05). This pattern may indicate an accumulation of fatigue or a stress response. The present findings align with Veltman's 59 observations of a significant increase in blinking frequency during actual flight. As the number of instruments increased, crew members encountered greater difficulty in acquiring information from the displays, thereby requiring increased cognitive effort. This heightened demand was associated with a gradual increase in blink rate, a trend that aligns with previously observed elevations in blinking frequency during more complex or demanding flight tasks. 59 Additionally, Wilson, 64 highlighted that the blinking rate is influenced by the crew member's overall visual demands. Notably, it was found that blink duration remained unchanged with varying difficulty levels (p = .312), suggesting that its regulatory mechanism may operate independently of mental workload (Table 7). Therefore, the present authors propose that blink frequency serves as a more reliable indicator than blink duration for measuring mental workload. 56
Nevertheless, Brookings et al. 61 observed that as task difficulty increases, the elevated RSP rate corresponds with a decrease in the blinking rate. Further, while eye measurements effectively reflect maximum labor capacity, factors such as lighting, air quality, air conditioning, and medication significantly influence all reported measurement indicators. Therefore, the present authors contend that eye movement indicators are best utilized in conjunction with other types of physiological indicators.
It is pertinent to address the exclusion of pupil diameter, which is widely recognized in the literature as a sensitive indicator of mental workload[. 65 This metric was intentionally excluded from our analysis. The core objective of this study was to develop a robust and practical non-contact system suitable for real-world cabin environments. The precise measurement of pupillometry is highly sensitive to variations in ambient lighting and subtle changes in head posture, both of which are difficult to control outside of highly constrained laboratory setups. Attempting to measure pupil diameter using our non-contact camera system under these variable conditions would likely have introduced significant noise and unreliable data, potentially compromising the classifier's performance. Therefore, to ensure the stability and real-world applicability of our model, we chose to focus on more robust features derivable from the video feed, such as those based on the Eye Aspect Ratio (EAR), including blink frequency and duration.
Task performance and NASA-TLX
In the present study, the subjective evaluations of different MWL levels, as influenced by instrument monitoring tasks, yielded significant results. A high MWL level corresponded to an elevated NASA-TLX scale score (Figure 5(a)). In the present study, the statistical method outlined by Christ et al. 35 and Hendy et al. 36 was employed for analyzing the NASA-TLX scale results, which align with those obtained through traditional scoring methods. This approach has substantially expedited the research process. Further, the results of task performance evaluations are notably significant. An increase in reaction time correlated with a heightened level of MWL, which is consistent with findings from numerous scholars.
The observed increase in accuracy from Task Difficulty Level 1 to Level 2, followed by a decrease from Level 3 to Level 4 (Figure 5(b)), was hypothesized to be influenced by the phenomenon of mind wandering (MW). This interpretation aligns with the decoupling hypothesis proposed by Smallwood and Schooler, 66 which posits that mind wandering draws upon executive cognitive resources. As task difficulty increases, the demand for these resources intensifies, thereby reducing the availability of cognitive capacity for mind wandering and consequently decreasing its frequency. In contrast, when task demands are low and task execution becomes more automated, fewer executive resources are required, permitting greater allocation to mind wandering and increasing its occurrence. Under this framework, the limited number of signal sources at Difficulty Level 1 may be insufficient to maintain sustained attention and cognitive engagement, thereby allowing for increased episodes of mind wandering. This may account for the lower accuracy observed at Difficulty Level 1 compared to Level 2, despite the former being a less demanding task.
The findings of the present study highlight the importance of carefully calibrating task difficulty and managing crew mental workload in the design of monitoring tasks, human-machine interfaces, and operational procedures. The objective should be to maintain crew vigilance by engaging cognitive resources sufficiently, while avoiding cognitive overload. This underscores the necessity for interface designs that balance information density and complexity, as well as task allocations that ensure appropriate levels of crew engagement. Moreover, these results suggest the potential value of implementing adaptive systems capable of dynamically adjusting task difficulty or information presentation to sustain crew members within an optimal range of mental workload and performance, thereby supporting reliable and continuous monitoring. 8 In addition, training protocols should be customized not only to skill levels but also to the dynamic complexity of monitoring environments, enabling personnel to maintain a high level of sustained attention without fatigue or boredom.
Mental workload classify model based on random forest
Considering the reliability of physiological signals in the present study, the RF classifier was selected to classify MWL levels based on physiological signals. This suggests that this algorithm offers several advantages:
The RF algorithm demonstrates notable resistance to overfitting and exhibits strong robustness in classification tasks. By leveraging bootstrap sampling and random feature selection to construct multiple decision trees, the algorithm introduces dual sources of randomness, which substantially reduce sensitivity to noise and outliers. This characteristic helps mitigate the risk of overfitting. In the present study, the model achieved an accuracy of 83.33% and a Cohen's kappa coefficient of 0.78, indicating stable classification performance even within the challenging context of a closed cabin environment, where physiological signals, such as bio-radar data, may be affected by motion artifacts. These results are consistent with previous findings in the literature that highlight the effectiveness of RF in handling complex, noisy biomedical datasets.67–70
The focus of the present study was on closed experimental environments, where the sample size of subjects is typically limited (e.g., N = 20–30). The RF algorithm achieves unbiased verification through OOB error estimation. In comparative literature, 71 the average accuracy rate for using Support Vector Machines (SVM) in mental workload classification tasks was reported to be 74.18%. To validate this, we conducted a comparative analysis including Support Vector Machine (SVM), XGBoost, AdaBoost, and a basic Neural Network (NN). This comparison, detailed in Section 3.7 (Table 8), used the identical dataset and train/test split.
In our comparison, both RF and AdaBoost achieved the highest test set accuracy at 83.3%, significantly outperforming SVM (79.2%), XGBoost (75.0%), and the Neural Network (70.8%). This demonstrates the highest predictive capability of the RF model on our dataset. Conversely, overfitting, where a model excessively learns training data noise, leads to poor performance on new data and is often indicated by a large “generalization gap” between high training accuracy and lower test accuracy. Both the Neural Network and AdaBoost achieved perfect (1.000) training accuracy, a strong indicator of potential overfitting. The Neural Network's test accuracy plummeted to 0.708 (a gap of 0.292), indicating poor stability. While AdaBoost also achieved high test accuracy (0.833), its perfect training score suggests a higher risk of overfitting compared to RF (generalization gap of 0.167 vs. 0.132 for RF). In contrast, RF achieved a high training accuracy (0.965) while maintaining excellent performance on the test set (0.833), demonstrating a better balance between fitting the data and avoiding overfitting. In summary, although AdaBoost matched the test accuracy of Random Forest (RF), RF exhibited greater robustness and a lower risk of overfitting. Beyond its superior balance of accuracy and generalization, RF offers advantages that are well-suited to present study. It effectively addresses the complexity of our high-dimensional feature space through the random subspace method, enabling efficient training. Furthermore, RF provides intrinsic feature importance metrics (Figure 7), enabling the quantification of the contribution of each physiological variable, which aligns well with our analytical goals. The top eight features ranked by importance according to the RF model were also employed for reclassification. The results indicate a decrease in classification accuracy when using these eight features, suggesting that other features also contain valuable information that can enhance classification performance.
The present study incorporated multimodal physiological signals, including respiration, heartbeat, and eye movement—resulting in a relatively high-dimensional feature space. The RF algorithm effectively addresses this complexity through the random subspace method, which reduces the dimensionality of individual decision trees, thereby enabling efficient training without compromising classification accuracy. Moreover, RFs provide feature importance metrics, allowing for the quantification of each physiological variable's contribution, such as the coefficient of variation in respiratory rhythm or dynamic fluctuations in EAR, which aligns well with the analytical goals of this research. In addition, the use of non-contact sensors (e.g., bio-radar and eye-tracking systems) introduces variability in spatial resolution. The RF's insensitivity to feature scaling obviates the need for extensive signal alignment and normalization procedures typically required by conventional approaches, thus enhancing both the robustness and practical applicability of the proposed methodology.
Overall, the experimental results demonstrate that the trends of various physiological indicators under different levels of MWL are consistent with findings reported in previous literature. This consistency validates the effectiveness of the proposed method. This approach can successfully extract eye movement data using non-contact devices and conventional cameras by incorporating machine learning models. This advancement facilitates the practical application of MWL measurement.
Application of non-contact measurement methods
In the experimental design of the present study, non-contact physiological monitoring technologies were selected as the primary means of data acquisition. Specifically, bio-radar was employed for respiratory and cardiac signal monitoring, while visual sensing was used for eye movement tracking. This methodological choice was guided by two key considerations: the operational constraints of closed cabin environments and the requirements for effective MWL detection. Traditional contact-based sensors, such as EEG caps and ECG electrodes, can induce abnormal proprioceptive sensations, potentially affecting subject behavior and data quality. Moreover, contact electrodes are prone to signal degradation over time due to the drying of conductive gel. In contrast, the non-contact approach minimizes physical interference and allows for continuous, stable signal acquisition under consistent environmental conditions. This enhances the feasibility of long-term monitoring in future applications involving confined and sensor-compatible operational settings.
Theoretical and practical implications
This study offers several distinct theoretical and practical implications. Theoretically, our study provides strong empirical validation for a non-contact, multimodal fusion approach. While prior work has often assessed physiological channels in isolation, our findings demonstrate that signals from cardiac, respiratory, and ocular systems, even when captured by non-intrusive sensors, provide complementary, not redundant, information. The feature importance analysis, which identified top contributors from all three modalities (e.g., X14-Blink rate, X12-ApEn, X5-LF), confirms this synergistic effect. This suggests that a truly robust understanding of MWL requires this integrated, cross-system perspective. Furthermore, we demonstrated that modern machine learning algorithms, like Random Forest, are highly effective at decoding these complex, high-dimensional physiological datasets, achieving high accuracy in classifying four granular workload levels.
Practically, the primary contribution is a validated framework for real-world cognitive monitoring. By successfully replacing intrusive electrodes and sensors with bio-radar and standard cameras, our method provides a pathway for continuous, objective MWL assessment in safety-critical domains such as aerospace, transportation, and industrial control rooms, without impeding operator performance. This quantitative, real-time MWL assessment can serve as a direct input for the next generation of adaptive human-machine systems —systems that could dynamically adjust information flow, task allocation, or automation levels to maintain the operator within an optimal cognitive performance band, thereby enhancing both safety and efficiency. Finally, this methodology can be employed as an objective tool in neuroergonomic design, aiding in the optimization of cockpit layouts or in the development of targeted training protocols to improve cognitive resilience.
Limitation
The limitations of the present study are as follows. Firstly, the sample size of the subjects was relatively small; specifically. Only 30 healthy individuals were selected due to the unique nature of closed cabin operations. This limited sample size may weaken the generalizability of the classification model.
Dussault et al., 72 noted that, when performing identical tasks, the heart rate of experts tends to be lower than that of novices. However, significant variations in HR and heart rate time (HRT) can arise from different training methods. 73 In the present study, only participants with no prior experience in actual closed-cabin tasks were recruited, which may have introduced certain biases in the data. Additionally, the study was conducted exclusively within closed-cabin environments, which differ substantially from typical real-world occupational settings. Consequently, the generalizability of the findings to broader contexts is limited.
The NASA-TLX was employed as a subjective measurement tool. However, subjective scales depend on the participants’ self-perception and may be influenced by personal biases or recall issues post-task. Additionally, some literature suggests that the relationship between subjective scales and physiological data is intricate, potentially involving nonlinear or interaction effects that are challenging to interpret directly.
In the present study, non-contact devices were employed to collect physiological data, aiming to minimize interference with normal operations. However, this method may compromise data accuracy to some extent, potentially introducing errors.
Data fusion may overly rely on specific types of features, such as physiological data, while neglecting other crucial information, including behavioral performance and subjective evaluations.
Although the RF classifier is well-suited for modeling nonlinear relationships, its performance is contingent on appropriate hyperparameter tuning and may suffer from reduced computational efficiency when processing high-dimensional feature spaces. Relying exclusively on a single classifier may limit the exploration of potentially more effective models; for example, neural networks or support vector machines might exhibit greater sensitivity to specific features. Moreover, physiological data inherently contain temporal dynamics, and the use of static features alone may be insufficient to fully capture fluctuations in MWL. Additionally, variations in task difficulty may lead to distinct patterns of workload change, yet this study did not distinguish between transient (instantaneous) and cumulative (overall) MWL during task execution. These limitations will be addressed in future research.
Conclusion
The primary purpose of this study was to address the limitations of intrusive monitoring by validating a fully non-contact, multimodal framework for assessing granular levels of mental workload (MWL) in closed-cabin environments. The results of this study indicate that such an approach is feasible and demonstrates significant effectiveness.
In addressing our research objective, we demonstrated that physiological signals (ECG, RSP, and eye movement) could be successfully acquired using only bio-radar and camera-based systems. The Random Forest classifier, built upon these fused multimodal inputs, provided strong empirical support for our hypothesis by achieving 83.33% accuracy in distinguishing four distinct MWL levels.
This finding supports the premise that the proposed technical approach can mitigate the operational interference associated with conventional contact-based measurements. It establishes an integrated system for robust cognitive state decoding that holds significant potential for future real-world application. Future work will focus on developing cross-modal temporal alignment techniques and constructing collaborative analysis frameworks to further enhance the engineering applicability of non-contact cognitive monitoring in highly constrained environments.
Footnotes
Abbreviations
Acknowledgements
The authors would like to thank Yuhua Hu and Jinliang Wang and Liting Fan for their help in this manuscript. We also thank the Associate Editor and anonymous reviewers for their constructive feedback which has led to an improved version of this manuscript.
Ethical approval
This study received ethical approval from the Northwestern Polytechnical University IRB (approval NPU IRB No. 201502024 & 202002024) on February 24, 2020.
Informed consent
All subjects were informed of their rights and provided with written informed consent forms prior to the experiment.
CRediT authorship contribution statement
Funding
The authors disclosed receipt of the following financial support for the research, authorship, and/or publication of this article: This work was part of the Program on Research on Optimal Design Method of Human Factors in Deep-Sea Manned Vehicle Cabin Supported by Compound Simulation Mechanism funded under the Fundamental Research Funds for the Central Universities (CN), grant number 31020190504007. Additionally, it was also funded under the Special Support Program for High-Level Talents of Shaanxi Province (CN), grant number w099115.
Declaration of conflicting interests
The authors declared no potential conflicts of interest with respect to the research, authorship, and/or publication of this article.
Data availability
The datasets used and/or analyzed during the current study are available from the corresponding author upon reasonable request.