
Abstract
Background
Various tools for clinical assessment of lumbar mobility in the sagittal plane coexist. Their validity has been called into question in particular because of their fixed distances between their skin markers whatever the height of the subject.
Objective
To measure the distance between the lower margin of the Postero Superior Iliac Spines (PSIS) and the middle of the L1 spinous process and to analyze the characteristics that influence it. To check whether these new skin marks could be more reliable for developing a new clinical assessment tool for lumbar mobility.
Method
The distance between the lower margin of the PSIS and the L1, located by ultrasound, was taken in the standing position and analyzed on 200 participants.
Results
The mean PSIS-L1 distance was 13.3 ± 1.8 cm, influenced mainly by standing height. A ratio or the regression line equation, based on the relationship between standing height and PSIS-L1, were highlighted.
Conclusions
The actual mode of placement of skin markers for the clinical assessment tools to evaluate lumbar mobility is not valid. The PSIS-L1/standing height ratio or the regression equation are the most effective ways for predicting the location of the upper skin marker (L1) for developing a new tool.
Introduction
Nonspecific low back pain and inflammatory pathologies of the spine frequently require analysis of spine mobility, which may be impaired, particularly in anterior flexion.1–3 Given international recommendations and the contraindications and potential risks associated with medical imaging, as well as its limited availability, in everyday practice,4,5 clinical assessment of lumbar mobility is generally carried out using the Schober Test (ST) or one of its many variants.6–10 Although the American Medical Association recommends double inclinometry (DI), which appears to be reproducible, but requires expertise, is time-consuming, and its normative values remain imprecise.11–15 These limitations certainly explain why the Schober Test is more widely known clinically. Indeed, the test is generally considered easy, rapid and requires solely a tape measure.1,15
With the original Schober Test, the subject is in a standing-up position. The operator identifies two skin markers. The first one is located at the lumbosacral junction (lower marker = LM). With the subject still upright, the second skin marker is placed 10 cm cephalid (upper marker = UM). The subject performs an anterior flexion, and the operator measures the lengthening of the distance between the two skin markers. As this procedure grew criticized for its difficulty locating the LM, an initial modification was made by placing this marker 5 cm below L5-S1, identified by palpation, with the UM remaining 10 cm above this mark. 8 This Modified Schober Test (MST) enables the L5-S1 joint to be included with certainty. However, according to some authors, despite its 15 cm height, the distance does not cover the entire lumbar spine.7,8 Indeed, its UM arrives mostly below the spinous process of the first lumbar vertebra (L1). 7 This version, therefore, fails to examine the mobility of the entire lumbar spine, particularly the upper lumbar spine. Thus, the test compromises its validity by neglecting the mobility of the upper part of the lumbar spine. According to some studies, the upper lumbar spine contributes more to flexion than the lower part.16,17
When the Modified-Modified Schober Test (MMST) was developed, its authors defined the spinous process of the 5th lumbar vertebra as the LM. For the upper marker, they tested several distances (5 cm, 10 cm, 15 cm and 20 cm) and concluded that the “15 cm distance” best reflected the actual height of the lumbar spine. 7 Subsequently, some authors preferred to use the intersection point between the vertical axis of the spinous processes and a line connecting the Postero Superior Iliac Spines (PSIS), as the lower MMST reference point. The lower MMST allows the L5-S1 joint to be included.14,15,18
In 2022, Hershkovich et al. challenged the positioning of the UM with a CT-Scan examination. The CT-Scan demonstrated that the UM should ideally be 16 cm higher than the line connecting the PSIS to cover the entire lumbar spine. This distance is the new reference for the Wolfson Modified Schober Test (WMST). 19 However, as this study was carried out with subjects in the supine position, the validity of this distance for clinical assessment of lumbar mobility remains to be demonstrated. 20
Multiple versions of this Schober Test exist, each offering fixed distances between LM and UM. However, disregarding the morphology and particularly the height or gender of the subjects limits the validity of these assessment tools. These validity issues explain why the clinical relevance of these assessment tools is highly debated.9,10,21–23
Given the difficulty (low reproducibility) of identifying L1 by palpation and the need to consider subjects’ morphology when locating its spinous process, further efforts are required to develop a more valid clinical test for measuring lumbar spine flexion.24,25
Ultrasound is becoming increasingly accessible and allows visualization of the lumbar vertebral spinous processes without irradiation.26,27
The primary aim of our study was to measure the distance, in the standing position, between a line passing through the lower edge of the PSIS (lower skin mark) and the middle of the spinous process of L1 (upper mark), both skin markers identified using ultrasound. The objective is to verify whether these skin markers can be more reliable and used to develop a new tool for clinical assessment of lumbar mobility. 26 The secondary objective was to observe the influence of the characteristics (gender, age, standing height, weight, BMI) of our population on this PSIS-L1 height. Finally, we investigated predictive models for the location of the upper marker (middle of L1).
Methods
This observational study was approved by the ethics committee of the University Hospital of UCL-Namur (NUB: B0392023000002, 21 March 2023). All participants signed an informed consent form for participation in the study.
Participants
Inclusion criteria were age between 18 and 65 years and ability to remain in a standing position without assistance or support or pain while performing the tests. Exclusion criteria were current pregnancy, history of spinal surgery, and known presence of significant lumbar scoliosis.
On a volunteer basis, subjects from various backgrounds representing society in terms of age, gender, height and weight were recruited in the Walloon region (Belgium).
Methodology
Subject characteristics (gender, age, weight, standing height), ultrasound images and PSIS-L1 height measurements were collected during an evaluation session held at Haute Ecole Robert Schuman in Libramont (Belgium) between April and May 2023. The same experimenter carried out all measurements at different times of the day.
Subjects’ weight was measured on a SALTER ® bathroom scale under standardized conditions.
Standing height (SH) was measured using a SECA® wall scale. For measurement consistency, the participants were asked to stand as upright as possible, with arms at their sides, heels together and head facing horizontally. The measurement was taken after a deep inspiration.
Ultrasound images and measurements of the height of the spinous process of L1 were performed using an ALOKA SSD-500® with a 7.5 MHz linear probe. To standardize the ultrasound study, the operator was supervised by a specialized physician and underwent training prior to the experiments. The methodology used for lumbar ultrasound is that described by Darrieutort-Laffite et al.. 26 To identify LM and UM using the ultrasound, subjects were positioned in a standing position, barefoot and in underwear, with their arms hanging at their sides and their feet shoulder-width apart. A line passing through the lower margins of the PSIS, identified by palpation and verified by ultrasound as it descended from the iliac crest, was drawn to identify the LM. The UM, constituted by the middle of the L1 spinous process, was determined using the ultrasound by ascending from the sacrum with the transducer placed on the spine midline to visualize the spinous processes as a hyperechoic line from one vertebral level to another. 26 The middle of the L1 spinous process is measured along its height and marked in the middle, at skin level, with a dermographic pencil. The middle of the spinous process was chosen as the reference point to ensure that the measurement was taken on the first lumbar spinous and to standardize the localization.
Once the two skin markers had been identified and marked, the distance between the LM and UM (PSIS-L1 height) was measured using a tape measure placed in contact with the skin along the entire height. For each subject, height measurements were taken three times and averaged.
Statistical analysis
Statistical analysis was performed using XLSTAT® software (Data Analysis and Statistical Solution for Microsoft® Excel®, Addinsoft, Paris, France 2023), Microsoft® Excel® (Microsoft 365 MSO, Version 2407 Build 16.0.17830.20056) and R 4.3.2 software on Jamovi.
Shapiro-Wilk normality tests were performed on all variables. The homogeneity of variances was tested using Fisher's test or Levene's test. Depending on the results obtained, comparisons of independent groups were made using the Mann-Whitney U test or Student's T test.
The interaction between variables was tested with the “Stepwise” and “Best Subsets” methodologies. A stepwise multiple linear regression was used to model the interaction of the independent variables “standing height”, “gender”, “weight”, “Body Mass Index (BMI)” and “age” on the dependent variable “PSIS-L1 height”. The quality of the multiple linear regression model was assessed based on performance measures such as coefficient of determination R², residual analysis and collinearity.
The biserial correlation coefficient was used to analyze the relationship between PSIS-L1 height and gender.
Spearman's non-parametric correlation test was chosen to analyze the relationship between PSIS-L1 height and the other variables (standing height, weight, BMI and age).
For the analysis of L1 location prediction models, the results obtained from the equation of the regression line PSIS-L1/standing height as well as for the ratio between PSIS-L1 and standing height were evaluated.
The Dixon test was used to detect extreme data. No data exclusion was necessary.
A significance level of p < 0.05 was established for all statistical analyses.
Results
Population
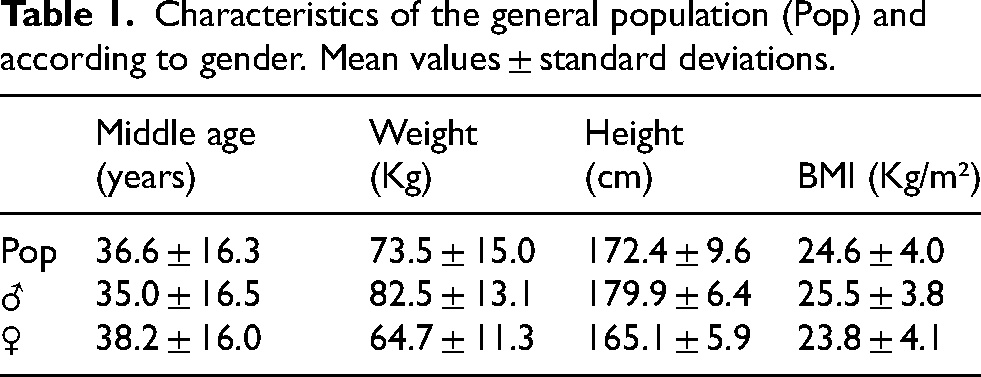
Measurements were carried out on 200 participants (98 males and 102 females) aged 18 to 65 years and measuring 152.2 cm to 192 cm (Table 1).
Characteristics of the general population (Pop) and according to gender. Mean values ± standard deviations.
PSIS-L1 height
The mean PSIS-L1 height measured, using LM and UM identified by ultrasound, was 13.3 ± 1.8 cm (12.6 ± 1.4 cm for female subjects and 14.0 ± 1.8 cm for male subjects; p < 0.001). Extreme values were respectively 10.1 cm and 17.5 cm for women and 11.1 cm and 20.3 cm for men.
After testing all possible combinations of predictive variables according to the best subsets regression, the model defined is the one with 3 variables “standing height - gender - BMI” without interactions.
Multiple linear regression showed that 24.7% of PSIS-L1 height was influenced by standing height (p < 0.001), 1% by BMI (p = 0.06) and 0.9% by gender (p = 0.119). Variance inflation factors (VIF) were 2.46 (standing height), 1.06 (BMI) and 2.55 (gender) respectively.
PSIS-L1 height was strongly positively correlated with standing height (R = 0.477; p < 0.0001), with gender (R = 0.429; p < 0.0001) and with weight (R = 0.256; p < 0.001) but not with BMI (R = 0.0687; p = 0.333).
PSIS-L1 height has a significantly negative correlation (R = -0.273; p < 0.0001) with age.
Predictive models for UM identification
Based on the multiple regression results, standing height is the most influential parameter on PSIS-L1 height.
According to the predictive model for L1 location (upper skin mark) based on the PSIS-L1/standing height regression line equation (Figure 1), the emplacement of the middle of L1 from the line joining the lower margin of the PSIS can be estimated to be:
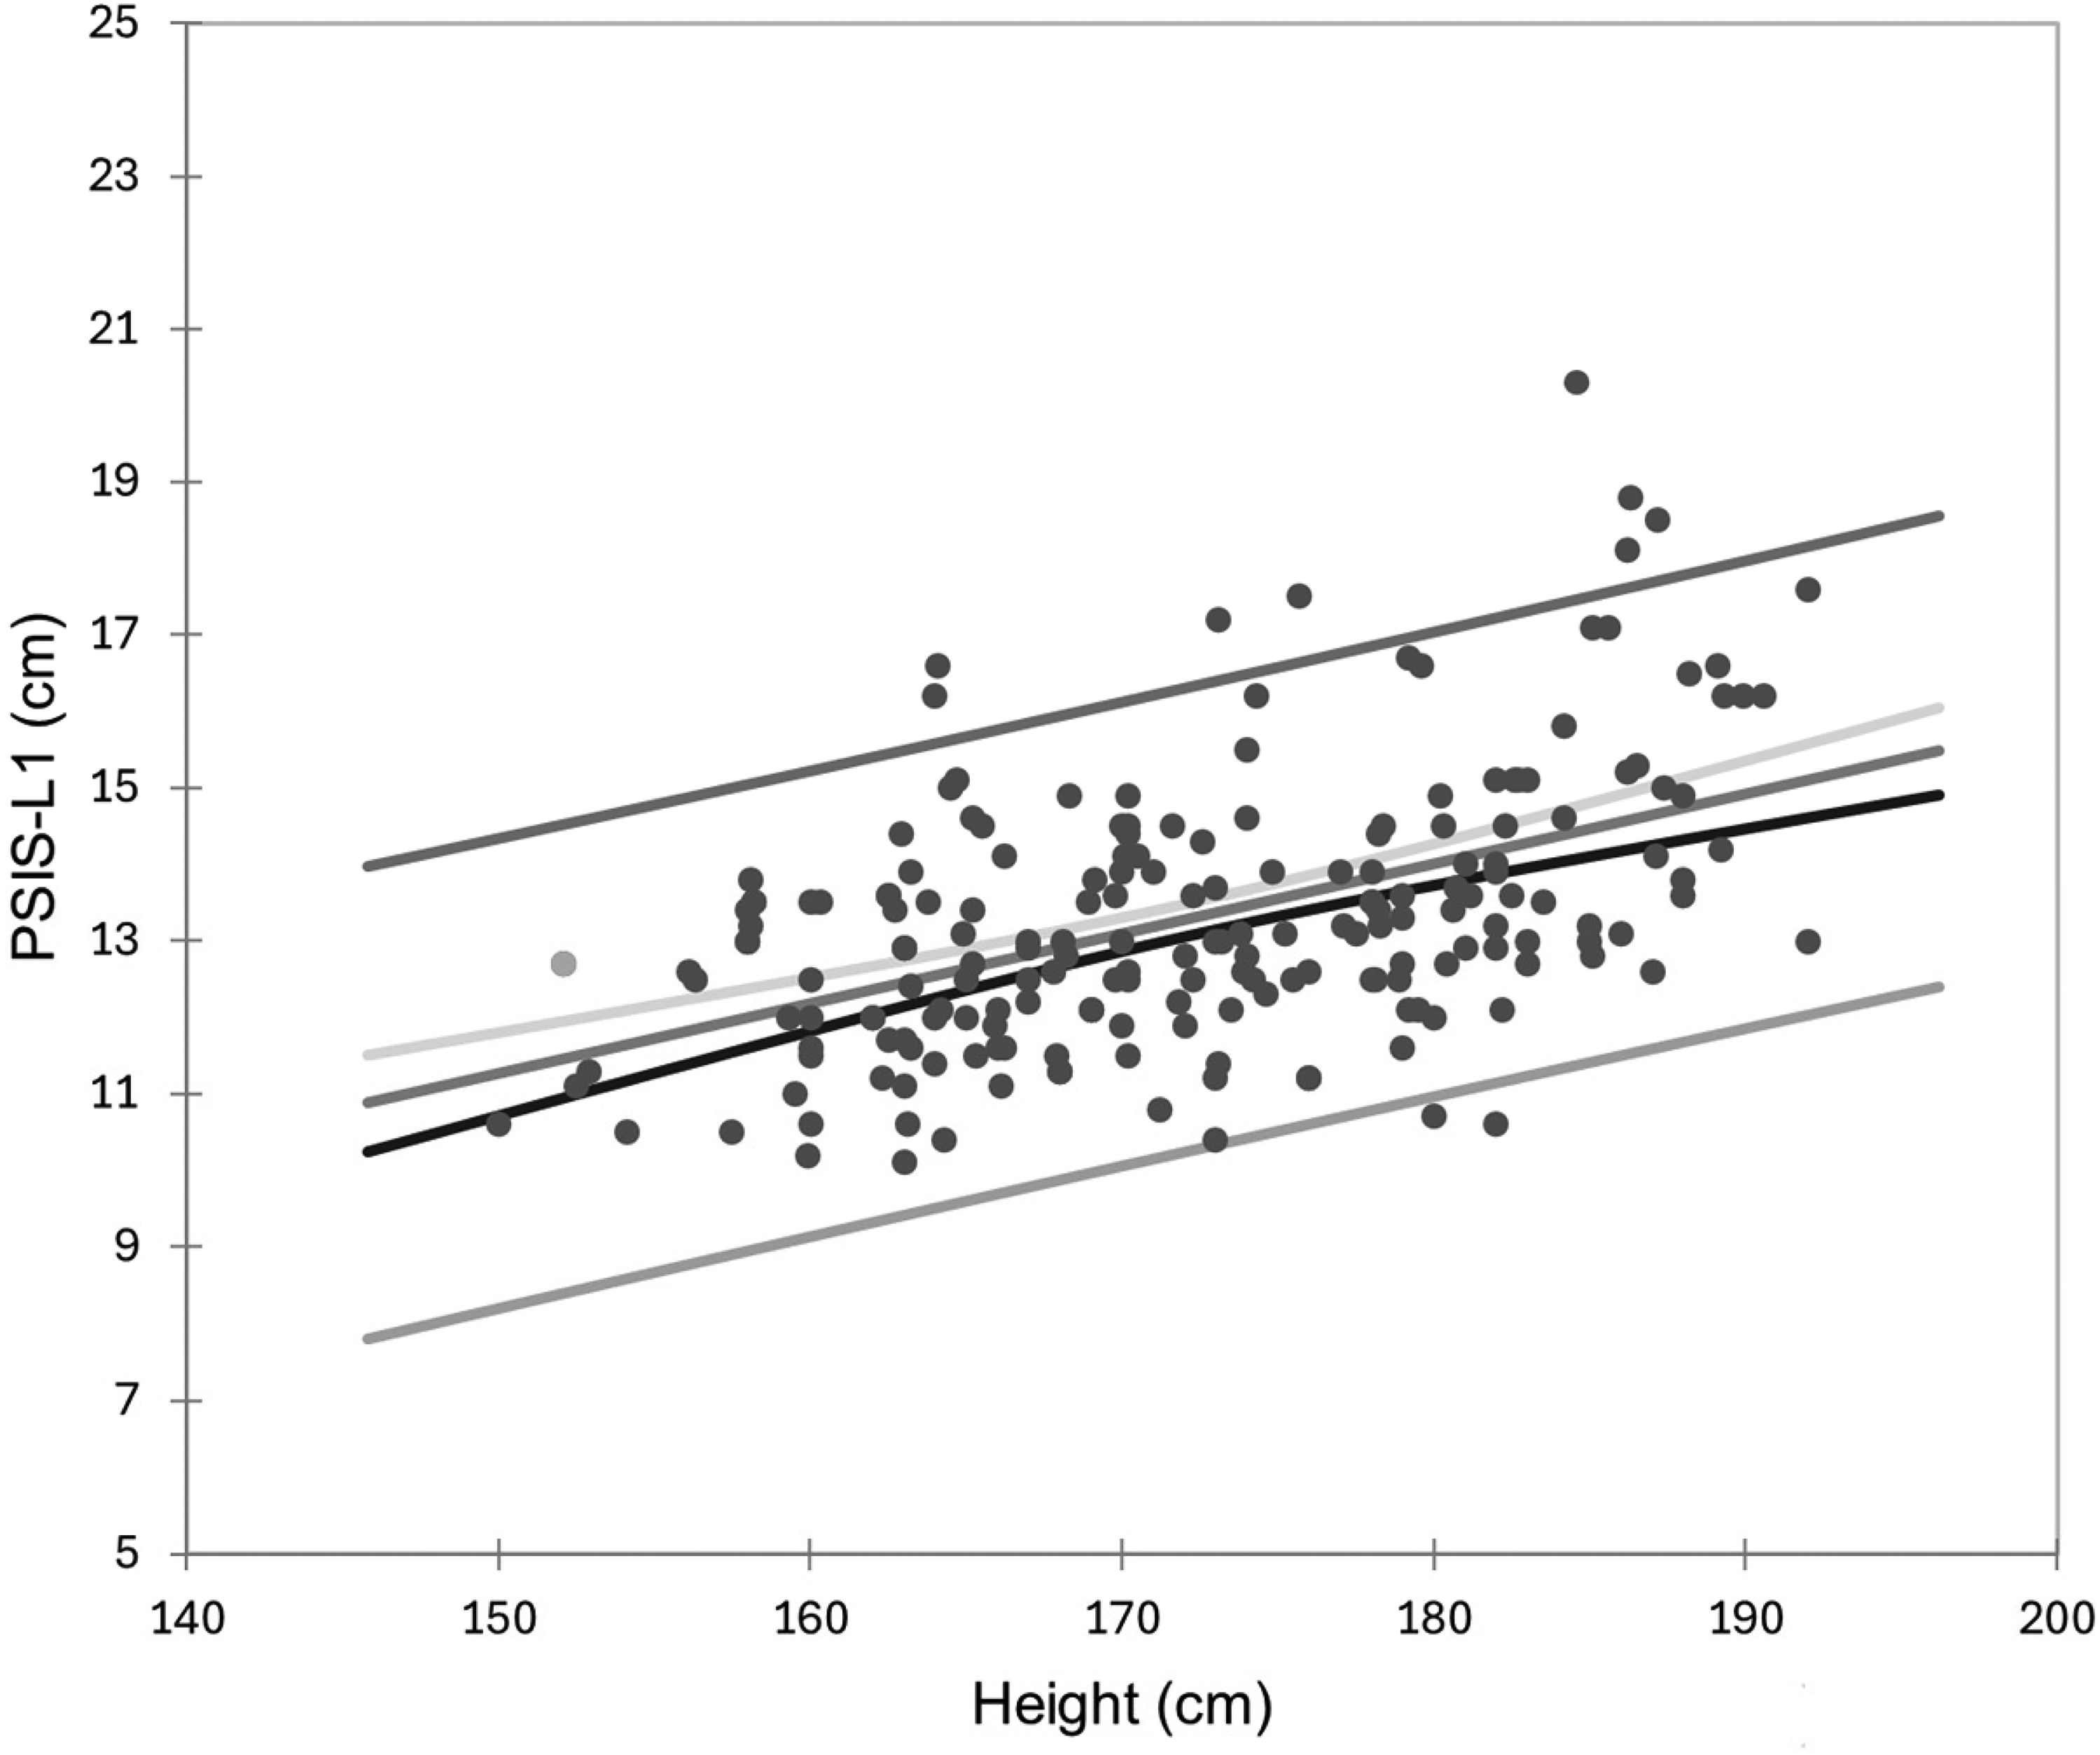
Linear regression between PSIS-L1 (cm) and standing height (cm).
“PSIS-L1 = 0.09 * standing height (cm) − 2.4”.
Another option for predicting the location of the upper marker is to use the PSIS-L1/standing height ratio. This ratio reached 7.7 ± 0.25% in our overall population (7.61 ± 0.83% in female subjects and 7.82 ± 0.92% in male subjects; p = 0.095).
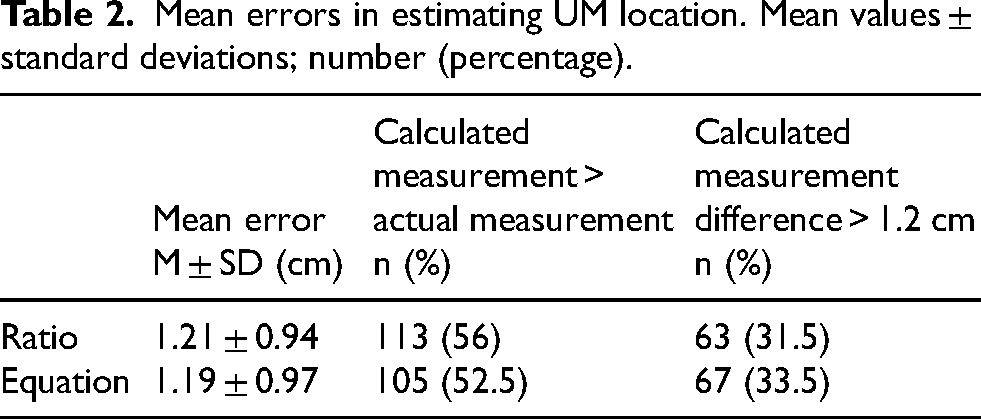
A posteriori, we calculated the positioning of L1 from these 2 prediction modalities (equation and ratio). We compared this theoretical value with the height measured between the PSIS and the ultrasonically located UM.
Table 2 shows that the average error in estimating the location of the UM via the 2 prediction modalities is around 1.2 cm in relation to the middle of L1. It also shows that this theoretical measurement is overestimated for just over half of our population compared with the height actually measured. These results also indicate that for 30% of our participants, the error is more significant than 1.2 cm, which would place the UM outside, above or below, the L1 spinous process (the latter measuring 2.4 cm on average, according to Aylott et al., 28 our reference point for measurements was half the height of the L1).
Mean errors in estimating UM location. Mean values ± standard deviations; number (percentage).
Discussion
Current tests for clinical assessment of lumbar mobility are controversial9,10 because they not only do not take into account patients’ morphological characteristics7,8 but also palpatory errors.1,14,24,29,30 Our study aimed to assess the lumbar spine's height between the PSIS's lower margin and the middle of the spinous process of L1 in the standing position. We have also attempted to identify a valid model for predicting L1 localization. Using ultrasound to locate bone structures, we were able to identify significant individual variations in this height, ranging from 10.1 cm to 20.3 cm, as well as a predominant influence of standing height. Our results confirm the lack of validity of conventional tests. Those tests assess lumbar spine mobility based on a fixed 15 cm measurement between upper and lower markers, regardless of the individual's morphology.6–8,19
If we had used a fixed 15 cm, from the Modified Schobert Test, to place the UM on our 200 participants, taking into account an average height of L1 of 2.4 cm, 28 only 25% would see their UM come into contact with it. For 7% of our population, the UM would be placed higher and 68% below L1. We would, therefore, have 75% of our population for whom the UM would not be in contact with the L1 spinous process at this fixed height.
Our study showed little influence of gender. While the PSIS-L1 height appears 1.4 cm lower in the female population of our study (corresponding to 90% of this distance in men), this difference seems to result mainly from the difference (p < 0.001) in mean standing height between the women (165.1 ± 5.9 cm) and the men (179.9 ± 6.4 cm).
Two prediction methods were examined to locate the L1 spinous process, and each gave relatively similar results. Our PSIS-L1/standing height ratio of 7.7 ± 0.25% (with minimum and maximum values of 5% and 10%) does not appear to be influenced by either gender or height and can easily predict UM location. However, it's not perfect, given the individual variations observed in our population.
Another possibility for locating UM is to use the equation resulting from the regression line. However, it may be less practical for the clinician and does not predict L1 location more accurately.
In both cases, with around 70% of our study participants having the upper marker placed on the L1 spinous process, these modalities perform better than the 15 cm. Indeed, using the 15 cm distance, only 25% of our population would have their UM placed in front of L1. Hence, our two predictive models are more reliable than the fixed height used in the Schober Tests.
In addition to its originality, this study included many subjects (n = 200), and an ultrasound allowed us to precisely identify the superior and inferior markers.25,31,32
Regarding the study's limitations, being overweight can limit wave propagation for visualizing specific structures. 26 Yet, even with a high BMI (>35 kg/m2), ultrasound can be used to visualize bone structures in the lumbar spine.33,34 According to Stiffler & al., ultrasound effectively identifies bony marks in around 75% of cases. 35 We did not encounter any problems with visualization of the spinous processes with the ultrasound in our population (BMI = 24.6 ± 4.0 Kg/m²).
Ultrasound is less precise than other imaging modalities. 33 Still, it is nevertheless a tool that enables the study of the posterior superficial structures of the lumbar spine,25–27 even by novices who have had minimal training in the use of the tool.31,36,37
The BMI didn’t prevent measurements being taken between the skin markers using the tape measure. The tape measure was firmly applied to the skin in the best possible way, as is done clinically, even in our participants with a high BMI. However, this may pose a problem, due to skin folds, in subjects with a very high BMI.
Another limitation of our study is that we could not assess the participants’ lumbopelvic sagittal morphology, which may interact with the intervertebral disc height and the column posture.38–40 To take this factor into account, an X-ray is needed to measure the Cobb angle or pelvic tilt, but this presents health risks. 5
Our participants did not log their daytime activities. Various activities can influence disc height. Certain practices can reduce it, while others increase it.41–44 These limitations may have influenced our results. However, the measurements were taken in a standing position and at different times of the day, reflecting the conditions observed in the clinic. Further, we wanted to measure the distance between skin markers under the conditions under which clinicians perform lumbar mobility tests.
The height measurement in the seated position could have been taken as a possible reference for calculating the PSIS-L1 height. Since the lumbar mobility assessment tests were performed in the standing position, we did not retain the seated option.
Participants over 65 years have been excluded. The reason is to avoid errors in the visualization of the spinous processes. In this age group, the narrowing of the interspinous spaces, caused by the ossification of the ligaments in these regions, is frequent. 33 Our prediction rules will need to be confirmed in this population.
We defined the line passing through the PSIS as the lower marker, which, according to the literature, is found at either S2 or S1. 18 Thus, by placing the LM at this level, we ensured that the L5-S1 joint would fall in the assessed mobility of the lumbar spine.
The midpoint of L1 height was taken as the reference point. Until now, we have no knowledge of the direction or possible displacement of the skin marker placed at this level between the upright starting position and the maximum anterior flexion performed during a lumbar mobility assessment test. Further studies are required to ensure that this marker remains opposite the spinous process of L1.
Conclusion
Current clinical tests for assessing lumbar mobility, based on identically spaced skin markers, lack validity by not being adapted to the morphology of all subjects.
The distance from the inferior mark (lower margin of the PSIS) to the spinous process of L1 can be assessed by the 7.7% standing height ratio or by the predictive equation of the regression line of the relationship between PSIS-L1 and standing height “PSIS-L1 = 0.09 * Standing Height (cm) - 2.4”.
To cover the entire lumbar spine, these two models have better validity than the fixed distances of the Schober tests.
In order to develop a new tool for the clinical assessment of lumbar mobility, further studies are required to verify the displacement of the L1 skin marker during anterior flexion, establish norms and analyze its metrological and clinometric qualities.
Footnotes
Acknowledgments
We would like to thank Aurélien Merienne for his help, Alexander Stenhouse for his meticulous review of the English language in this work, as well as all the participants of the study for their invaluable contributions.
Ethical approval and consent to participate
The study was approved by the ethics committee of the University Hospital of UCL-Namur (NUB: B0392023000002, 21 March 2023). All participants signed an informed consent form for participation in the study.
Informed consent
Not applicable.
Author contributions
DJ, FT, GD, CD and MV participated in the conception of the study. DJ was responsible for data acquisition. DJ and GD analyzed the data. DJ drafted the manuscript and MV, CD, FT and GD critically revised the manuscript. All authors approved the final version.
Funding
The authors received no financial support for the research, authorship, and/or publication of this article.
Declaration of conflicting interests
The authors declared no potential conflicts of interest with respect to the research, authorship, and/or publication of this article.
Data availability statement
Data are available upon reasonable request.