



Abstract
Response to Intervention (RTI) or Multi-Tiered Systems of Support (MTSS) is beginning to be implemented in preschool programs to improve outcomes and to reduce the need for special education services. The proportions of children in programs identified as struggling learners through universal screening have important implications for the feasibility of these approaches as well as for the way programs might allocate resources and staff implementing tiered models of intervention. The expected proportions of children who might be identified for higher tiers of instructional support in pre-kindergarten settings are relatively unknown. The proportions of children who would have been identified for higher tiers of instructional language/literacy support when using three different universal screening measures are described. Participants were 659 children participating in the Center for Response to Intervention in Early Childhood (CRTIEC) Tier 1 Study. Results indicated that the proportions of children at Tier 2 and Tier 3 performance levels were higher for children in low-income eligibility programs and varied by program-level characteristics including numbers of English language learners and children with special needs, as well as the universal screening measure used. Implications of these findings suggest the importance of increased focus on early literacy and language in Tier 1 instruction in programs serving high proportions of children at risk as a means of preventing reading failure in future years.
Keywords
Introduction
Although Response to Intervention (RTI) has been implemented in elementary grade settings for several years, early education programs have only recently applied this approach with children younger than kindergarten who may be struggling to learn language and early literacy skills (Greenwood et al., 2011; McConnell & Missall, 2008). Whether some of the assumptions supporting RTI in K-12 settings will fit pre-kindergarten (Pre-K) programs is still an open question. Although there are many conceptual reasons why RTI should be a good match for early education (e.g., the value placed on early identification/prevention of learning problems; the importance of individualizing instruction in preschool settings), some critical challenges and unanswered questions remain. One major challenge for RTI in early education is the dearth of evidence-based Tier 1 curricula in general and the infrequent implementation of evidence-based curricula to promote early literacy more specifically (Guo, Sawyer, Justice, & Kaderavek, 2013). In addition, the scarcity of measures for identification and progress monitoring in early literacy and language is another challenge of preschool RTI (Greenwood et al., 2011). Early education programs that seek to implement universal screening to identify children who would benefit from higher tiers of instructional support are limited in their choices of measures. Yet, many Pre-K programs implementing tiered early literacy programs are moving ahead with universal screening with limited information on the soundness of these measures or the ramifications for their programs of their choices in these measures.
One question about RTI models in Pre-K programs related to universal screening in early literacy and language is what proportions of children would be identified as potential candidates for higher tiers of instructional support, and whether programs have the capacity and the infrastructure for addressing those needs. The proportion of children in a classroom or a program who are identified for higher tiers of support has important implications for how RTI models are conceived and delivered. When greater numbers of children are identified for a Tier 2 and 3 early literacy intervention, more resources in terms of staff, materials, time, and cost will be required to appropriately serve them. This concern is magnified for programs that already focus on children who are at risk for meeting readiness goals for kindergarten (e.g., Title 1 preschool programs, many state-funded Pre-K programs, and Head Start). The available evidence indicates that many children entering these programs are significantly below the mean on measures of vocabulary (e.g., Zill & Resnick, 2006). Therefore, we might expect that the proportion of children needing more than universal Tier 1 early literacy and language services would be much higher in these early education programs than the 20% rule of thumb, often discussed for the elementary grades (National Association of State Special Education Directors, 2008).
Therefore, in the present study, we sought to contribute to the literature by addressing questions about the proportions of children who qualify at levels of language and early literacy risk greater than Tier 1 in preschool programs in a secondary analysis of a data from a larger investigation (Greenwood et al., 2012). We sought to investigate how proportions of at-risk children might vary across early childhood program types and when using various screening measures used for identification. We expected that preschool RTI tier-level proportions in programs would be influenced by child factors such as poverty, the language spoken at home, and special needs status (e.g., Shanahan & Lonigan, 2008). We also expected proportions would be influenced by the measures selected for use and the constructs, content, and methods that they reflected (e.g., Fletcher, Stuebing, Miciak, & Denton, 2012). This information about proportions of children identified for greater instructional intensity is fundamental for programs seeking to address critical policy questions about feasibility and the resources, staff, time, and cost needed to implement RTI. These data about relative proportions might also inform the sequence of steps a program might take in beginning implementation of an RTI program designed to strengthen the overall effectiveness of preschool instruction.
The overall goal of the larger Center for Response to Intervention in Early Childhood (CRTIEC) Tier 1 study was to examine the quality of Tier 1 being implemented across a large number of classrooms in early education programs that were typical in each of four geographic sites (see Greenwood et al., 2012). In general, we sought to investigate the quality and quantity of early literacy/language instruction that might serve as the foundation for a multi-tiered system of support. In the current study, we report the range of children being served across these typical programs and the proportions of them that might be identified for higher tiers of instruction if they were universally screened with multiple measures at the beginning of the school year.
We addressed the following research questions from an RTI perspective:
Method
Sample
Participants were 659 children with informed consent enrolled in 65 Pre-K classes from programs in four states that were involved in the CRTIEC Multi-Site Study of Tier 1 instruction during the 2009-2010 school year (see Greenwood et al., 2012, for details). Programs participating were typical in each of the four geographic sites involved in the CRTIEC project (Kansas City, MO/KS; Columbus, OH; Eugene–Springfield, OR; and Minneapolis, MN).
Only early education programs that reported that language and literacy were an instructional focus and that could identify a specific curriculum they used for language and literacy instruction for the majority of preschool-aged children were recruited. We selected programs where children attended for at least 12 hr per week, where the majority of early literacy instruction occurred in English and where children communicated primarily in either English or Spanish. We included programs that served children with IEPs but did not include programs in which the majority of children had disabilities or developmental delays.
This enrollment resulted in 65 classrooms that represented four types of programs: 20 (30.7%) were from State-Funded Pre-K programs; 20 (30.7%) were Title 1; 17 (26.1%) were from Head Start; and 8 (12.3%) were Tuition-Based (see Table 1). The majority of classrooms were from half-day (39, 60%) versus full-day (26, 40%) classrooms. Private-Tuition and Title 1 classrooms were more likely to be full-day programs, whereas Head Start and Pre-K were more likely to be half-day programs.
Number of Classroom by Program Types by Site.

Children and parents
All children in the selected programs who were at least 4 years old and were identified in their Pre-K year and all children in the selected classrooms and their parents meeting these criteria were individually recruited. The mean age of the children was 4.6 years (SD = .32 years) at the first assessment. Eighty-one percent were 4-year-olds, 19% were 5-year-olds.
Children’s and parents’ socio-demographics varied by sites (see Greenwood et al., 2012). The total sample was balanced by gender and included 36% African American, 31% White, 20% Hispanic/Latino, 10% multi-race, and 3% Asian. Approximately 23% of the children were ELLs. This varied considerably by program type with 38% of children in State-Funded Pre-K programs being ELLs and 0% of children in the Tuition-Funded programs (see Table 2). The mean percentage of children eligible for early childhood special education (with IEPs) was 11%. This also varied across program types with 15% of children in Head Start programs having IEPs and 3% of children in Tuition-Based programs. With regard to parent/caregiver educational attainment in the overall sample, 22% of parents reported having less than high school, 23% had high school diplomas or general education development (GED), and 55% reported education beyond high school.
Percentage of ELLs and Children With IEPs Across Program Types.

Note. ELL = English language learners; IEP = Individualized Education Plan.
Teachers
All teachers in these classrooms were recruited for participation, and those enrolled provided informed consent. These 65 teachers reported 9.9 mean years of teaching experience. The majority of teachers reported having a 4-year degree (47.7%) in early childhood education; 7.4% had a 2-year degree. The proportion of teachers having a graduate degree was 38.2%; 18.5% of these were early childhood degrees. Only 2.4% had a Child Development Associates (CDA) degree, and 4.3% had no degree.
Design and Procedures
In addition to child/family and teacher characteristics, measures used for this report focused on oral language and early literacy performance to identify children who might have been appropriate candidates for more intensified Tier 2 and Tier 3 interventions in these areas. A lead measurement director planned and supervised implementation of the multi-site data collection. Staff assessors in local sites were trained to meet calibration standards on all measures and to meet pre-specified levels of procedural and measurement reliability.
Measurement
The universal screening measures used in the fall included the Get Ready to Read (GRTR; Whitehurst & Lonigan, 2001), an early literacy screener; and an early version of the Picture Naming and Sound Identification measures in the Individual Growth and Development Indicators (IGDIs 2.0; see McConnell & Greenwood, 2013). The two IGDI measures (Picture Naming and Sound Identification) were collected in the fall, midyear, and spring of the academic year, but only fall assessment data are included in this report.
GRTR
The GRTR is a brief, 20-item screener that measures print knowledge, emergent writing, and phonological awareness and that includes cut points for identifying children with weak and very weak language and early literacy skills. Reliability is reported to be .78 for alpha and .80 for split-half. Classification accuracy (predictive validity) of the measure with the Test of Preschool Early Literacy (TOPEL; Lonigan, Wagner, & Torgesen, 2007) ranged from 68% to 86% (Wilson & Lonigan, 2009). Validity is reported to range from .58 to .69 (Phillips, Lonigan, & Wyatt, 2009). Recommended cut point ranges for the GRTR scores are 9 to 20 (average and above) = Tier 1; 6 to 8 (weak skills) = Tier 2; and 0 to 5 (very weak skills) = Tier 3.
IGDIs
Picture Naming and Sound Identification IGDIs developed by the CRTIEC research team were used (McConnell & Greenwood, 2013). The Picture Naming IGDI is an individually administered, untimed task in which a child is presented with a set of pictures, each depicting a familiar object, and the child is asked to name each picture as quickly as possible (Bradfield et al., 2013). Administration consists of 4 sample cards and 40 test cards with a child’s score being the number of pictures correctly named out of 40. This score is converted into a Rasch scale score and a correct card equivalent score. Picture Naming has a person-level (as opposed to item level) reliability score of .81 and criterion validity correlation coefficients of .62 with the Peabody Picture Vocabulary Test (PPVT; Dunn & Dunn, 2007) and .69 with the Clinical Evaluation of Language Fundamentals–Preschool (2nd ed.; CELF-P2; Wiig, Secord, & Semel, 2004) expressive vocabulary subtest. A cut score of 28 produced a 70% classification accuracy of being in Tier 1. This score was associated with a balance in classification accuracy of 70% between correctly identified for Tier 2/3 (sensitivity) versus falsely identified for Tier 2/3 (selectivity). The criterion used as the basis for classification accuracy was teachers’ ratings of students’ vocabulary skill as defined by a three-tier rubric classification developed by the authors.
The Sound Identification IGDI is an individually administered, untimed task in which the child identified a sound that the letter makes from three choices (Wackerle-Hollman, Schmitt, Bradfield, Rodriguez, & McConnell, 2013). Like in Picture Naming, items on the Sound Identification IGDI are presented on individual cards, but in this case, each card depicts three letters (upper and lower case). The child is asked to point to the letter that makes the sound modeled by the assessor. The score on this measure is the number of letters correctly identified. This score is converted into a Rasch scale score and a correct card count equivalent score. The person-level Rasch reliability score is .60. Sound Identification has a criterion validity correlation coefficient of .54 with the TOPEL Print Knowledge subtest (Lonigan et al., 2007). A cut score of 10 on Sound Identification was associated with a probability of .74 of being in Tier 1. This score was associated with a balance in classification accuracy of 70% for Tier 2/3 correctly identifying children for Tier 2/3 (sensitivity) versus incorrectly identifying Tier 2/3 (selectivity). As with the Picture Naming, the criterion for classification accuracy was teachers’ ratings of child skills on a three-tier rubric, this time rating children on their phonological awareness skills. Each of the IGDI assessors met pre-specified qualifications based on meeting a protocol assessing their administration fidelity.
Results
Research Question 1
Children’s overall GRTR mean score was 11.2 (SD = 4.3), higher than the lower cut point limit of 9 on the GRTR, indicating that, on average, children in the sample were in the low normative range on the GRTR screener (see Table 3). Also, pairwise comparisons across programs indicated that preschoolers in the income-eligible programs (i.e., Pre-K, Head Start, and Title 1) had lower GRTR mean scores compared with those in the Tuition-Based programs.
Mean Screening Scores for Children in Preschool Programs.

Note. GRTR = Get Ready to Read; PN = Picture Naming; SI = Sound Identification.
TB versus PK < .001.
TB versus HS < .001.
TB versus T1 < .001.
PK versus HS < .001.
PK versus T1 < .001.
Overall means on the Picture Naming and Sound Identification IGDIs indicated that, on average, children’s scores were actually below the normative range. The Picture Naming score for the entire sample (M = 26.7, SD = 9.0) fell below the lower Tier 1 cut point score of 28 (see Table 3). As with the GRTR, pairwise comparisons indicated that children in the Tuition-based programs scored higher on Picture Naming than those in Pre-K (23.4) and Title 1 (27.6) programs who scored below the Tier 1 cut point (see Table 3).
The overall mean score on Sound Identification (M = 9.9, SD = 5.8) was equivalent to the lower Tier 1 cut point of 10 for this measure. Mean scores of children from Pre-K (9.6), Head Start (9.1), and Title 1 (9.7) were all below the Sound Identification cut point for Tier 1. Pairwise comparisons for Sound Identification indicated that the Tuition-Based program mean of 13.4 was significantly higher than those of each of the other three programs (see Table 3).
Research Question 2
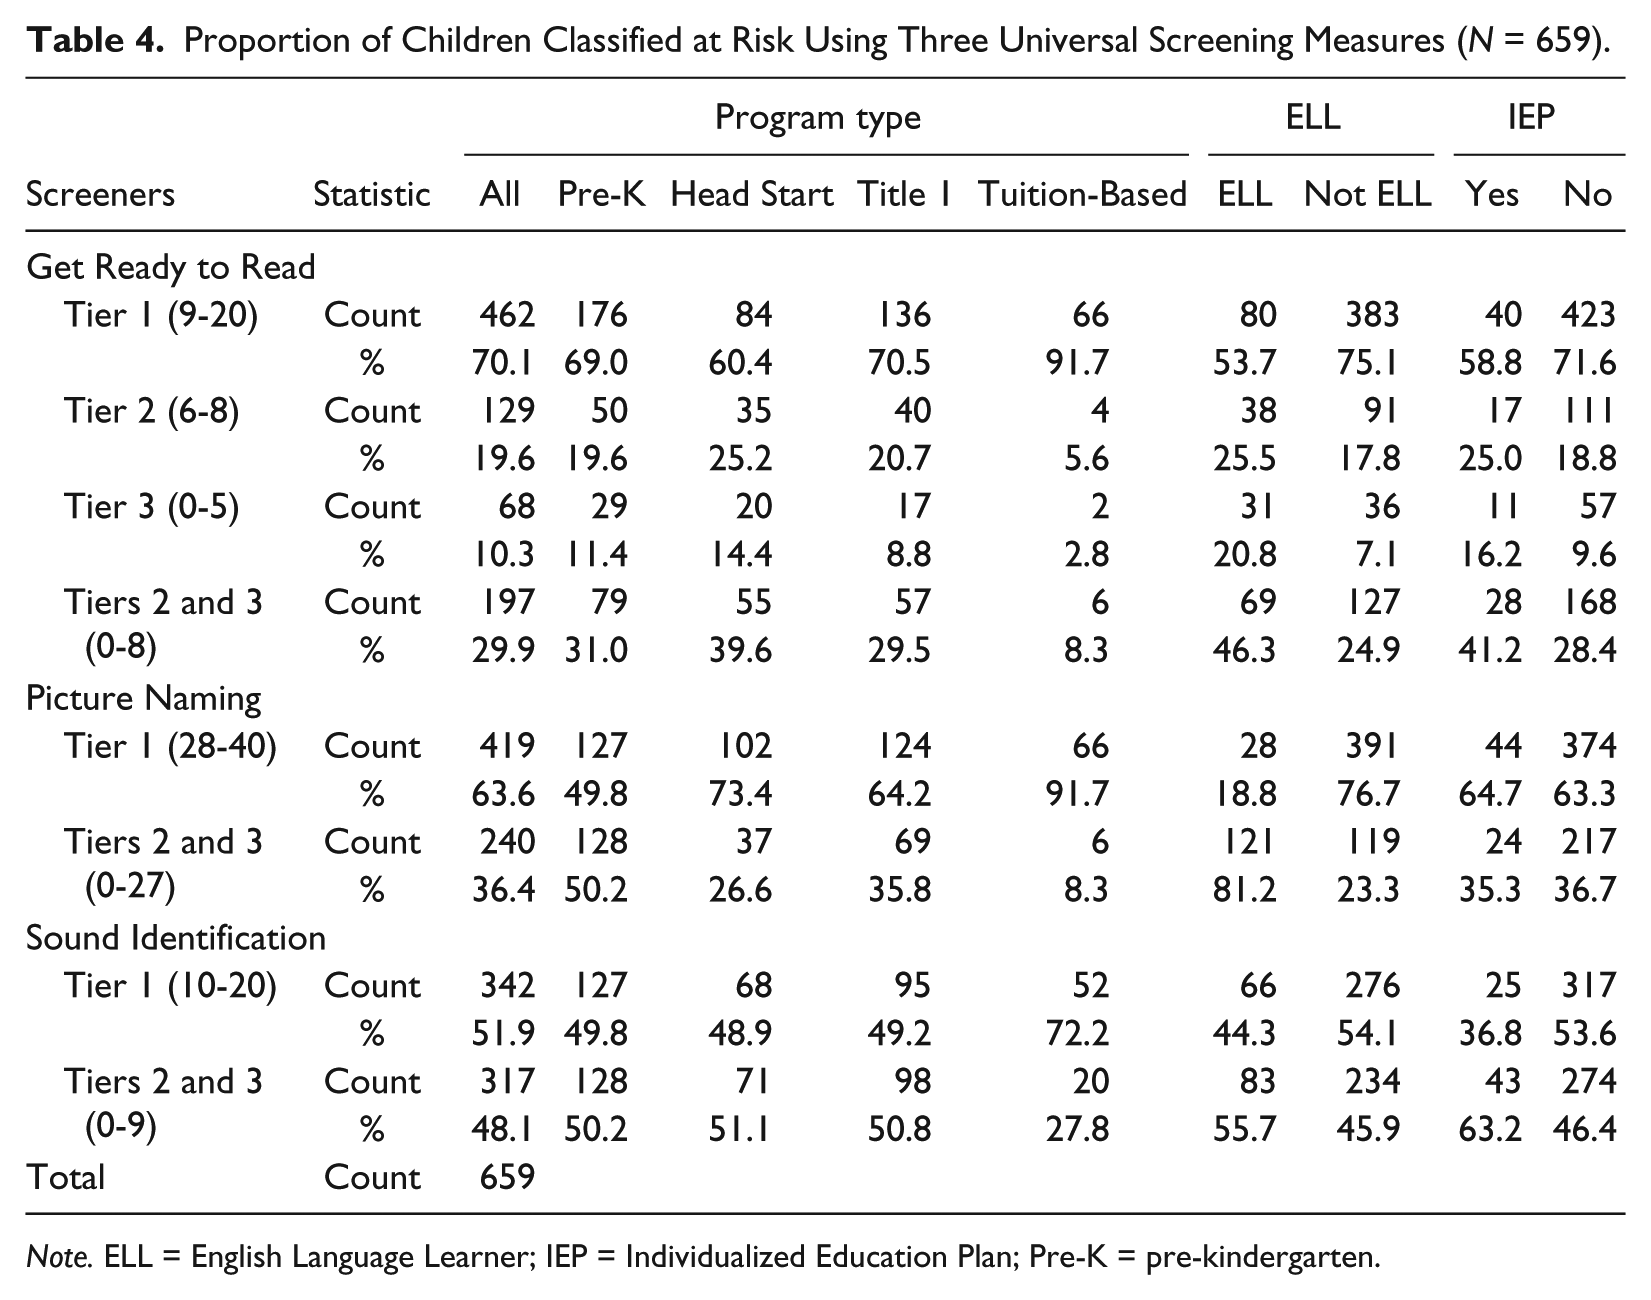
As might be expected, given the differences in overall means by screening measures reported above, the proportions of children identified for Tier 2/3 support varied by measure. The proportions of children identified for higher levels of instructional support across the entire sample were 29.9% using the GRTR, 36.4% using Picture Naming, and 48.1% using the Sound Identification measure. Looking at proportions identified within specific programs, the smallest proportions of children were identified in the Tuition-based program (see Table 3). Proportions of children also differed considerably for each measure by program. For example, although the GRTR identified approximately 30% of the entire sample for higher tiers of support, approximately 40% of children in Head Start programs were identified for Tier 2/3 using this measure and fewer than 10% in Tuition-Based programs.
The Picture Naming measure identified a higher proportion of children across the entire sample (36.4%) than did the GRTR. Using Picture Naming, the proportions identified for Tier 2/3 support varied considerably across program types with 50.2% identified in Pre-K programs and only 8.3% in Tuition-Based programs. The Sound Identification measure identified the highest proportion of children across the entire sample (48.1%) with variation across programs ranging from 51.1% in Head Start programs and 27.8% in Tuition-Based programs.
Research Question 3
The proportions of children identified for higher than Tier 1 instructional support were 29.9%, 36.4%, and 48.1%, as measured by the GRTR, Picture Naming, and Sound Identification screeners (see Table 4). As previously noted, for all three measures, proportions were lowest for the income-eligible programs compared with Tuition-Based. The proportions identified for higher tiers were generally larger when the two IGDIs were used than when the GRTR was employed, with more children identified for Tier 2/3 services using the IGDI measures than when the GRTR was used (with the exception of Picture Naming [26.6%] in Head Start versus GRTR at 39.6%). Across all programs, the highest proportion of children were identified with the Sound Identification measure.
Proportion of Children Classified at Risk Using Three Universal Screening Measures (N = 659).
Note. ELL = English Language Learner; IEP = Individualized Education Plan; Pre-K = pre-kindergarten.
Children whose home language was other than English were identified in much greater proportions (see Table 3) than children whose home language was English. For example, 46.3% of ELLs were identified for Tier 2/3 using the GRTR measure, compared with 24.9% for children who were not ELL. The difference between ELL and not ELL in proportions identified for higher tiers of support was the greatest for the Picture Naming measure with 81.2% of ELL children identified and 23.3% of not-ELL children identified. The smallest difference in proportions between ELL and not ELL occurred for the Sound Identification measure with 55.7% of ELL children identified for Tier 2/3 and 45.9% of not-ELL children identified.
The proportion of children with IEPs identified for higher tiers of instructional support by the GRTR was 41.2%, compared with 24.9% of children without IEPs; 63.2% of children with IEPs were identified using the Sound Identification measure compared with 46.4% without IEPs. Interestingly, similar proportions of children with and without IEPs were identified using the Picture Naming measure, at 35.3% with IEPs versus 36.7% without IEPs.
Research Question 4
The concordance among the three screening measures in identifying children for Tier 2 or 3 services was 63% (415 out of 659 children) overall. For 37% of the children, there was a lack of agreement across the three measures in identifying the children for Tier 2/3. The best pairwise concordance was between the GRTR and the Picture Naming IGDI, with 72% of children classified in agreement. The least concordance among screening measures was found between Picture Naming and Sound Identification, at 63%, the first a vocabulary and the second a phonological awareness measure.
Discussion
The purpose of this investigation was to address questions about the proportions of children identified by language and early literacy universal screening measures across a range of early education programs. The measurement model based on the RTI approach used three screening measures selected for their brevity and repeatability making them efficient and feasible for program-wide universal screening.
The primary question we sought to answer was whether the proportions identified for higher tiers of instructional support would approximate those expected in a three-tier RTI framework. An assumption of RTI approaches is that the proportion of children identified for higher tiers will be less than the proportion identified for core instruction (Tier 1). If this assumption is flipped, and higher proportions are identified for the resource-intensive Tier 2/3 than for Tier 1, an RTI-driven program would not be feasible within the presumed constraints and costs of implementing RTI in most typical preschool programs.
Additional questions examined the variation in proportions by measures overall, by programs, and by ELL and IEP status. We sought to describe the range of differences in the proportion of identified children that might arise given use of different screening measures, and thus, the practical implications for preschool RTI feasibility and implementation. It was not our purpose to examine the superiority of the screeners on differences in domain content or accuracy in determining risk (e.g., Wilson & Lonigan, 2009).
On the three screeners, children scored, on average, close to the cut score separating Tier 1 from Tier 2/3. The proportion of children identified across the entire sample for Tier 2/3 overall was as low as 30% when using the GRTR and was as high as 48% when using the Sound Identification IGDI. The smallest proportions identified for Tier 2/3 were in the Tuition-Based program with 8.3% indicated on both the GRTR and the Sound Identification measures. The highest proportions of children were identified for Tier 2/3 by the Sound Identification IGDI, and this was true across all the programs (range was 27.8% within Tuition-Based programs and 51.1% within Head Start programs). The proportions of children indicated among ELL and IEP status children were the highest of all. And the concordance among the measures was as low as 63% between the Picture Naming and Sound Identification, and as high as 72% between the GRTR and Picture Naming, indicating a sizable lack of concordance.
Several important findings were generated by these analyses with important implications for early education programs adopting RTI frameworks. One finding was that approximately 30% to 35% were identified for higher tiers of support rather than the 20% often indicated for RTI models implemented in K-12 settings. Another finding was that the proportions of children identified for Tier 2/3 services were much larger in income-eligible programs compared with Tuition-Based programs, and this most likely reflects the sizable numbers of children in income-eligible programs who are ELLs and have IEPs. A striking finding was that more than 81% of ELL children were identified by the Picture Naming IGDI. Of course, the Picture Naming measure captures only a child’s expressive vocabulary knowledge in English. A new set of Spanish IGDIs will allow programs to measure a child’s oral language and early literacy skills in Spanish, and programs will be able to assess children who are native Spanish speakers in both English and Spanish (see Wackerle-Hollman, 2014). For children with IEPs, Picture Naming typically was not nearly the challenge as it was for ELLs, with 35.3% identified by this measure. For children with IEPs, Sound Identification was much more likely to identify children needing Tier 2/3 (63.2% children). Across all screening measures for ELL children and those with IEPs, these subsample proportions were vastly larger than the theoretical 20% one would expect, indicating a greater need for resources for the programs serving these children and a reconfigured Tier 1 foundation to prevent and reduce these numbers. In contrast, Tuition-Based programs with fewer ELL children and those receiving early childhood special education had much smaller proportions needing Tier 2/3 services.
It should not be surprising that screening measures did not consistently identify similar proportions of children as being at risk for literacy and language problems. The higher proportion identified by the Sound Identification measure is most likely a reflection of the fact that many children are not exposed to instruction on letter–sound correspondence until the year before they enter kindergarten. Therefore, children without classroom instruction in this aspect of early literacy may have a higher likelihood of obtaining a positive screen than they would on Picture Naming, as children may have opportunities to learn vocabulary in their home and classroom environments prior to receiving specific classroom oral language instruction. These content differences tapped by the measures have important implications for programs deciding what they are planning to teach and aligning content domains appropriately.
Limitations
Several study design limitations need consideration. First, although based on a multi-site study with a large student sample, the findings reported by program types cannot be considered nationally representative, because the four program types were not equally represented in the study’s sampling plan due to limitations in resources. As a result, program types in the study were confounded by site and regional factors. However, the participating programs were qualified members of well-known, national early education programs with their accompanying standards and criteria for program membership, program quality, and accountability.
Because the Tuition-Based programs were all for-profit service providers, they conformed to their own unique standards; and thus, they were less likely typical of any particular class of early education program than were the other three programs. We argue that the meaningfulness of the program type comparison was in accounting for variation in the numbers of children at language and early literacy risk based on expected socio-demographic differences associated with the each program type. Thus, program type differences were due to factors beyond those associated with program differences in philosophy, pedagogy, or service model.
Second, because Picture Naming and Sound Identification cut points separating Tier 2 and 3 risk levels were not available, we were not able to separate the proportions of children in each tier. These cut points await further research. Third, results were limited to only one measurement occasion at the beginning of the year. Additional research is needed on this important aspect of how universal screeners might identify children at different times of the school year (after exposed to several weeks of Tier 1 early literacy/language instruction).
Implications
The proportions of children needing more intensive tiers of intervention revealed in this study clearly raise some serious questions of how an RTI model might be designed and implemented in early education settings—especially those serving children with low-income eligibility requirements. We understand that these proportions were influenced by poverty and home language differences, for example, as well as the universal screening measure used for identification, the domains they tapped, and classification accuracy psychometrics.
These high proportions of children at early literacy/language risk are not news to those who are familiar with Pre-K programs serving low-income children. However, organizing instruction that addresses the early literacy/language gaps prior to kindergarten is the real challenge in these programs. Faced with large numbers of children with risk but limited resources and capacity for serving them using the RTI approach, programs will need help knowing how to approach the challenge, how to begin, and how to make subsequent decisions leading to implementation of the RTI approach and attaining the promised benefits.
Establishing an effective Tier 1 combined with local screening data to quantify the proportions of children needing higher tiers of support is usually the first step in implementing an RTI approach (Greenwood, Horner, Kratochwill, & Clements, 2008). Subsequent steps strengthening Tier 1 based on local screening data also will be needed to improve local outcomes and reduce the numbers needing Tier 2 and 3 supports. Fortunately, the problem of needed enhancement of Tier 1 is not the lack of knowledge of what needs to be taught and learned prior to kindergarten (e.g., Shanahan & Lonigan, 2008). The heart of the challenge is the curriculum, methods, implementation standards, and professional development needed to teach children these skills.
Review and selection of an evidence-based curriculum to be implemented is an early step in reducing the proportions of children at risk. Understanding the socio-demographic risk of the children being served as in this study also helps explain the extent that supports for ELL children will be needed as part of Tier 1. Screening data in this study also helped identify Sound Identification in the phonological awareness domain as an area where Tier 1 instruction is likely needed by all students, regardless of home language environment.
Conclusion
Clearly, regardless of the measure being used, large proportions of children in the United States will enter kindergarten with significant delays in language and early literacy. “Business as usual” in early education that typically waits until the early elementary grades to identify children as struggling learners and only then provides more intensified instruction to these children is intervention that is “too little and too late.” Although the promise of reaching greater effectiveness in Pre-K instruction through RTI is challenging, we argue for greater efforts to provide the necessary infrastructure tools and supports needed by local programs. Successful RTI implementation efforts will require more refinement in screening and progress monitoring tools, a greater selection of evidence-based interventions, and more attention to professional development that insures high-fidelity implementation of language and early literacy practices.
Footnotes
Authors’ Note
The opinions presented in this article are those of the authors, and no official endorsement of the Institute of Education Sciences should be inferred.
Declaration of Conflicting Interests
The author(s) declared no potential conflicts of interest with respect to the research, authorship, and/or publication of this article.
Funding
The author(s) disclosed receipt of the following financial support for the research, authorship, and/or publication of this article: This work was conducted by the Center for Response to Intervention in Early Childhood supported by Grant R324C080011 to the University of Kansas (Charles Greenwood and Judith Carta, Principal Investigators), from the National Center for Special Education Research, Institute of Education Sciences, U.S. Department of Education.