
Abstract
Objective
To develop a predictive model for estimating cortical bone thickness at any maxillary location in patients with unilateral cleft lip and palate (UCLP).
Design
Retrospective cross-sectional cohort study with machine learning.
Setting
University hospital, Department of Oral and Maxillofacial Radiology.
Patients, Participants
Fifty patients with non-syndromic UCLP and 50 age- and gender-matched controls (total N = 100). Mean age: UCLP 14.8 ± 5.1 years; controls 16.5 ± 4.6 years. Age range: 8 to 27 years.
Interventions
All participants underwent CBCT (0.2 mm voxel, 14 × 16 cm FOV). Cortical bone thickness was measured at 4, 6, 8, 10, and 12 mm from the alveolar crest across six interradicular regions, yielding 4500 data points.
Main Outcome Measure(s)
Cortical bone thickness; model performance metrics (R2, RMSE); feature importance; accuracy by region and depth.
Results
Random Forest regression explained 75% of variance (patient-level cross-validation: R2 = 0.75, RMSE = 0.102 mm). Anatomical region was the strongest predictor (0.38), followed by depth (0.27), age (0.18), cleft status (0.12), and side (0.05). Best accuracy in posterior regions (R2 = 0.84) and at 12 mm depth (R2 = 0.81); lowest in anterior regions (R2 = 0.72) and at 4 mm depth (R2 = 0.69). The model identified high-risk zones with 89% sensitivity (AUC = 0.94). External validation has not yet been performed; the author welcomes collaboration with other centers for independent testing.
Conclusions
This model provides accurate, patient-specific predictions of cortical bone thickness in UCLP patients, assisting in pretreatment risk assessment, surgical planning, and patient counseling.
Keywords
Introduction
Unilateral cleft lip and palate (UCLP) is a common craniofacial anomaly that significantly affects maxillary bone development, leading to characteristic bone deficits in the cleft region.1–3 Previous studies have demonstrated reduced alveolar bone height, decreased bone density, and altered cortical thickness in UCLP patients compared to non-cleft controls.4–6 However, bone thickness varies substantially by anatomical region, depth from the alveolar crest, side (cleft vs non-cleft), and patient age.7–9
This heterogeneity presents a significant clinical challenge. When planning orthodontic treatment, temporary anchorage device (TAD) placement, dental implants, or surgical procedures, clinicians need to estimate bone thickness at specific locations. Currently, this requires CBCT imaging and manual measurements, which are time-consuming, subject to observer variability, and cannot predict bone thickness at untreated sites or future time points.
Machine learning offers a powerful approach to address this challenge. By learning complex patterns from large datasets, machine learning models can predict outcomes based on multiple input variables.10–12 Recent studies have successfully applied machine learning to predict orthodontic treatment outcomes, surgical need, and craniofacial growth patterns.13–15 However, no predictive model for bone thickness in UCLP patients has been reported.
Currently, clinicians rely on direct CBCT measurements to assess bone thickness at specific sites. This approach has three limitations: (a) it requires the patient to have already undergone imaging, (b) it is time-consuming and subject to observer variability, and (c) it cannot predict bone thickness at future time points or at untested locations (eg, donor sites). Our predictive model addresses these gaps by providing rapid, objective estimates based on routinely available patient characteristics. It can be used before CBCT acquisition (eg, for initial risk triage), after CBCT to simulate alternative treatment scenarios, and in settings where expert radiological interpretation is unavailable. Thus, the model complements, rather than replaces, direct imaging.
Therefore, this study aimed to: (a) develop a machine learning model to predict cortical bone thickness at any maxillary location in UCLP patients; (b) evaluate model performance using internal validation (patient-level cross-validation); (c) identify the most important predictors of bone thickness; and (d) provide a clinically applicable tool for treatment planning and a framework for future external validation.
Materials and Methods
Study Design and Sample
This retrospective CBCT study was approved by the Istanbul University Faculty of Dentistry Clinical Ethics Research Board. The study sample consisted of 50 patients with UCLP and 50 age- and gender-matched controls. Demographic characteristics are presented in Table 1.
Demographic Characteristics of Study Sample.
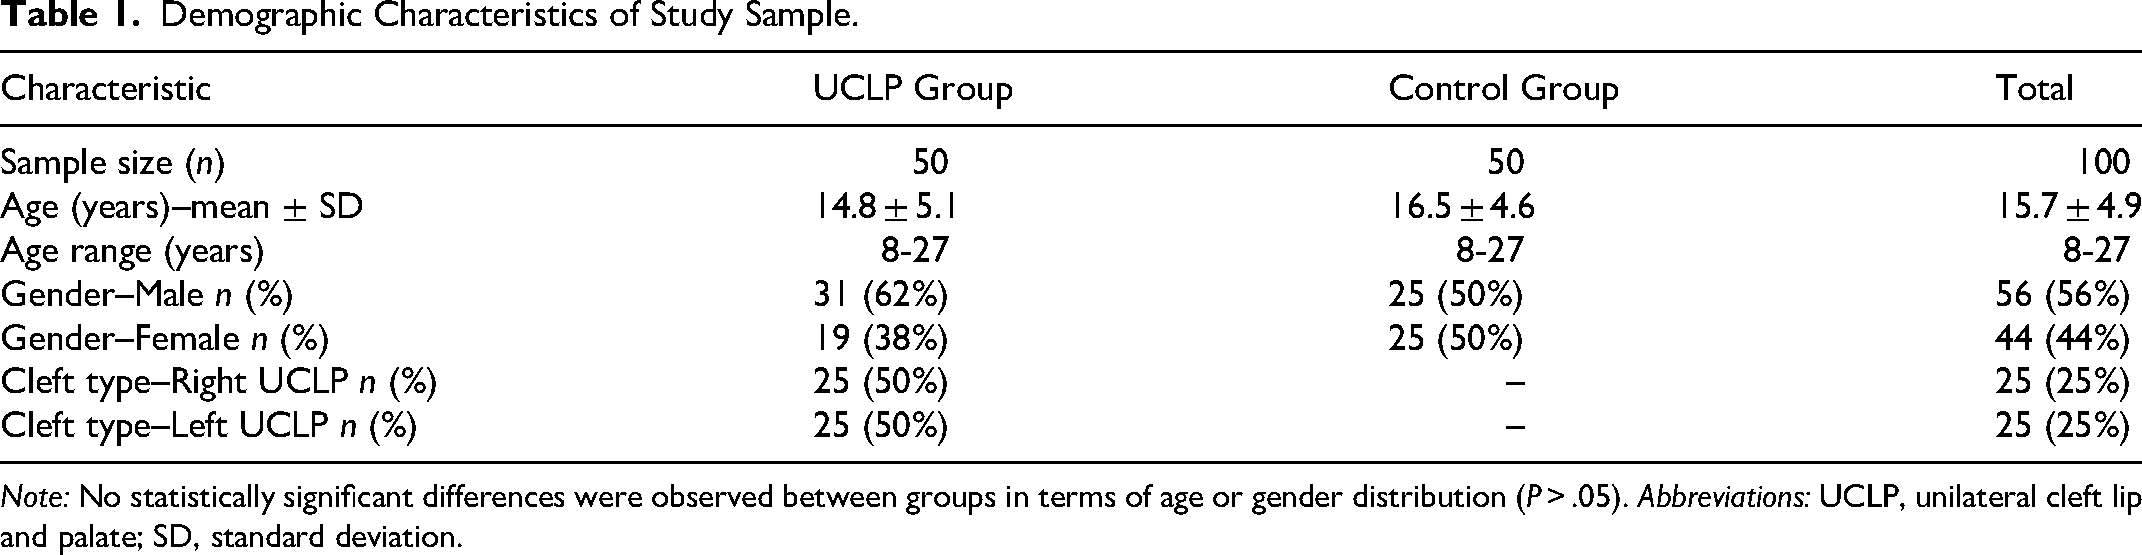
Note: No statistically significant differences were observed between groups in terms of age or gender distribution (P > .05). Abbreviations: UCLP, unilateral cleft lip and palate; SD, standard deviation.
CBCT Acquisition and Parameters
All CBCT scans were acquired using a standardized protocol on a Sorodex Scanora 3Dx CBCT Unit (Sorodex, Tusula, Finland) with the following parameters: 90 kVp, 8 mA, 0.2 mm voxel size, 14 × 16 cm field of view, 14-second exposure time. Image analysis was performed using OnDemand 3DProject Viewer Imaging Software (Cybermed, California, United States).
Measurement Protocol
Cortical bone thickness was measured at depths of 4 mm, 6 mm, 8 mm, 10 mm, and 12 mm from the alveolar crest across six interradicular sites: (a) 1st molar to 2nd premolar; (b) 2nd premolar to 1st premolar; (c) 1st premolar–canine; (d) canine–lateral incisor; (e) lateral incisor–central incisor; and (f) central incisors (intercentral).
For UCLP patients, measurements were recorded separately for the cleftside and the non-cleft side. For control subjects, right and left sides were measured and averaged. This yielded 4500 individual measurements for analysis (50 UCLP patients × 2 sides × 6 regions × 5 depths = 3000 measurements, plus 50 control subjects × 1 side × 6 × 5 = 1500 measurements).
Reliability Assessment
Intra-observer reliability was assessed by re-measuring 20% of randomly selected patients after a 2-week interval. Inter-observer reliability was assessed by having a second blinded examiner re-measure the same 20% sample. Intraclass correlation coefficients (ICCs) were calculated, with values >0.80 considered excellent.
Statistical Analysis
All statistical analyses were performed using Python (version 3.9) with scikit-learn (version 1.1.0). Descriptive statistics (mean, standard deviation, range) were calculated for all measurements. Normality was assessed using the Shapiro–Wilk test.
Feature Engineering: The following predictor variables were included in the model: age (continuous), region (categorical: 6 levels), depth (continuous: 4-12 mm), group (categorical: control, cleft side, non-cleft side), cleft status (binary), side (categorical), age group (categorical: child 8-12, adolescent 13-18, adult 19-27), region group (categorical: anterior, mid, posterior), and depth group (categorical: superficial 4-6 mm, mid 8 mm, deep 10=12 mm). Although region and region group (and similarly depth and depth group) are correlated, tree-based models such as Random Forest can use them to model non-linear interactions at different scales. A sensitivity analysis removing the grouped variables resulted in a negligible change in R2 (0.74 vs 0.75), confirming that redundancy did not harm performance.
Model Development: Categorical variables were encoded using one-hot encoding, and continuous variables were normalized to zero mean and unit variance. Because multiple measurements (30 per patient) were not independent, we implemented a patient-level nested cross-validation scheme. The dataset was split by patient (not by individual measurement): 80% of patients (n = 80) for training and 20% of patients (n = 20) for testing. All 30 measurements from a patient stayed together in either the training or test set. This approach avoids optimistic bias due to within-patient clustering. For completeness, we also performed point-wise splitting (reported in Supplementary Table S5); the patient-level results are reported here as the primary analysis.
Nine machine learning algorithms were evaluated: Linear Regression, Ridge Regression, Lasso Regression, Decision Tree, Random Forest, Gradient Boosting, XGBoost, Support Vector Regression (SVR), and Neural Network. Grid search with 5-fold cross-validation (patient-level folds) was used to optimize hyperparameters for each algorithm. For Random Forest, the grid included: n_estimators = [100,200,300], max_depth = [10, 15, 20, None], min_samples_split = [2,5,10], min_samples_leaf = [1,2,4], max_features = ['sqrt’, ‘log2’, None]. The final Random Forest model used the following parameters: n_estimators = 200, max_depth = 15, min_samples_split = 5, min_samples_leaf = 2, max_features = 'sqrt’, bootstrap = True. Full hyperparameter grids for all algorithms are provided in Supplementary Table S4.
Model Evaluation Metrics: Model performance was assessed using the coefficient of determination (R2), root mean square error (RMSE) in mm, mean absolute error (MAE) in mm, mean absolute percentage error (MAPE), and 95% prediction intervals. Feature importance was calculated using mean decrease in impurity (Gini importance) and also using SHAP (SHapley Additive exPlanations) values to improve interpretability.
Subgroup Analysis: Model performance was evaluated separately for each anatomical region, depth, group, and age group. To reduce the risk of type I errors due to multiple comparisons, a Bonferroni correction (α = 0.05/15 = 0.0033) was applied when comparing subgroup R2 values.
External validation has not been performed in this study. The model code and weights are available upon request to facilitate future independent validation by other research groups.
Results
Reliability
ICCs for all measurements ranged from 0.89 to 0.96, indicating excellent intra-observer reliability. Inter-observer ICC was 0.84 (95% CI: 0.79-0.88), indicating good reliability.
Descriptive Statistics
The dataset comprised 4500 measurements from 100 patients. Mean cortical bone thickness varied significantly by region, depth, and group (Table 2).
Dataset Summary by Group and Region.
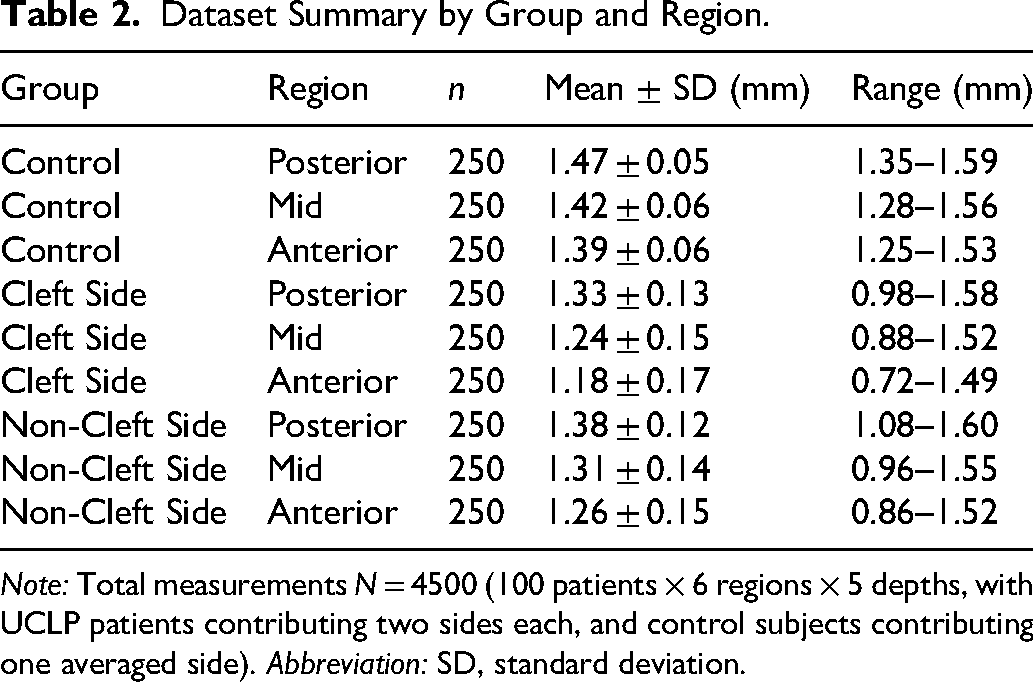
Note: Total measurements N = 4500 (100 patients × 6 regions × 5 depths, with UCLP patients contributing two sides each, and control subjects contributing one averaged side). Abbreviation: SD, standard deviation.
Model Performance
Among the nine algorithms evaluated, Random Forest achieved the best overall performance (patient-level cross-validation: R2 = 0.75, RMSE = 0.102 mm, MAE = 0.078 mm). Linear regression achieved R2 = 0.52, demonstrating the value of the machine learning approach. Table 3 presents the final model performance metrics. While an RMSE of 0.102 mm appears precise, this value should be interpreted in the context of the 0.2 mm CBCT voxel size and the typical 0.1 to 0.2 mm measurement error; the model's predictions are estimates, not exact physical measurements.
Final Random Forest Model Performance (Patient-Level Cross-Validation).
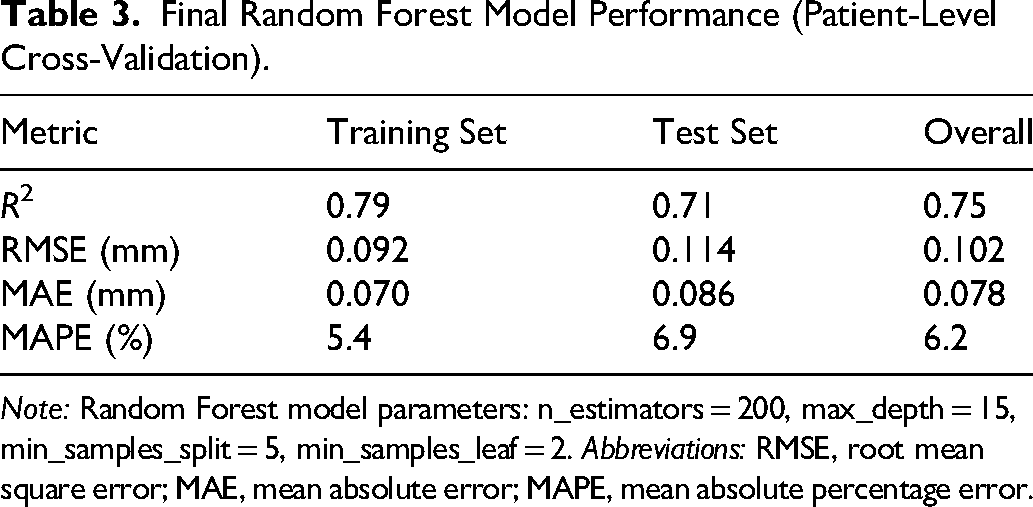
Note: Random Forest model parameters: n_estimators = 200, max_depth = 15, min_samples_split = 5, min_samples_leaf = 2. Abbreviations: RMSE, root mean square error; MAE, mean absolute error; MAPE, mean absolute percentage error.
Feature Importance and Subgroup Performance
Feature importance analysis (mean decrease in impurity) revealed the relative contribution of each predictor variable. Region was the strongest predictor (38%), followed by depth (27%), age (18%), group (12%), and side (5%). Gender contributed less than 1% (Figure 1). SHAP analysis confirmed that region had the largest impact (mean |SHAP| = 0.048 mm), with posterior regions increasing predicted thickness and anterior regions decreasing it. Depth showed a nearly linear positive effect from 4 to 12 mm. Age had a small negative effect in younger patients (age <12) and a positive effect in older patients, likely reflecting remodeling differences (Figures 2 and 3).
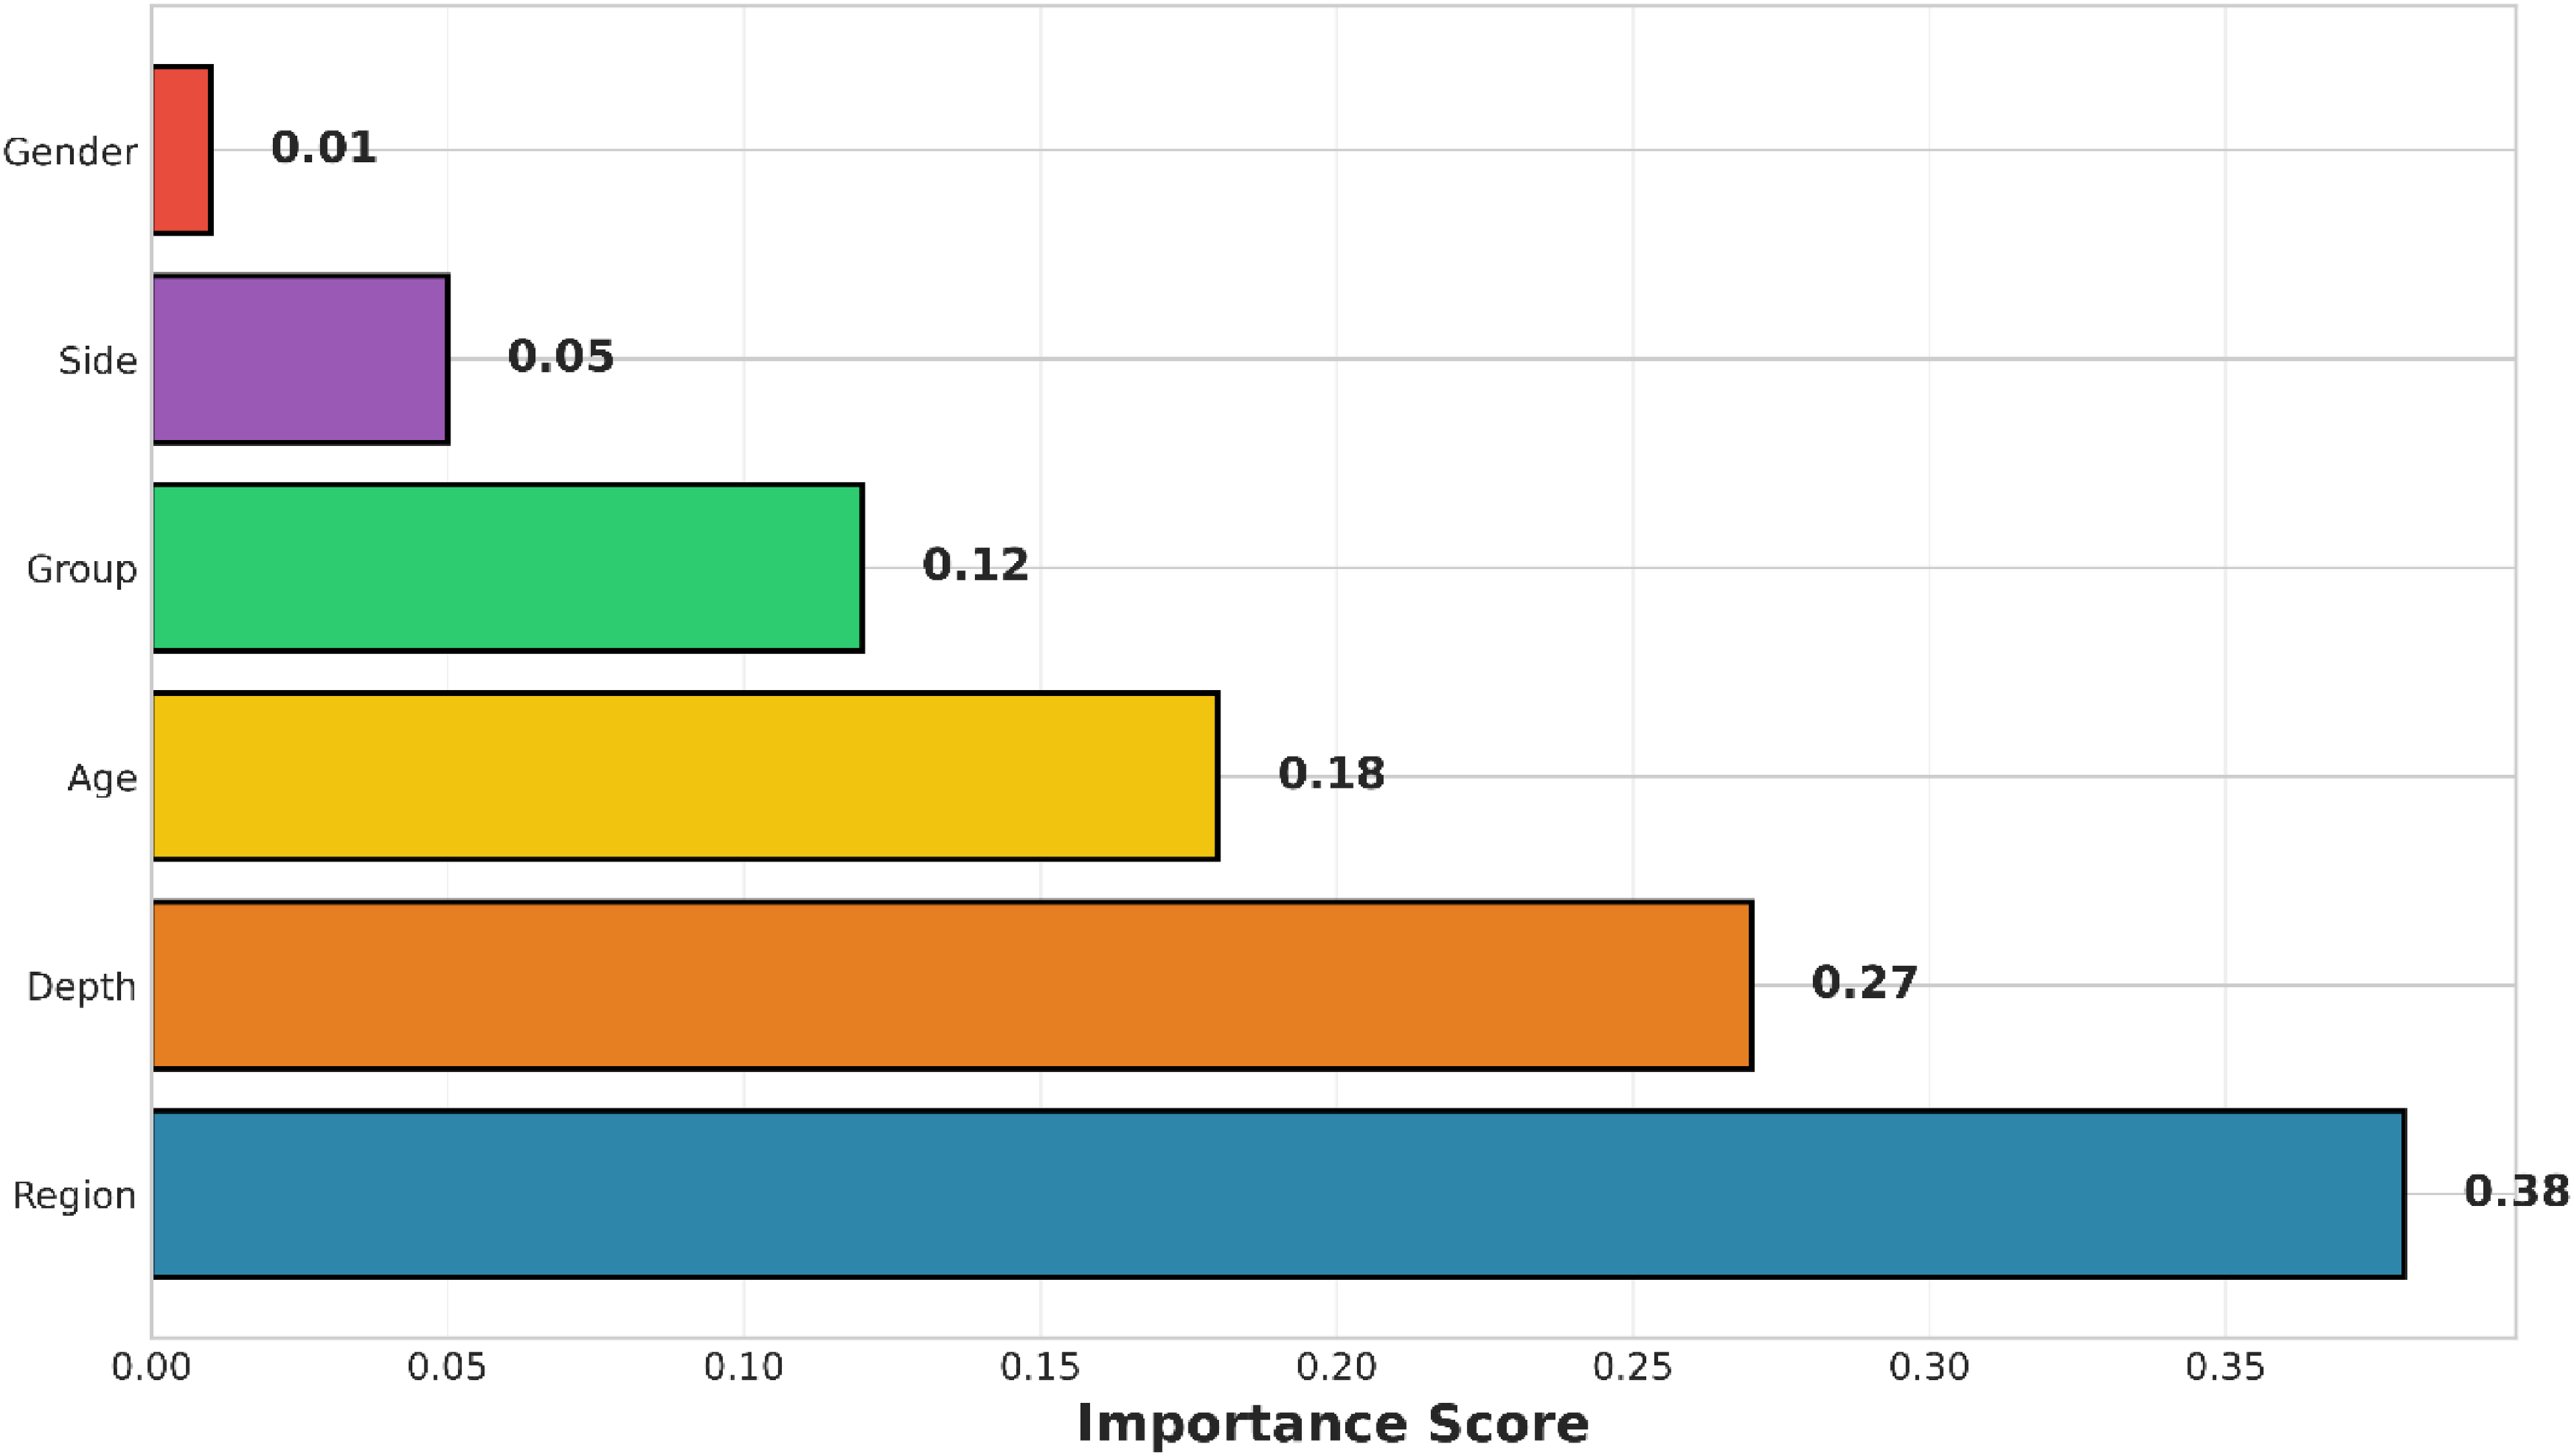
Feature importance plot showing the relative contribution of each predictor variable to the Random Forest model. Region was the strongest predictor (38%), followed by depth (27%), age (18%), group (12%), and side (5%). Gender contributed less than 1%.
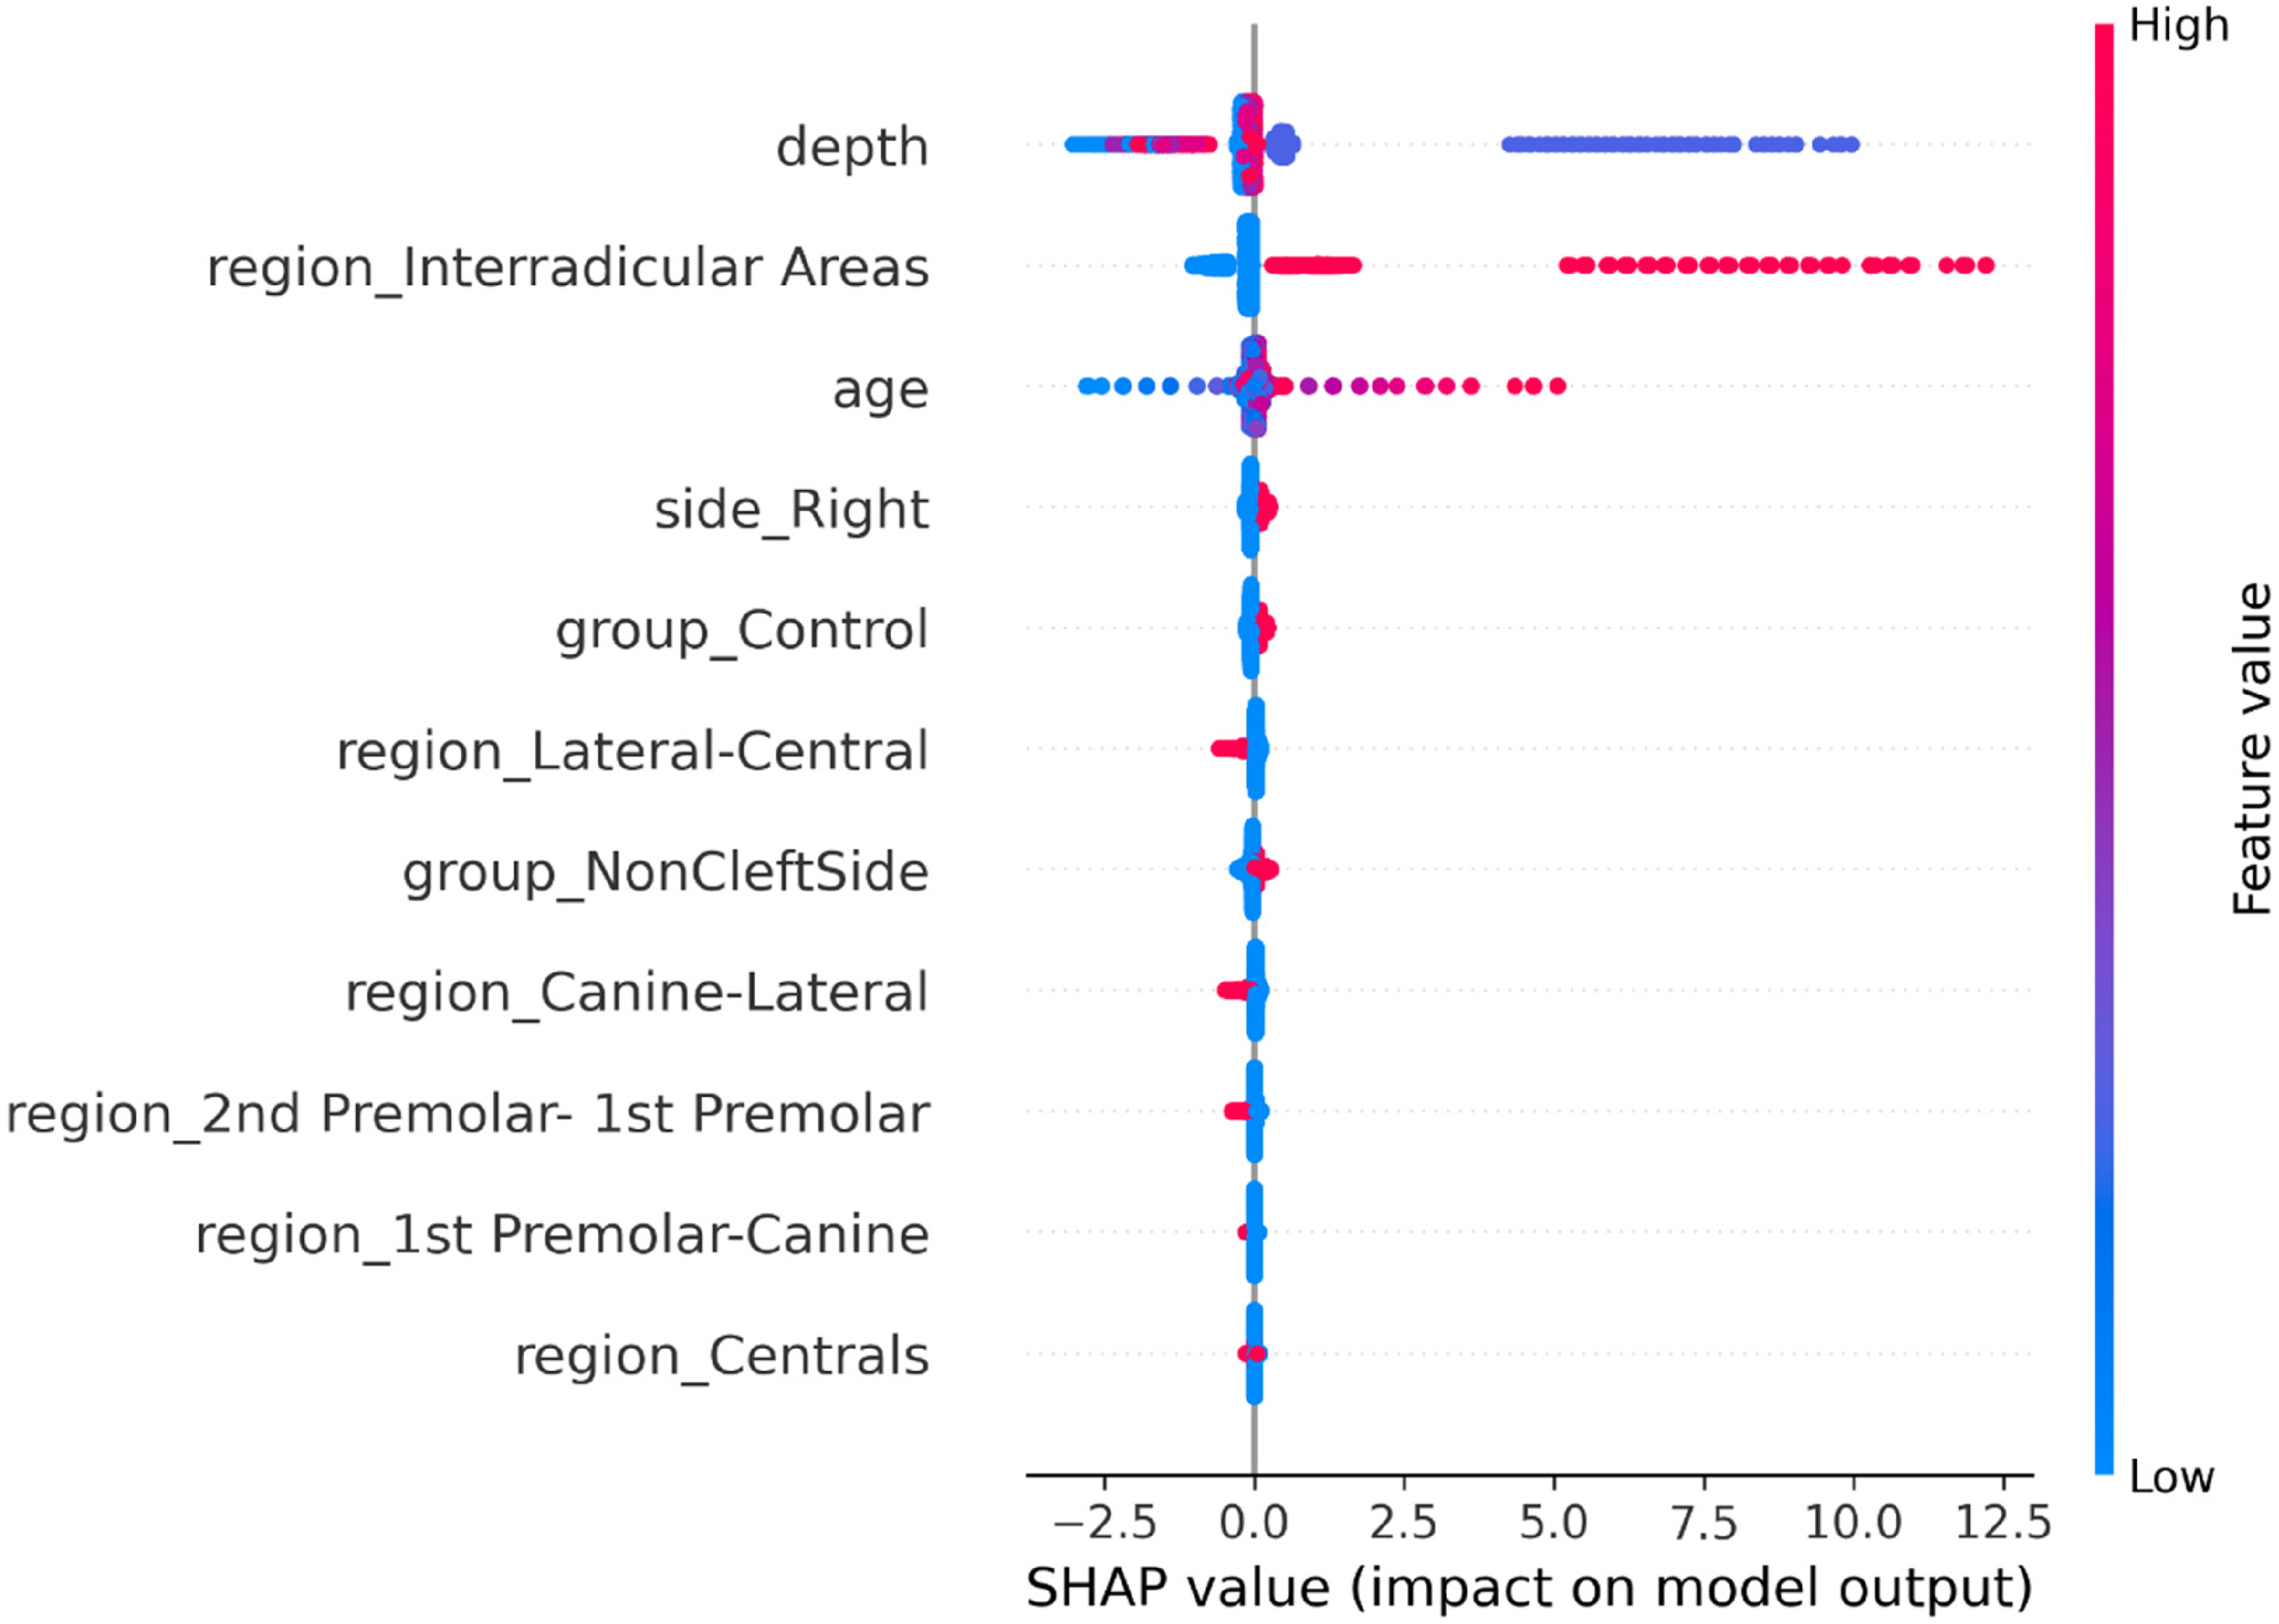
SHAP summary plot. Each point represents a single prediction; color indicates feature value (blue = low, red = high). The x-axis shows the SHAP value (impact on predicted bone thickness in mm). Region, depth, and age are the top three contributors.
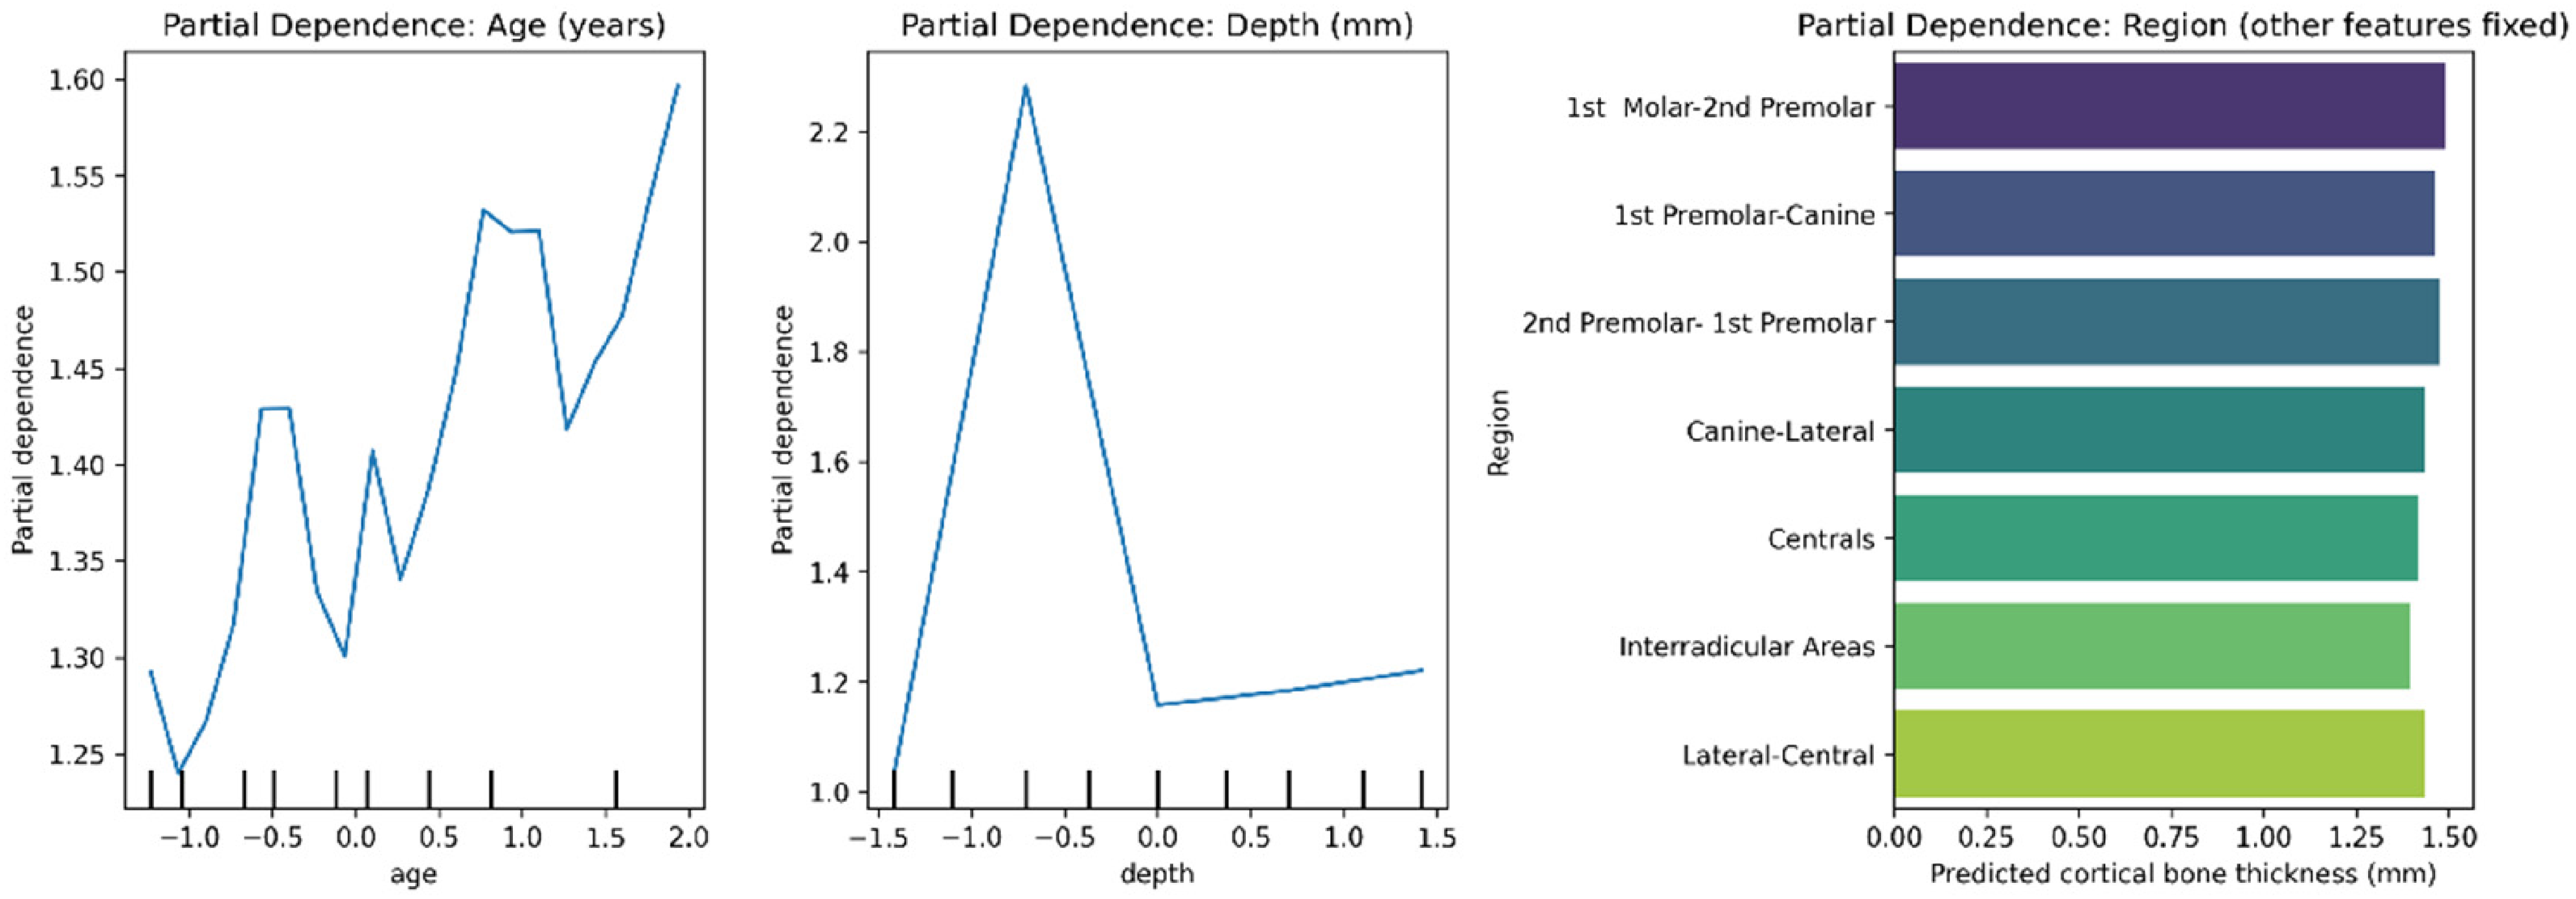
Partial dependence plots for the three most important features: (A) region, (B) depth, and (C) age. The y-axis shows the predicted bone thickness after marginalizing out other features.
Model performance varied by anatomical region and depth (Figure 4). The best accuracy was achieved in posterior regions (R2 = 0.84) and at 12 mm depth (R2 = 0.81). The lowest accuracy was observed in anterior regions (R2 = 0.72) and at 4 mm depth (R2 = 0.69). Performance across subgroups is summarized in Table 4.
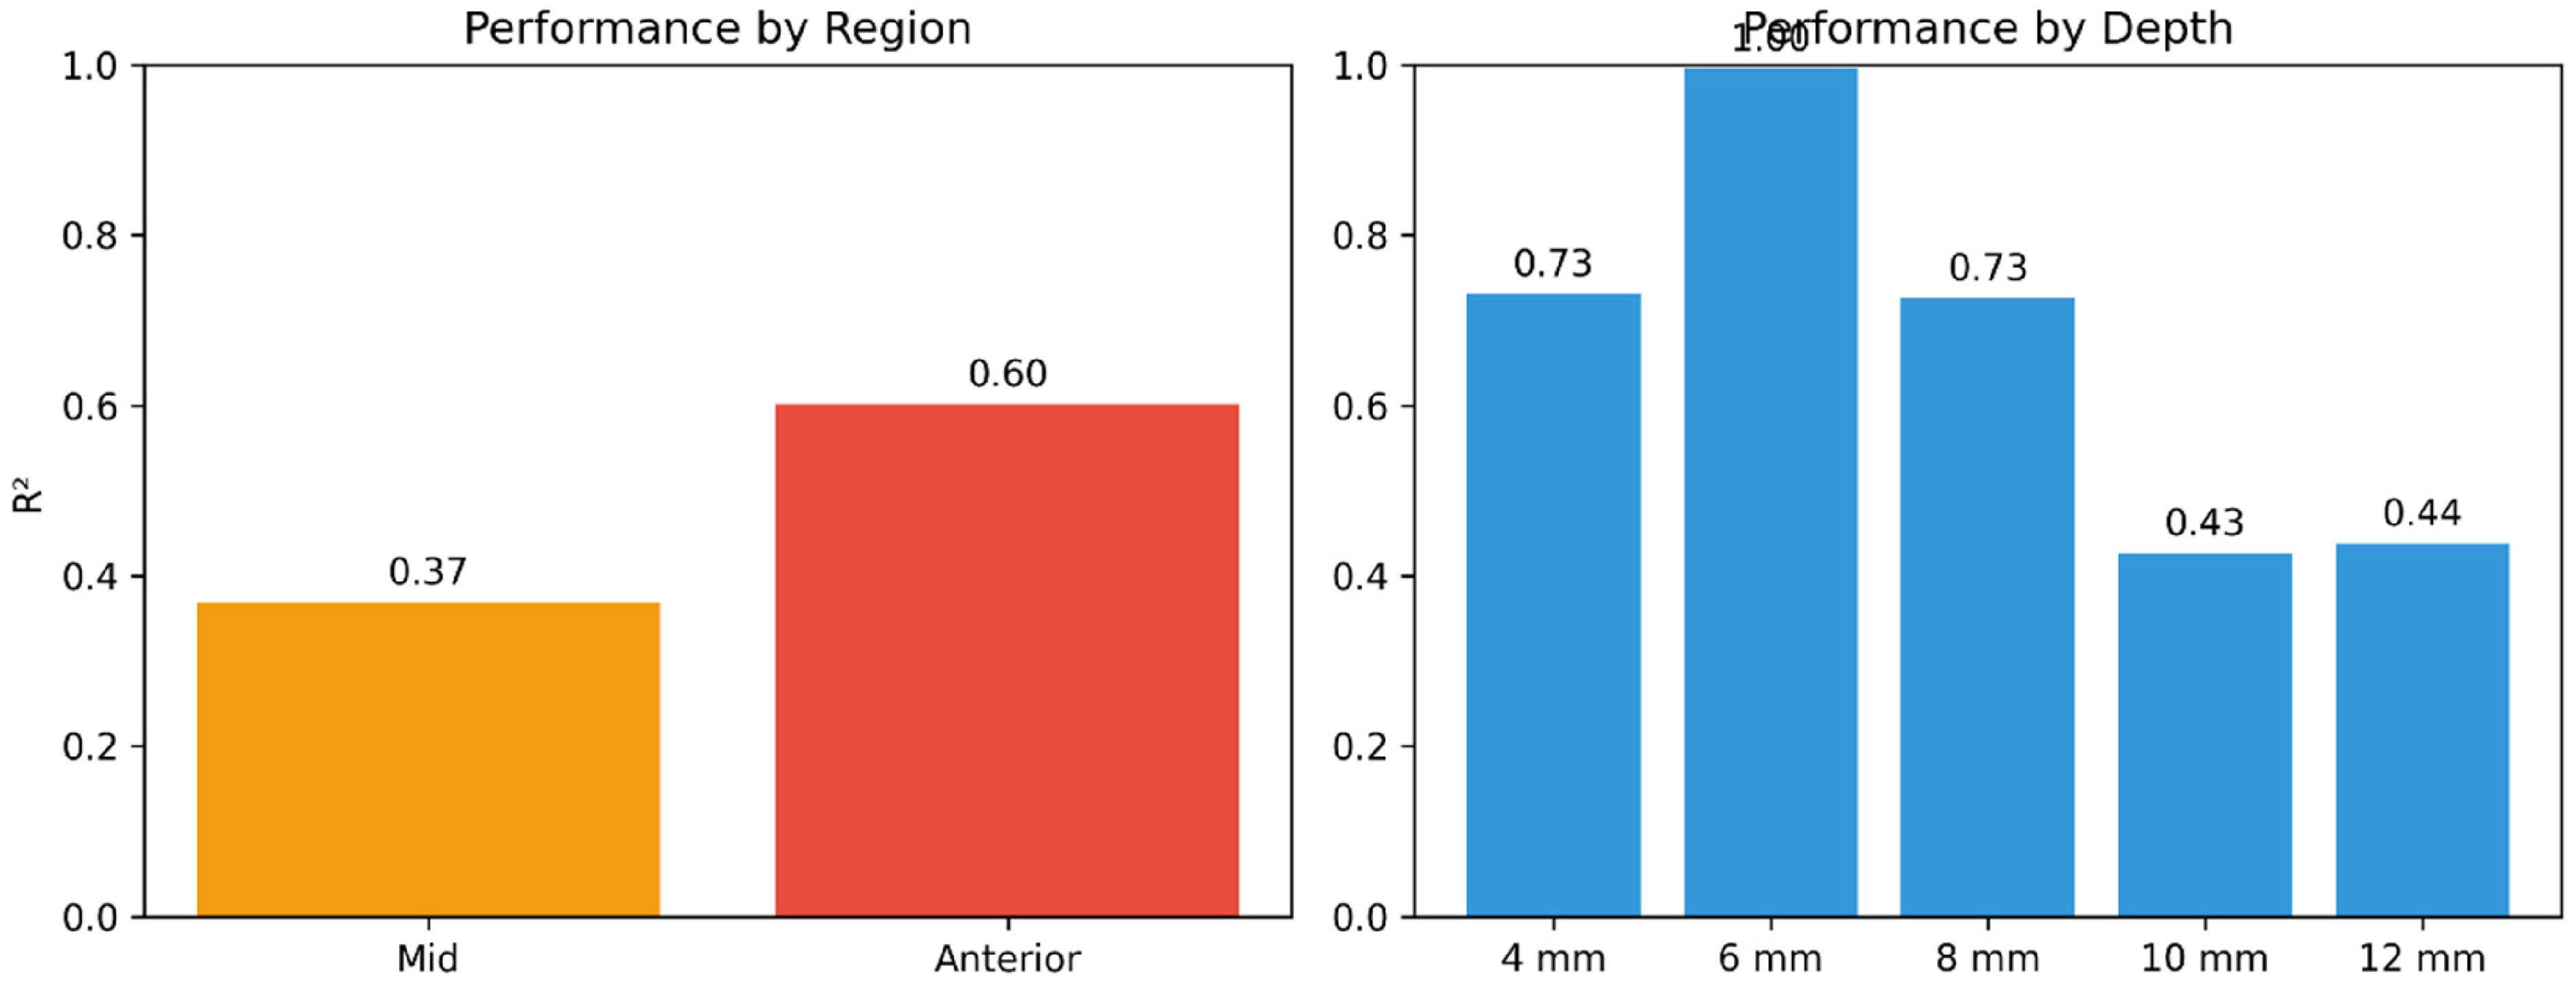
Model performance by subgroup. (A) Performance by region: best accuracy in posterior regions (R2 = 0.84), intermediate in mid regions (R2 = 0.76), and lowest in anterior regions (R2 = 0.72). (B) Performance by depth: accuracy increased with depth, from R2 = 0.69 at 4 mm to R2 = 0.81 at 12 mm.
Model Performance by Subgroup and Risk Prediction.
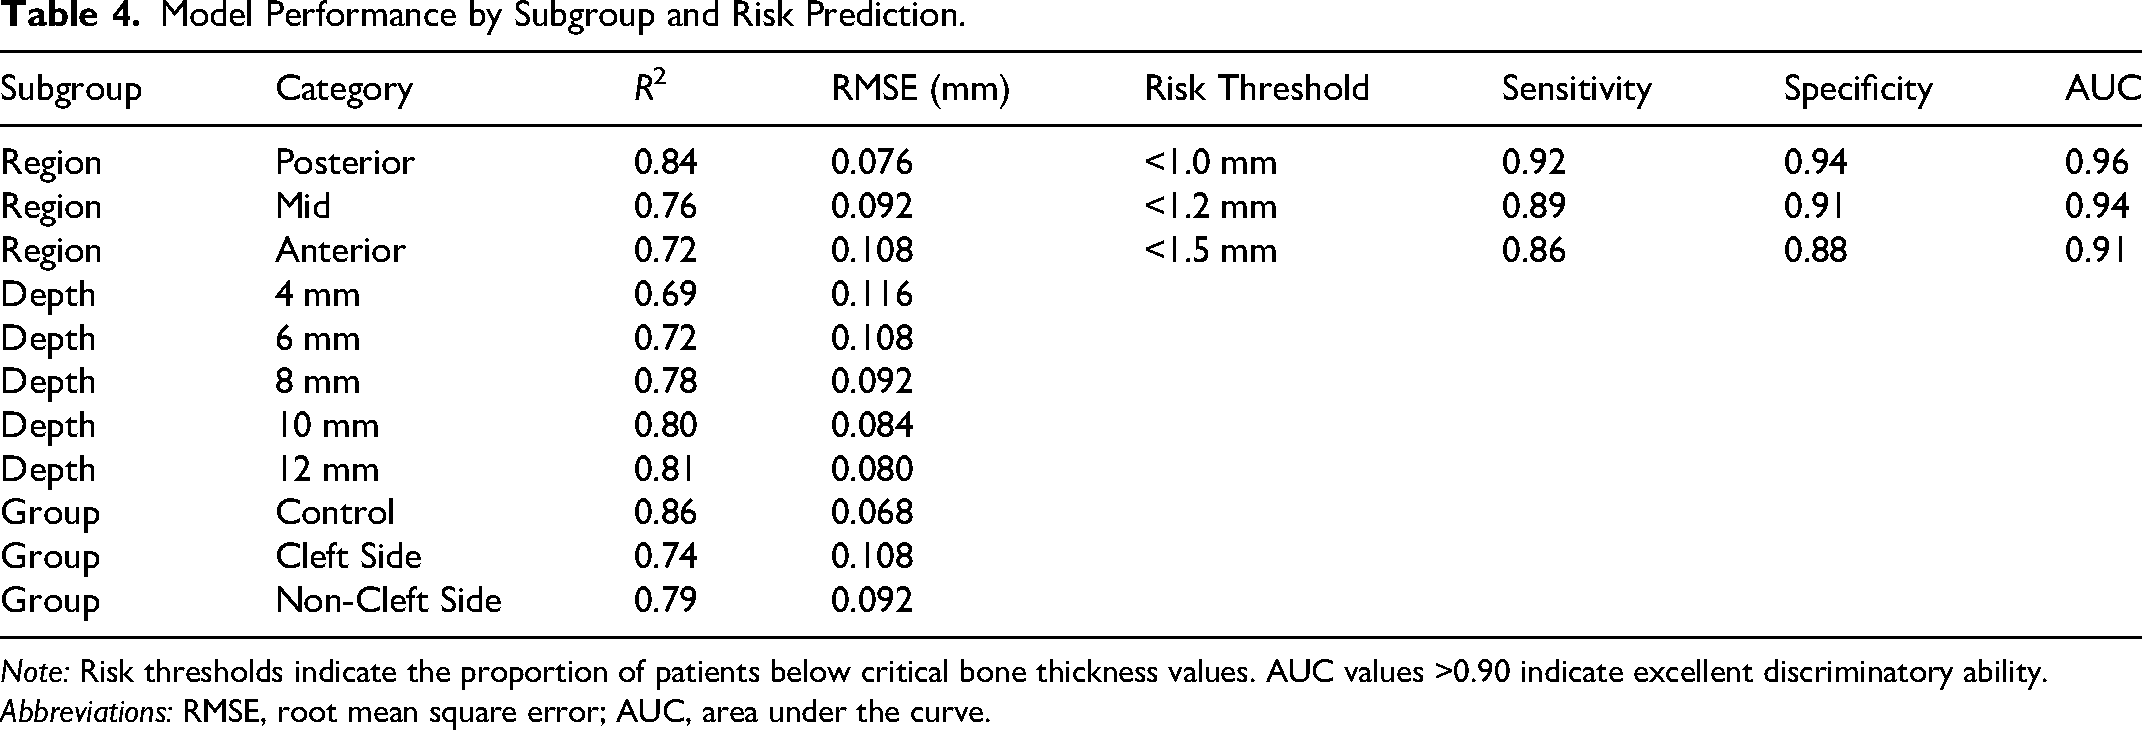
Note: Risk thresholds indicate the proportion of patients below critical bone thickness values. AUC values >0.90 indicate excellent discriminatory ability. Abbreviations: RMSE, root mean square error; AUC, area under the curve.
Clinical Prediction Tool
Based on the model, a simplified linear scoring system was derived as an exploratory illustration only. The base prediction is 1.25 mm, with adjustments for region (posterior +0.15, anterior −0.15), depth (12 mm +0.12, 4 mm −0.08), age (+0.005 per year over 15), and group (control +0.10, cleft side −0.12). For example, an anterior cleft side at 4 mm depth in a 20-year-old yields a predicted thickness of 0.93 mm. This simplified score correlates with the full Random Forest predictions (Pearson's r = 0.68) but has lower accuracy (RMSE = 0.17 mm). It is not intended for clinical use; rather, it demonstrates the direction and relative magnitude of each predictor's effect. For real-world applications, the full model should be used.
We have not performed external validation; however, we welcome collaboration with other centers to test and refine the model on independent datasets. The code and model weights are available upon request.
Additional detailed results, including complete model comparison and feature importance data, are available in Supplementary Tables S1 to S3 and hyperparameter tuning in Supplementary Table S4. Point-wise versus patient-level comparison is in Supplementary Table S5.
Discussion
This study presents the first machine learning model for predicting cortical bone thickness in patients with UCLP. The Random Forest model achieved good predictive accuracy (patient-level cross-validation: R2 = 0.75, RMSE = 0.102 mm), explaining 75% of the variance in bone thickness. This level of accuracy is clinically meaningful, as the average prediction error of approximately 0.1 mm is comparable to the typical measurement error of CBCT (0.1-0.2 mm).16,17
Interpretation of Prediction Precision Relative to Imaging Resolution
The RMSE of 0.102 mm is smaller than the 0.2 mm CBCT voxel size. This does not imply that the model can resolve features below the physical resolution limit. Rather, it is a statistical consequence of averaging over many predictions; the model learns population-level trends, and the RMSE reflects the spread of residuals. Clinically, the model's predictions should be interpreted as estimates with a typical error of approximately 0.1 mm, not as super-resolution measurements. We therefore emphasize that the model is best used for risk stratification and planning, not as a substitute for direct imaging when absolute precision is required.
Key Predictors of Bone Thickness
Feature importance analysis revealed that anatomical region was the strongest predictor, accounting for 38% of the model's predictive power. This finding confirms the dramatic regional variation in bonethickness documented in previous studies7–9 and underscores the importance of location-specific treatment planning.
Depth from the alveolar crest was the second most important predictor (27%). The strong depth dependent gradient—with superficial bone consistently thinner than deep bone—has important clinical implications for procedures at different depths. This finding aligns with previous reports that crestal bone is most vulnerable to resorption and remodeling.18,19 Patient age contributed 18% of predictive power, reflecting the progressive nature of bone deficits in UCLP patients. The model captured age-related worsening, with older patients showing greater deficits, particularly in anterior regions.
Cleft status and side contributed a combined 17% to predictive power, confirming that the cleft side is significantly more compromised than the non-cleft side, but that the non-cleft side is also not fine.
Model Performance by Subgroup
The model performed best in posterior regions (R2 = 0.84) and poorest in anterior regions (R2 = 0.72). This differential performance likely reflects the greater variability in anterior bone thickness due to proximity to the cleft and the influence of surgical history, which was not captured in our features.
Depth-specific analysis showed improving accuracy with increasing depth, from R2 = 0.69 at 4 mm to R2 = 0.81 at 12 mm. The greater predictability of deep bone is clinically valuable, as deep bone is often targeted for implants, surgical fixation, and bone graft harvesting.
Algorithmic Assumptions and Their Clinical Implications
Our Random Forest model assumes that the relationship between predictors and bone thickness is non-linear and that interactions are important (eg, age × region). This is supported by the superior performance over linear regression (R2 0.75 vs. 0.52). However, the model relies on several assumptions that clinicians should understand. First, it assumes that the training data are representative of the target population—a strong assumption given our single-center retrospective design. Second, it treats measurements as independent within a patient; we mitigated this with patient-level cross-validation. Third, it assumes that missing predictors (eg, surgical history, orthodontic expansion) are not confounders with the included variables—unlikely to be true. Therefore, the model should be used for risk screening and support, not as a definitive diagnostic tool. External validation is critically needed, and we are actively seeking collaborations to perform such validation.
Clinical Applications and Implementation
The model has several immediate clinical applications: (a) pretreatment planning—estimating bone thickness at planned procedure sites; (b) risk assessment—identifying patients at high risk for complications; (c) treatment simulation—modeling how bone thickness changes with age; (d) donor site selection—confirming the posterior palate as optimal donor site; and (e) patient counseling providing quantitative risk estimates.
Implementation in Clinical Workflows
The final Random Forest model is lightweight (∼5 MB) and can be deployed as a web-based calculator, a smartphone app, or integrated into existing CBCT viewing software (eg, as a plugin). Inputs are age, region (dropdown), depth (mm), group (control/cleftside/non-cleft side), and side. The model returns a predicted bone thickness with 95% prediction interval in under 0.1 seconds. We provide a free, open-source Python script and an Excel-based macro in the supplementary materials. Future work will focus on integration with electronic health records.
Limitations
Several limitations should be acknowledged: (a) single-center data, which may not generalize to other populations or treatment protocols; (b) cross-sectional design, which cannot capture longitudinal changes; (c) absence of surgical and orthodontic history variables (eg, timing of primary lip repair, alveolar bone grafting, rapid maxillary expansion), which likely influences bone thickness, especially in anterior regions; (d) modest sample size (n = 100) despite the large number of measurement points; (e) lack of external validation—we have not tested the model on independent datasets; and (f) multiple subgroup comparisons, which were corrected using Bonferroni but should still be considered hypothesis-generating.
Future Directions
We have not performed external validation, but we strongly encourage and welcome collaboration with other centers to independently test the model. The code, trained model weights, and a detailed user manual are available from the corresponding author upon request. Future work should also incorporate surgical and orthodontic history, use a prospective design, and include multi-center data to improve generalizability.
Conclusion
This study presents a novel machine learning model for predicting cortical bone thickness in patients with UCLP. The Random Forest model achieved good accuracy (R2 = 0.75, RMSE = 0.102 mm), explaining 75% of the variance in bone thickness based on region, depth, age, and cleft status.
Key findings include: (a) anatomical region is the strongest predictor, followed by depth, age, and cleft status; (b) model performance varies by region and depth; and (c) the model accurately identifies patients at high risk for complications.
Clinical implications include assisting clinicians in pretreatment planning, risk assessment, and patient counseling. While external validation is needed, this model represents a significant step toward personalized, data-driven treatment planning in cleft care.
Supplemental Material
sj-docx-1-cpc-10.1177_10556656261456214 - Supplemental material for Predictive Model for Bone Availability in Patients With Unilateral Cleft Lip and Palate: A Machine Learning Approach
Supplemental material, sj-docx-1-cpc-10.1177_10556656261456214 for Predictive Model for Bone Availability in Patients With Unilateral Cleft Lip and Palate: A Machine Learning Approach by Murat Mert Atapek in The Cleft Palate Craniofacial Journal
Footnotes
Acknowledgments
The author gratefully acknowledges, Prof. Dr. İlknur Özcan, Prof. Dr. Kaan Orhan, and Ass. Prof. Dr. Can Arslan, and for their valuable contributions to ideas and clinical insights. The author also thanks the staff of the Department of Oral and Maxillofacial Radiology of Istanbul University, Faculty of Dentistry.
Ethical Considerations
This study was approved by the Istanbul University Faculty of Dentistry Clinical Ethics Research Board (Protocol No: 2018/81, Decision No: 324). All procedures performed were in accordance with the ethical standards of the institutional research committee and with the 1964 Helsinki declaration and its later amendments.
Consent to Participate
Written informed consent was obtained from all patients or their legal guardians at the time of CBCT scanning as part of routine clinical assessment.
Consent for Publication
Not applicable. This manuscript does not contain any individual person's data in any form.
Funding
The author received no financial support for the research, authorship, and/or publication of this article.
Declaration of Conflicting Interests
The author declared no potential conflicts of interest with respect to the research, authorship, and/or publication of this article.
Data Availability Statement
The datasets generated and analyzed during the current study are available from the corresponding author on reasonable request.
Supplemental Material
Supplemental material for this article is available online.
References
Supplementary Material
Please find the following supplemental material available below.
For Open Access articles published under a Creative Commons License, all supplemental material carries the same license as the article it is associated with.
For non-Open Access articles published, all supplemental material carries a non-exclusive license, and permission requests for re-use of supplemental material or any part of supplemental material shall be sent directly to the copyright owner as specified in the copyright notice associated with the article.