



Abstract
Practitioners dealing with domestic abuse often claim that the problem escalates over time in both seriousness and frequency. We tested those claims on 36,000 police records of domestic abuse between 2009 and 2014 reported to Suffolk Constabulary in the east of England. Using the Cambridge Crime Harm Index as the measure of harm severity, we found no escalation in the majority of cases; 76% of all unique victim and offender units (dyads) had zero repeat calls. Among the cohort of 727 dyads who called police 5 or more times, there was no evidence for statistically significant escalating harm severity, but some evidence of increasing frequency. Less than 2% of dyads accounted for 80% of all domestic abuse harm, but in over half of these highest harm dyads, there had been no prior contact with police regarding domestic abuse. These findings suggest the need for more engagement of nonpolice agencies in predicting serious harm.
Keywords
Escalation of Severity and Frequency in Domestic Abuse
Despite the large body of research on domestic abuse, too little evidence is available about fundamental patterns of violence within couples. Until very recently, for example, Police Chief Officers in the United Kingdom told the public that victims of domestic abuse suffered 34 episodes prior to reporting to police. This figure was then exposed as lacking any credible evidence for contemporary cases of domestic abuse in the United Kingdom (Strang, Neyroud, & Sherman, 2014). Similarly, unsupported assertions have long been made about “escalation”—the notion that over the life of a domestic relationship, the severity and frequency of any violent events will increase with each further report. According to Pagelow (1981), escalation is something on which researchers can agree, yet a recent literature review found no consistent evidence to support that claim (Bland, 2015).
Indeed, in England and Wales, police and other organizations have put escalation at the center of their efforts to assess risk of harm in future cases. All English and Welsh forces are required to complete a risk assessment form with the victim even if no crime has been proven. That risk assessment (known as “DASH”), which to varying degrees is later reviewed by a specialist, asks specific questions designed to predict escalation in severity and frequency. Yet many questions remain about the extent of the empirical evidence that supports the validity or reliability of the DASH predictions.
This article aims to add to the body of research on escalation and the patterns of harm in domestic abuse cases. We hope it will help to build an evidence-based strategy for targeting different patterns of domestic abuse for different types of interventions at different levels of cost. The research considers three key questions about the population of over 36,000 domestic abuse events that were reported to Suffolk Constabulary between January 1, 2009 and March 31, 2014. First, we address the question of how much, if any, escalation in the severity of harm occurs in repeat cases. Second, we examine whether repeat cases become more likely or frequent as cases become more chronic, independent of seriousness. Third, we examine individual dyads (couples of one offender and one victim as distinct, unique units) for the distribution and concentration of serious harm for evidence of a “power few” (Sherman, 2007). We find, in summary, little evidence of escalation in severity, some evidence of increasing frequency among the most chronic cases, and an enormous concentration (80%) of harm in less than 2% of the dyads.
Measuring Severity of Crime Harm
Research into escalation of severity depends on both conceptualization and measurement of that severity. Several approaches to these tasks have been used and are currently being developed. Perhaps the most widely used measure in survey research is the Conflict Tactics Scale (CTS), a three-tiered index of violence with multiple levels in each tier sorted in a hierarchy. CTS was developed by Muray Straus in 1979 as a specific tool for measuring domestic abuse severity. Levels were established from face-to-face interviews by classifying the “tactics” respondents have used in family disputes. The three indices measure reasoning, verbal aggression, and physical aggression and the system offers a number of potential analytic options as described by Chambers-McClellan (2002) in refs it says Chambers-McClellan. Other scholars have focused on the concept of harm as a measurement of severity. Sellin and Wolfgang (1964) were among the first scholars to attempt to develop a different system. They surveyed a range of groups including students, police officers, judges and community members, asking them to rank 141 crimes on a scale of 1 (least serious) to 11 (most serious). Their methodology has been subject to considerable criticism of its sampling methodology but the work found a strong correlation between the rankings of each group. Wolfgang, Figlio, Tracy, and Singer (1985) took this methodology further, opening up the ranking questions to 60,000 survey respondents. They amended the scoring system to a weighted range of 0.2–72.1 and again found general levels of agreement on severity rankings. All these approaches, however, depend on subjective views of various audiences. None of them employs an official consensus established by democratic governments.
In order to provide an accessible tool for police to classify the severity of harm from criminal events, Sherman (2007, 2011, 2013) proposed multiplying each crime type by the number of days of imprisonment each could attract under sentencing guidelines. Sherman, Neyroud, and Neyroud (2014) applied this principle to England and Wales to create the Cambridge Crime Harm Index (CHI). Sherman et al. (2014) challenge the notion that a single count of crime is a strong measure of harm as misleading because all crimes are not equal. As a scale for measuring harm, the Cambridge CHI is robust, but to date no study of domestic abuse has utilised it as the primary instrument for the measurement of severity. Equally important, its external validity for police agencies not based in England and Wales offers a useful structure that can be applied with any local sentencing guidelines or statutory sentences.
Definitions
This section defines key terms for the data and methods of the study.
Domestic Abuse
At present, domestic abuse is not a crime classification in its own right in England and Wales; it can take any form of crime. As a consequence, this study will consider more types of crime than just violence. Where a vehicle is stolen or a house burgled as part of a domestic dispute, those crimes are included in this analysis. As an English police agency, Suffolk Constabulary works to the national definition of domestic abuse and audits is records to test for compliance with that definition
Data Sources
The data for this analysis consist of a large sample of 36,000 police records of domestic abuse between 2009 and 2014 recorded by Suffolk Constabulary in the east of England. Suffolk Constabulary records crime on a database known as Crime Information System (CIS). Emergency and nonemergency calls are recorded on a separate system. While it is the norm that only calls which are classified as crimes are entered onto both systems, in the case of domestic abuse every call is transferred to CIS. Crimes are referred to as crimes and calls that are not crimes are colloquially referred to as “domestic abuse non crimes.” This practice allows Suffolk Constabulary to utilise CIS to manage and record its risk assessment (DASH) scores. The product is highly beneficial for this research because it means a large amount of data pertaining to individual cases is held on one system and therefore in one format. Other agencies and researchers seeking to replicate this research may need to link data from multiple systems. It is advantageous to the research that the structure of data for crimes and noncrimes is recorded in the same format with victims and suspects identified even where no crime has been committed. To be clear, this does not mean individuals are being incorrectly criminalised by Suffolk Constabulary; rather the force consciously assigns roles of “victim” and “suspect” based on the circumstances of the call.
As with all English & Welsh forces, crime in Suffolk is subject to audit against National Crime Recording Standard principles. The “domestic” nature of offenses is determined either by the recording parties in the contact and control room or by the investigating officer. A “flag” is marked on CIS to denote a crime as domestic. If this is falsely marked in the positive, it is declassified by a “crime allocator” or by domestic abuse specialists in the Central Tasking and Referral Unit. The latter also perform the role of identifying domestic cases that are falsely negative.
The original data extract from CIS provided 143 variables pertaining to items like crime classification, date and time, location of event, detection status, victim and offender, and risk assessment. Variables were supplemented in the data cleaning and analysis phases of this research and the final number of variables is above 160.
As is common with many police data sets, the pool of domestic abuse data extracted from Suffolk Constabulary’s CIS system had a wide range of issues and limitations associated to it. For each record of data (n = 36,742) a new variable was created concatenating the victim surname and date of birth. This was the basis of a victim URN but remained subject to errors, primarily in spelling or incorrect dates of birth. Further cleaning was required to match different victim “URNs” which are in fact related to the same victim. To achieve this, each of the victim “URNs” was applied to a formula that created a code based on the letters that appeared in the victim forename and surname and the district and sector in which the event took place (e.g., John Smith, victim of crime in Newmarket, Forest Heath would generate a code of HIJMNOSTForestHeathNE). The component parts of this code are the letters which appear in the name, in ascending alphabetical order, the district in which the event took place (Forest Heath) and the sector in that district in which the event took place (in this case NE stands for Newmarket). These codes were then sorted in ascending order and used to aid a visual matching exercise of the database. Where codes matched the episodes were assigned a matching victim “URN” (based on the first URN that appeared in the sequence).
There were two inherent flaws in this process. First, the coding system assumes that even when names are mistyped, they use the same letters. Second, it assumes that victims’ offenses take place in the same locality, which of course, they may not. However, both these flaws were partially mitigated by the manual nature of the matching exercise, whereby the author visually examined each record and was able to identify where these flaws yielded errors. This was done in short batches of around 1,000 records over a period of about 2 months to reduce the chances of human error. It is important to underline that this process is not without its limitations, but it represents a methodical and meticulous attempt at defining unique victims.
Missing Data
Other data variables besides DASH were subject to missing data in various degrees as denoted by Table 1.
Summary of Missing Data Values in Suffolk Constabulary Domestic Abuse Data Set.
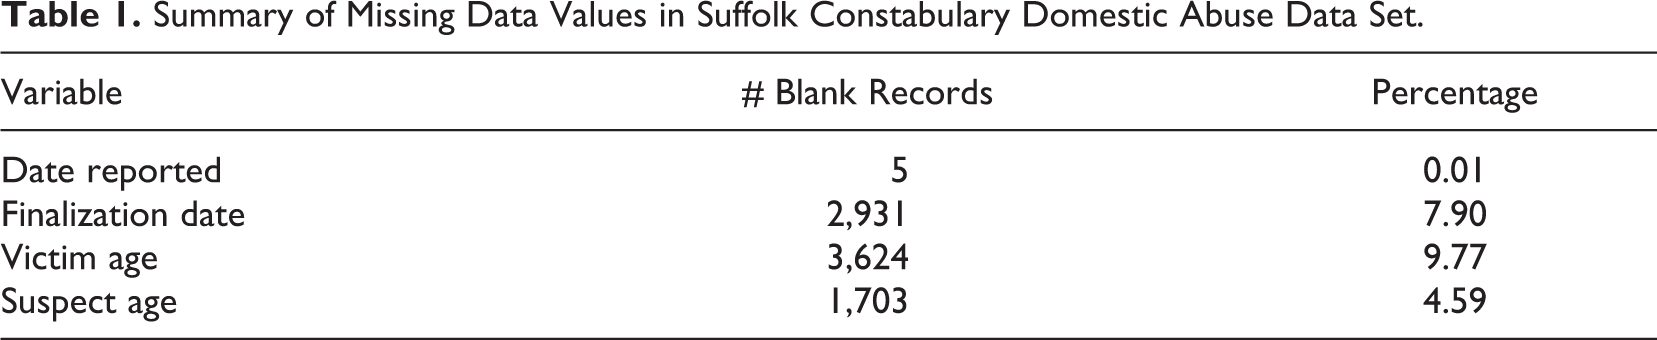
With respect to victim age, the proportion appears problematic to analyses. However, of the 3,624 records with this data missing, 37% were for victims who had at least one other event attributed to them and in the majority of those cases, the age variable was not missing in all of the other events. This meant that the actual percentage of events with missing victim age is somewhat lower than 9.77%.
Analytic Procedures
This section describes the analytical methods for three specific research questions.
What is the extent of repeat victimization?
The method of analysis to answer this question is a comparison of the counts of dyads, offenders, and victims at each level of events (one event in the data set, two events, three events, etc.). The analysis is run 3 times to establish to what extent victims and offenders move between dyads.
What is the conditional probability associated to repeat offending?
This analysis asks if you call × number of times, how likely is it that you will call again, and with what degree of likelihood.
Does severity increase with further events?
The instrument for measuring severity in this analysis is the Cambridge CHI. To achieve this, a new variable has been added to the data set and a LOOKUP formula applied to insert a CHI value based on the national classification of the event. The LOOKUP function identifies the relevant event classification in a cross-reference table which has been manually populated by the author based on the original work of Sherman et al. (2014) and further research conducted using UK Sentencing Guidelines (Sentencing Guidelines Council, 2008; Sentencing Council, 2011). The resultant lookup table contains CHI values for 119 offense types and a substitute value (0.1) assigned to “noncrimes.” Figure 1 shows a summarised break down of crime types within the dataset. The value 0.1 has been selected as a “noncrime” carries no sentence tariff or equivalent other than an investment of police time. As such, this is the lowest value possible in this version of CHI, but as it is more than 0 it will influence mean harm scores. To track the trajectory of harm, a dyad study group of cases meeting a higher repeat threshold was identified. Eligibility for this group was determined as a minimum of five events (crime or noncrime) in a period of 3 years commencing from the date of the first event in the data set. The 3-year period was determined to achieve consistency between the dyads. The number of events was set at five to enable an opportunity to see change over a range of data points. Again in this regard, this study goes further than many of its predecessors. The study group comprised of 727 dyads.
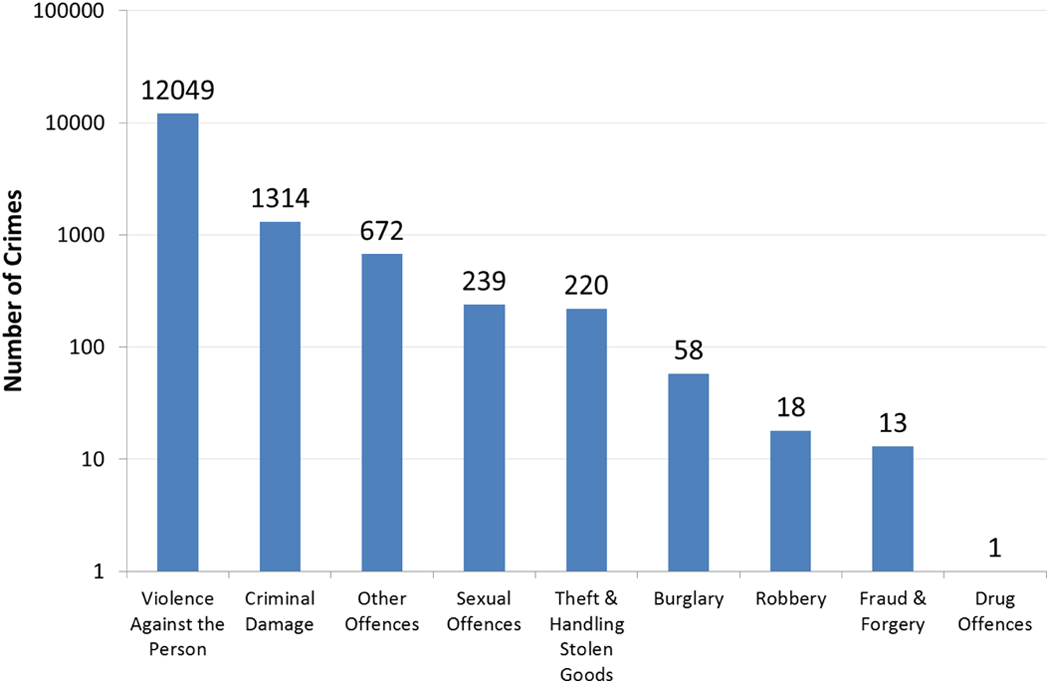
Numbers of crimes by classification (N = 14,584).
For each of these dyads, the CHI scores were mapped across each event in the sequence and the mean CHI score for each sequential event was then analyzed using analysis of variance (ANOVA) to test for significant variance. This analysis was repeated on four further cohorts derived from the eligible dyads to determine if significant change in severity occurred within the eligible group. These cohorts were (1) those dyads which were among those which caused the most cumulative harm, (2) those dyads where an arrest was made at first event, (3) those dyads which took place in an area classified among the highest quintile for deprivation, and (4) those dyads which had a gap of less than 60 days between the first and second event.
Does Frequency Increase with Further Events?
The other side of the escalation issue is frequency, defined here as the speed with which the next offense occurs after the last offense. A more precise name for this measure is intermittency, or the time between events. This research seeks to test the veracity of the claim that calls to police become more frequent with each passing call. As with the question concerning severity, ANOVA statistics were used to test a null hypothesis that there was no difference in the mean intermittency between any combination of events. These tests were run for the 727 dyads with five or more events in a 3-year period and two cohorts derived from this group. First, chronic high harm cases which featured with those dyads contributing to 80% of CHI scores in the whole data set. Second, those dyads in which events took place within the 20% most deprived wards in Suffolk. These cohorts were chosen to test if the null hypothesis was proven or disproven in the particular circumstances each cohort reflected.
The intermittency variable under scrutiny was the number of days that had elapsed between the reported date of each crime in the sequence. Using this variable does not control for the so-called historic reporting (where victims report days, weeks, and in some cases months and years after an event has happened), but it does reflect intermittency of reporting. Analysis showed that 82% of events were reported on the same day they were committed and 93% within 7 days.
Where ANOVA tests led to the rejection of the null hypothesis, Tukey’s Honestly Statistically Different (HSD) tests were used to identify between which particular events in the sequence that the differences were attributed to.
External Validity
While national statistics on domestic abuse are not available in England and Wales, Her Majesty's Inspectorate of Constabulary (HMIC) report that domestic abuse represents 3% of Suffolk Constabulary’s calls for assistance and 7% of all its recorded crime—comparable with the national position (HMIC, 2014). While Suffolk is predominantly a rural county, it has a number of urban areas and corresponding issues with high deprivation and comparative levels of some types of offending.
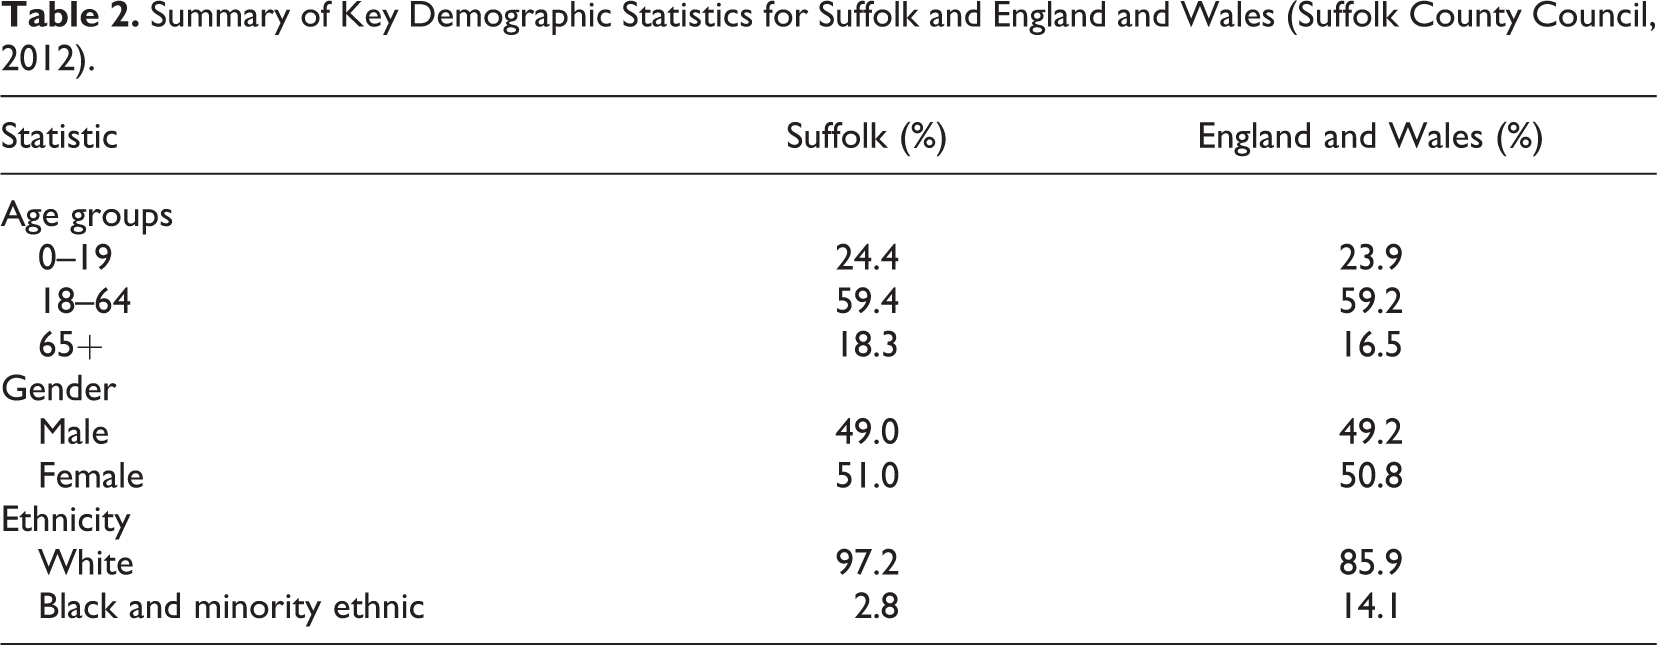
Table 2 shows a comparison of Suffolk against the overall figures for England and Wales for illustrative purposes: Suffolk Constabulary’s data should be comparable to other English and Welsh forces in many regards, but most particularly in the application of national crime counting rules. This alone should mean that all forces in England and Wales could derive some relevance from the findings detailed in the next chapter as well as police in other countries with similar penal codes. What is less certain is the replicability of this study, which will be dependent on forces’ individual circumstances relating to the recording of “noncrimes.”
Summary of Key Demographic Statistics for Suffolk and England and Wales (Suffolk County Council, 2012).
Results
The final cleaned data set contained 36,742 domestic abuse event records that were recorded within Suffolk Constabulary’s jurisdiction between January 1, 2009 and March 31, 2014. These data included 14,584 crimes under formal national definitions, 21,414 “noncrimes” (where a report had been made but no crime evidenced) and 742 nonnotifiable crimes (ostensibly crimes, but where there is no statutory responsibility to report to the Home Office).
The majority of nonnotifiable offenses relate to malicious use of public communications networks to send indecent or obscene messages. Although nonnotifiable for statutory statistical returns, the sentencing guidelines do enable a CHI value for this type of offending.
The majority (82%) of crimes within the data set are classified as some form of violence, which includes threatening behavior as well as physical contact violence. Violent and sexual offenses have typically been the principal focus of domestic abuse research but in this instance, they will form just 33% of the overall data set on police callouts for domestic abuse. The majority of “other offenses” are public disorder, which are noncontact but can relate to threatening or intimidating behavior.
As Figure 2 shows, most violent crime is recorded with no injury or with less serious injury. The “most” serious injury based cases make up less than 1% of the entire data set.
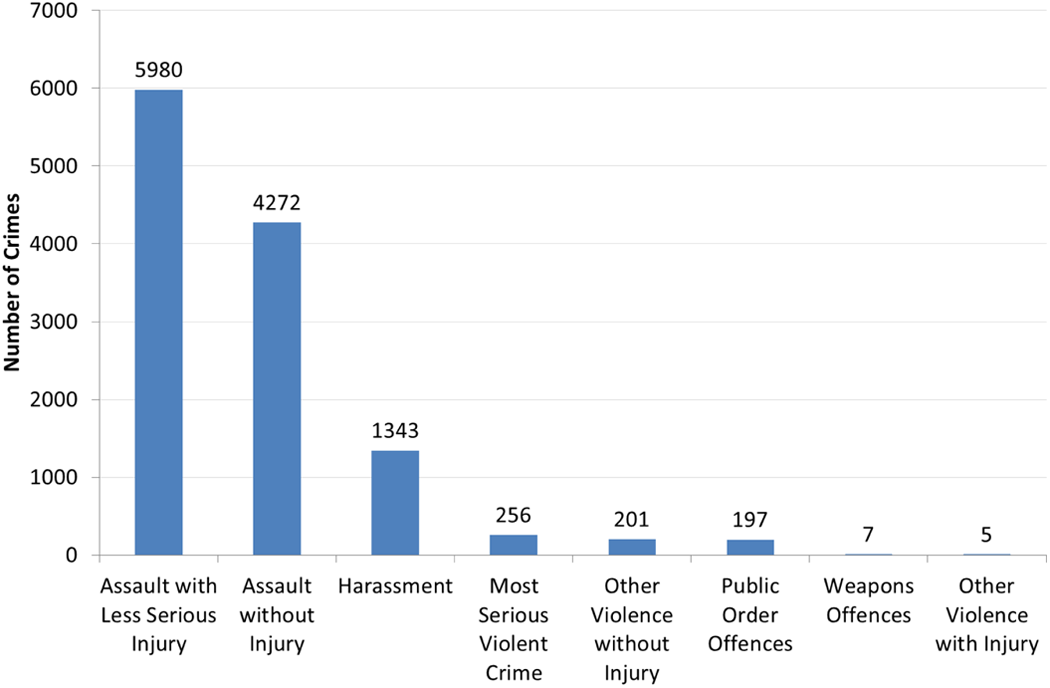
Breakdown of categories of violent crime (N = 12,049).
The key demographic breakdowns of the data are also worth consideration. In 77% of cases, victims of domestic abuse in Suffolk are female. The most frequent age banding for both males and females is 18–29 year olds, who make up over a third of all domestic abuse events.
Figure 3 shows that most victims of domestic abuse in Suffolk were “White British” (as classified by the Home Office 16+1 ethnicity codes).
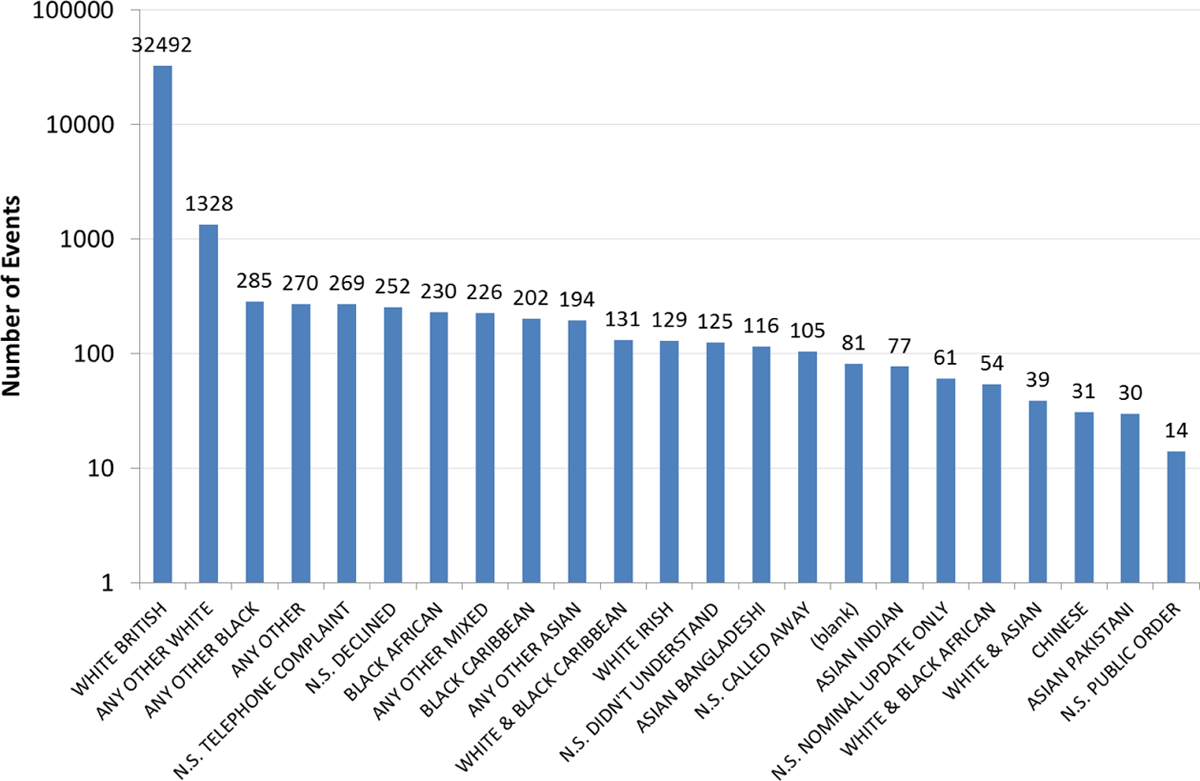
Breakdown of events by ethnicity.
Figure 4 gives a clear message regarding victim and offender movement in dyads. The ratio of unique victims to dyads is nearly 1:1. For offenders it is about 33% higher. This indicates that offenders in Suffolk had a greater tendency than victims to feature in multiple dyads. The victim ratio is also interesting as it indicates that at least 3,321 victims have reported more than one event.
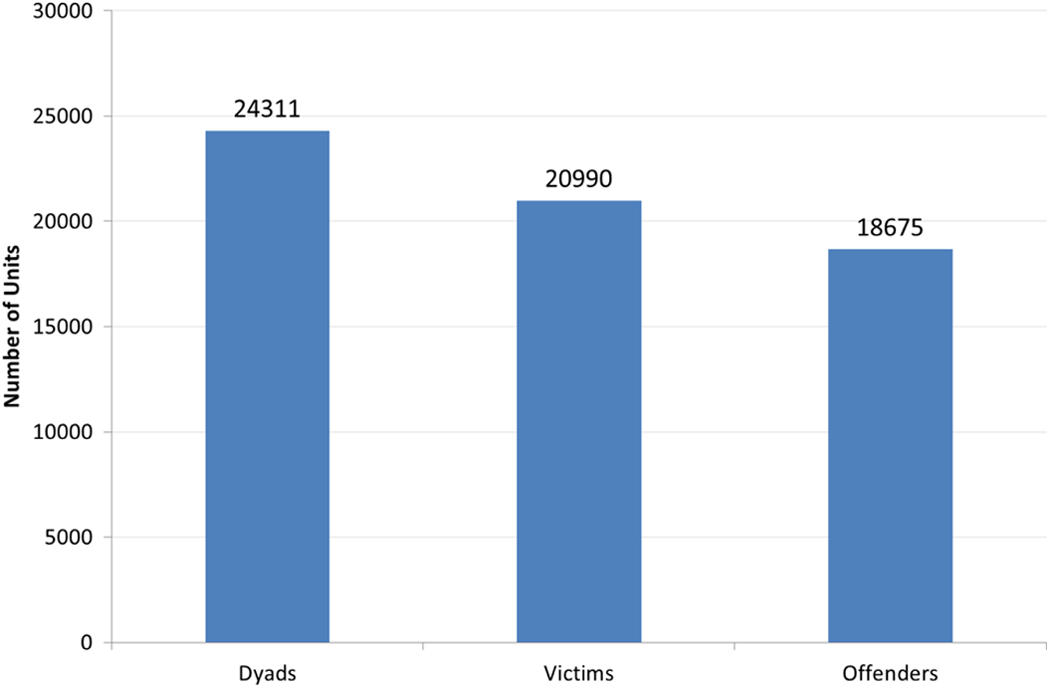
Number of unique dyads, victims, and offenders.
Repeat Victimization
Dyads
Figure 5 shows that most dyads presented to Suffolk Constabulary just once during the analyzed period. Those 18,476 dyads represent 76% of all dyads that reported in the data set, with a total prevalence of repeat victimization among dyads of 24%. Similar distributions were found for victims and offenders. However, the prevalence of repeat calls among victims is higher than among dyads. Thirty-two percent of victims reported more than one event to Suffolk in the 63 months analyzed, a rate one third higher than the 24% rate for dyads. This indicates some movement of victims between dyads.
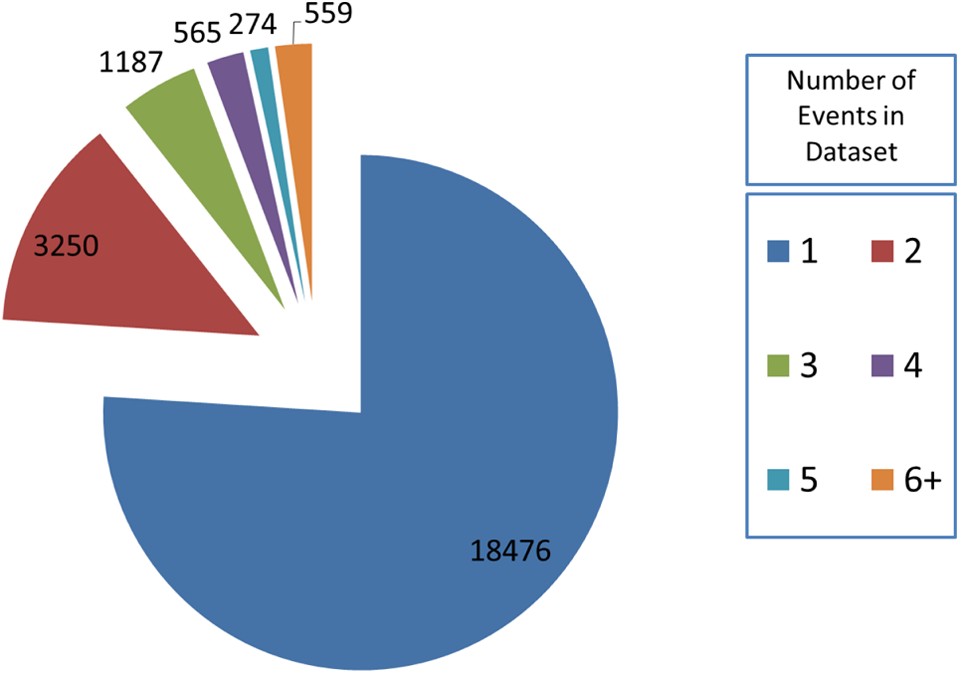
Number of dyads by level of events reported.
Repeat offending was more prevalent in the data set than victimization among either dyads or victims. Sixty-five percent of offenders were linked to just a single event, lower than the 76% of dyads and 68% of victims already shown. This indicates that offenders are also associated with multiple dyads. Offenders committed offenses against multiple victims to a greater extent than victims were victimised by multiple offenders. A total of 2,615 victims in the data set were victimized by more than one offender. That represents 29.5% of all repeat victims. By comparison, 3,144 offenders offended against multiple victims—47.6% of all repeat offenders.
Conditional Probability
Dyads
The initial probability that a dyad reporting once will report a second event is just 24%. This probability rises with each subsequent event reported. If a dyad is the subject of two events, then it is 44% likely to report a third. If it reports a third, it becomes 54% likely to report a fourth and so on. Similar patterns are found for victims and offenders.
Escalation in Severity
All Eligible Dyads
From Events 1–10, Figure 6 indicates an upward trajectory in the mean CHI values (number of days in prison recommended by sentencing guidelines) for the first ten calls among all eligible dyads (this analysis is restricted to the first 10 calls because sample sizes drop away after this point). A single factor ANOVA test determined borderline significance in escalation over time, F(9, 4,802) = 1.76; p = .07. That is entirely due, however, to the increase in CHI values after the first three events. Since most dyads never have one, let alone three repeat events, the importance of this finding of delayed escalation is highly precise, and inappropriate for most couples.
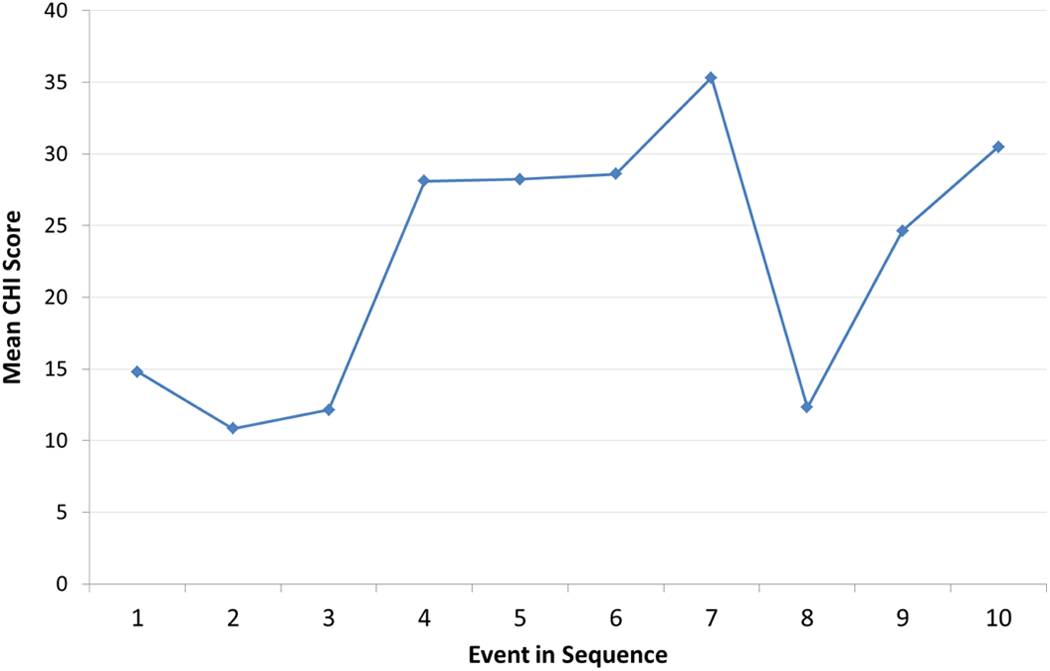
Average Crime Harm Index (CHI) scores in first 10 events for all eligible dyads.
Chronic high harm dyads
Figure 7 suggests no consistent upward trajectory in mean CHI scores from Event 1 to Event 10 among the group of dyads who contributed 80% of cumulative CHI in the whole data set. This group is referred to as “chronic high harm dyads” (n = 76) and it should be noted that this is a very small proportion of the dyads as well as a small sample for trajectory analysis. As would be expected given the criteria of this cohort, the average level of harm was far higher than for other cohorts. A single factor ANOVA test determined no statistical significant escalation over time, F(9, 539) = 1.29, p = .24.
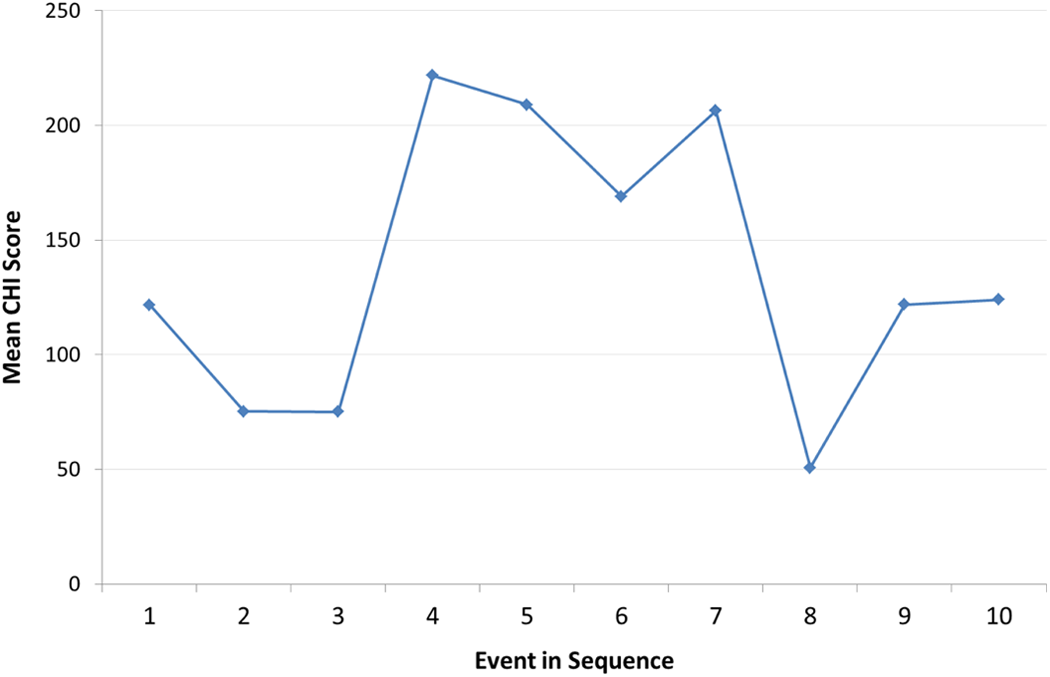
Average Crime Harm Index (CHI) scores in first 10 events for all eligible dyads featuring with dyads causing 80% of cumulative CHI.
Arrest at first event
Figure 8 indicates an upward trajectory, but no statistically significant increase, in mean CHI scores between Events 2 and 6 for the cohort in which there was an arrest at the first offense (n = 189). At Event 6, the sample size was 114 and after this, it declined considerably to just 20 cases at event 10. A single factor ANOVA test determined no statistical significance, F(9, 1200) = 1.24, p = .26.
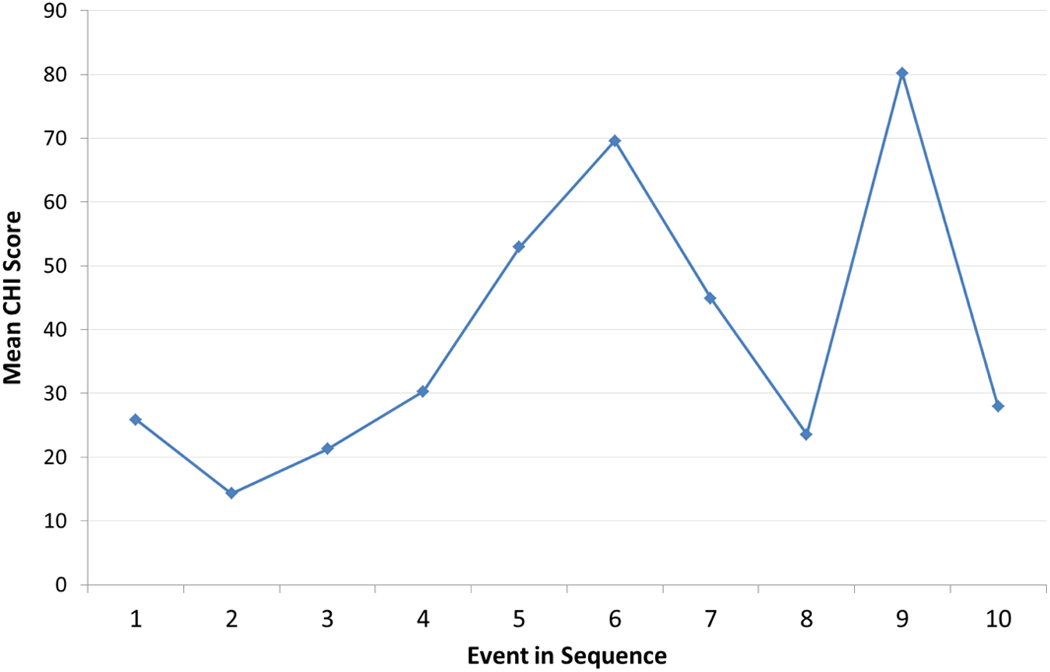
Average Crime Harm Index (CHI) scores in first 10 events for all eligible dyads featuring with dyads where an arrest was made at the first event.
Decreasing Intermittency between Calls
All eligible dyads
Figure 9 shows a general downward trajectory between Event 1 and Event 10, with rises at three sequential points; Events 3 and 4, Events 4 and 5, and Events 7 and 8. For all eligible dyads, the average number of days in between events is over 100 at every pair up to the 6th event. Thereafter the average falls to less than 90. Standard deviation is above 100 days for every pair of events. A single factor ANOVA test determined that at least one relationship between two of these pairs was statistically significant, F(8, 4076) = 3.68, p < .001. This means the null hypothesis of no differences between means is rejected. ANOVA does not explain which groups have statistically significant differences, rather it just identifies that at least two groups do. A Tukey’s HSD test identified significant differences between the means of 13 pairs of events (as shown in Table 3).
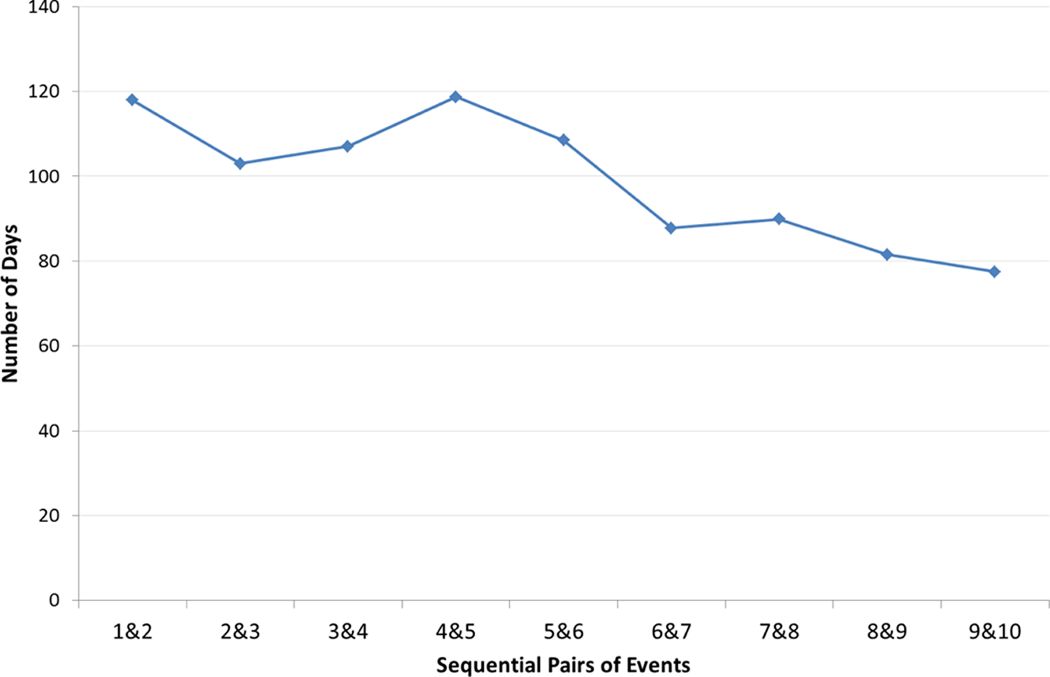
Average intermittency between the first 10 events in eligible dyads.
Tukey’s HSD Results for Intermittency Means at First 10 Events for Eligible Dyads.
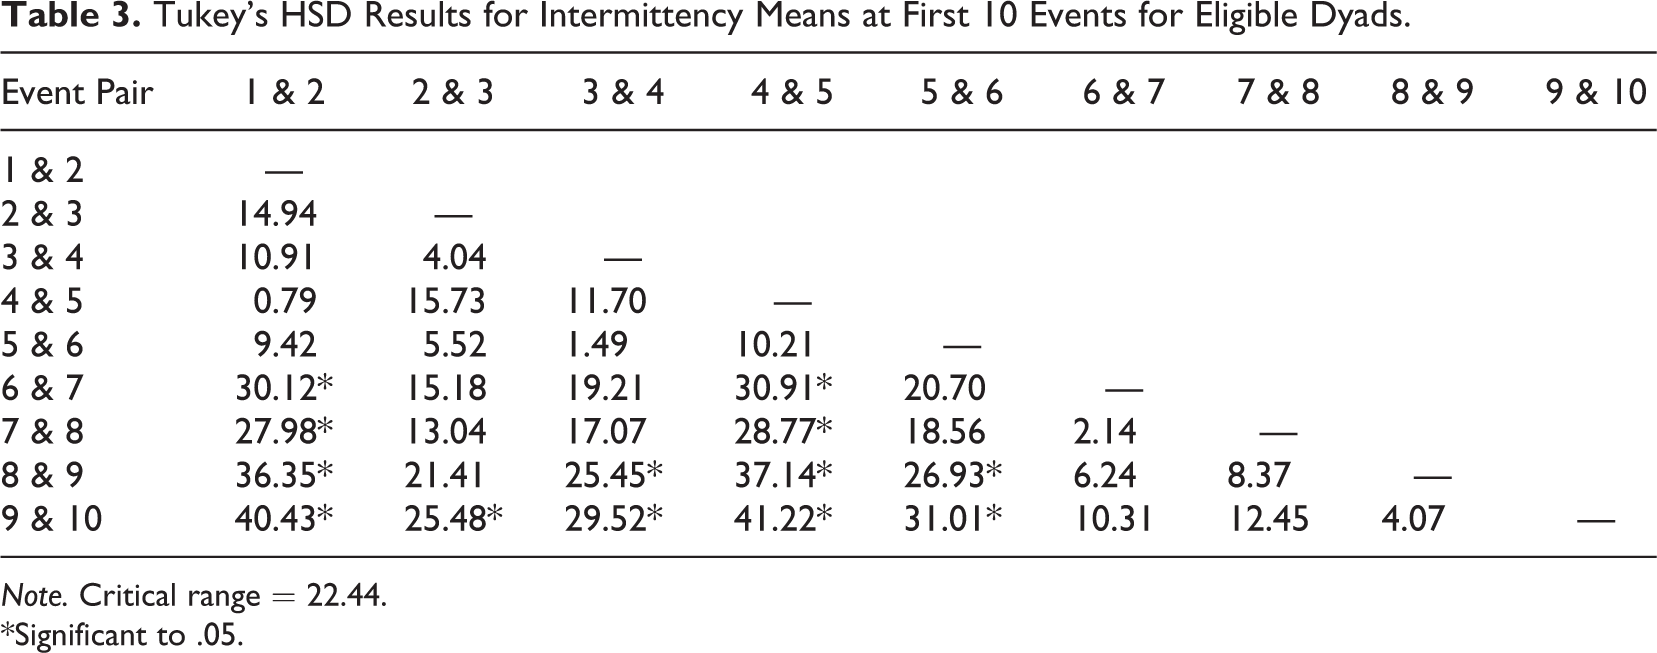
Note. Critical range = 22.44.
*Significant to .05.
These results indicate that there was significant difference (in this case a decrease in time, or an increase in speed) in the number of days between domestic abuse reports predominantly in the cases of earlier events compared to later events. For example, the difference in time (days) between events one and two was significantly higher than the difference between Events 6 and 7, seven and eight, and eight and nine. This supports the notion of escalating intermittency between initial and later events, and highlights specifically that there was a step change in intermittency from around event 8 onward. These results should be considered in the context of unequal sample sizes that mean that Tukey’s HSD results are more conservative.
Chronic High Harm Dyads
A single factor ANOVA test determined that there was no decline in intermittency—that is, increase in frequency—for high-harm dyads. None of the relationships between any of the pairs of events was statistically significant, F(8, 464) = 1.05, p = .39.
Higher Deprivation
Figure 10 shows that where events took place within the 20% most deprived wards in Suffolk, there was a clear increase in the pace of calls to police. The downward trajectory of intermittency over time had sample sizes ranging from 450 for the first five events to 54 at the 10th. A single factor ANOVA indicated that the difference in mean intermittency between at least two events was statistically significant, F(8, 2525) = 2.70, p < .01. Tukey’s HSD test identified significant differences between 12 of the 36 possible combinations. These results indicated significant differences between the mean intermittency at Event 2 and the mean intermittencies at Events 7, 8, 9, and 10. This supports the inference dyads based in more deprived areas of Suffolk experience decreasing numbers of days between offenses after Event 7.
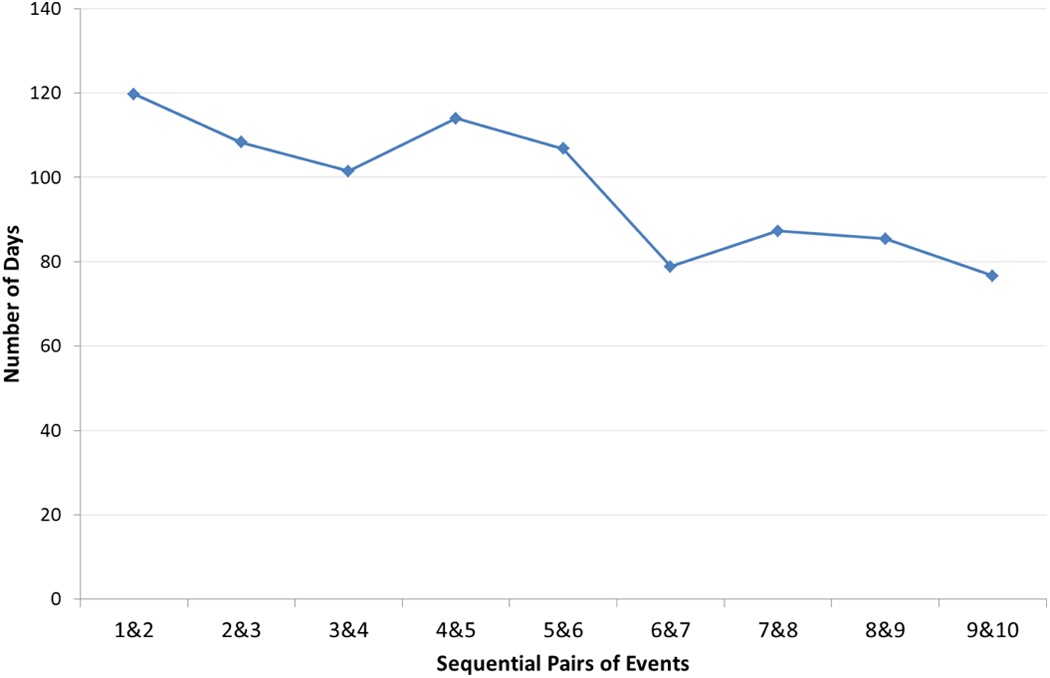
Average intermittency between the first 10 events in eligible dyads where events took place in an area within the most deprived in Suffolk.
“Power Few” Concentrations of Harm
Dyads
CHI scores were highly concentrated among dyads, as indicated by Table 4. It is striking that 10% of all domestic abuse harm within 5 years and 3 months was attributable to just 20 dyads (out of 24,311 that reported in that time). It is equally notable that 80% of harm was attributable to just 1.7% of dyads—a much higher concentration than the theoretical “80–20” rule would suggest. These results strongly support the conclusion that a very small number of dyads account for a majority of harm. Conversely, this also suggests that a very high number of dyads report a very low amount of harm.
Distribution of Cumulative Harm Among Dyads.
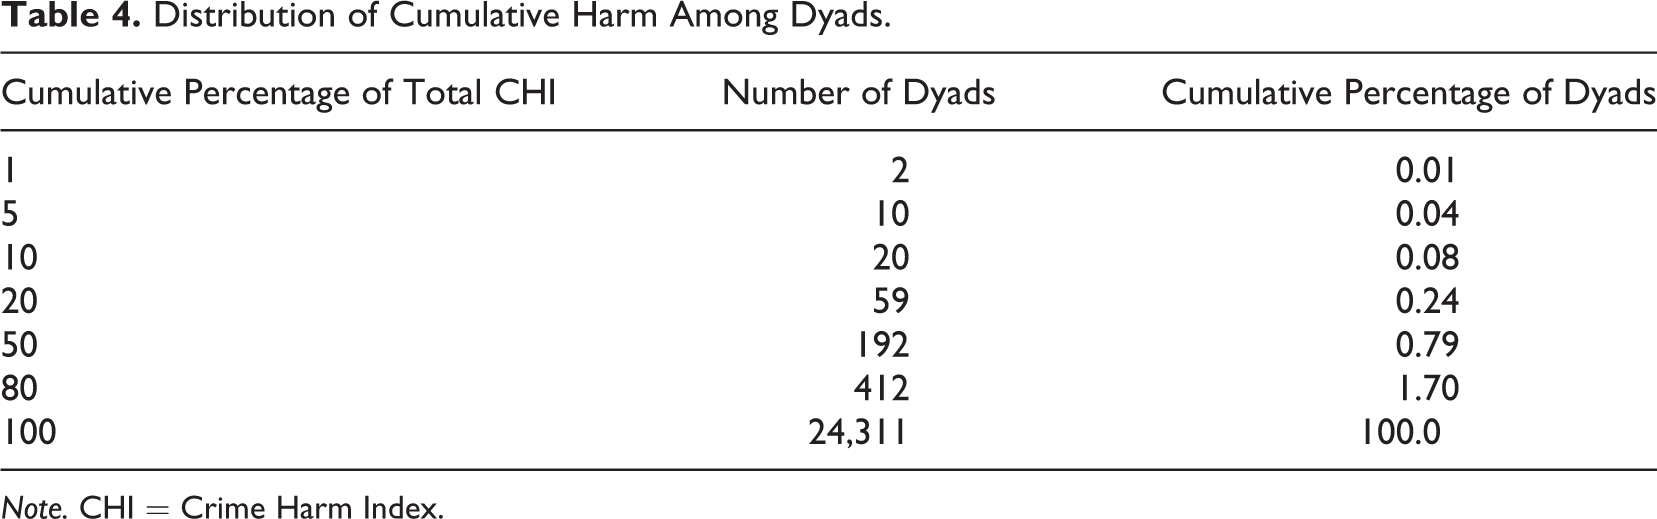
Note. CHI = Crime Harm Index.
Figure 11 shows the proportion of total CHI attributed to dyads at each level of reporting. Those dyads which reported just one event (n = 18,476) accounted for 53.6% of all harm, yet made up 76% of all dyads. This suggests two interesting issues. First, police in Suffolk may have no prior records of domestic abuse in the cases that make up over half of all domestic abuse harm. Secondly, that there is uneven distribution of harm between the number of dyads at each level of event reporting.
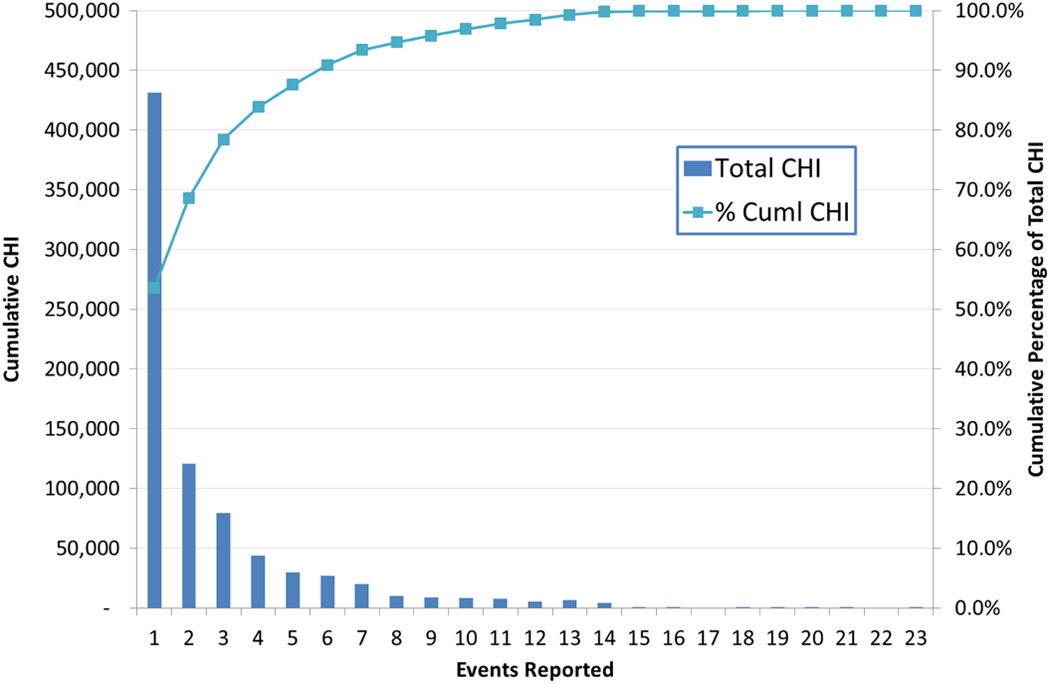
Pareto chart for cumulative Crime Harm Index scores by number of events reported per dyad.
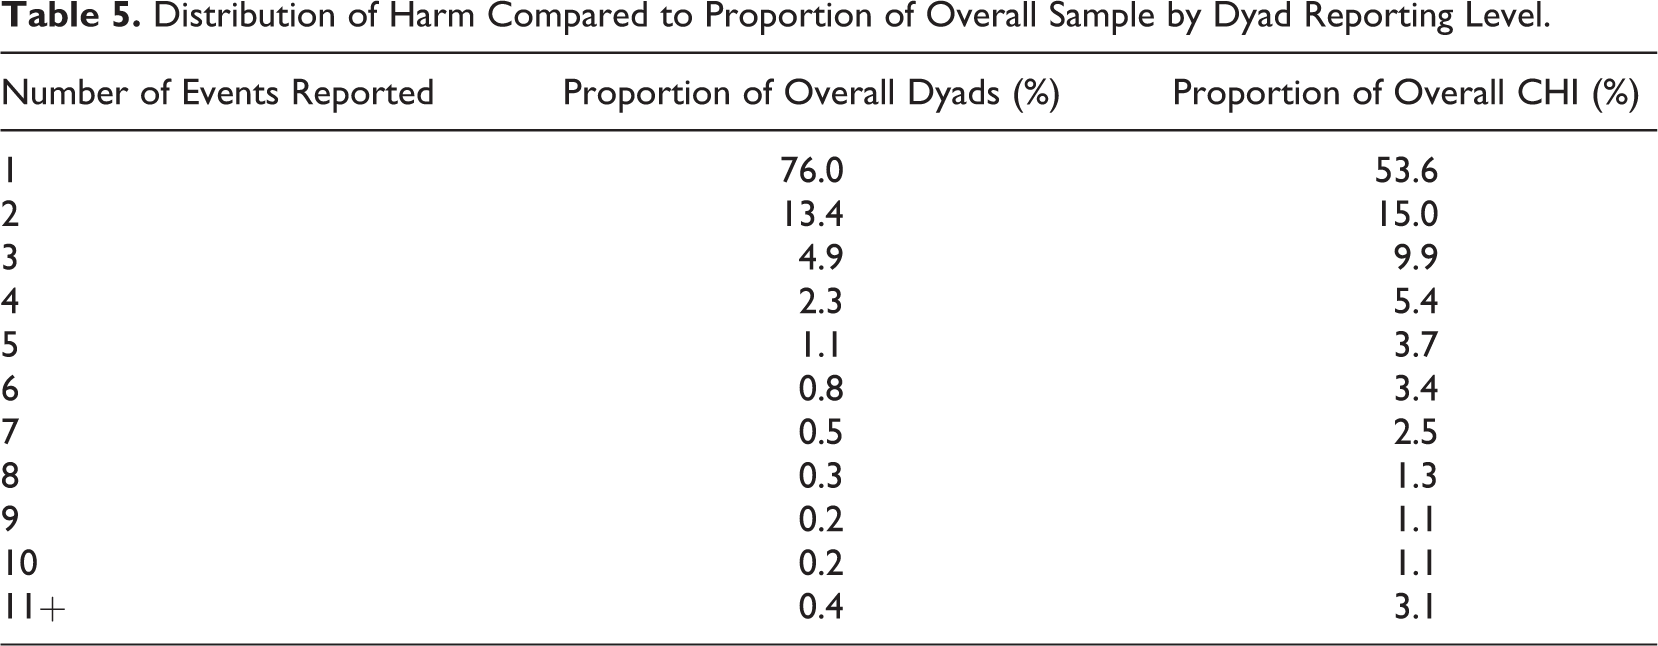
This finding is demonstrated in more detail by Table 5.
Distribution of Harm Compared to Proportion of Overall Sample by Dyad Reporting Level.
Breakdown of the Power Few
Further analysis of the 412 dyads that accounted for 80% of cumulative CHI scores in the data set identifies three subcategories of dyad based upon event reporting history. Dyads 293 of the 412 (53%) had only one reported event in the data set. This implies that police had no prior record of domestic abuse in over half of the most harmful cases in a 5-year period. This cohort is henceforth referred to as Never Called Before (NCB).
Dyads 76 of the 412 (18%) met the eligibility criteria for the CHI and intermittency analysis undertaken in this research. This is to say that just less than one in five of the most harmful dyads reported five or more events in a 3-year period. This cohort is henceforth referred to as “chronic.”
The remaining 119 dyads (29%) reported more than one event, but less than five in a 3-year window from the first event. This cohort is henceforth referred to as “intermediate.”
The data suggest differences in the demographic composition of the chronic and NCB cohorts in particular. NCB dyads tend less frequently to have unemployed, females and White British victims than was generally observed in the data set. They also have children present in fewer cases. By contrast, the chronic dyads displayed the opposite trend; dyads were more frequently featuring unemployed, female, or white British victims or where children were present. Similar results were found for both victims and offenders.
Discussion
These results demonstrate the broad diversity of risk and harm in the high-volume category of “domestic abuse” as well as a general lack of escalation in their seriousness. The majority of such events happen only once and cannot, by definition, escalate. Yet the findings also highlight areas where the police response is perhaps lacking at present. There are also practical implications among the findings that could influence how the police respond to domestic abuse calls for service.
Theoretical Implications
These findings pose further serious questions to Pagelow’s (1981) assertion that escalation in domestic abuse is the “one thing that researchers can agree on.” This study contributes what may be the largest sample size to the research that has failed to find evidence of escalation since Pagelow’s claim and the widespread “theory” of escalation it has generated (which does not pass standard requirements for a theory in science). Escalation is a complex issue; it can relate to severity or intermittency, it can be measured on different scales, using different units and over different timescales. This research offers new perspectives that may help to advance the debate around escalation in three principal ways.
First, there is no universal rule of escalation in severity of harm among domestic abuse cases. It should not be an accepted fact that any domestic abuse case will progress from the nonsevere to the severe unless intervention is made. This conclusion is based on two pieces of evidence: (A) there are many dyads within the data who were reported to police many times but neither reached any level of “serious” offending or displayed any evidence of escalation in harm; (B) a great deal of high harm cases showed no evidence of escalation at all; indeed the majority showed no previous domestic abuse record at all.
Second, the existence of chronic low harm dyads may be explained by the semi-normalization of violence. Reporting may be used by the victim as a retaliation tactic. Alternatively, the reporting may be generated by a third party, which could include Police proactively contacting victims and offenders through part of an ongoing risk management or investigation process. Indeed the completion of a DASH form itself often leads to the collection of information about further offenses.
Third, NCB cases may point toward reluctance in victims to report if offending patterns were preexisting. This is potentially endorsed by theories of underreporting and the gap between the levels of violence reported to surveys and reported to police. If violence does exist in NCBs before the report to police, then police and partner efforts to identify it become crucial to any risk management strategies. Opportunities may exist in data mining, or referral networks such as the Sexual Assault Referral Centers that enable victims to approach agencies without the obligation of reporting to police. There is also a strong implication that agencies should not scale down efforts to encourage reporting. Alternatively, the crime may represent an “explosion” of violence that is counter normative to the relationship. If this were the case, it may run contrary to theories of underreporting.
Certainly, the existence of these “subtypes” of domestic abuse dyads (NCB, chronic high harm, chronic low harm, 1-time low harm) lends credence to various taxonomies of domestic abuse. Johnson’s (1995) is the most publicised; dividing dyads into those of “common couples” for whom violence is rare and not the norm and “patriarchal terrorism” for whom males display continuing patterns of violence to control females. As discussed in the literature chapter, Piquero, Brame, Fagan, and Moffitt (2006) theorized that Johnson’s different classifications may be the reason that studies see different patterns of escalation. The results presented in this research do not directly evidence “patriarchal terrorists” or “common couples,” but they do present a clear picture of distinctly different patterns among dyads that is worthy of further exploration to see if additional theories can be identified.
The results set out clearer evidence for decreasing intermittency among domestic abuse cases. This evidence too merits consideration of theoretical implications. Why do cases become more likely to report again and more quickly with each passing call? There have been no studies undertaken to substantiate this, so this point is speculative but merits further exploration.
The final theoretical implication concerns victims moving between dyads. The concept of serial offenders is well established and is at the heart of legislation such as “Claire’s Law” where victims are able to make checks on partners to see if they have a history of violent offending. Less is known about serial victims, those who experience domestic abuse from more than one offender. While this research has not examined the nature of the relationships in each dyad, the inference is that victims end one abusive relationship and then enter another. Why this happens is an important question that merits theoretical consideration. Understanding this phenomenon could have interesting implications for prevention strategies.
Policy Implications
Preventing domestic abuse is a key priority for police forces in England and Wales (HMIC, 2014) and at the heart of prevention is the DASH form—a tool used by officers and specialists to form judgements about the risk of harm. The tool, which grades cases as “standard,” “medium,” or “high” risk is a determinant of prevention strategy. Part of the form specifically questions the presence of escalation in severity and frequency; if a victim answers yes to the questions they are considered more likely to be at risk of harm. Yet this research has identified two pieces of evidence that contradict this process. First, not all cases that escalate in intermittency become high harm. Second, the majority of high harm cases, do not exhibit patterns of escalation in severity or intermittency. This second point, coupled with other research about DASH (Thornton, 2011) and should lead to a major rethinking of the role of escalation in domestic abuse risk assessment. Put simply, England and Wales police forces currently prioritize scarce preventative resources on criteria directly contradicted by the empirical evidence of this study.
The fact that more than half of the cases representing 80% of all harm were unknown to the police for domestic abuse has wider implications for policy than just rethinking the risk assessment process. It should also prompt examination of how police (and other domestic abuse stakeholders) identify victims. This examination should focus on two separate aspects of identification: victim reported and agency generated.
For the former, agencies should continue to target efforts and evaluate tactics for increasing victim confidence. Importantly however, these efforts need to spread wider than just those victims with whom they already have contact. Indeed, a good proportion of effort and resource should be expended on people who have never made contact with police before concerning domestic abuse. The data examined here suggests that police in Suffolk at least should increase engagement with higher employment areas, males and those in non–White British communities. The external validity of this research means this is a worthy consideration for other English and Welsh forces too.
Second, police and partners consider how they can leverage their data collectively to identify cases before they become NCB. This could begin with an exploration of police data and expand into partner databases. The advent of “troubled families,” integrated offender management and multiagency safeguarding hub programmes should be an enabler in this respect (Williams and Ariel, 2013). This study does not offer an answer to the question of whether the NCB cases have truly NCB, but it does give Suffolk Constabulary and its partners a cohort of victims and offenders that it could examine for prior contacts of any kind. This could lead to a review of how police analysts and intelligence units proactively seek out risky cases and target engagement.
From this implication, this discussion returns to risk assessment. At present, a DASH form is generated upon report of a domestic incident or crime. The evidence presented here would suggest a fundamental change should be considered—that a domestic abuse risk assessment may need to be triggered by something other than a domestic abuse event. This evidence suggests police and partners may be wasting resources on cases where risk assessment adds little value, while missing opportunities to assess the risk of high harm cases not yet brought to police attention.
Finally, police agencies around the world should consider how data standards could be set to ensure that forces are able to identify repeat victims. The process of data cleaning required to undertake this research precludes Suffolk Constabulary from being able to accurately and systematically identify repeat victims on an operational basis. This means that call operators or officers attending scenes may not have the full knowledge of the history of the dyad or victim. It may mean that serial victims go unnoticed. It certainly means that DASH assessments could be completed multiple times on the same victim, without ever being linked. If police agencies are serious about preventing domestic abuse and providing service to victims, these points need to be corrected.
Research Implications
While this research has reached some definite conclusions in relation to its research questions, those have in turn generated more questions.
Regarding escalation in general, this study is the first to use the Cambridge (or any) CHI to measure escalation of harm, or dyad/victim based concentrations of harm. The Cambridge CHI proved a successful instrument and this research should mean that it could be used by other researchers with a degree of confidence. The CHI opens up a new paradigm of analytical opportunities ranging from geographical to temporal. Its use may expand beyond the academic and it would be interesting to see a force use CHI to track its performance in preventing domestic abuse.
Never called before dyads
CHI has been used in this research to describe the existence of NCBs; a group of high harm dyads that have not come to police attention for domestic abuse prior to the high harm event. However, apart from some basic demographic analysis, this research has not examined NCBs in any detail. The first question of interest regarding further research should be whether the phenomenon exists in other force areas and to what extent. Part of this research may be whether NCBs have in fact NCB. This study was limited to 5 years of data, so it is possible that some NCBs may have reported prior to the commencement of the data period. However, given the findings on intermittency, it is improbable that the majority of NCBs feature elsewhere in police data regarding domestic abuse. What is less clear is whether the victims or offenders were known to police for anything else.
If other police forces experience NCB, the ramifications for domestic abuse strategy are wide ranging and it will be important to learn even more about this group. In Suffolk, this group was more frequently employed, male or non–White British than high harm chronic or the general data set. This analysis, however, is based on a limited number of variables. Further analysis, perhaps based on interviews or surveys with NCB victims and offenders could prove invaluable to future prevention and identification strategies.
It would also be extremely useful to understand what happens to NCBs after the high harm event. Data in this study imply a high rate of desistance. Understanding this could help identify what works in preventing repeat offending.
Chronic dyads
While further research of NCBs could prove valuable, further research of the chronic cases (both high harm and low harm) should not be ignored. Those chronic cases that have desisted could also help identify what works in preventing repeat offending and what role police intervention has in both desistance and further offending. For Suffolk Constabulary, the high harm chronic cases could become a cohort of dyads that represent the best short-term return on investment in terms of traditional “performance” and harm reduction. Perhaps the most important question research could answer for this group is whether they are being managed at all and if so, how?
Limitations of this Study
Like most pieces of research, particularly retrospective analysis, this study was subject to several restrictions. A universal limitation on this kind of “big data” analysis is unreported crime. It is a virtual certainty that police-recorded data do not represent all domestic abuse that takes place.
Another major limitation of this study has been reported as globally as Western Australia and Uruguay as well as other UK agencies. None of them record URNs for victims. Identifying unique victims is highly manual and labor intensive. It is probable that a small number of cases have also been incorrectly included or excluded on this basis. Yet it is not so much a threat to the internal validity of the study as it is to the operational application of its findings.
The use of CHI at the level of definition required necessitated the author to supplement the research of Sherman et al. (2014) by cross referencing a list of offenses from the data set with available online resources (Sentencing Council, 2011). In some cases, the wording of crimes on Suffolk’s system did not exactly match those in the reference material that required some interpretation. While it is highly unlikely this skewed the overall findings, researchers working with CHI in future should review their own systems against the reference material and the values shown in Appendix.
It should also be considered that it was not possible to control for variables that may have influenced severity or intermittency. The most prominent of these is police involvement. It was not possible to determine which cases had been assigned to the Suffolk multiagency risk assessment conference or had been assigned an Independent Domestic Violence Advocate. Either of these may have had an influence on mitigating violence or increasing the frequency of reports. Further studies or future iterations of this study should seek to identify these points at the outset.
Finally, it should be considered that both ANOVA and Tukey’s HSD are linear tests, which is to say they assume a linear relationship in the data they are applied to. Domestic abuse is of course highly complex and it is perhaps unlikely that escalation always assumes a directly linear pattern. Future studies may wish to consider whether a nonlinear model can be applied.
Despite limitations, this study retains strong internal validity. As police recorded data, the classifications are subject to national standards and local audit. Data are linked to unique offender records by intelligence operatives and subject to rigorous local checks. The nature of the data also makes a wide number of variables available for analysis, many of which have been examined in this research. The data period extended over 5 years and cleaning made the analysis of dyads viable for the first time in an escalation study. This study has taken advantage of this to provide a longitudinal based analysis, something which previous escalation studies have cited the absence of as a weakness.
Conclusions
The phenomenon of escalation has been discussed by researchers for more than 30 years, yet evidence actually proving its existence has been thin. The fact that some domestic abuse presents as a repeat phenomenon does not mean that most or all dyads experience repeat offending, let alone rising severity. The absence of research may be in part due to the lack of a consistent instrument to measure crime severity. For England and Wales agencies, this is no longer the case, with the advent of the Cambridge CHI (Sherman, 2013; Sherman, Neyroud, & Neyroud, 2014).
This study examined over 36,000 cases of domestic abuse crimes and incidents reported to Suffolk Constabulary between January 1, 2009 and March 31, 2014. Through extensive cleaning of data, this research was able to compile findings by dyad, a long-standing gap in the research on escalation. The data showed that three quarters of dyads reported to police just once in the period analyzed, but that harm was highly concentrated, with over 80% of cumulative harm for the whole period attributable to less than 2% of dyads. Furthermore, this study identified that just over half this “high harm” group called the police for a domestic abuse incident or crime, just once in the period. It is inferred that this group of NCB offered Suffolk Constabulary no opportunity for preventative measures by conventional domestic abuse means. In addition, these cases offered no opportunity for the observation of escalating patterns. The existence of the NCB group has implications for research, theory, and policy. It is important that research examine whether the phenomenon exists in other police areas. If it does, research should be undertaken to examine the group in more detail to attach any relevant theoretical concepts and importantly to refine the way police identify cases and engage with people who don’t present as victims of domestic abuse. This study indicated that NCB victims were more often male, non–White British or from areas of lower deprivation than was typical. Examining the profile of NCBs further, perhaps with a random forest analysis, could generate a game changing approach to domestic abuse prevention in England and Wales.
This study also examined 727 dyads that met the eligibility criteria of five or more offenses within a period of 3 years from the first case. The study concluded that there was no evidence of escalating severity among this group, but that events reported after the fifth call were reported significantly more frequently (i.e., fewer days between calls to police) than those before the fifth. Just 76 of the 727 dyads featured in the most harmful 80% indicating that most chronic repeat dyads were “low harm.” More research into this “chronic” group should focus on the effect of police interventions, particularly on intermittency.
This evidence provides a direct contradiction to the notion of escalating violence in domestic abuse cases. Researchers may wish to further examine the notion of differing typologies of domestic abuse case, exploring the theoretical differences underpinning high and low harm, chronic and NCB cases, but the implication of this evidence regarding escalation is clear; at best, it is not a universal phenomenon.
This study also found evidence that conditional probability of domestic abuse rises with each passing event. After a dyad has reported 3 times, it is more than 50% likely to report a fourth time. The probability of the next event being a crime or being a crime with a CHI value of over 30 also rises, but is at a much lower level. This evidence should influence forces to consider how they respond based purely on level of event reporting in a case history. This may provide practical difficulties to forces in identifying dyads as entities, but the pattern of escalating probability is evident in offenders and victims too. Further research may consider subclassifications of dyads to detect differing patterns in conditional probability.
Finally, the study concludes that both victims and offenders can become “serial” to differing extents when it comes to domestic abuse. Repeat victims were victimised by multiple offenders in almost 30% of cases, but almost half of all repeat offenders offended against more than one individual. This area is worthy of further exploration as it may assist with developing the understanding of victim vulnerabilities, theories concerning different “types” of offender, victim, and dyad and the management of cases.
Furthermore, the conclusion that over half of the most harmful cases were not known to the police for domestic abuse should prompt a review of how forces and their partners engage with potential victims and how they use their data to proactively identify risk. The status quo of using a nonactuarial, nonevidence-based, reactive risk assessment is untenable. An alternative needs to be developed which takes into account that much of the harm caused to domestic abuse victims comes from cases that have never even been subject to risk assessment.
Footnotes
Appendix
Declaration of Conflicting Interests
The authors declared no potential conflicts of interest with respect to the research, authorship, and/or publication of this article.
Funding
The authors disclosed receipt of the following financial support for the research, authorship, and/or publication of this article: The first author received financial support for the research and authorship of this article from the College of Policing (UK) and Suffolk Constabulary to attend the Cambridge University Police Executive Programme, where he conducted the research for a master’s thesis presented in successful completion of the requirements for the M.St. in Applied Criminology and Police Management at the Institute of Criminology, University of Cambridge.