
Abstract
Economic crime models and the social strain theory argue that income inequality can foster property crime, yet empirical studies do not provide strong support for this relationship across countries. An important limitation of these studies is that they only consider relative inequality measures and omit absolute ones. Absolute inequality can have a crime-inducing effect for two main reasons: First, the potential monetary returns from crime can be expected to depend on the interaction between relative income inequality and mean income. Second, higher levels of absolute inequality imply that the economic elite can capture institutions in ways that can make them dysfunctional for society as a whole. This article finds that, in contrast to relative inequality, absolute inequality is a robust and statistically significant determinant of violent property crime rates for a sample of up to 59 developed and developing countries.
Introduction
The determinants of crime rates have been a topic of interest to criminologists, sociologists, and economists for decades. Several theories, such as strain theory (Merton, 1938, 1968) and rational choice theory (Chiu & Madden, 1998; Ehrlich, 1973), argue that economic inequality is an important factor in explaining why people perpetrate crimes. However, the empirical evidence for the impact of income inequality on property crime rates across countries is inconclusive. Some studies present results that support the hypothesis that inequality fosters property crime (e.g., Fajnzylber, Lederman, & Loayza, 2002a, 2002b; Soares, 2004a, 2004b), while other studies do not find a significant relationship (e.g., Neapolitan, 1995; Neumayer, 2005; Stack, 1984).
Previous studies have proposed several explanations for the mixed empirical findings, such as issues with property crime data, selection bias in the sample, and omitted variables. The hypothesis of this article is that another reason could be that existing cross-country analyses rely on relative inequality measures (such as the Gini) that are scale invariant, while they omit absolute inequality measures (such as the absolute Gini) that capture the interaction of relative inequality with mean income. 1 Relative and absolute inequality trends differ considerably (Atkinson & Brandolini, 2010; Bosmans, Decancq, & Decoster, 2014; Goda, 2016; Goda & Torres García, 2017; Ravallion, 2004), and Figure 1 shows that the correlation between absolute inequality and violent property crime rates is clearly positive, whereas there is no evident correlation of relative inequality and crime rates.
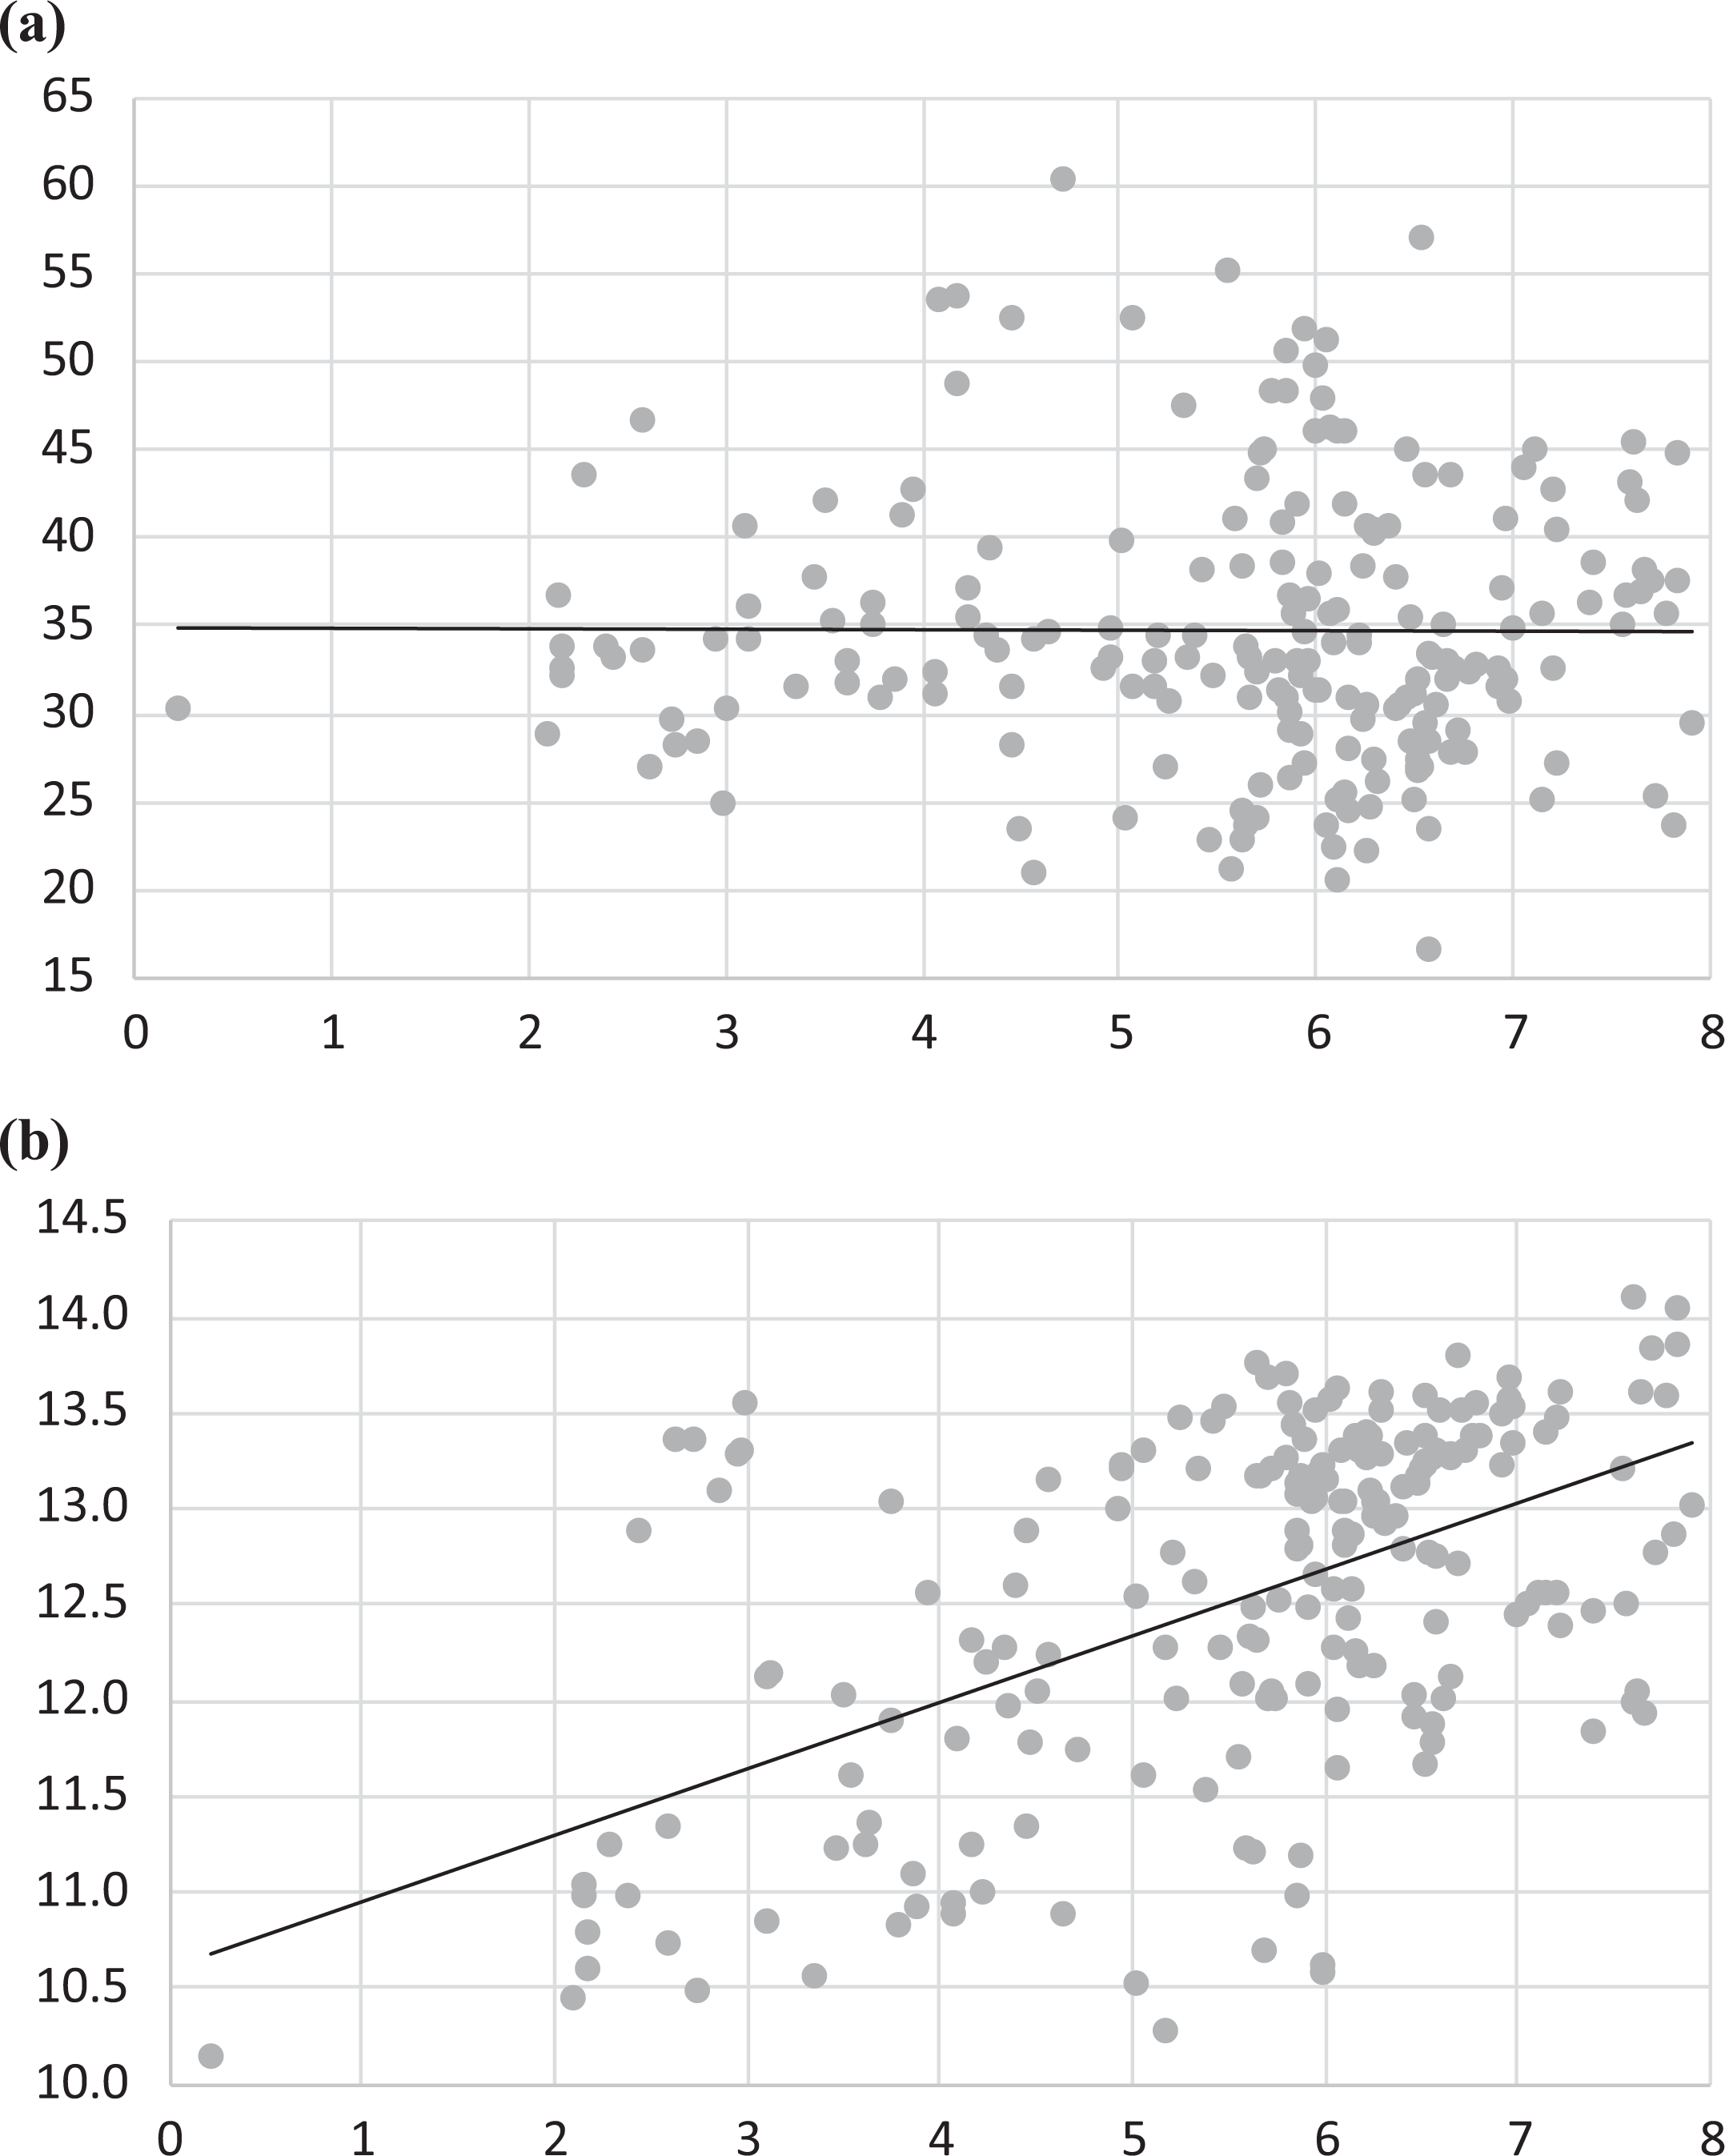
The correlation between relative and absolute income inequality and violent property crime rates across 59 countries. (a) Gini index and (b) absolute Gini. This figure shows the correlation between the number of robberies and violent thefts per one million inhabitants and the Gini index (a) and the natural logarithm of the absolute Gini (b), respectively. The data represent 3-year averages for the period 1980–1997 (see Research Design section and Appendix B for data details).
Absolute inequality measures can be expected to capture two main channels that might induce property crime. First, economic crime models show that the potential monetary returns from crime are a function of the absolute differences between illegal and legal income, which can be approximated by considering both mean income and the relative distribution of income (Ehrlich, 1973). Second, the social strain theory argues that crime is a consequence of dysfunctional societies (Merton, 1938, 1968), and higher top incomes imply that the economic elite can spend more money on bribery or lobbying practices, which tends to increase their de facto political power (Acemoglu & Robinson, 2008). This power, in turn, might be used to influence political and juridical institutions in ways that make them dysfunctional for society as a whole.
The aim of this article is to test empirically whether absolute income inequality is a more significant and robust determinant of violent property crime than relative inequality. To ensure that the results are not influenced by the data and sample used, 2 we employ Neumayer’s (2005) replication data set that comprises robbery and violent theft rates for 59 developed and developing countries for the period 1980–1997. That is to say, the major difference with existing studies is that this article does not restrict its attention to the Gini coefficient and top-to-bottom income ratios but also considers the absolute Gini, the variance, and the absolute distance between top and bottom incomes as potential violent property crime correlates.
The results of this exercise suggest that absolute income inequality is an important determinant of violent property crime rates and that all considered absolute income inequality measures are more robust and significant determinants of violent property crimes than relative ones. This result is not affected by the sample size or the consideration of country-specific fixed effects and time trends. It is important to note that, due to the availability of data, it is beyond the scope of this article to identify the exact transmission mechanism that explains the presented results. However, the finding that absolute inequality is a correlate of property crime rates presents a useful basis for future theoretical and empirical research.
The layout of this article is as follows. Second section details the theoretical link between (absolute) income inequality and property crime rates. Third section gives an overview of the research design. Fourth section presents and discusses the estimation results. Fifth section concludes this article.
The Theoretical Link Between (Absolute) Income Inequality and Property Crime Rates
The existing literature identifies various mechanisms through which inequality can foster crime. From a sociological point of view, the most well-known mechanism is social strain theory (Merton, 1938, 1968), which in essence argues that criminal behavior is the outcome of dysfunctional social and cultural dynamics that lead to strain, institutional anomie (Messner, 2014; Messner & Rosenfeld, 1997), and relative deprivation (Hagan & Peterson, 1995). 3 To be more precise, according to the literature, inequality (i) contributes to the weakening of social bonds and values (anomie), (ii) increases the cultural pressure to be economically successful (quest for material success), (iii) lowers the opportunity to achieve economic success in legal ways (imbalance between social goals and the means to achieve them), and (iv) contributes to the subjective feeling of being unjustly disadvantaged in comparison to others (relative deprivation). In each of these four scenarios, crime is seen as deviant behavior that serves as an outlet for social strain. 4
From an economic point of view, the most used framework in the literature is based in the seminal work of Ehrlich (1973; see, e.g., Bourguignon, 2000; Chintrakarn and Herzer, 2012; Fajnzylber, Lederman, & Loayza, 2002b; Neumayer, 2005; Soares, 2004b). In essence, Ehrlich (1973) presents a model that argues that property crime is a rational cost–benefit decision of individuals that divide their time between legal and illegal activities with the aim of maximizing their expected utility. While the income of legal activities (Yl ) is assumed to be known, engaging in illegal activities entails a certain probability of being caught and punished, which implies a potential cost that reduces the expected income of illegal activities (Yi ).
The solution of the model shows that, under a given level of law enforcement, the individual participation in crime, and hence the crime rate in each state, is a positive function of the absolute differential returns from crime
While most of the literature agrees about the theoretical relationship between income inequality and property crime rates, empirical results of the existence of this relationship are mixed (see Soares, 2004a; Sun, Chu, & Sung, 2011, for an overview). Only approximately half of the studies that use U.S. crime data find a significant positive relationship between inequality and property crime rates, and a recent study surprisingly reports that an increased income inequality significantly reduced property crime rates in the period 1965–2005 (Chintrakarn & Herzer, 2012). Similarly, of the few existing cross-country studies, some find that income inequality is an important variable to explain property crime rates (Fajnzylber et al.,2002a, 2002b; Soares, 2004a, 2004b), while others report only a very weak relationship (Sun et al., 2011), no significant relationship (Neapolitan, 1995; Neumayer, 2005), or a negative impact (Stack, 1984).
Various explanations have been proposed to explain this ambiguity in the results. The first concerns the existence of measurement and reporting problems with crime data (Fajnzylber et al., 2002a, 2002b; Neapolitan, 1995; Neumayer, 2005; Soares, 2004a, 2004b). The second concerns the importance of using a broad country sample and allowing for country-specific fixed effects when estimating the impact of inequality on crime (Neumayer, 2005). The third emphasizes the importance of additional explanations for criminal behavior, such as racial aspects (Harer & Steffensmeier, 1992; Stolzenberg et al., 2006), institutional variables (Savolainen, 2000), and poverty (Pridemore, 2008, 2011).
While all of these explanations are plausible, our hypothesis is that an alternative reason for the ambiguity in the empirical results could be that the existing studies use relative inequality measures, like the Gini coefficient or top-to-bottom income ratios. There are two main reasons why relative measures might not be entirely satisfactory inequality proxies to verify the existence of a relationship between income inequality and property crime rates. The first and more straightforward reason is that they are unlikely to capture adequately potential returns from crime, as proposed by Ehrlich (1973).
An increase in relative inequality implies a transfer of income from poorer to richer individuals. This is the same as to say that the legal income (Yl ) of poorer individuals’ decreases (with a given mean income), which should encourage them to increase the time that they allocate to illegal activities. Such a scenario can be expected to be captured well by relative inequality measures. However, given that relative inequality measures are scale invariant (i.e., they do not change when the incomes of all individuals increase by the same percentage), they cannot capture changes in the average potential payoff of crime (Yi ) that is associated with a change in the mean income.
To make this argument more palpable, suppose that there are three fictional countries (A, B, and C): A and B have the same relative income distribution, but B has a higher mean income than A, while country C has the same mean income as B, but its relative income distribution is more unequal (Figure 2). Although the relative income distribution in A and B is the same, in the richer country (B), there exists a greater income distance between the income quintiles than in the poorer country (A); likewise, in C, the income distance is greater than in B, due to the differences in their relative income distribution. 5 This implies that, ceteris paribus, absolute differential returns from crime in B are greater than in A, and that of C are greater than that of B. 6 Accordingly, property crime can be expected to be highest in C, second highest in B, and lowest in A.
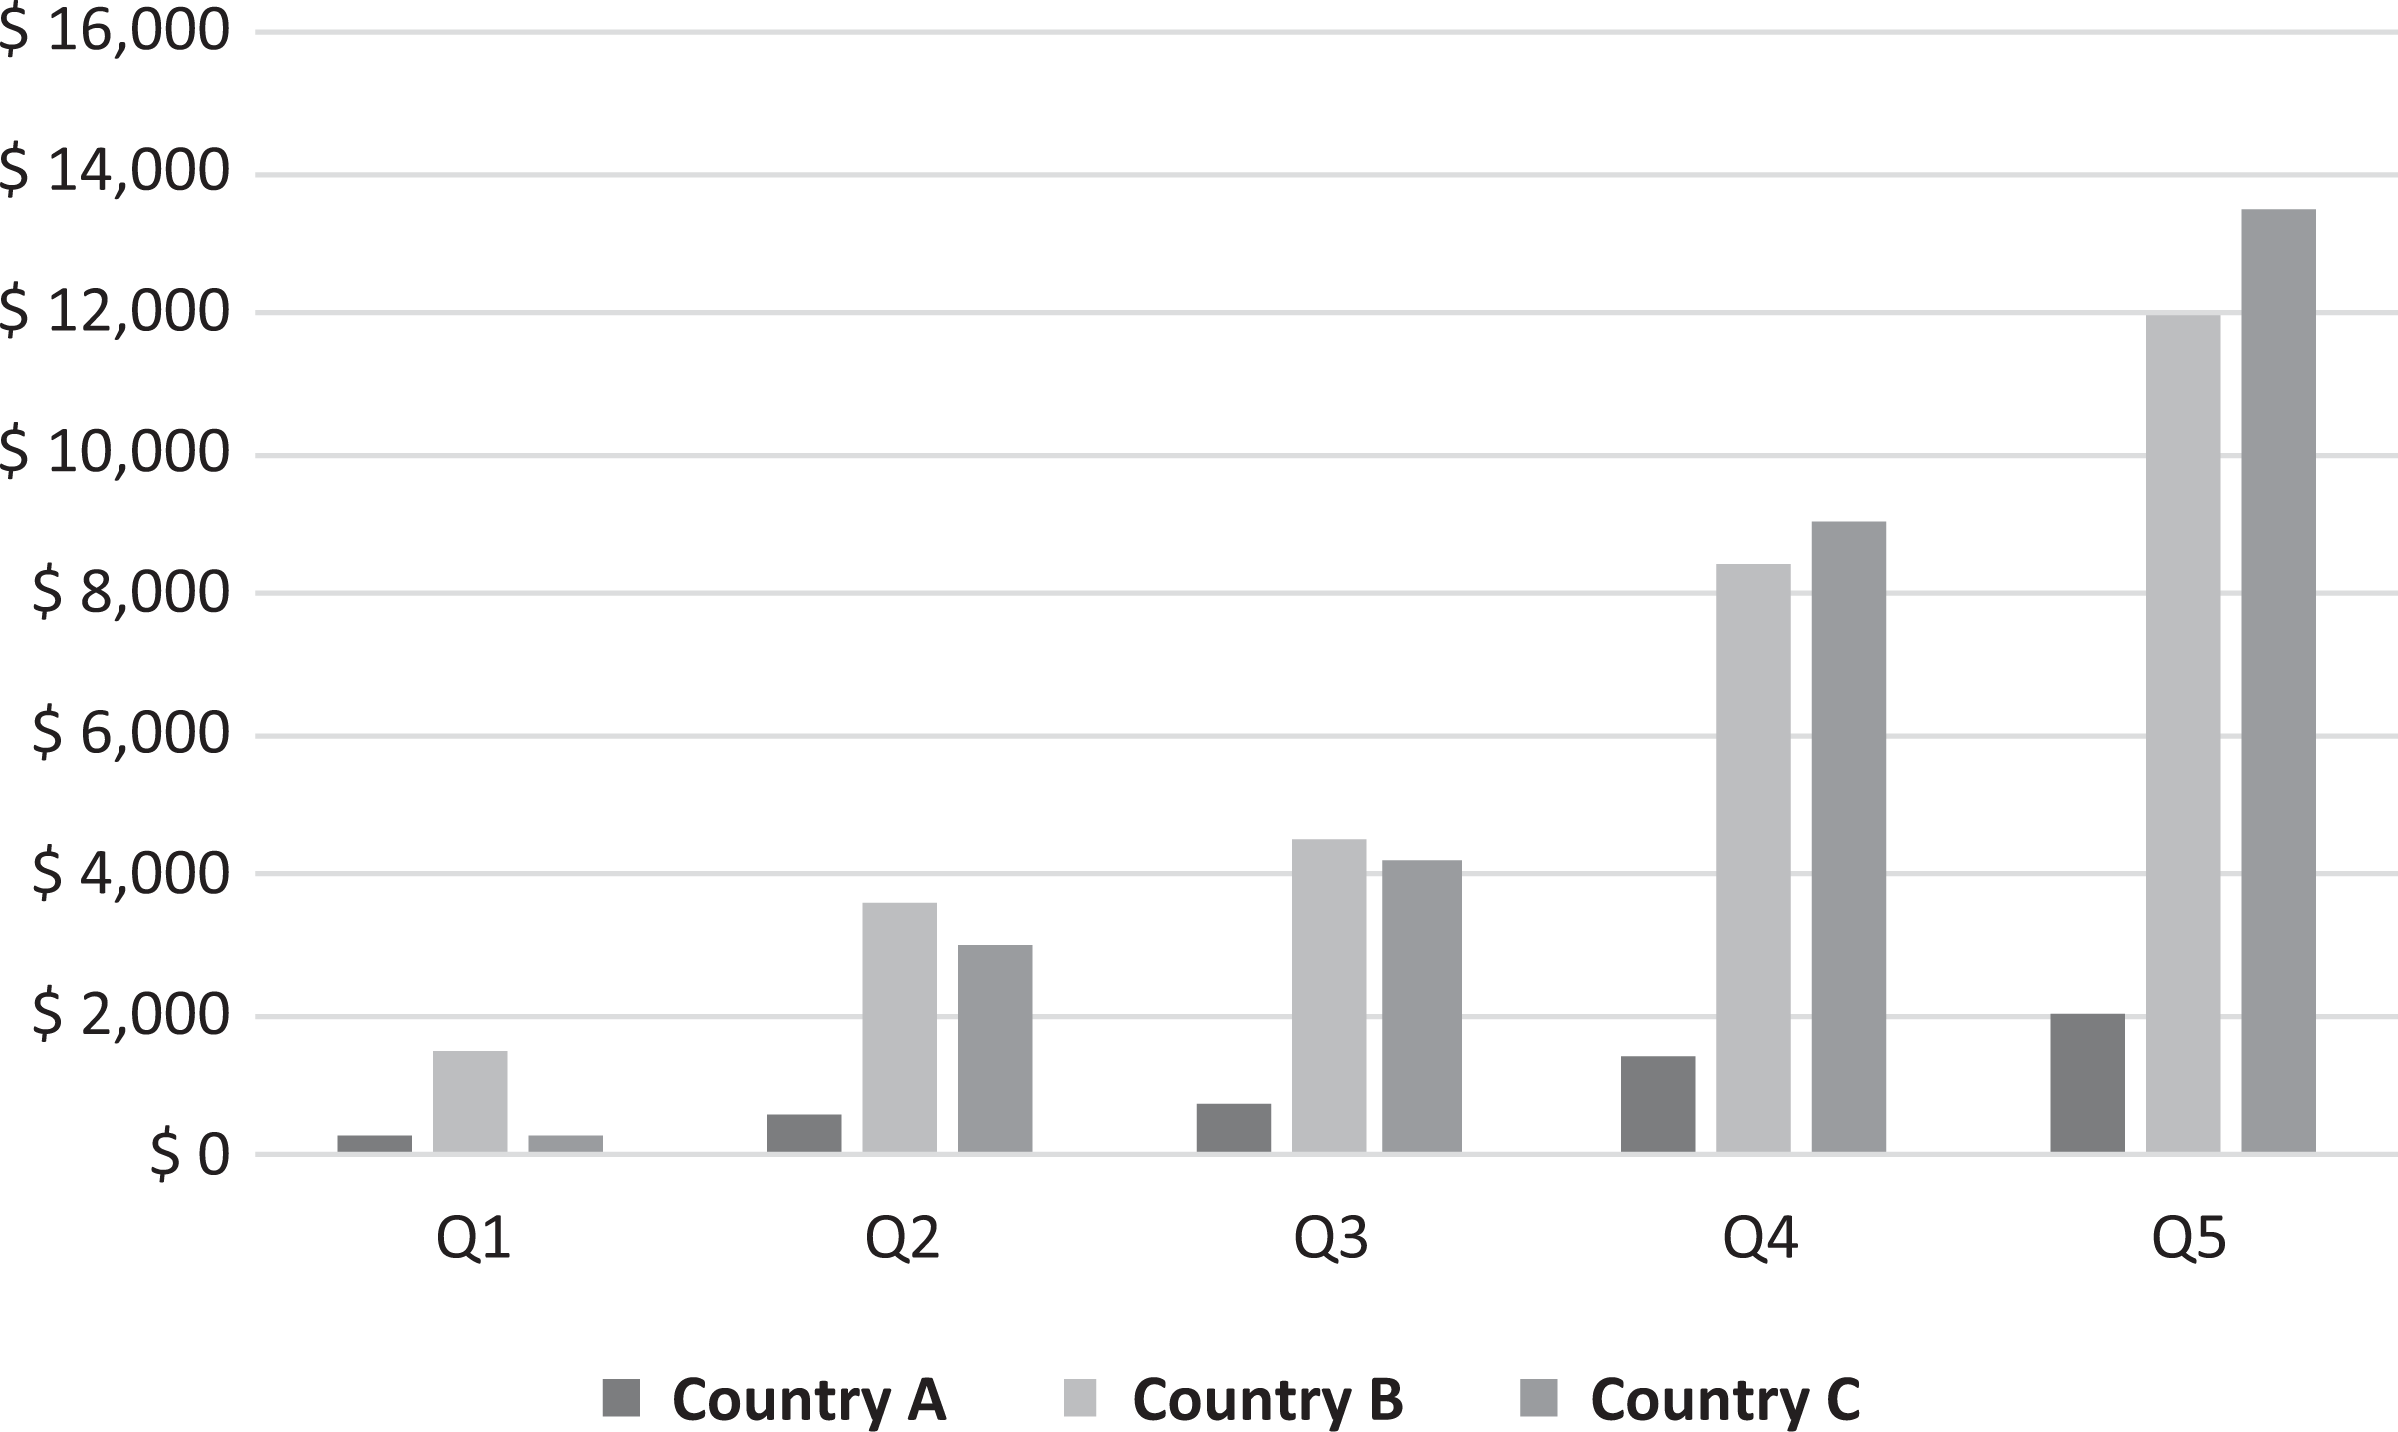
Absolute inequality: The interplay between relative income distribution and mean income. This figure shows the incomes of population quintiles of three fictional countries. The countries differ in their relative income distribution (quintile shares) or mean income. The mean income of Country A is $5,000, while that of countries B and C are $30,000. The respective quintile shares of Countries A and B are 5%, 12%, 15%, 28%, and 40%, while those of Country C are 2%, 8%, 10%, 30%, and 50%, respectively.
This stylized example suggests that returns from crime cannot be adequately captured when one focuses attention either on relative inequality or on mean income. Instead, it seems more appropriate to account for the interaction of these two variables. Precisely, this interaction between relative income distribution and mean income is captured by absolute inequality measures such as the absolute Gini (see Equations 1 and 2 in the next section for more details).
A second potential reason why rising absolute inequality might translate into higher crime rates is that it increases the de facto political power of the rich. The political power of different groups in society depends on their ability to organize and on the amount of money that they can spend on lobbying and bribery (Acemoglu & Robinson, 2008). Bartels (2008), Gilens (2012) and Gilens and Page (2014) show, for example, that in the United States, economic elites have a substantial impact on government policy, while the influence of average citizens and mass-based interest groups is limited. Higher levels of absolute inequality imply that the economic elite has access to more resources than the rest of the population (see Figure 2). These resources might be used to influence political and juridical institutions in ways that make them dysfunctional for large parts of society, which in turn can foster social strain.
However, as Scheve and Stasvage (2017) point out, so far, the evidence on this topic is limited. It is not clear when and why such institutional capture occurs and whether politicians and institutions in some countries might react differently to capture attempts than in others. Moreover, the extent of social strain that such capturing causes is not clear. Hence, this second potential mechanism is less straightforward than the first one. Nevertheless, it is beyond the scope of this article to establish which of these two potential mechanisms is more important, instead the aim of this article is to establish empirically if absolute inequality has a significant crime-inducing impact.
Research Design
As mentioned above, among the potential reasons for the divergent findings of cross-country studies could be issues regarding the reliability of crime data. Unfortunately, all existing crime databases provide very unbalanced data, and it is widely acknowledged that property crime data in particular suffer from methodological changes and different operational definitions between countries, reporting errors, and underreporting (Fajnzylber et al., 2002a, 2002b; Neapolitan, 1995; Soares, 2004b). Moreover, the significance of inequality as a correlate of crime can be influenced by the country sample used. For example, Neumayer (2005) shows that income inequality is a significant determinant of violent property crime rates when using a sample of 33 countries (as shown by Fajnzylber et al., 2002a, 2002b); however, its significance vanishes when the sample is broadened to 59 countries.
Considering these issues, we use Neumayer’s (2005) replication data set. 7 This data set provides 3-year averages of the number of robberies and violent thefts per one million inhabitants for 59 countries that were reported by the International Criminal Police Organization (Interpol) between 1980 and 1997 and also the data for most explanatory variables used. Its utilization does not solve the crime data issues, but it ensures that our results are not influenced by the data and sample used and that they are comparable with those of previous studies.
The major difference between this article and previous studies across countries is the use of absolute inequality measures. To be more precise, our main variables of interest are the absolute Gini and the variance (instead of the Gini Index) and the absolute per capita income differences between the top and bottom of the population (instead of top-to-bottom income ratios). The absolute Gini and the variance show inequalities within the entire distribution, while the income difference between the per capita income of the top and bottom proxies the income gap between low-income and high-income individuals. Especially with regard to the view that high top incomes might increase the de facto political power of the rich, the latter measure seems more salient than the ones that reflect the overall level of inequality.
The absolute Gini coefficient is calculated by multiplying the Gini coefficients with gross domestic product (GDP) per capita in 1997 purchasing power parity (PPP) (both variables are available in the replication data set).
8
The latter two are also used to calculate the top-to-bottom income distance and income ratio, given that the available data on income shares are very scarce for the period of interest.
9
Following Goda and Torres García (2017), we first estimate ventile income shares (

The usage of GDP per capita as proxy for personal mean income is in line with previous studies such as Sala-i-Martin (2006) and Pinkovskiy (2013). Please note that this approach has been criticized by authors like Anand and Segal (2008) and Milanovic (2002), which argue that it is inconsistent to combine the income distribution from household surveys with mean income from national accounts. Moreover, GDP per capita might not be always a good estimate of personal mean income, given that it entails retained earnings of corporations, depreciation, and in-kind benefits (on this point, see also Nolan et al., 2018). That is to say, the calculated absolute inequality measures are likely to have some (substantial) measurement error.
However, GDP per capita data has the advantage that it is available for the whole sample and that it presents income estimates that are based on a common methodology for all countries (both are not the case for household survey means). Moreover, it is not clear if the usage of household survey mean income would reduce the measurement error. It is well-documented that household surveys tend to underestimate capital income and income at the top of the distribution; thus, recent studies use national accounts data to adjust household survey income (see, e.g., Alvaredo, Chancel, Piketty, Saez, & Zucman, 2018; Goda & Sánchez, 2018; Lakner & Milanovic, 2016). Moreover, Nolan et al. (2018) find that in most Organisation for Economic Co-operation and Development (OECD) countries, there is little gap between the annual average growth rate of GDP per capita and household survey mean income. In other words, it seems reasonable to use GDP per capita as mean income proxy for our purpose.
To study the impact of these income inequality measures on violent property crime rates, the model specification is as follows:

where i represents country, t is time, vc is the logged rate of robbery and violent theft, c is a constant, INEQ are the abovementioned inequality measures,
Please note that all of the obtained absolute inequality measures are log-transformed due to their high variability across time and countries. As has been extensively reported by the time-series literature, this type of transformation stabilizes the variance of the series and thus improves the estimators (Box & Cox, 1964; Box, Jenkins, Reinsel, & Ljung, 2016) and the series forecast (Lütkepohl & Xu, 2012; Proietti & Lütkepohl, 2013).
The data of the control variables used are also retrieved from the replication data set. Among them are the unemployment rate, female labor force participation rate, proportion of males in the 15–64 age-group, polity measure of democracy, and a measure of human rights violations (Purdue’s Political Terror Scales). The literature often relates the first three variables with higher levels of anomie and crime rates in a society, whereas higher levels of democracy might lower (when they increase the respect for the rights of others) or raise (autocracies might more successfully suppress unwanted social behavior) the incidence of violent crime. Human rights violations, on the other hand, are unanimously seen to raise violent crime rates given that they set a bad example and increase social strain (Neumayer, 2003).
Next to these variables, low income per capita and low growth rates can foster violent crime rates (Neapolitan, 1995; Sun et al., 2011). Hence, we also control for GDP per capita growth and urbanization rates. The latter is used as a proxy for mean income to avoid multicollinearity issues on the grounds that we use GDP per capita to calculate all absolute inequality measures. It is well-documented that the level of income and urbanization is highly correlated (Acemoglu, Johnson, & Robinson, 2002, 2005). 12 Additionally, we include the squared term of the urbanization rate because previous research suggests that the level of development has a nonlinear effect on property crime rates (Bennett, 1991; Neumayer, 2005).
Moreover, we also consider poverty rates (retrieved from Povcal) to ensure the robustness of our results. Some previous research argues that it is mainly the poor who gain from committing property crime and that poverty in particular increases the level of deprivation and thus crime (see Bourguignon, 2000; Sun et al., 2011). In line with the second argument, Pridemore (2008, 2011) shows that the positive effect of relative inequality on homicide rates across countries vanishes when poverty is considered as an alternative explanatory variable.
The descriptive statistics of all variables considered are reported in Table 1. In line with Figure 1, the corresponding correlation matrix of these variables suggests that the absolute inequality measures are much more strongly positively correlated with violent crime rates than the relative ones (Table A1 in the Appendix).
Descriptive Statistics of the Variables Used.
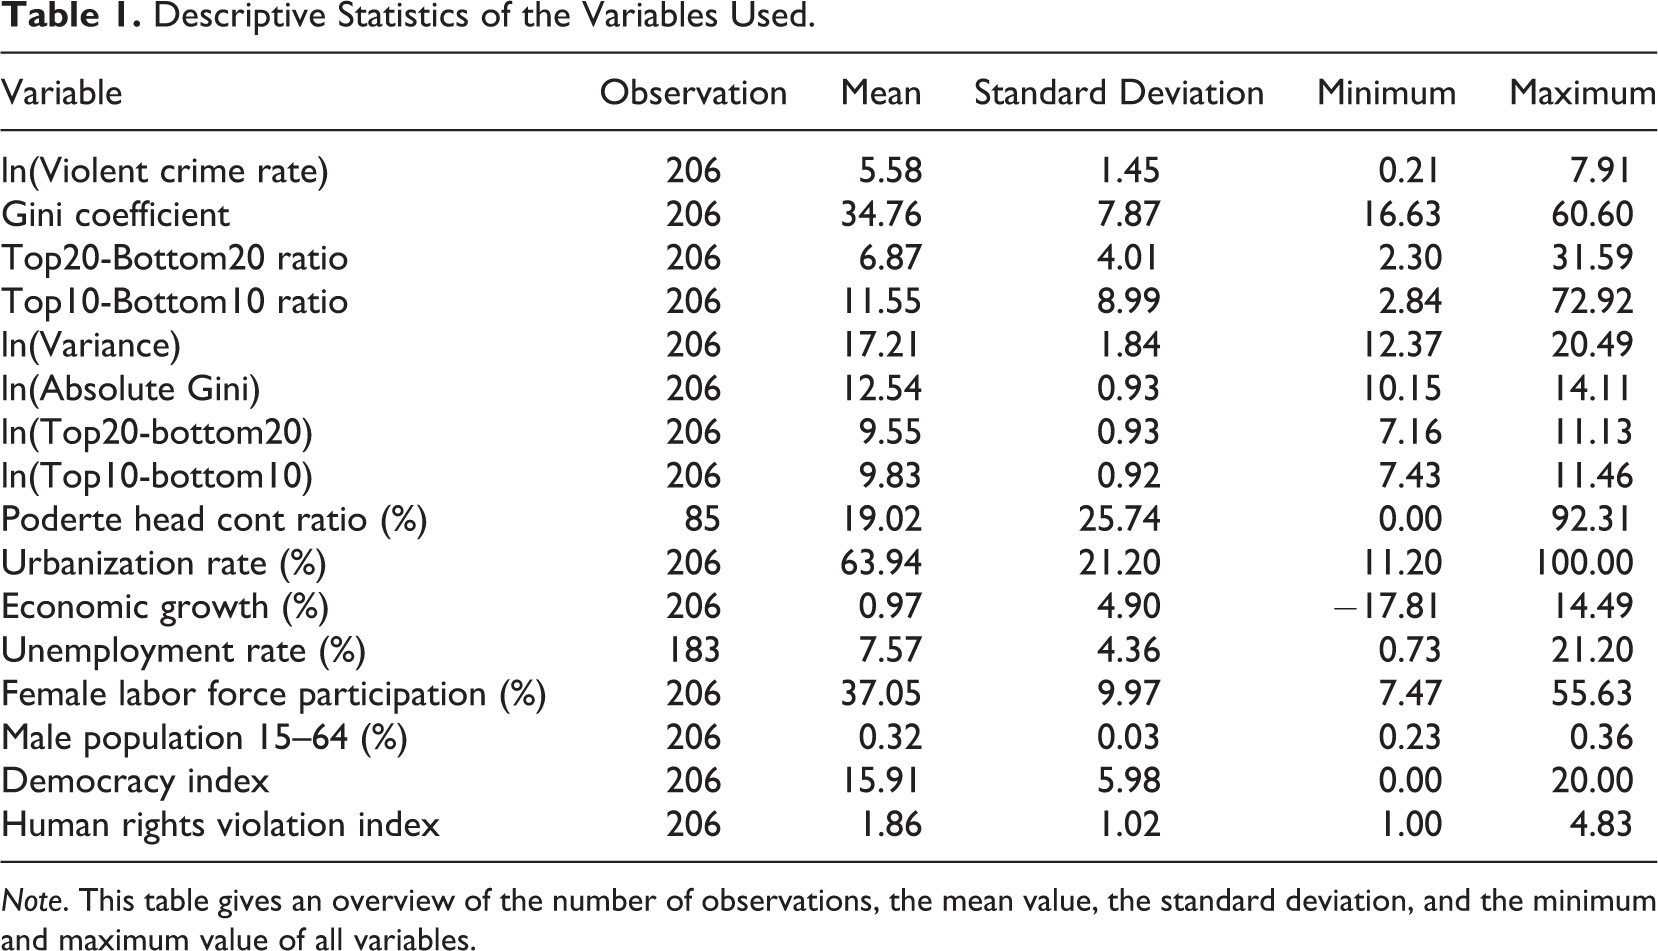
Note. This table gives an overview of the number of observations, the mean value, the standard deviation, and the minimum and maximum value of all variables.
Finally, it is important to point out that we use fixed-effects panel data regressions. 13 In theory, these regressions could face a potential simultaneous causation issue between crime and inequality, although it seems rather unlikely that the amount of crime is sufficiently large to influence the general inequality structure in the country. In any case, it is reasonable to assume that inequality in year t is not affected by crime rates in year t + 1, that is, that crime rates are weakly exogenous (Fajnzylber et al., 2002a, 2002b; Neumayer, 2005). Hence, we use lagged values of inequality in a robustness check in order to test whether the results might be biased because inequality is correlated with the error term due to simultaneity. The results of this exercise are only indicative that the findings are not influenced by simultaneity, but given the relatively few observations and unbalanced sample at hand (and considering that we are not aware of an adequate instrumental variable for absolute inequality), we think it is the best we can do. 14
The Impact of Absolute Income Inequality on Violent Property Crime
Table 2 presents the estimation results for the Gini coefficient, the absolute Gini, and the variance for a reduced sample size of 33 countries, with the aim of considering only those countries that are included in Fajnzylber et al. (2002a, 2002b). In agreement with Fajnzylber et al. and Neumayer (2005), we find that for this sample, the Gini coefficient has a positive sign and is statistically significant. The same is true for the two absolute inequality measures.
The Effect of Inequality on Violent Property Crime Rates (33 Countries).
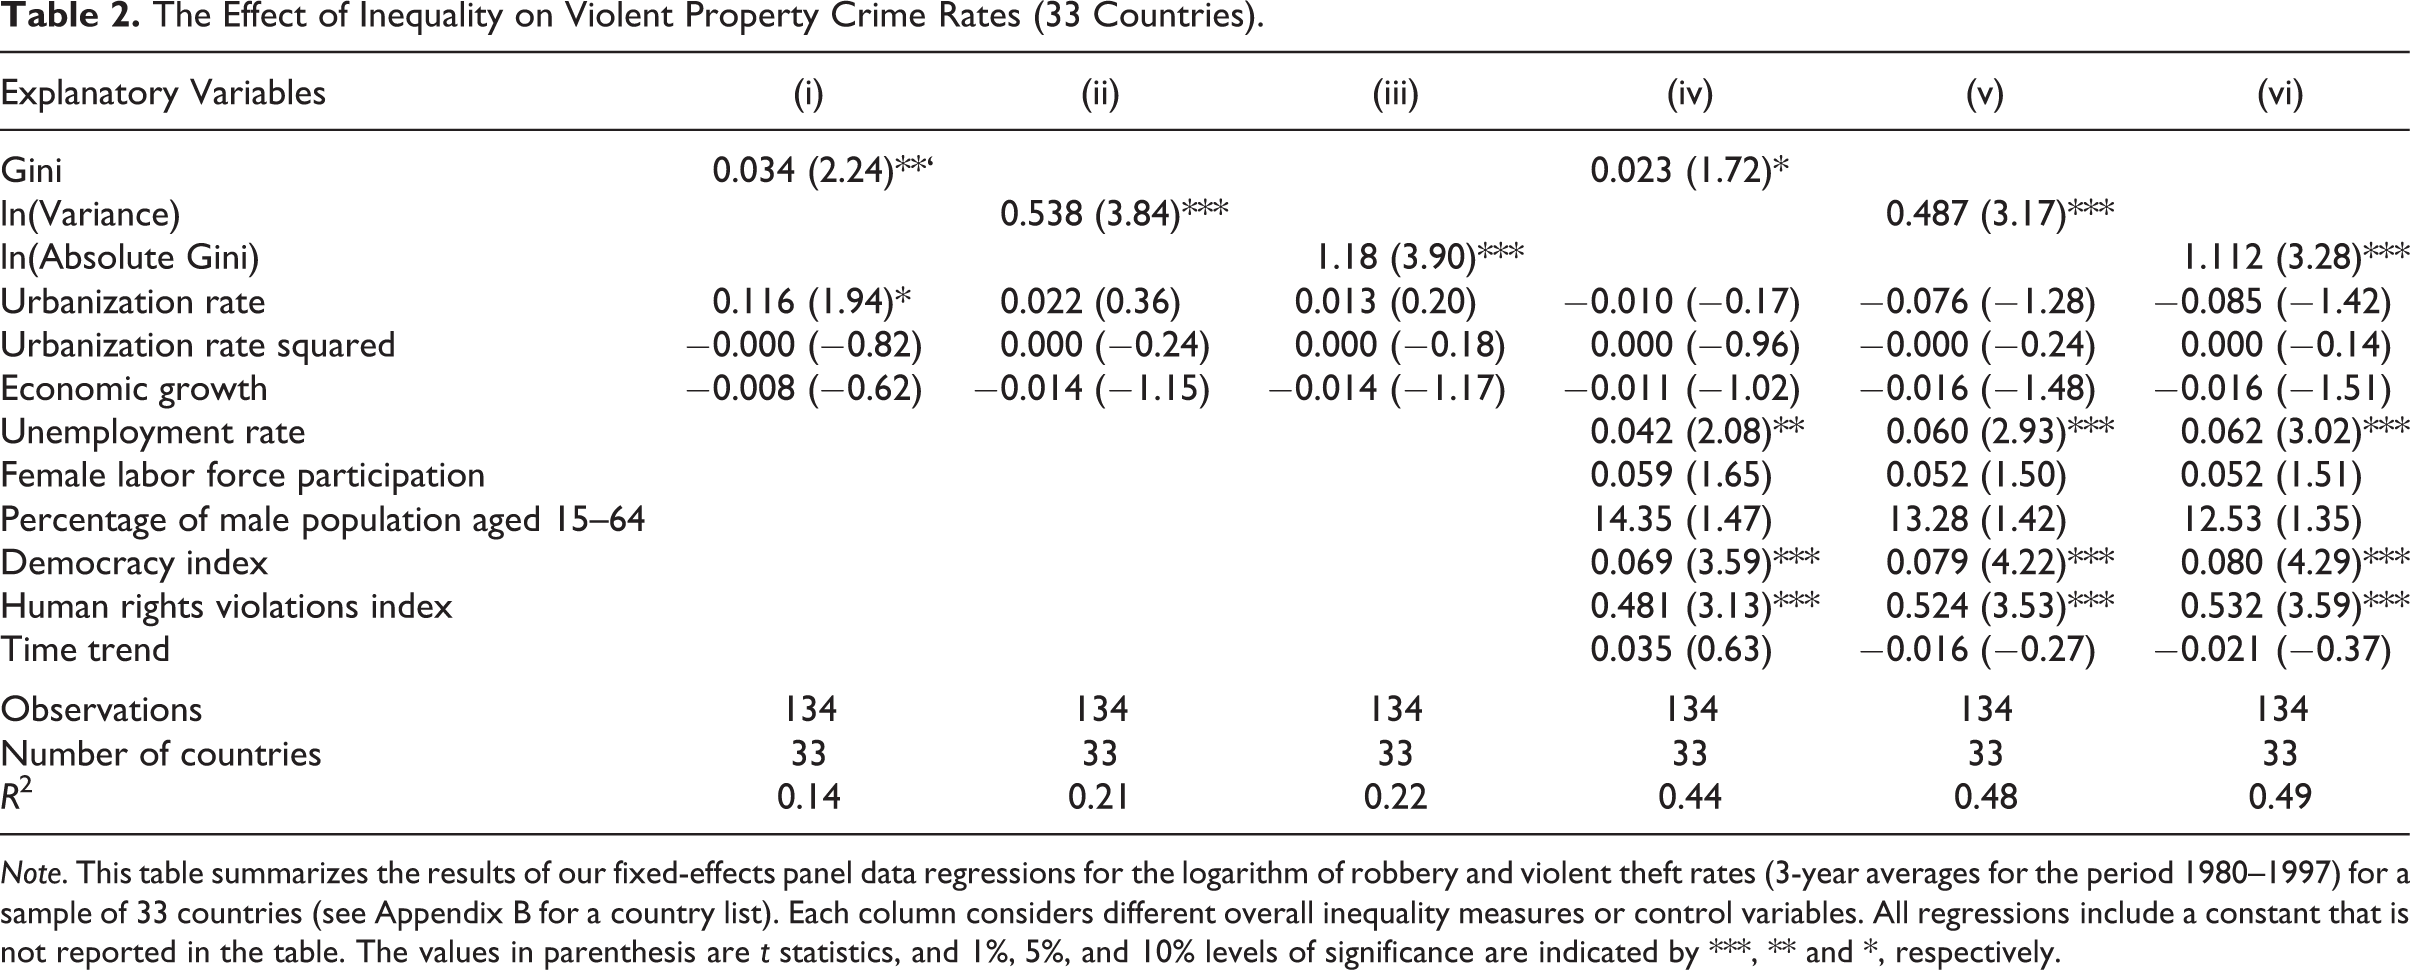
Note. This table summarizes the results of our fixed-effects panel data regressions for the logarithm of robbery and violent theft rates (3-year averages for the period 1980–1997) for a sample of 33 countries (see Appendix B for a country list). Each column considers different overall inequality measures or control variables. All regressions include a constant that is not reported in the table. The values in parenthesis are t statistics, and 1%, 5%, and 10% levels of significance are indicated by ***, ** and *, respectively.
Although the absolute measures have a higher statistical significance than the Gini coefficient (1% vs. 10% level of significance when all control variables are considered), it can be concluded that with a reduced sample size, the use of relative or absolute inequality measures qualitatively leads to the same result. Other important variables to explain violent property crime are the unemployment rate, the level of democracy, and the degree of human rights violation in the country. All of these control variables have a plausible positive sign.
When the artificial sample size restriction is lifted and the entire sample of 59 countries is considered, the significance of the Gini coefficient vanishes when all control variables are considered (as reported by Neumayer, 2005). On the contrary, the effect of the absolute Gini and the variance stays positive and significant at least at the 5% level (Table 3). In addition, higher unemployment and female labor force participation rates, as well as higher degrees of democracy and human rights violations, foster violent property crime. The R 2 value of approximately .40 in Models (v) and (vi) suggests that the variation in violent property crime rates is explained reasonably well by all of these variables.
The Effect of Inequality on Violent Property Crime Rates (59 Countries).
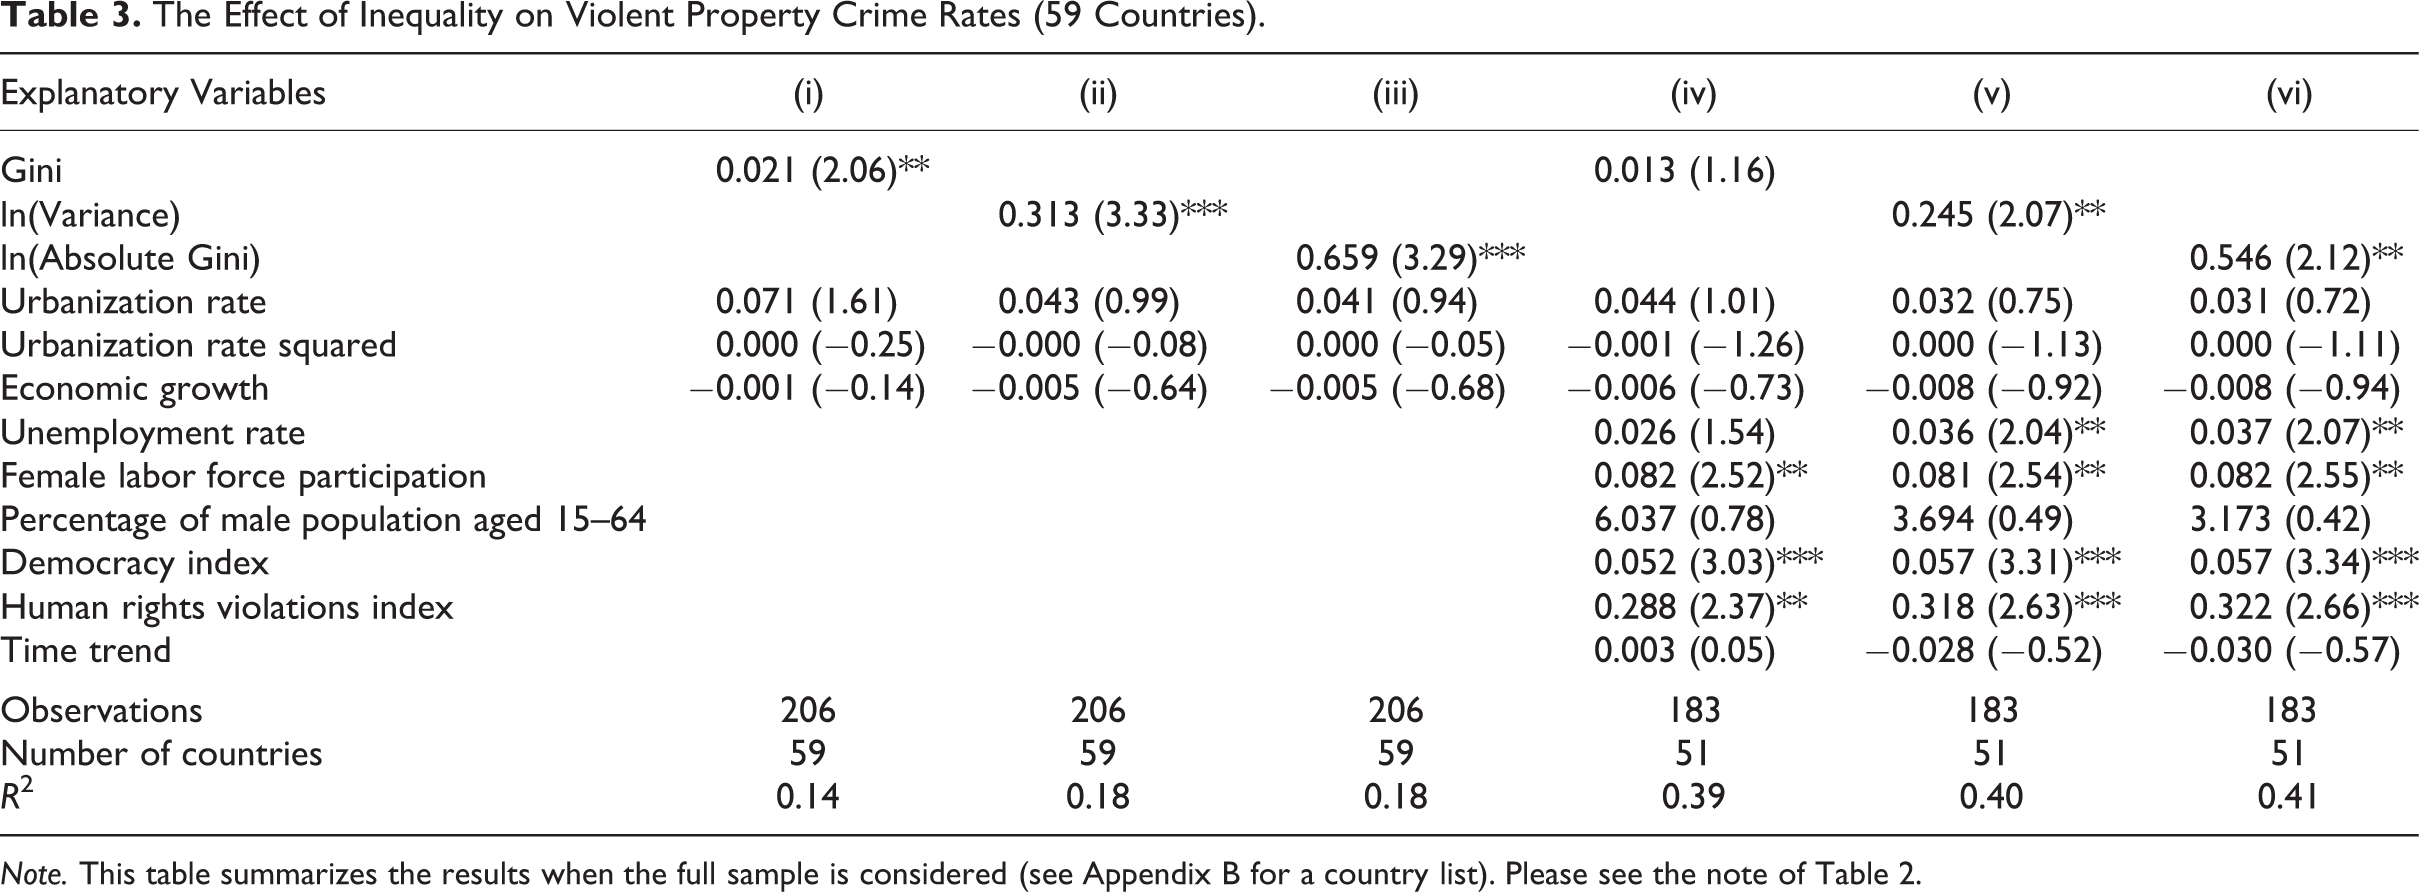
Note. This table summarizes the results when the full sample is considered (see Appendix B for a country list). Please see the note of Table 2.
In terms of magnitude, the results suggest that a 1% increase in the absolute Gini (variance) leads to an average increase in the robbery and violent theft rate of approximately 0.55% (0.25%) when all control variables are considered (see Models v and vi of Table 3). These magnitudes seem reasonable. For example, if the United States (with more than 2,000 violent crimes per one million inhabitants in 1995) would like to achieve the same crime levels as Sweden (approximately 720 in 1995) choosing the lowering of inequality as a policy instrument, they would need to decrease their absolute Gini by approximately 64%. 15 Please note that this example is just illustrative, given that the coefficients’ sizes are not likely to be very precise due to the discussed crime data issues and the unbalanced sample. Moreover, the validity of this example rests on the ceteris paribus assumption, and it is unlikely that the other explanatory variables would stay constant when inequality would decrease substantially.
Table 4 indicates that our main finding that absolute inequality fosters violent property crime is not likely to be influenced by simultaneous causation. The lagged value of the variance and absolute Gini is significant in all specifications presented. Interestingly, the Gini coefficient is also significant when introduced with a lag; but, taking into account the other results, the absolute measures can still be considered to be more robust inequality proxies than the Gini. It is important to stress that the reduced observation size leads to efficiency losses and that Table 4 only provides suggestive evidence that the results of Tables 2 and 3 are not influenced by simultaneity.
The Effect of Lagged Inequality on Violent Property Crime Rates.

Note. This table shows the results when considering the lagged value of the overall inequality measures. Please see the note for Table 3.
As a second robustness check, we repeat the analysis of Table 3 using alternative inequality measures that consider the income differences between the poor and the rich (Table 5). As mentioned above, these inequality measures might be more adequate to reflect the de facto political power of the rich compared to that of the poor. The obtained results with these measures are very similar to that of the overall inequality measures. To be more precise, the top-bottom income ratios are not significant, whereas the income difference between the Top 20% and Bottom 20% (Top 10% and Bottom 10%) are significant at the 5% level. Furthermore, the magnitude is very similar to that of the absolute Gini. That is, a 1% increase in the absolute income difference between the top and bottom income earners leads to a .54% (.51%) increase in the violent property crime rate (ceteris paribus). This similarity in the results is not surprising given the very high correlation between all of the absolute inequality measures (see Table A1 in the Appendix).
The Effect of Top-Bottom Income Differences on Violent Property Crime Rates.
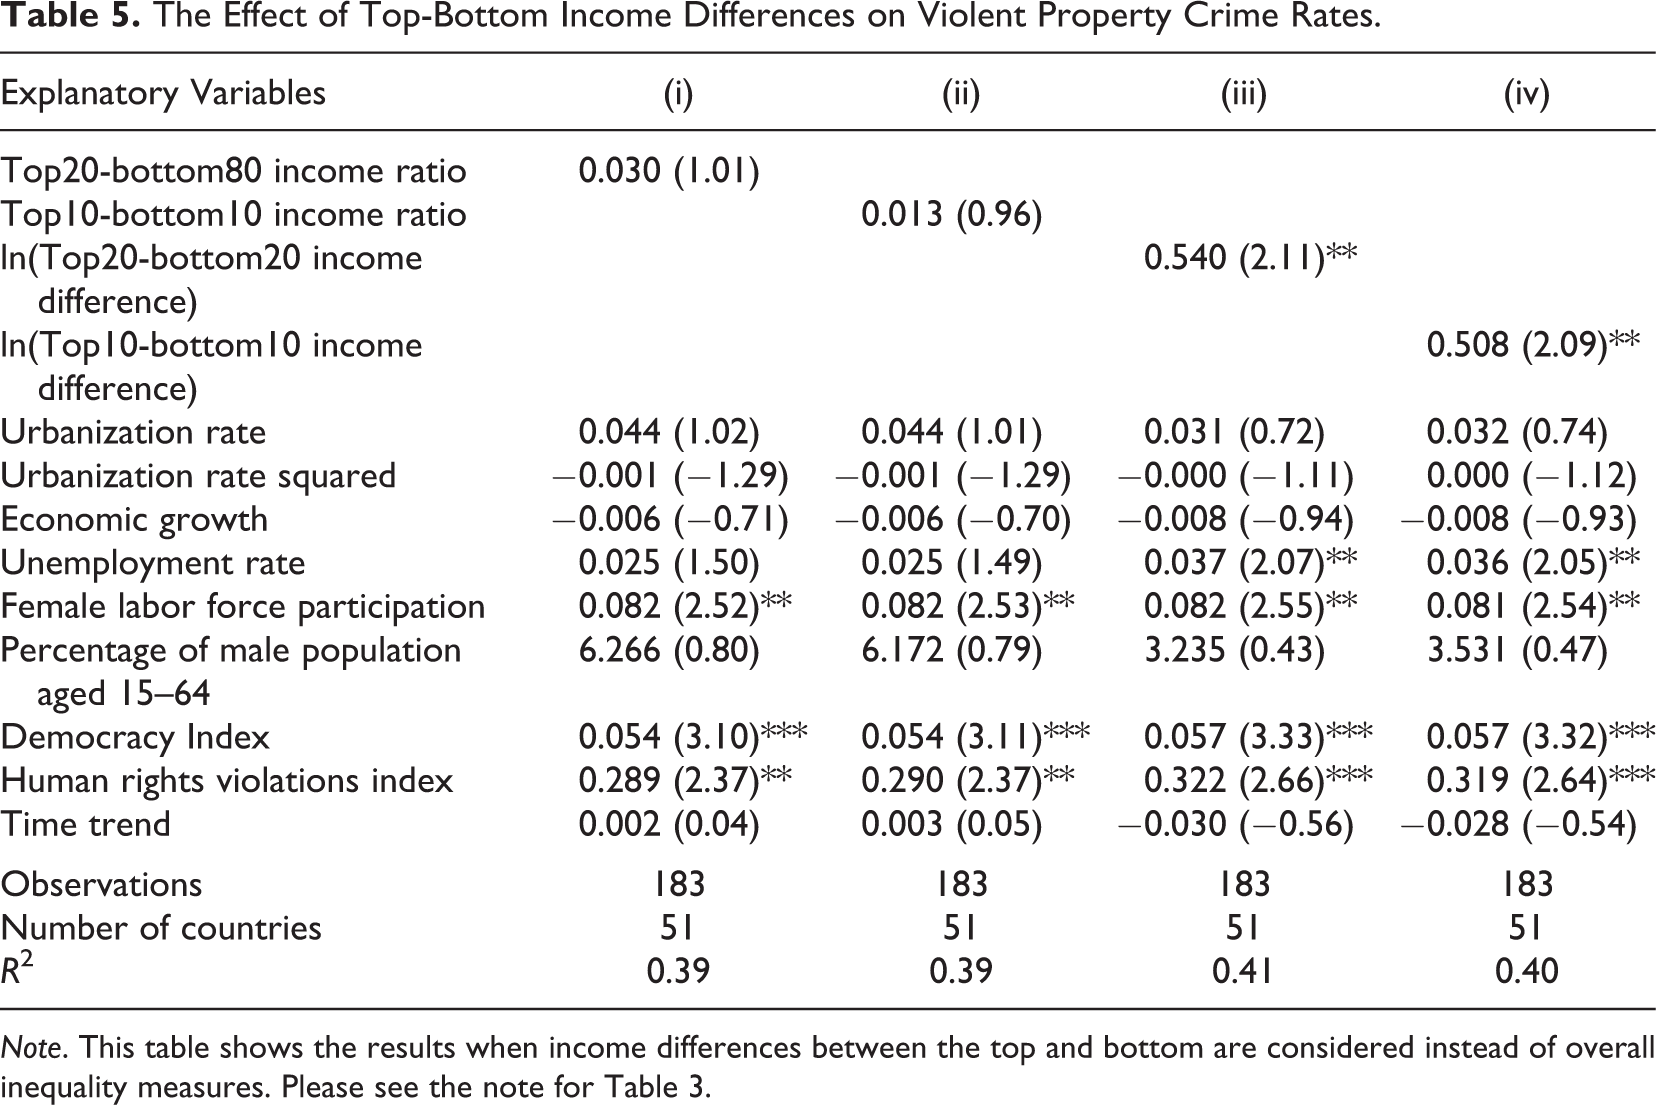
Note. This table shows the results when income differences between the top and bottom are considered instead of overall inequality measures. Please see the note for Table 3.
As a final robustness check, we verify whether the results hold when poverty is introduced as a control variable, given that Pridemore (2008, 2011) finds that the significant effect of relative inequality on homicide rates across countries vanishes when this variable is considered as an additional explanatory variable (please note that due to the limited data availability, the inclusion of poverty rates substantially reduces the sample size). The results of Table 6 suggest that the same is not the case when considering violent property crime rates: The variance, absolute Gini, and the two top-bottom income difference variables stay significant at the 5% level. Accordingly, one can conclude that absolute inequality is a robust and important determinant of violent property crime rates at the cross-country level.
The Effect of Absolute Inequality When Also Considering Poverty.
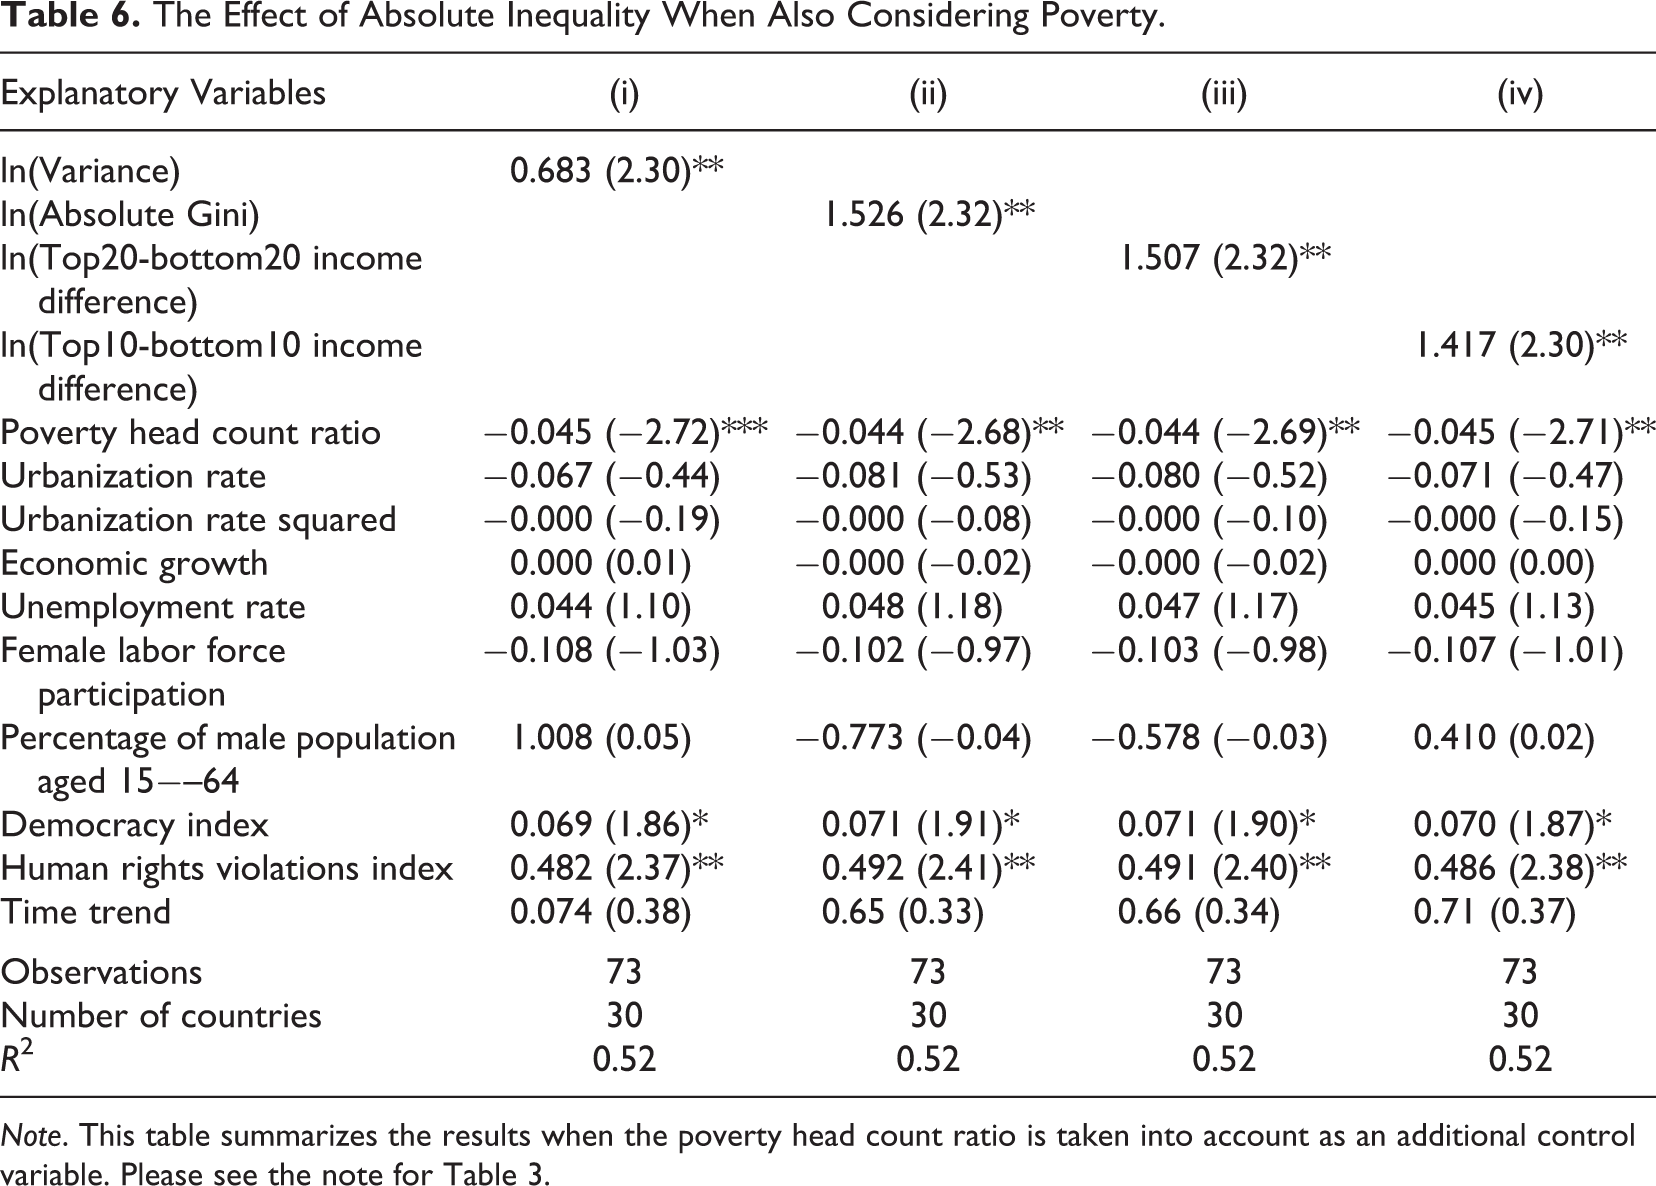
Note. This table summarizes the results when the poverty head count ratio is taken into account as an additional control variable. Please see the note for Table 3.
Finally, it is important to note that higher poverty rates seemingly reduce property crime rates. Next to data issues, potential explanations for this surprising result might be that very poor people are unlikely to travel to richer neighborhoods to commit property crimes and/or that high levels of poverty foster the expenditure of the rich to protect themselves against crime, which in turn reduces the potential returns from crime (see Chintrakarn & Herzer, 2012). However, given that our variable of interest is income inequality, it is beyond the scope of this article to investigate potential reasons in more detail.
Conclusions
Our key finding is that, in contrast to relative inequality, absolute inequality is a significant and robust determinant of robbery and violent theft rates. This result holds irrespective of whether absolute inequality is measured by the absolute Gini, the variance, or by per capita income differences between top and bottom percentiles. This finding indicates that the omission of absolute inequality measures in empirical studies on the correlates of crime is a major shortcoming, which can lead to incorrect conclusions about the impact of inequality on crime. Other important correlates of crime are unemployment, female labor force participation, democracy levels, and human rights violations.
We offer two theoretical explanations for this finding. First, high absolute inequality levels imply high potential returns from property crime. Second, high incomes at the top might increase the de facto political power of the rich, which can make institutions dysfunctional for society as a whole. Unfortunately, the available data in the used cross-country setting impede us in identifying the exact mechanisms that explain our key finding. From our point of view, an important and interesting avenue for future research would be to identify the main mechanisms that explain why absolute inequality fosters property crime.
The scarcity and relatively poor quality of the existing property crime data means that the results presented here have to be treated with caution. Future research should verify our findings by considering both relative and absolute inequality measures when studying the effect of inequality on property crime in cross-country settings or single-country studies. A further limitation of this study might be that we assume inequality to be weakly exogenous (due to the relatively few observations and the lack of a reliable instrumental variable). In our opinion, it is unlikely that the amount of crime is sufficiently large to influence the general inequality structure in the country, but future research might want to explore this matter in more detail.
Footnotes
Appendix
Acknowledgments
We are grateful to Angelica Sanchez and Alfredo Villca for their outstanding research assistance. Furthermore, we would like to thank three anonymous referees, Andrés Ramirez, Gustavo Canavire, the participants of the conference “Inequality, Trust and Ethics: Insights from Economics and Behavioral Ethics” (hosted by the University of Notre Dame in London in May 2015), and the participants of the Economics Seminar at the Universidad Javeriana in Bogotá for their helpful comments. We gratefully acknowledge funding for research assistance from Colombia’s Administrative Department of Science, Technology and Innovation (Colciencias; grant number 645).
Declaration of Conflicting Interests
The authors declared no potential conflicts of interest with respect to the research, authorship, and/or publication of this article.
Funding
The authors disclosed receipt of the following financial support for the research, authorship, and/or publication of this article: This work was supported by Departamento Administrativo de Ciencia, Tecnología e Innovación (Award ID 645).