
Abstract
Competitive intelligence is essential for operations management decision-making. Beyond traditional offline information channels, firms increasingly gather online data and resources to generate comprehensive competitive intelligence. This study derives competitive intelligence in large markets by developing an interpretable machine learning framework that integrates multifaceted user behavior data, including user favorites, user-commented products, and user textual comments. Considering the complementary nature of these data sources, we first combine latent features derived from user favorites and user-commented products to improve submarket inference. Using these inferred submarkets as supervised signals, we connect user-commented products and associated textual comments to uncover consumer perceptions. We estimate the model using multifaceted data on online user behavior in the automotive domain. The results demonstrate that our model effectively improves submarket identification, captures consumer perceptions, and predicts competitive positions for new entrants. The derived competitive intelligence helps managers make more informed decisions in product operations and marketing strategies.
Introduction
Sun Tzu, The Art of War
Firms are constantly looking for competitive intelligence to improve business operations (Kumar et al., 2020). Effective competitive intelligence enhances a firm's strategic position, but achieving this requires understanding the market from the perspectives of its competitors and consumers. Insights generated by consumers have proven valuable for providing competitive intelligence that helps businesses survive and succeed (DeSarbo et al., 2006; Netzer et al., 2012). To maximize the effectiveness of operations management strategies, this study integrates multiple types of online user behavior data, including user favorites, user-commented products, and textual comments, to offer managers a more complete picture of their competitive landscape.
The value of user-generated content (UGC) for competitive analysis is well established. Research has shown that online reviews and search logs contain rich information about consumer preferences and competitive dynamics (Bernstein et al., 2019; Chen et al., 2020). Previous UGC-based studies assumed that products that co-occurred in a single review or search session are potential competitors and applied clustering methods (e.g., K-means or community detection) to infer market structure (Netzer et al., 2012; Ringel and Skiera, 2016). Additionally, based on the unstructured text (e.g., review contents and social tags), several studies used Natural Language Processing (NLP) methods (e.g., rule-based text mining and latent Dirichlet allocation [LDA]) to analyze latent dimensions or aspects in which the target product and its competitors compete (Liu et al., 2021; Nam et al., 2017; Ye et al., 2022).
While these methods provide valuable and distinctive insights, several challenges remain. First, competitive information is typically scattered across multiple data sources. Individual data sources only provide partial insights. For example, online reviews rarely contain direct comparisons between competing products; a review is unlikely to explicitly compare a Tesla Model 3 with a BMW i4. This creates a sparsity problem in co-occurrence when inferring competitive relationships, particularly for niche products or new market entrants. Second, managers need clear competitor identification and a deep understanding of consumer perceptions, but existing approaches struggle to provide both simultaneously. Some researchers (Tirunillai and Tellis, 2014) have focused on extracting product attributes and perceptions from online reviews, but limited their analysis to predetermined sets of competing products. Others (Liu et al., 2019; Netzer et al., 2012; Ye et al., 2022) use a two-stage approach, first clustering products into competitive groups and then analyzing perceptions within those groups. However, this sequential approach means that errors in identifying competitive relationships can significantly impact the subsequent analysis of consumer perceptions. Third, competitive landscapes are constantly evolving as new products enter the market. While recent studies have made progress in analyzing market structure, predicting competitive positions for new entrants remains challenging. This is particularly true in markets with rapid product innovation and changing consumer preferences, where historical patterns may not fully capture emerging competitive dynamics.
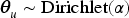
To tackle these challenges, we develop an interpretable machine learning approach. This approach leverages the complementary nature of multifaceted user behavior data, including (1) user favorites, (2) user-commented products, and (3) user textual comments, as illustrated in Figure 1. Specifically, we combine user favorites and user-commented products to improve market-structure inference, as they capture different stages of the consumer decision process. In our context, user-commented products referring to products mentioned in user comment threads, represent early-stage exploration behaviors. These products indicate that users are actively gathering information or discussing options, reflecting a broader set of items that have attracted attention. In contrast, user favorites could suggest that consumers may have narrowed their choice set and are closer to making a purchase decision. For example, in Figure 1, we observe that the user-commented products partially overlap with those in the user favorites (e.g., Audi A5, BMW 3) while also including additional options (e.g., BMW 5). 1 We posit that by integrating these complementary signals, we can mitigate potential biases or blind spots that may arise from relying on a single data source (Ouyang et al., 2018; Pant and Sheng, 2015).
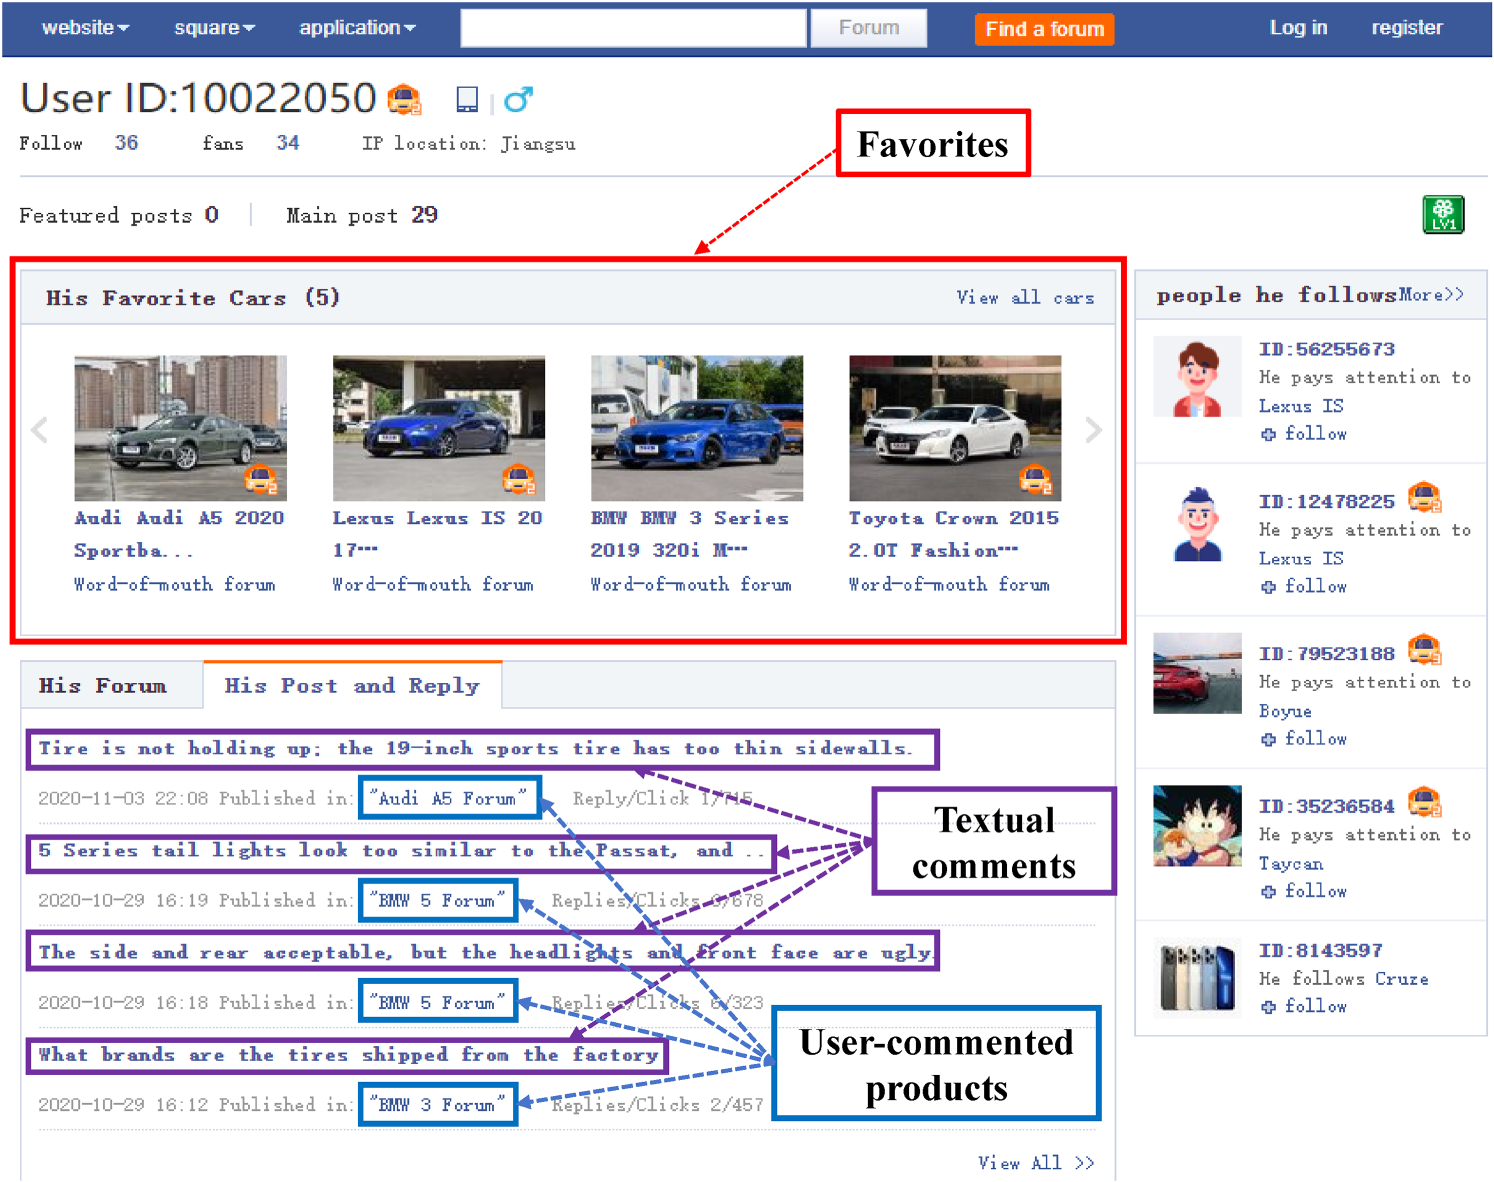
The interactions between users and products on the website.
To extract user perceptions of competitive products, we establish conditional connections between user-commented products and their corresponding textual comments. These connections allow us to analyze how consumers compare competing products and what attributes drive their evaluations. Specifically, the textual comments (i.e., labeled by the purple square in Figure 1) often contain rich information about specific product features and competitive factors. For example, in Figure 1, we observe that this user places significant emphasis on the configuration (e.g., tire size and brand) and appearance (e.g., front face and headlights) when considering rival cars to the Audi A5, BMW 3, and BMW 5. Furthermore, textual comments capture user sentiment, showing the factors influencing preferences and aversions toward a product.
To implement this integrated analysis, we propose the Hierarchically LDA (HLDA) model, which extends classical topic modeling approaches to incorporate multifaceted user behavior data. HLDA is built upon unsupervised topic models, namely LDA (Blei et al., 2003) and Correspondence LDA (Blei and Jordan, 2003). Specifically, to infer the market structure, we extend LDA by introducing a two-component mixture strategy to embed latent features and allocate user-commented products to distinct competitive submarkets. This extension uses latent features from favorites to improve submarket inference while also considering how products are discussed together in comments. Additionally, based on the latent features of current products and inferred submarkets, HLDA can predict competitive positions for new entrants. To further extract consumer perceptions, we extend Correspondence LDA to model the conditional relationship between submarkets derived from user-commented products and their associated textual comments. Through this extension, the model identifies latent topics from textual comments, which we interpret as competitive dimensions. These competitive dimensions capture the specific product attributes that consumers consider when comparing products within each submarket.
We apply the HLDA to a large-scale dataset with 324,641 favorite lists and 354,703 user-commented products. We evaluate the model through a set of focused analyses that demonstrate its ability to improve submarket identification, capture consumer perceptions, and predict competitive positions for new entrants. Additional validation through simulations, benchmark comparisons, and external data further supports the robustness of our approach. Overall, the results highlight the value of integrating multifaceted UGC signals for competitive intelligence.
This research makes the following contributions to the existing literature: (1) We explore the value of integrating multifaceted UGC information for competitive intelligence analysis. Existing literature has focused on extracting insights from single data sources, for example, online reviews to identify competing products (Netzer et al., 2012), search logs to map market structure (Ringel and Skiera, 2016), or textual comments to understand consumer perceptions (Tirunillai and Tellis, 2014). Our study demonstrates how combining different types of UGCs can provide a more complete picture of market competition. By analyzing the complementary relationships among user favorites (which reflect serious consideration), commented products (which capture broader attention), and textual comments (which provide context), we develop a more comprehensive understanding of product competitive relationships and consumer perceptions. (2) Our methodological contribution lies in developing an interpretable machine learning approach for analyzing multiple data types. From a technical perspective, we extend LDA to integrate user favorites with user-commented products, improving submarket inference. To extract consumer perceptions, we leverage Correspondence LDA by modeling the conditional relationship between user-commented products and their associated textual comments. The data integration strategies developed could serve as a template for operations management and marketing researchers seeking to analyze various complementary data sources.
Market structure analysis involves understanding the competitive relationships between products and how these relationships influence firm operations (Cooper and Inoue, 1996). The analysis can be constructed from either a supply or a demand perspective. The supply side determines whether the products are substitutes based on firm characteristics, strategy, performance, and managerial cognitions (Voleti et al., 2015), while the demand side assesses them through consumer perceptions (DeSarbo et al., 2006). In recent years, demand-side analyses have gained prominence as they directly reflect how consumers evaluate and choose between products in real decision-making scenarios.
The proliferation of online platforms has transformed how firms conduct market competition analysis. The Internet enables the timely analysis of market competition through UGCs. For example, early work has presented methods for extracting consideration sets to map market structure using online reviews (Netzer et al., 2012). However, such analyses can be challenging since it is rare for two competing entities to be cited in the same sentence fragments in online reviews (Valkanas et al., 2017). For instance, it is uncommon to see reviews stating, “Toyota is better than Honda.” To quantify this challenge, we collected consumer reviews on edmunds.com and autohome.com and found only 1.1% and 0.13%, respectively, of total reviews mentioned more than one car. This sparsity makes it difficult to reliably infer competitive relationships from reviews alone.
Rather than relying solely on textual reviews (i.e., Netzer et al. (2012)) to extract competitive products, we combine user-commented products and favorite lists to analyze market structure. This integration helps overcome the data sparsity issues associated with online reviews. Subsequent studies have explored different types of UGCs, including consumer search (Ringel, 2023; Ringel and Skiera, 2016), purchase records (Gabel et al., 2019), brand-user networks (Yang et al., 2022), and user favorites (Liu et al., 2020), to analyze market competition. While these data sources provide valuable insights, they often capture different aspects of consumer decision-making. Our work advances this literature by examining how multiple UGC types can be integrated to provide complementary perspectives on competition, rather than treating each data source in isolation.
In addition, this study is related to the literature on topic models. Recent studies have used LDA-type models to extract latent topics from unstructured textual and multimodal data for applications such as identifying influential users (Igarashi et al., 2025), analyzing consumer engagement on social media (Liu et al., 2025), inferring purchase intentions (Li and Ma, 2020), and forecasting sales based on sentiment signals (Lau et al., 2018). Building on this stream of research, we extend LDA (Blei et al., 2003) and Correspondence LDA (Blei and Jordan, 2003) to address the requirements of market-structure analysis. First, we use an embedding method to extract the latent features from user favorites. Unlike traditional approaches that analyze only textual content, we apply embedding techniques to capture competitive relationships from behavioral data. Then, we incorporate latent features and user-commented products into LDA to enhance submarket inference. Second, we extend the Correspondence LDA to establish the conditional relationship between the submarkets hidden in user-commented products and user perceptions (i.e., topics) in their associated textual comments.
Due to the space limit, we only review the prior work most related to this study. In Appendix A, we first position our work in the literature along several dimensions and show how our research bridges the gaps in the literature. Then, we discuss an extensive list of studies about user favorites and textual comments.
The proposed model
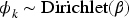
This study proposes the HLDA model, outlined in Figure 2. In Figure 2, the shaded nodes are the observed variables. HLDA is implemented using a three-step unified framework to combine user favorites, user-commented products, and textual comments. In the first step, we apply an embedding method, Word2Vec (Mikolov et al., 2013), to extract the latent features from user favorites. These features serve as fixed inputs to subsequent steps. Products with similar latent features in the vector space tend to be competitors, as these similarities reflect how consumers group them during product evaluation. In the second step, we extend LDA to model the user-commented products by integrating the latent features learned from user favorites in the first step to identify submarkets. In the third step, we extend Correspondence LDA's approach to model the conditional relationships between submarkets inferred from user-commented products and the topics derived from associated textual comments. To provide a clear roadmap, we summarize the three types of data sources and their roles within the HLDA in Table 1. Next, we provide the details.
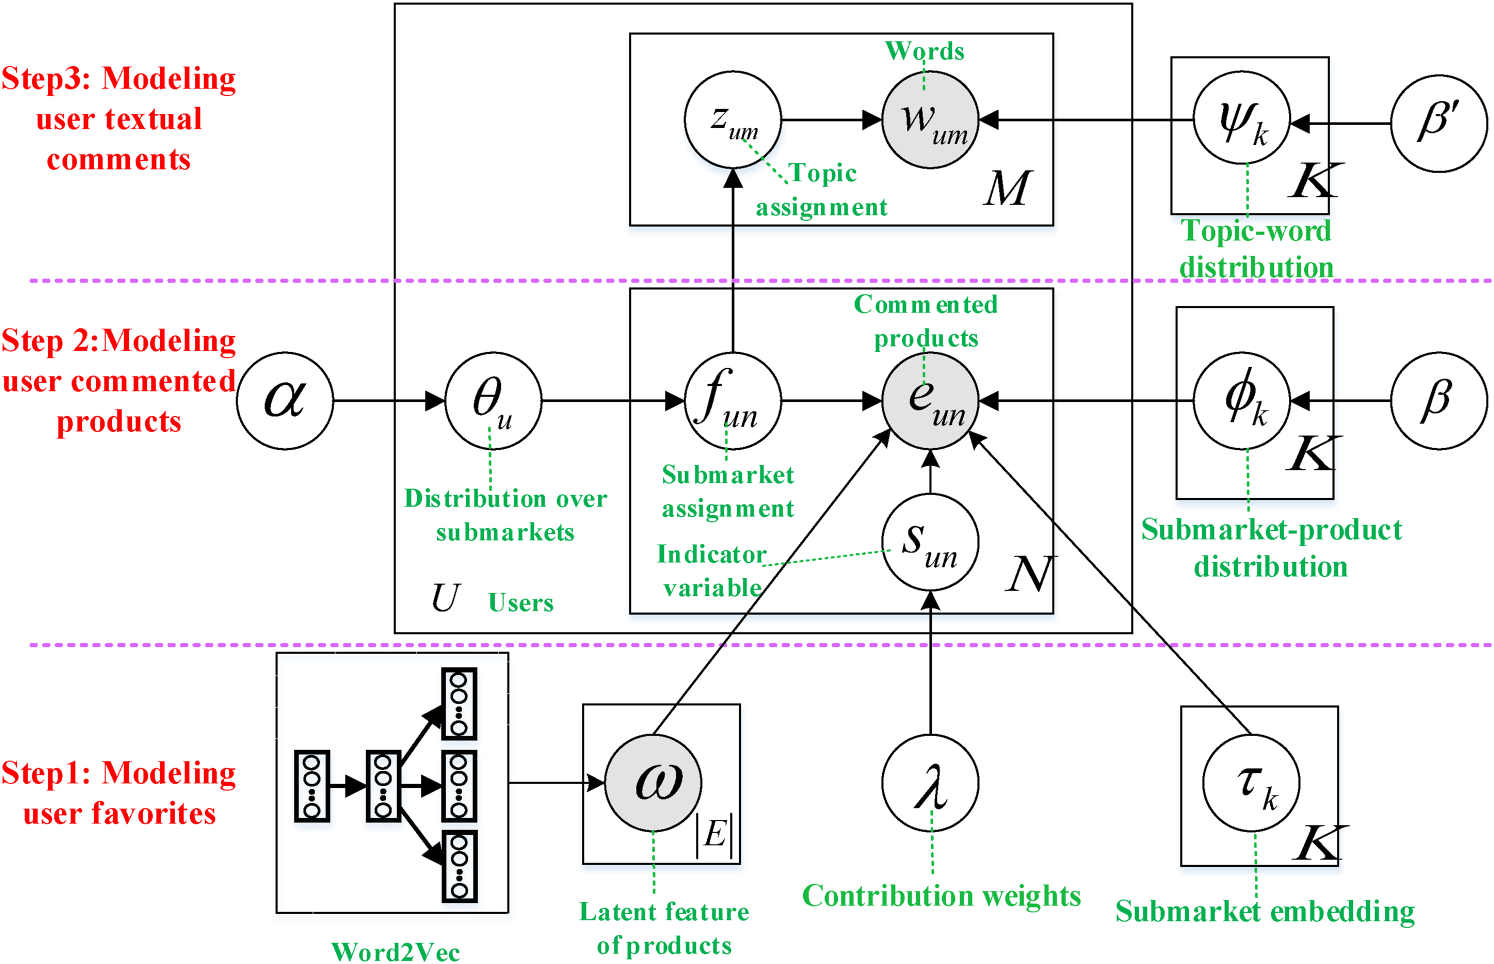
Schema of the hierarchically latent dirichlet allocation (HLDA) model.
Overview of data sources and their roles in hierarchically latent dirichlet allocation (HLDA).
To capture competitive relationships in user favorites, we use the Word2Vec method (Mikolov et al., 2013) to learn product latent features. Word2Vec was originally designed for NLP, where it analyzes word co-occurrence in small sliding windows within a set of documents. In our application, we apply this approach to user favorites, treating products as “words” and favorites lists as “documents.” When users frequently save certain products together (e.g., similar luxury electric vehicles (EVs)), this suggests these products share common attributes and may be competitors.
For each product
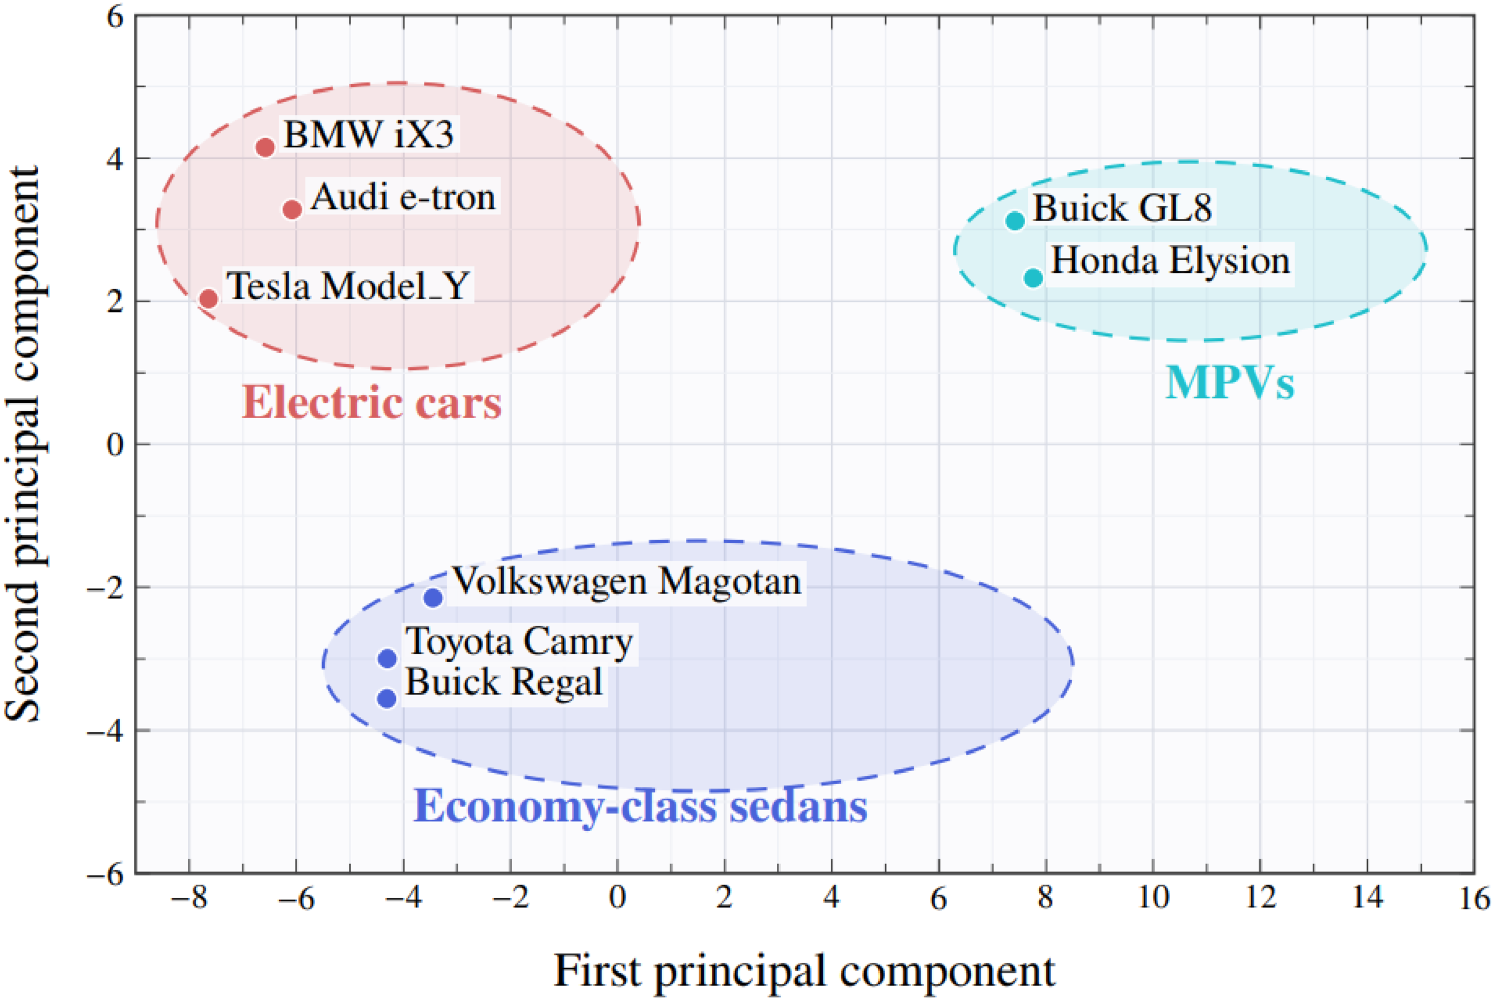
Examples of two-dimensional principal component analysis (PCA) projection of the latent features.
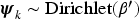
We extend the LDA model to identify submarkets by analyzing user-commented products alongside latent features derived from user favorites. Following the LDA analogy, user-commented products serve as documents, individual products as words, and submarkets as topics. However, unlike standard LDA, we incorporate the latent features learned from user favorites in Step 1 to improve submarket inference. In HLDA's generative process, user-commented products are generated using a two-component mixture strategy (Nguyen et al., 2015). One component follows a categorical distribution similar to LDA, while the other component uses the softmax function to link the submarkets in the latent feature space.
Formally, let U denote the number of users, with each user
Second, a submarket embedding
This dual submarket representation integrates direct product co-occurrence patterns in user-commented products (i.e.,
In analyzing user comment patterns, we observe that consumers engage with products in two distinct ways: one anchored in users’ favorites, and another independent of favorites, in which product selection follows the unique co-occurrence patterns observed in user-commented products. To model this dual behavior, we use a two-component mixture strategy to generate each commented product 
When 

To understand consumer perceptions of submarkets, HLDA analyzes textual comments and leverages the submarket assignments of the products in the comments as supervised signals. This approach is inspired by Correspondence LDA (Blei and Jordan, 2003), originally designed to model the conditional dependence between visual and textual topics. We apply this framework to establish the conditional relationship between submarkets and the topics discussed in the associated comments.
Suppose user

For example, if a user comments on four products with submarket assignments
This uniform distribution ensures that words are more likely to be associated with submarkets that dominate the user's commented-product set. By having the probabilistic link between products and words, our model captures how consumers articulate their perceptions about specific competitive submarkets, rather than treating textual comments as disconnected from the competitive context.
In Appendix B, we outline the generative process of HLDA. The model requires estimating four latent variables
Our inference algorithm proceeds as follows: in each iteration, we first fix the values
Deriving competitive intelligence
After running the Gibbs sampling algorithm until convergence, we estimate
Determining Competitive Strength
Let 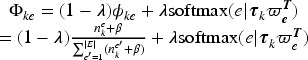
An aspect of competitive intelligence is understanding consumer perceptions within each submarket. By analyzing the posterior distribution of 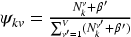
To evaluate the sentiment (positive, negative, or neutral) associated with each topic, we use an explainable deep learning method, namely the sentiment lexicon-aware attention network (SLAN) (Wu et al., 2019). Unlike simple lexicon-based approaches, SLAN handles contextual information through attention mechanisms and properly accounts for negation and intensity modifiers. Implementation details are provided in Appendix C.
We investigate the specific types of consumers who show interest in the submarket. Using our model, we can obtain each user's preference distribution over each submarket by:
The popularity of a submarket represents how frequently it is considered by consumers in the marketplace. This metric provides key information for managers to identify high-interest segments and monitor shifting consumer attention patterns. We define submarket popularity 
This measure aggregates individual user preferences across the entire user base, providing a market-level view of submarket importance.
Data description
We collect data from autohome.com.cn, the leading online transaction platform for automobiles in China. The platform consists of model-specific discussion forums, each corresponding to a particular car model (e.g., Audi A5). Within each forum, posts are organized by discussion threads. Users are not restricted to participating in a single forum. In fact, users frequently discuss and compare vehicles across model-specific forums, guided by their interests. As a result, a user's commented products may include vehicles from different categories (e.g., electric and gasoline-powered cars). In addition to participating in forums, the platform allows users to add vehicles of interest to their personal favorite lists. To construct user-level data, we develop a web-crawling program that starts from individual user profile pages (see Figure 1) and collects each user's favorited vehicles, commented vehicles, and the associated textual comments.
We perform several preprocessing operations, including filtering out users with minimal activity, standardizing product nomenclature, and using domain-specific word segmentation to enhance analytical precision. Appendix D reports descriptive statistics for user favorite lists, user-commented products, and the associated textual comments. The data contains 324,641 favorite lists and 354,703 user-commented products on 2330 car models from 434,258 unique users. The data spans from September 2017 to December 2021. On average, users comment on 4.3 cars with a standard deviation of 2.7, and the average size of a favorite list is 4.0 with a standard deviation of 2.3.
Market structure analysis
In this section, we present the results of the market structure analysis. We set the hyper-parameter
To visualize the competitive market structure, we select the top 20 representative cars from each submarket based on their competitive strength determined by Equation (8). We then establish the connections between the submarket (represented by the red node) and its car members (other color nodes). To visualize these connections, we used Gephi (Bastian et al., 2009) for graph and network analysis. Figure 4 showcases the global market network, revealing the competitive market structure. Among the inferred 60 submarkets, there are 720 unique cars without double-counting. Figure 4 provides a clear view of product competition in a specific submarket.
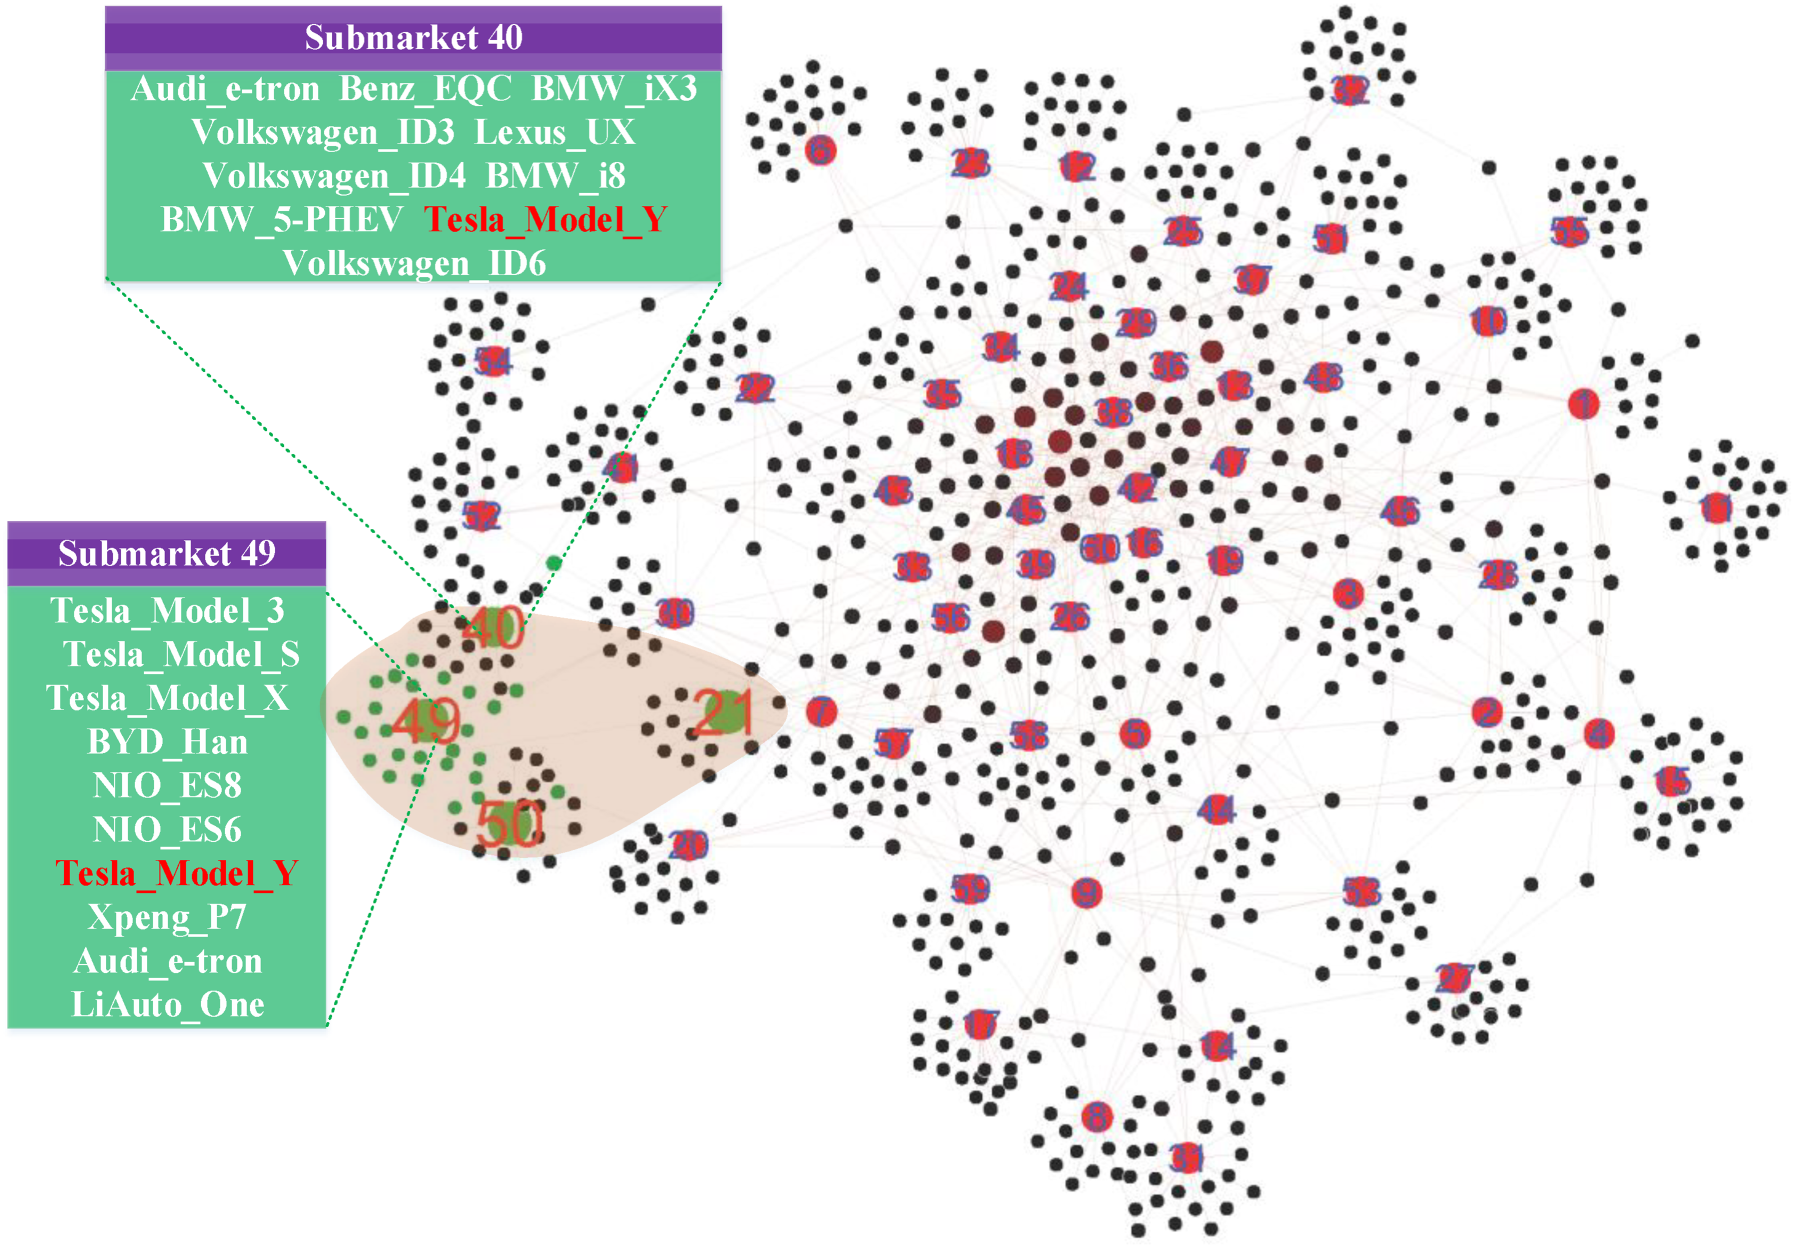
The visualization of the competitive market structure.
To demonstrate how managers can derive competitive intelligence from this network, we focus on Tesla's positioning in the rapidly evolving EV market. In submarket 49, three Tesla models (i.e., Model_3, Model_S, and Model_X) compete directly with vehicles from established luxury brands and emerging EV specialists like BYD and NIO. This submarket analysis reveals not only Tesla's current strong position but also growing competitive challenges that might be overlooked in traditional analysis frameworks.
The network structure in Figure 4 also reveals important insights through submarket adjacencies. Submarket 40 (containing premium European EVs like Audi e-tron and BMW iX3) and submarket 50 (dominated by emerging Chinese EV brands) share boundaries with submarket 49. These proximity relationships highlight potential cross-shopping behavior, where consumers evaluate options across market segments. For Tesla's strategic planning, understanding these adjacent market dynamics is crucial for maintaining a competitive advantage against established luxury manufacturers and new entrants.
Furthermore, our analysis shows that some Tesla models (e.g., Model_Y) appear in multiple submarkets, indicating increasingly fluid market boundaries. This finding suggests that consumers no longer restrict their attention to products within a single segment; instead, they evaluate options across different price tiers and categories. To further assess the generality of this pattern, we follow social network theory (Newman et al., 2002) and conduct a network degree analysis, in which the degree of a car is defined as the number of submarkets it simultaneously belongs to. Figure 5 reports the degree distribution of car models and shows that 44.3% of cars (319 out of 720) appear in two or more submarkets.
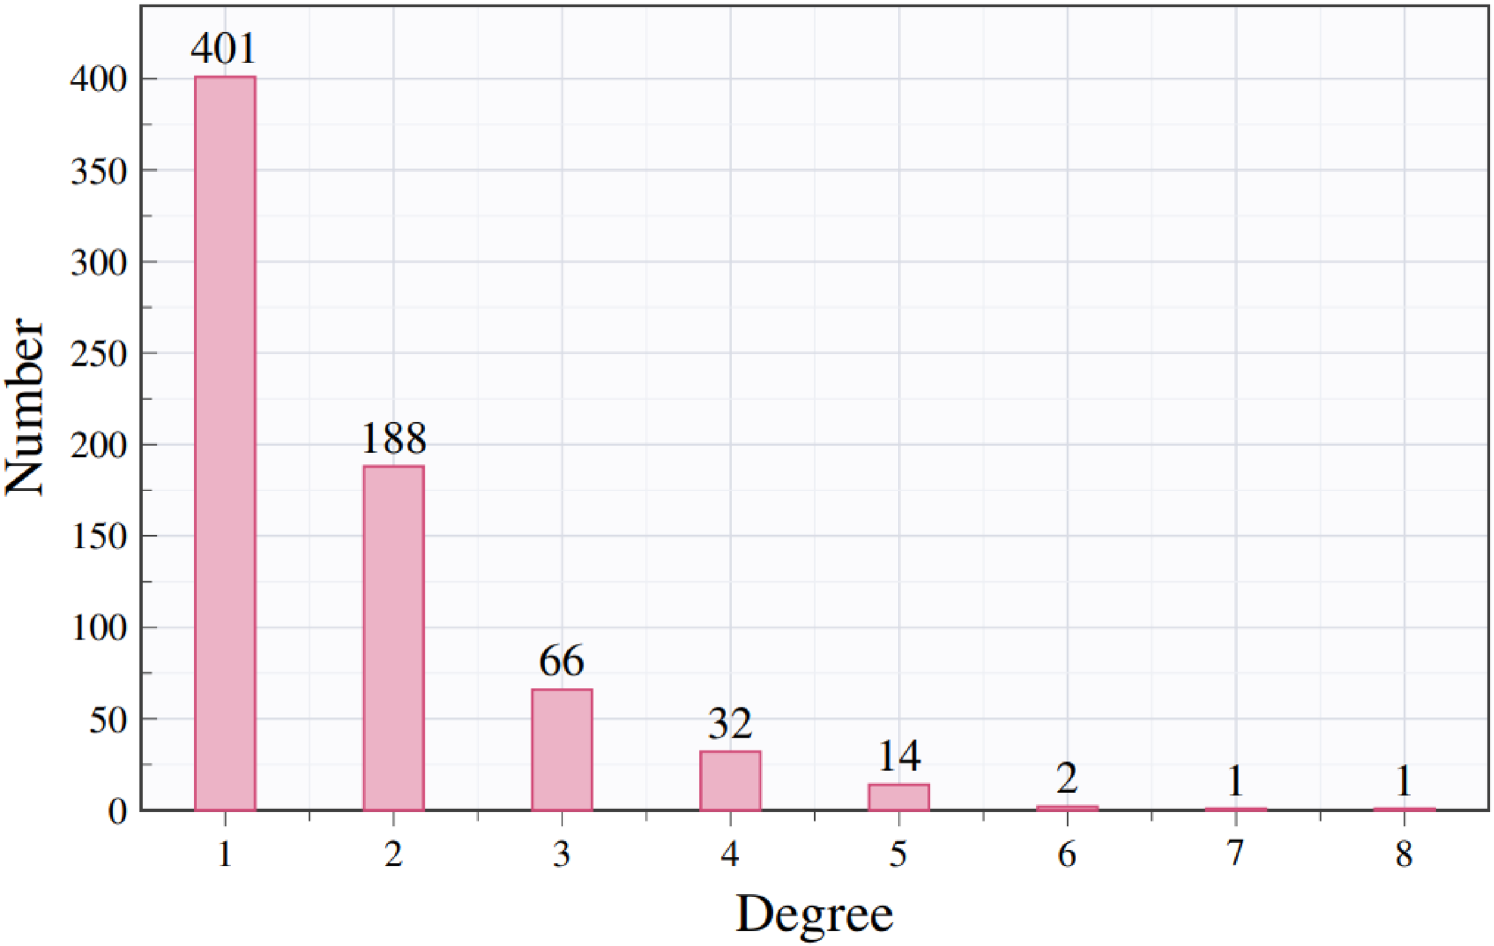
Degree distributions of car models.
Although we classify the cars in our dataset into 60 fine-grained submarkets to provide a macro-level of the market landscape, we can also zoom in on these submarkets based on the specific questions and objectives managers ask. In Appendix G, we use vehicle size and price to map the relationships among submarkets, suggesting that the multi-granularity of market segmentation helps managers better understand the competitive landscape and make targeted decisions.
Figure 6 presents the competitive strength rankings of the top ten flagship vehicles in submarket 49 and its adjacent submarkets (i.e., 21, 40, and 50). This micro-level analysis provides several insights for Tesla's competitive strategy.
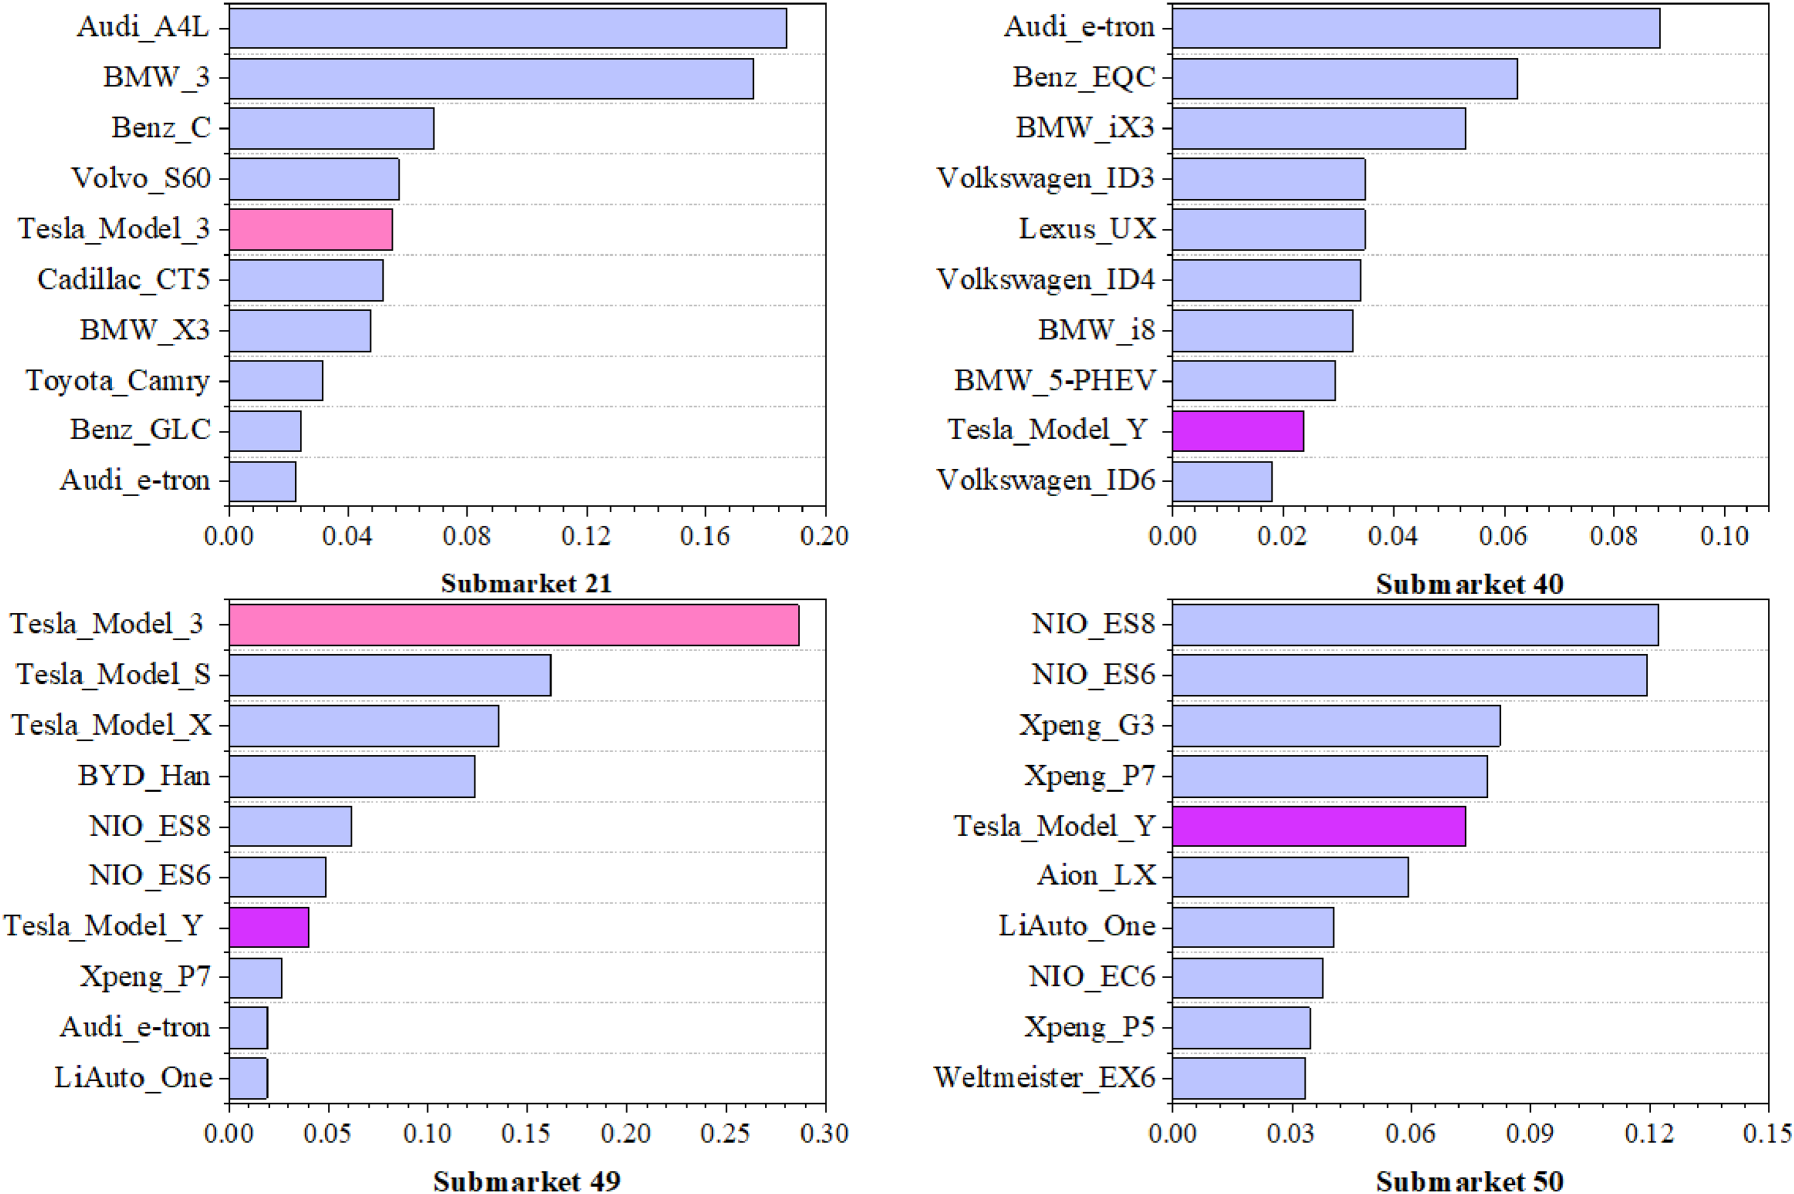
Competitive strength of cars in four submarkets.
In submarket 49 (premium EVs), Model_3 maintains dominant market leadership, with a competitive strength of 0.2866, significantly higher than any competitor. This competitive strength quantifies Model_3's centrality in the submarket network, reflecting its greater consumer attention relative to other vehicles in the segment. However, this dominance does not transfer equally across submarkets. While Model_3 maintains a presence in the traditional luxury submarket 21 (where it competes with Audi_A4L and BMW_3), its competitive strength is substantially lower (0.1152), indicating a more challenging competitive position. Similarly, Model_Y shows varying competitive strengths across submarkets 40 (European premium EVs) and 50 (emerging Chinese EVs). In submarket 40, Model_Y faces intense competition from established European luxury brands with a long heritage in premium segments. Conversely, in submarket 50, Model_Y competes against rapidly advancing Chinese EV manufacturers.
This variable performance across submarkets reveals an important strategic insight: even dominant brands like Tesla must develop submarket-specific competitive strategies rather than applying uniform approaches across segments. For instance, in submarket 21, Tesla might emphasize performance and total cost-of-ownership advantages over traditional luxury vehicles, while in submarket 50, the focus might shift to technological superiority and brand prestige to justify premium pricing relative to less-established competitors.
In Appendix H, we further examine submarket popularity based on Equation (11). Our analysis reveals a highly skewed distribution of consumer interest, with four dominant submarkets attracting over 4% of user attention each, while nearly 40% of submarkets remain relatively niche (popularity < 0.01). Specifically, within the EV sector, we find that emerging Chinese EV submarkets (e.g., submarket 50) have already surpassed some established European premium segments in popularity, suggesting a shift in competitive dynamics that may challenge traditional leaders like Tesla. Also, we identify a statistically significant but weak positive correlation (r = .29, p < .05) between submarket popularity and the number of competing products. This finding suggests that more popular submarkets tend to attract more competitors.
Topics and sentiment characteristics of the sampled submarkets.
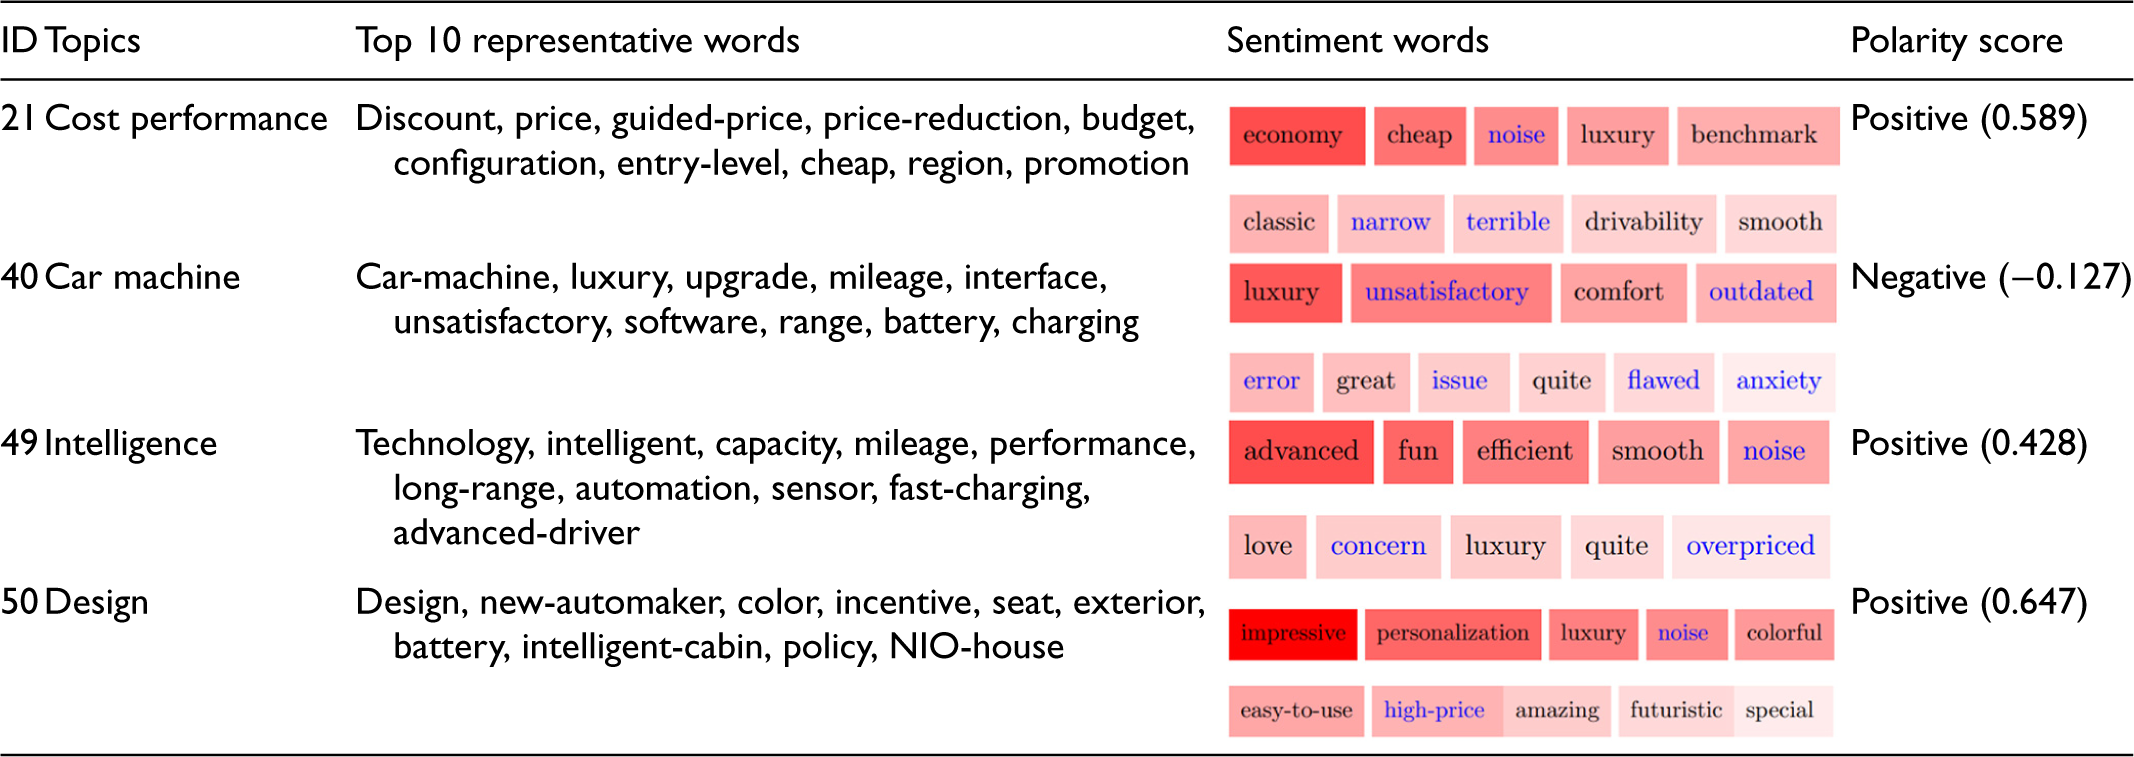
Beyond identifying competitive relationships, our model extracts user perceptions (Equation (9)) that reveal how customers evaluate products within each submarket. Table 2 presents the competition-related topics and associated sentiment analysis for submarket 49 and its adjacent submarkets. The sentiment words in Table 2 report the top 10 sentiment-related terms ranked by their frequency within each topic. The polarity score is calculated based on the relative proportions of positive and negative comments associated with each topic. This analysis reveals perception patterns across EV submarkets that provide actionable intelligence for product development and marketing.
Specifically, in submarket 49, technology and intelligence features dominate consumer discussion, with frequently mentioned terms such as “intelligent,” “automation,” and “advanced driver” in the associated topic. These discussions carry predominantly positive sentiment (polarity score = 0.428), with words such as “innovative” and “advanced” appearing frequently. This alignment between Tesla's technology-focused positioning and positive consumer perceptions is consistent with the effectiveness of Tesla's differentiation strategy in this segment.
Conversely, submarket 40 (European premium EVs) shows negative sentiment (−0.127) despite similar luxury positioning, with consumers expressing dissatisfaction with interface design and software performance, as reflected in topic terms like “unsatisfactory,” “outdated,” and “flawed.” This perception gap between submarkets 49 and 40 highlights a competitive advantage for Tesla in software experience and interface design, which could be further emphasized in marketing communications. In submarket 50 (emerging Chinese EVs), design aspects dominate consumer discussions, particularly concerning exterior styling and cabin innovation. The strongly positive sentiment (0.647) suggests that these brands successfully meet design expectations, potentially challenging Tesla's historical advantages in this dimension.
Across all three EV submarkets (40, 49, and 50), battery performance and driving range consistently emerge as key concerns, as indicated by terms such as “battery,” “range,” and “charging.” This recurring topic underscores the fundamental importance of driving range and charging infrastructure for consumer EV adoption, regardless of price point or brand positioning. These submarket-specific perception maps provide Tesla managers with precise guidance for product development prioritization and marketing message refinement. For example, maintaining technology leadership in automation and interface design appears critical in submarket 49, while addressing any perception gaps in exterior design may become increasingly important relative to competitors in submarket 50. Complementing these perception insights, Appendix I examines user preference patterns across submarkets.
Two-dimensional principal component analysis (PCA) projection of the product vectors.
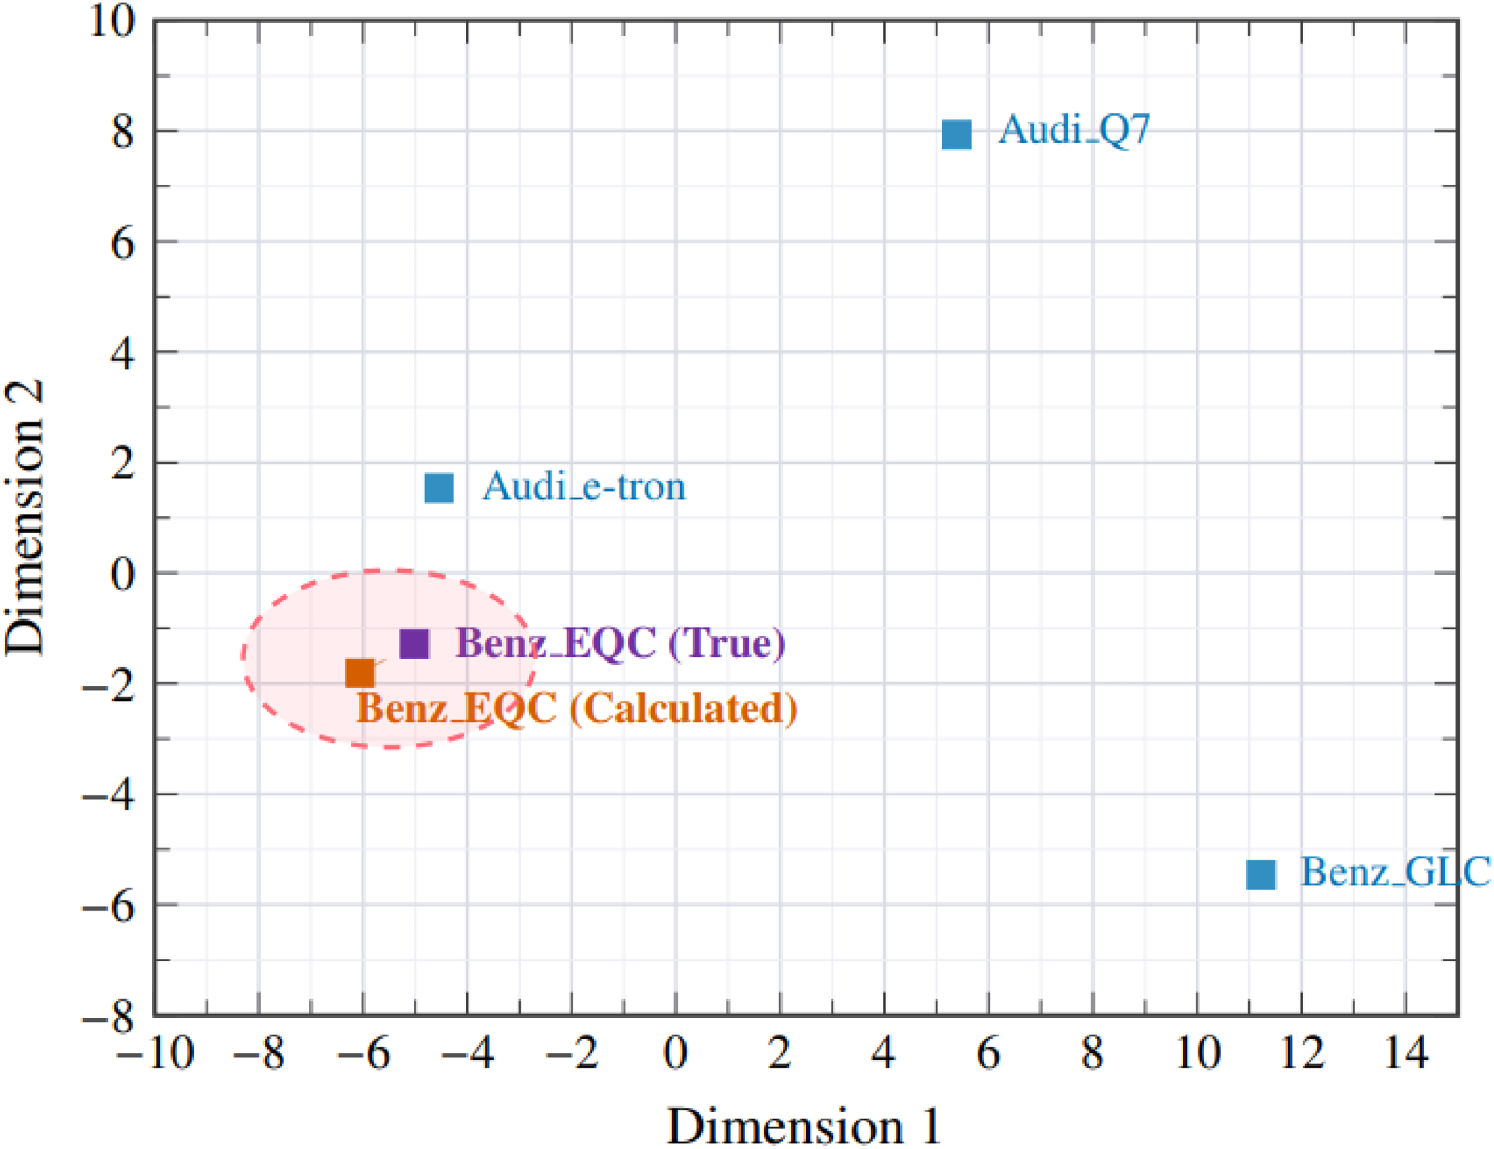
The Word2Vec component of our model enables the prediction of competitive positioning for new market entrants by leveraging their vector representations. Specifically, we follow the idea of Gabel et al. (2019) in estimating the vectors for new products. Specifically, we first build label sets for all products, such as product type (e.g., SUV, MPV, and sedan), energy type (e.g., gas-powered vehicle, BEV, HEV, and PHEV
3
), and price range (e.g., $0–$20,000, $20,000–$30,000). Then, we use linear combinations of other product vectors to infer the vectors of new products. To illustrate this process, consider the Benz_EQC as a new market entrant. Its vector representation can be approximated by combining vectors of existing products that share similar attributes or represent specific feature transitions:

In this formulation, the term
To predict the competitive submarket of a new product, we calculate cosine similarity scores (SSs) between its vector and all submarket vectors
Figure 8 visualizes these SSs between new vehicles (released after 2022) and potential target submarkets. Based on this figure, we can identify the submarket assignment for each new car and determine which cars are likely to enter a specific submarket. For example, the NIO_ET5, positioned as a mid-to-high-end EV, has a high probability of being assigned to EV submarkets 40 (SS = 0.6246), 49 (SS = 0.7236), and 50 (SS = 0.7852). In submarket 49 (shown in a blue rectangle), we identify several potential entrants, including NIO_ET5 (SS = 0.7236), Xiaomi_S7 (SS = 0.5150), and BMW_i3 (SS = 0.4252). In response to the new entrants to submarket 49, Tesla's managers should implement a proactive strategy to maintain and strengthen the brand's competitive position.
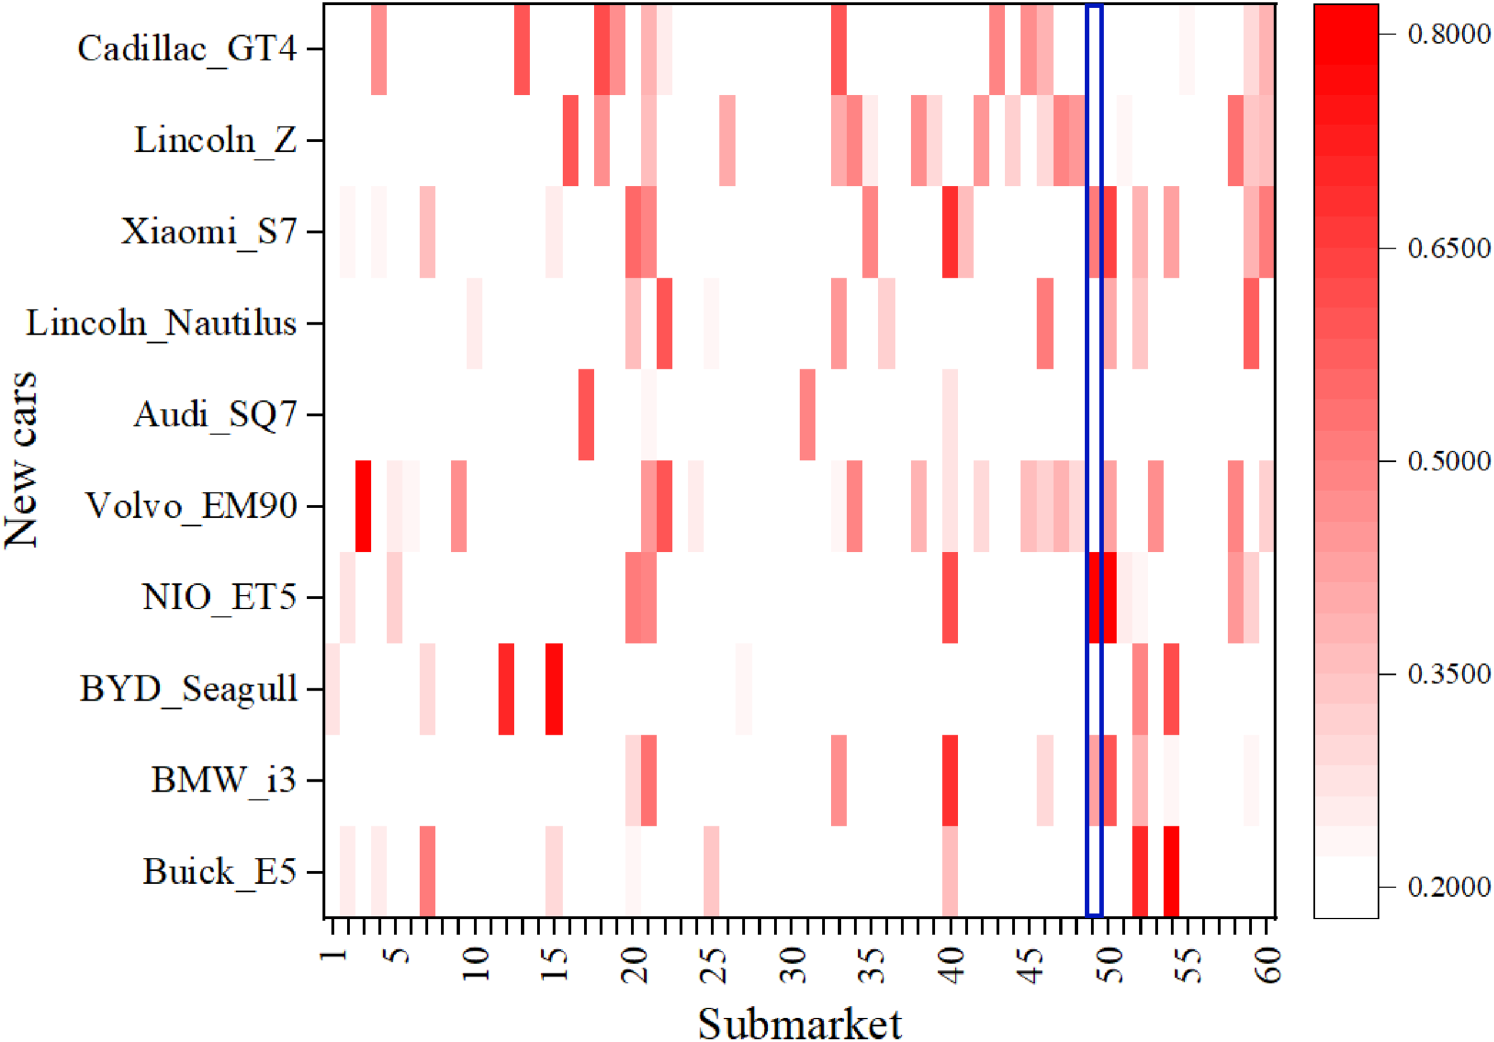
The heat map of the similarity scores between the new cars and submarkets.
Table 3 presents the predicted submarkets, competitive strengths, and ranking results for two new cars. We also list the top 5 representative cars for each predicted submarket. From the table, we observe that the BMW_i3 exhibits relatively low competitive strength (0.0068) in submarket 49, placing it near the bottom with a rank of 17. In contrast, the NIO_ET5 demonstrates significantly higher competitive strength (0.0433) in the same submarket, obtaining a more favorable rank of 7. This disparity in competitive strength and ranking indicates that the NIO_ET5 is perceived as a more prominent entrant in submarket 49. NIO_ET5 may exert a greater influence on consumer decision-making in this submarket, thereby attracting more attention and capturing a larger share of market demand. For Tesla's managers, it is crucial to monitor the market dynamics surrounding the NIO_ET5 and respond with tailored strategies to counter its influence in submarket 49.
These results quantify the potential competitive impact of new entrants, providing a measure of both their submarket membership probability and their projected competitive strength in those submarkets. To further understand how such competitive relationships evolve, we also developed a dynamic extension of the model. As detailed in Appendix J, the dynamic analysis tracks the evolution of EV submarkets from 2017 to 2021 and highlights the model's ability to capture not only the current competitive landscape but also the temporal dynamics of market competition. For example, while Tesla's luxury submarket was initially challenged by high-end gasoline vehicles (2017–2018), it later faced intense rivalry from domestic EV entrants like NIO and LiAuto (2019–2021). This evolution is accompanied by a clear transition in consumer discourse. Specifically, the focus has shifted from fundamental concerns like “battery endurance” and “price” toward new attributes such as “intelligent technology” and “resale value.”
The empirical analyses in Sections 4.2 to 4.5 demonstrate that HLDA produces interpretable competitive structures, meaningful consumer perceptions, and reliable predictions for new market entrants. A natural question, however, is whether these insights stem from the principled integration of all three data sources, that is, user favorites, user-commented products, and textual comments, or whether a simpler, single-source model would yield comparable results. To address this, we conduct ablation studies that isolate the contribution of each component.
We construct five ablation variants by selectively removing or replacing components of HLDA:
All variants share the same hyperparameters as the full model. For variants involving Word2Vec, we maintain a context window of 5, a latent dimension of 200, and 15 training epochs. We evaluate each variant using the coherence score (Mimno et al., 2011) 4 and partial perplexity (Huang et al., 2018), selecting the optimal number of submarkets for each variant based on partial perplexity. To assess statistical significance, we conduct 10 independent runs per variant and perform paired t-tests against the full model. Results are summarized in Table 4, organized by signal complexity, from single-signal baselines to pairwise integrations to the full triadic model.
The predicted submarkets, competitive strengths, and ranking results for two new cars.
The predicted submarkets, competitive strengths, and ranking results for two new cars.
Ablation analysis of multisource integration in HLDA.
Notes. All the results are reported as mean ± standard deviation. The variance in the paired t-test is computed as the differences between the paired observations. Improvement reports the percentage by which the full HLDA model outperforms each variant. HLDA = hierarchically latent Dirichlet allocation; HLDA-F = HLDA of user favorites only; HLDA-C = HLDA of user-commented products only. *p < .05; **p < .01; ***p < .001. The number of paired observations in the paired t-test is 10.
Table 4 shows that the full triadic model performs best across both evaluation metrics, showing that each source provides incremental information. The results also indicate that not all pairwise combinations are equally informative: pairwise models that retain favorite-derived latent features perform substantially better than the variant that removes them. Specifically, among single-signal baselines, HLDA-F and HLDA-C perform comparably, with coherence scores 5.30% and 5.68% below the full model, respectively. HLDA-F slightly outperforms HLDA-C, consistent with the view that favorites may reflect more serious consideration, while commented products may include exploratory mentions not representative of genuine competitive interest (Yang et al., 2015).
Among pairwise integrations, HLDA-noLF, which omits user favorites entirely, performs worst overall, with coherence and perplexity deteriorating by 7.45% and 5.86%, respectively. This result shows that the latent features learned from user favorites are the single most impactful component, as they provide a structured competitive embedding that neither commented products nor textual comments can replicate on their own. By contrast, HLDA-noTC and HLDA-noTC-SC, both of which retain user favorites but remove textual comments, show only moderate degradation (2.95% and 2.41% in coherence, respectively) and perform similarly. This suggests that rearranging how favorites and commented products are combined adds little value; what matters is their joint inclusion alongside textual comments.
The full HLDA model outperforms all variants (p < .01), showing that user favorites, user-commented products, and textual comments each supply complementary signals that jointly enable more precise submarket identification. User favorites anchor the competitive embedding; commented products capture broader co-occurrence patterns; and textual comments strengthen within-submarket topic coherence by surfacing the attributes that drive product comparisons. Removing any one source measurably degrades performance; the full integration performs well.
Beyond these ablation studies, we conduct additional evaluations to further establish the robustness and predictive validity of our model. In Appendix K, we perform simulation-based parameter recovery checks using synthetic datasets with known ground truth, reporting recovery distributions for the sum of absolute errors and KL divergence. The results show that our estimation procedure reliably recovers the true latent parameters. Appendix L benchmarks HLDA against state-of-the-art baselines across coherence scores, silhouette coefficients, and perplexity. Our model outperforms these baselines, indicating that the gains from multi-signal integration are not simply a function of the Word2Vec embedding itself but arise from the full HLDA architecture. Finally, we conduct external validation against real-world data sources, including consumer reports, sales data, and human-rated benchmarks. The results show higher PMI scores, better alignment with observed sales patterns, and higher human-evaluation ratings than all baselines, providing evidence that the inferred submarkets reflect genuine competitive relationships rather than statistical artifacts.
Competitive intelligence plays a pivotal role in informing strategic decision-making in operations management. Our integrated analysis offers insights that enhance operational decisions.
First, our study helps manufacturers and managers analyze market competition from both macro and micro perspectives. From the macro perspective, our approach enables managers to understand the overall competitive landscape. Visualizing submarkets and their relationships helps managers identify opportunities and threats not only in primary submarkets but also in adjacent segments. For example, our analysis reveals clear segmentation in the automotive market, with distinct but interconnected submarkets for traditional luxury vehicles, premium EVs, and emerging EV brands. From the micro perspective, manufacturers and managers can leverage our results to identify the competing products in each submarket and evaluate their respective competitive strengths. As demonstrated through the Tesla case in Section 4, its managers can detect both direct competitors and emerging threats that might be missed through traditional analysis.
Second, this study provides managerial support for product marketers and online platforms. Specifically, our model is designed to obtain competitive intelligence by analyzing latent patterns of individual user behavior (i.e., favorite and comment behaviors). Compared with the literature (Matthe et al., 2023; Ringel, 2023; Ringel and Skiera, 2016), our model can provide insights into user perceptions across submarkets. Product marketers can leverage user perceptions to identify the latent aspects users prioritize most, then create a more compelling value proposition that resonates with users and elicits positive responses. In addition, from the derived user perceptions, product marketers can proactively address negative sentiments and take corrective actions to maintain a positive product image. In addition, online platforms can leverage user perceptions to provide recommendations. For example, the platform can generate interpretable rationales by highlighting which perceived attributes contribute most to a given recommendation, thereby increasing user trust and engagement.
Conclusion
This study proposes an interpretable machine learning framework for deriving competitive intelligence from multifaceted user behavior data. By jointly inferring market structure and consumer perceptions, HLDA integrates three complementary signals, including latent features from user favorites, co-occurrence patterns from user-commented products, and attribute-level discourse in textual comments. Applied to a large-scale automotive dataset, the framework successfully identifies fine-grained competitive submarkets, characterizes rival product strengths, extracts consumer perceptions, and predicts competitive positioning for new entrants. Ablation studies and external validation show that the triadic integration performs best in the reported validation exercises and that the inferred submarkets align with real-world competitive relationships, as evidenced by sales patterns and human-rated benchmarks.
This work contributes to the operations management and marketing literature in two ways. First, it demonstrates the value of integrating multiple UGC types rather than treating each in isolation for competitive analysis. Second, it provides an interpretable methodological template that researchers and practitioners can adapt to other platforms and product categories where complementary behavioral signals exist.
Several directions remain open. First, the current framework treats all commenting behavior symmetrically. Future work could incorporate sentiment directly into the estimation process to distinguish favorable evaluation from critical comparison, which may sharpen submarket boundaries and perception maps. Second, the bag-of-words assumption limits the model's ability to link individual products to their specific associated textual comments. Future work could address this limitation by incorporating alignment mechanisms, such as attention-based models or contextual language representations, to capture semantic dependencies between products and their corresponding comments. More broadly, examining how our framework performs across platforms with different engagement structures, or in markets with faster product cycles, would further establish the generality of the multi-signal integration approach.
Supplemental Material
sj-pdf-1-pao-10.1177_10591478261457235 - Supplemental material for Deriving competitive intelligence from multifaceted user behavior data: An interpretable machine learning framework
Supplemental material, sj-pdf-1-pao-10.1177_10591478261457235 for Deriving competitive intelligence from multifaceted user behavior data: An interpretable machine learning framework by Yang Qian, Hai Che, Yezheng Liu, Yuanchun Jiang and Jennifer Shang in Production and Operations Management
Footnotes
Acknowledgments
The authors sincerely thank Editor-in-Chief Subodha Kumar, Departmental Editor Fred Feinberg, Senior Editor P. K. Kannan, and the anonymous reviewers for their valuable and insightful suggestions.
Funding
The authors received the following financial support for the research, authorship, and/or publication of this article: Yang Qian, Yezheng Liu and Yuanchun Jiang are supported by the National Natural Science Foundation of China (72101072, 72342011, 72571096, 72271084, 72171071), and the Key Laboratory of Philosophy and Social Sciences for Cyberspace Behaviour and Management.
Declaration of Conflicting Interests
The authors declared no potential conflicts of interest with respect to the research, authorship, and/or publication of this article.
Notes
How to cite this article
Qian Y, Che H, Liu Y, Jiang Y and Shang J (2026) Deriving competitive intelligence from multifaceted user behavior data: An interpretable machine learning framework. Production and Operations Management XX(XX): 1–17.
References
Supplementary Material
Please find the following supplemental material available below.
For Open Access articles published under a Creative Commons License, all supplemental material carries the same license as the article it is associated with.
For non-Open Access articles published, all supplemental material carries a non-exclusive license, and permission requests for re-use of supplemental material or any part of supplemental material shall be sent directly to the copyright owner as specified in the copyright notice associated with the article.