



Abstract
This study reports findings from a validation study of the Student Risk Screening Scale for use with 9th- through 12th-grade students (N = 1854) attending a rural fringe school. Results indicated high internal consistency, test-retest stability, and inter-rater reliability. Predictive validity was established across two academic years, with Spring Student Risk Screening Scale (SRSS) scores differentiating students with low-, moderate-, and high-risk status on office discipline referrals, grade point averages, and course failures during the following academic year. Teacher ratings evaluating students’ performance later in the instructional day were more predictive than teacher ratings evaluating students’ performance earlier in the instructional day. Educational implications, limitations, and future research directions are presented.
Teachers and administrators are faced with a number of challenges each year. Some challenges provide meaningful differentiated instruction to improve the academic performance of all students (No Child Left Behind Act [NCLB] of 2001, 2002), offering inclusive educational experiences for students with exceptionalities as appropriate (Individuals With Disabilities Education Improvement Act [IDEA], 2004), and establishing a safe and drug-free environment (Satcher, 2001). Each charge is highly important and, in some instances, difficult to achieve—particularly when attending to issues of school safety.
Clearly the consequences of antisocial behavior in our schools are far reaching, impacting students, teachers, and the surrounding community as a whole. Antisocial behavior includes a host of undesirable behaviors constituting persistent violations of social norms such as verbal and physical aggression, noncompliance, as well as coercion (Kazdin, 1985). Not surprisingly, antisocial behavior is a core characteristic of emotional and behavioral disorders (EBD), a general category of behavioral challenges that includes externalizing as well as internalizing behavior patterns (Kauffman & Brigham, 2009; Moffit, 1993; Stouthamer-Loeber & Loeber, 2002; Walker, Ramsey, & Gresham, 2004).
The prevalence of EBD is substantial. Between 2% and 20% of school-age children and youth are estimated to evidence such characteristic behavior, with more conservative estimates suggesting 6% (Kauffman & Brigham, 2009). In the absence of effective intervention efforts, students with EBD experience a number of short- and long-term negative consequences, including strained social relationships, academic underachievement, school failure, unemployment, criminality, and continued mental health concerns (Wagner, Kutash, Duchnowski, Epstein, & Sumi, 2005; Wagner, Newman, Cameto, Levine, & Garza, 2006).
While some educators may contend the issue of EBD is a concern to be addressed by the special education community, this is simply not the case (Lane, Oakes, & Menzies, 2010). In fact, less than 1% of students go on to qualify for special education services under the category of emotionally disturbed (ED) as defined in the Individuals With Disabilities Education Improvement Act (IDEA, 2004). The vast majority of students with EBD will spend their K-12 years in the general education setting, with general education teachers responsible for meeting these students’ multiple needs in academic, behavioral, and social domains.
Recognizing the value of a systems perspective for meeting all students’ needs (including those students with EBD; Lane, Parks, Kalberg, & Carter, 2007), many school site leadership teams are developing three-tiered models of prevention. Such models include (a) response-to-intervention modules (RTI; Gresham, 2002) emphasizing the academic domains, (b) positive behavior intervention and support (PBIS; Sugai & Horner, 2002) emphasizing behavior and social domains, and (c) comprehensive, integrated, three-tiered (CI3T) models addressing academic, behavioral, and social domains featured in RtI and PBIS models (Lane, Kalberg, & Menzies, 2009).
Such three-tiered models include a data-based method of providing graduated support for students according to their individual needs. All students participate in primary (Tier 1) prevention efforts to reduce the likelihood of learning and behavioral problems occurring. Students for whom primary supports are insufficient are identified using data collected as part of regular school practices and placed into secondary (Tier 2; e.g., small groups focused on common deficits; Elliott & Gresham, 2008) or tertiary (Tier 3; e.g., individualized interventions for academic or behavioral concerns) prevention efforts, with tertiary being the most intensive.
Central to such models is accurate detection of students requiring additional supports. Fortunately, a number of screening tools are available for use within the context of three-tiered models of prevention to assess behavioral performance, including Early Screening Project (ESP; Walker, Severson, & Feil, 1995), the Systematic Screening for Behavior Disorders (SSBD; Walker & Severson, 1992), Student Risk Screening Scale (SRSS; Drummond, 1994), Strengths and Difficulties Questionnaire (SDQ; Goodman, 1997), Behavior and Emotional Screening System (BESS; Kamphaus & Reynolds, 2007), and Social Skills Improvement System: Performance Screening Guide (SSiS; Elliott & Gresham, 2007). Yet most screening tools currently available were designed for use at the elementary level and involve some type of cost. Given the challenges associated with supporting students at the high school level, the limited availability of behavioral screening tools for this population is disappointing.
Supporting Students at the High School Level: The Land of Limited Inquiry
The high school setting is markedly different from both the elementary and middle school settings. Namely, content area curricula become increasingly differentiated, students have less one-to-one contact with a growing number of adults, the physical building is comparatively quite large, and in the absence of a strong primary prevention agenda, expectations across classrooms and noninstructional settings can be quite diverse (Eccles, Lord, & Midgely, 1991; Lane, Kalberg, Parks, & Carter, 2008; Seidman, Aber, Allen, & French, 1996). As such, it is not surprising that relative to performance patterns in the middle school years, the high school years are characterized by decreasing grades, attendance patterns, and rates of engagement (e.g., Roderick & Camburn, 1999; Seidman et al., 1996). Also, sources of reinforcement shift, with approval from peers becoming increasingly more important than approval from adults (Parker, Rubin, Erath, Wojslawowicz, & Buskirk, 2006). Even the most talented youth often struggle to negotiate the transition to and through the high school years, an experience particularly challenging for students with tendencies toward antisocial behavior patterns who struggle academically and lack self-determined behaviors (goal-setting and self-advocacy skills) needed for success in this complex environment (Carter, Lane, Pierson, & Glaeser, 2006; Nelson, Babyak, Gonzalez, & Benner, 2003; Sinclair, Christenson, & Thurlow, 2005; Wagner et al., 2005).
As such, it is important to identify students with antisocial behaviors early in their high school years and intervene—ideally within the context of three-tiered models of prevention. Such frameworks are highly desirable for supporting transitions from middle to high school as well as from school to adult life (e.g., employment, postsecondary education, and community involvement; Bullis & Yovanoff, 2006; Wagner et al., 2006; Zigmond, 2006). To this end, the research community must identify reliable, valid, and feasible screening tools for use in high school settings. These tools will enable the general education community to identify and support students at risk for late onset behavior problems such as antisocial behavior patterns that may occur during middle and high school years as well as those who have continued behavioral challenges persisting despite previous intervention efforts (Stouthamer-Loeber & Loeber, 2002).
To date, there are two no-cost screening tools that have been used at the high school level. The SDQ has established reliability and validity across the K-12 continuum. Yet the teacher version requires teachers to rate each student on 25 items equally distributed across the following domains: peer problems, conduct problems, emotional symptoms, hyperactivity, and prosocial (the opposite of antisocial behavior). In our work at the middle and high school levels, teachers suggest the SDQ is too cumbersome in terms of both administration and scoring. Although, information gleaned from the SDQ is highly useful in terms of informing intervention efforts (Kalberg, Lane, Driscoll, & Wehby, in press; Lane et al., 2008). This led our research team to examine the degree to which the SRSS—a tool initially developed for use with elementary-age students—could be used with middle and high school students.
Reliability and Validity of the Student Risk Screening Scale
The reliability and validity of the SRSS for use at the middle and high school levels have been examined during the past 5 years. Specifically, there have been two articles depicting results of four validation studies of the SRSS at the middle school and one published validation study examining utility at the high school level.
Lane et al. (2007) conducted the initial investigations of the reliability and validity of the SRSS, the first one conducted with middle school students (6th–8th grades; n = 500) in a rural setting and a second conducted with middle school students (5th–8th grades; n = 528) in an urban setting. Results of the first study indicated high internal consistency across three administrations (Fall = .78, Winter = .85, and Spring = .85, respectively), test-retest stability (0.66, p < .0001, 14 weeks [Fall to Winter]; 0.56, p < .0001, 34 weeks [Fall to Spring]; and 0.80, p < .0001, 20 weeks [Winter to Spring]), and convergent validity with the SDQ. Short-term predictive validity was established, with low- (n = 422), moderate- (n = 51), and high- (n = 12) risk status best differentiated by behavioral variables (e.g., ODR and in-school suspensions). Academic variables (grade point average [GPA] and course failures) were able to differentiate between those with (moderate and high) and without (low) risk. However, academic variables did not differentiate between students in the moderate- and high-risk groups as did the behavioral variables. Results of the second study also supported internal consistency and test-retest stability. However, this study did not examine predictive validity in the urban setting.
Lane, Bruhn, Eisner, and Kalberg (2010) conducted another series of studies in urban middle schools to explore further issues of reliability and validity. Consistent with the Lane et al. (2007) findings, results again indicated high internal consistency (Study 1: .84 to .89; Study 2: .83 to .88) and test-retest stability (Study 1: .57; Fall to Spring; to .86; Fall to Winter; Study 2: Fall Year 1 to Spring Year 2; .41). Study 1 (n = 534) supported the predictive validity of the SRSS, with students at low risk being able to be differentiated from moderate- to high-risk status on behavioral (ODR) and academic (GPA) measures. Furthermore, findings from Study 1 support the feasibility of the SRSS as evidenced by increased use over time serving as a behavioral marker for social validity. Study 2 (n = 528) also supported predictive validity up to 2 years following initial SRSS status. In this second study, students in the low-risk group had statistically significantly fewer out-of-school suspensions, fewer unexcused absences, and higher GPAs than students in the moderate- and high-risk groups. Thus, initial evidence supports use of the SRSS in rural and urban middle schools, yet limited inquiry exists at the high school level.
Lane et al. (2008) conducted the first study of the SRSS at the high school, with 674 9th- through 12th-grade students attending a rural school. Results were consistent with those of the middle school studies. Again, results indicated internal consistency (.78 to .86), test-retest stability over a 2-year period, and inter-rater reliabilities between two different raters. In addition, convergent validity was established between SRSS total scores and the total scores and subscale scores of the SDQ. Furthermore, predictive validity was established over 2 academic years. For high school students, low risk for antisocial behavior differentiated ODRs and GPA from students with moderate and high levels of risk. Yet neither ODR nor GPA scores could distinguish between students with moderate- or high-risk status. Furthermore, this study provided anecdotal support for the feasibility of the SRSS as evidenced by the school-site teachers electing to continue with the SRSS but not the SDQ, citing concerns about the time required to complete the SDQ.
While these collective findings are useful, additional inquiry is needed to establish the reliability, validity, and feasibility of the SRSS for use in middle and high schools, particularly for high schools as only one validation study has been conducted. The intent of this study is to address this call by examining issues of (a) reliability, the extent to which a test yields the same or similar scores when administered over time, and (b) validity, the extent to which evidence and theory support the interpretation of the test scores in such a manner deemed consistent with the initially intended use of the test (American Educational Research Association, American Psychological Association, & National Council for Measurement in Education, 1999).
Purpose
In this article, we extend the current literature on the reliability and validity of the SRSS for use at the high school level. Whereas the Lane et al. (2008) study was conducted with one small rural school, the current study is conducted with a much larger rural:urban fringe high school (a census-defined rural territory that is less than or equal to 5 miles from an urbanized area, as well as a rural territory that is less than or equal to 2.5 miles from an urban cluster; U.S. Department of Education). First, we examined internal consistency, test-retest stability, and inter-rater reliability of the SRSS as applied in a moderate to large rural:urban fringe high school in middle Tennessee. Second, we conducted a series of analyses to explore the predictive validity of the SRSS by analyzing the degree to which students perceived to have low, moderate, and high levels of risk by two different teachers (second and seventh periods) could be differentiated in terms of behavioral (ODRs) and academic (GPA and course failures) characteristics according to extant school-wide data collected during the following school year. Rather than examining only the predictive validity of the initial ratings as in the Lane et al. (2008) study, we conducted analyses to examine predictive validity of ratings conducted later in the academic year. Reliability and validity would be evidenced by internal consistency estimates of .80 or greater, statistically significant test-retest stability estimates, statistically significant inter-rater reliability estimates, and the ability to predict important academic and behavioral outcomes for students on a short-term and long-term basis (Lanyon, 2006). Finally, we conducted a series of analyses to determine the relative benefit of more than one rater in predicting important outcomes for high school students.
Method
Participants
Participants for the 2008–2009 school year were 1,845 students (930 males and 915 females) attending a rural:urban fringe high school in middle Tennessee. The school served students in 9th (28.8%, n = 532), 10th (24.20%, n = 447), 11th (24.53%, n= 453), and 12th (22.47%, n = 415) grades. Students were predominately Caucasian (90.12%, n = 1,642). Approximately 7.14% (n= 127) of students received special education services and 13% of students were classified as economically disadvantaged. There were 1,920 students in the following academic year, with nominal changes in demographic characteristics (see Table 1). The special education and economic demographic data for the 2009–2010 academic year were not yet reported at the time of submission (Tennessee Department of Education, 2009).
Student Demographics.
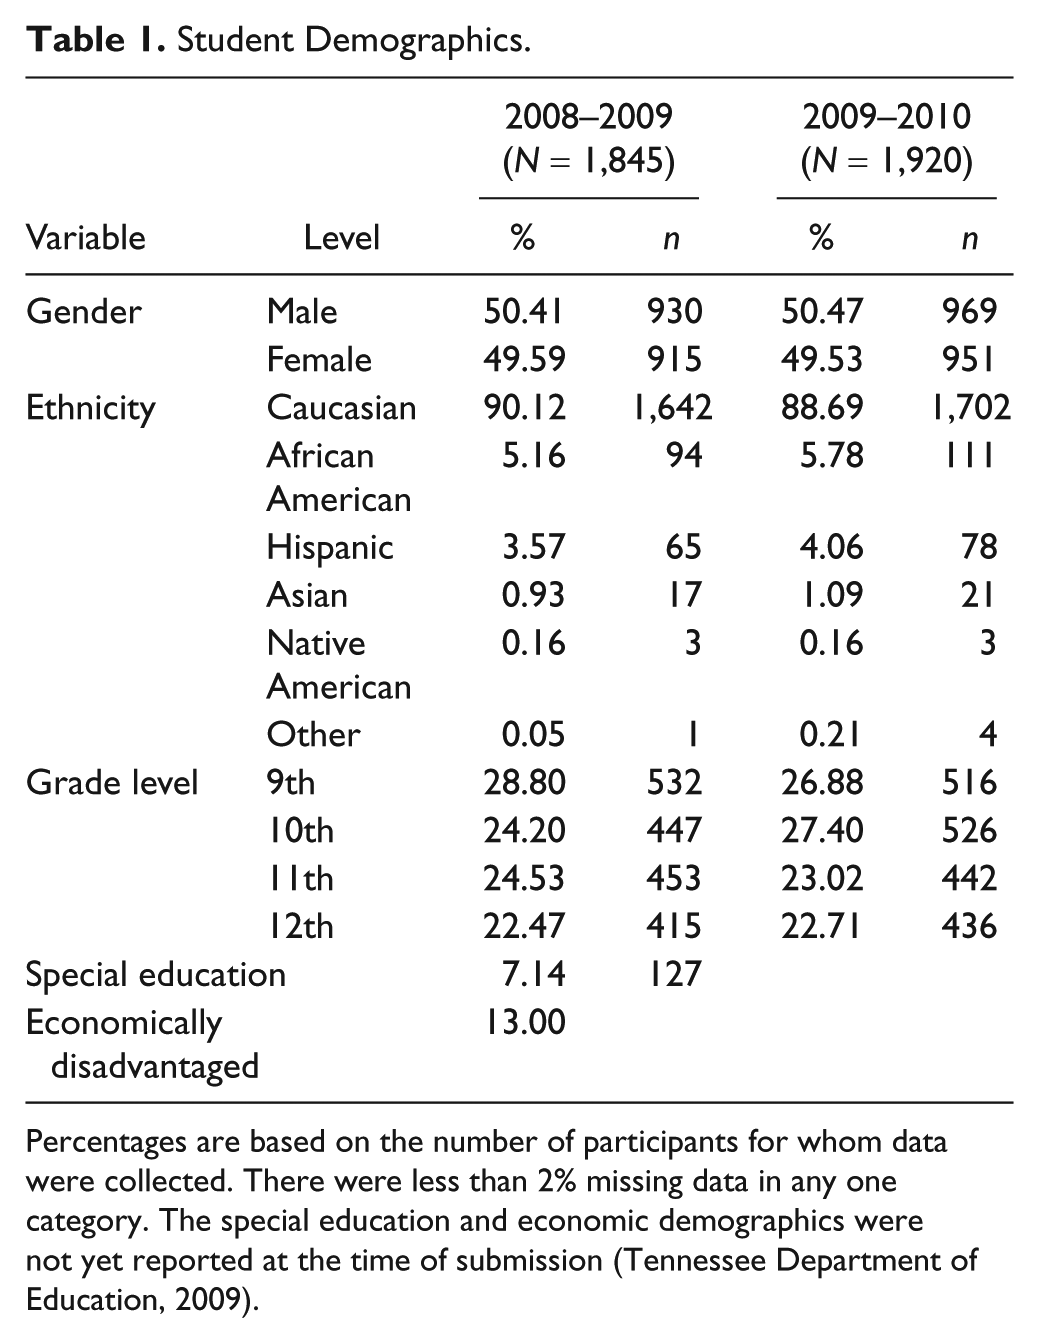
Percentages are based on the number of participants for whom data were collected. There were less than 2% missing data in any one category. The special education and economic demographics were not yet reported at the time of submission (Tennessee Department of Education, 2009).
Procedures
During the 2007–2008 academic year, Liberty High School participated in a year-long training series at Vanderbilt University to build a comprehensive, integrated, three-tiered (CI3T) model of prevention with a focus on positive behavior intervention and support (PBIS). Throughout the academic year, the school’s leadership team utilized faculty input to develop their three-tiered model of prevention. The aims of the plan were to promote positive gains academically, behaviorally, and socially and included components to teach, reinforce, and monitor expectations. The school-site leadership team adopted the SRSS (Drummond, 1994) as a regular school practice, requiring second- and seventh-period teachers to complete the SRSS three times per year (details to follow). The team used SRSS data as well as other data collected as part of regular school practices (e.g., attendance, ODRs, GPA, and course failures) to monitor their plan’s effectiveness and plan supports for students for whom primary prevention efforts were insufficient (see Lane et al., 2009, for examples).
Assessment
In the 2008–2009 school year, the SRSS was administered at three time points: 6 weeks after the year started (September), again in Winter (January), and in the Spring (March). At each time point, all students were rated by two teachers: second period and seventh period teachers. The intent of having two raters was to obtain more than one teacher’s view of student behavior. The school’s leadership team felt that student-teacher interaction was often limited and varied depending on the teacher and class and, therefore, using two raters would be a more accurate approach to identify students in need of supports rather than relying on one rater’s perspective. The second and seventh period teachers were chosen because these were the two class periods that all students were in the building (i.e., students were not out of the school for work) and captured teacher-perspectives of student behavior before and after lunch. Faculty feedback indicated student behavior was more variable later in the day following lunch.
Prior to the first administration of the SRSS, the assistant principal oriented the faculty to the screening measure, including its purpose and how to accurately complete the screener. The SRSS was then uploaded onto the school’s secure server and all teachers were directed to complete the measure for their class periods during their planning block. One member of the school-site leadership team uploaded the class rosters to the spreadsheet to minimize teacher time commitment and limit the potential error of missing students. At the end of the day, the same team member checked to ensure that all teachers had completed the screener for their class and reminded any teacher who had not done so to complete the screener the next day. During the Fall 2008–2009 time point, this process took several weeks before all teachers screened their class. Therefore, the procedures were changed for the Winter 2008–2009 administration to have all teachers sign in to the secure network and complete the SRSS at a faculty meeting. Due to an overload of users on the server, this procedure was unsuccessful and the teachers were given a week to complete the screeners on their own. The challenges with technology resulted in a return to the original plan for the Spring 2009 time point, with the administrator reviewing the screening procedures at the faculty meeting and then giving teachers 1 week to complete them. However, in Fall 2009 a preparation error occurred (the first item was inadvertently omitted from the SRSS), thereby invalidating the screening time point. Therefore, the Fall data were not scored or analyzed. For the Winter and Spring time points of the 2009–2010 academic year, the school-site team followed the same administration procedures used the previous year (signing in to a secure server to complete SRSS ratings within a 1-week window).
Scoring and entry
In Liberty High School’s first year of implementing the screening process, it was supported in scoring by Vanderbilt University. In the 2008–2009 school year, the screeners were printed out and entered by research assistants (RAs) into an Excel database, which contained formulas to calculate scores and risk categories. Reliability of data entry was then conducted on 100% of the items entered. During the 2009–2010 school year, as part of technical assistance provided to the school, RAs collected the school’s SRSS data using an encrypted and password-protected flash drive to transfer the screeners from the school’s secure server to the project’s database for analysis. RAs worked with the school-site team to transfer the data electronically into the Excel database with 100% reliability of transfer checked. Any errors found (< 1%) were corrected prior to analysis.
Measures
While multiple data sources were collected by the school to monitor students’ progress, SRSS, office discipline referrals (ODRs), grade point averages (GPAs), and course failures (CFs) were chosen as the primary data sources for this article.
Student Risk Screening Scale (SRSS)
The SRSS is a seven-item screening tool used to detect students with and at risk for antisocial behavior patterns that include both covert (e.g., steals, lies, cheats, and sneaks) and overt (e.g., aggressive behavior) behaviors identified as predictors for the development of problem behaviors (Loeber, 1991; Loeber & LeBlanc, 1990; see description provided in the introduction). Teachers rate each student on seven items—steals: lie, cheat, and sneak; behavior problem: peer rejection, low academic achievement, negative attitude, and aggressive behavior—using a 4-point Likert-type scale (never = 0, occasionally = 1, sometimes = 2, and frequently = 3). Approximately 15 minutes of teacher time is required per class to complete this no-cost screening tool. Total scores for each student as rated by each rater are used to place students into one of three categories: low risk for antisocial behavior (0–3), moderate risk (4–8), and high risk (9–21). These three risk categories were established by the developer of the instrument, Drummond. The SRSS has been validated for use at the elementary (Drummond, Eddy, Reid, & Bank, 1994; Drummond, Eddy, & Reid, 1998a, 1998b; Ennis, Lane, & Oakes, in press; Oakes et al., 2010), with initial evidence to support the use in middle (Lane, Bruhn et al., 2010; Lane et al., 2007) and high (Lane et al., 2008) school levels as explained in the introduction.
Office Discipline Referrals (ODR)
As a part of the school’s primary plan, ODRs were monitored to determine behavioral performance. An ODR was recorded when the school’s reporting form was completed and administrative action was taken (e.g., student conference, detention, suspension). ODRs were recorded by incident categories (i.e., skipping, insubordination/defiance, refusal to show, cheating, and other). For the purpose of this article, the rate of ODR per day per student was analyzed (the number of ODR earned divided by the number of days each student was enrolled). Yet as will be mentioned in the Limitations section, an error occurred during the second year. Specifically, due to changes in the ODR data collection systems implemented at the school site, Fall 2009 Quarter 1 ODR data were not collected and recorded consistently across all grade levels. Thus, 2009–2010 ODR rates reflect only Quarters 2, 3, and 4 data rather than the entire academic year, as reported for the 2008–2009 academic year.
Grade Point Average (GPA)
Students’ cumulative GPAs for each academic year were used to determine academic performance. These data were collected for each semester and then a year end average was calculated based on a 4-point scale with weighting of 0.5 for honors classes and 1.0 for advanced placement course.
Course Failures (CF)
As part of the school’s primary plan, CFs were chosen to monitor academic performance. CFs were defined as an F (<70%) in any class on a quarterly report card. The number of course failures per student was totaled at the end of each year for analysis.
Entry of extant school wide data
The academic and behavioral data (ODR, GPA, and CF) were collected by RAs on password protected encrypted flash drives after the data were de-identified. Identification numbers were assigned, entered into a secure database, and checked for accuracy by another RA (data entry reliability < 99.72%). Errors were corrected prior to analysis.
Statistical Analyses
A series of analyses were conducted to determine the reliability of the SRSS. First, to establish internal consistency, alpha coefficients were computed for each of the five time points (2008–2009: Fall, Winter, and Spring; 2009–2010: Winter and Spring) for each rater (Period 2 and Period 7). Data were not aggregated across raters. Thus, separate alpha coefficients were computed for each rater at each of the five administrations. Alpha coefficients > .80 are considered acceptable (Nunnally & Bernstein, 1994). Second, test-retest stability was examined by computing Pearson correlation coefficients between each administration over 2 years for each rater. Again, Period 2 and Period 7 raters’ scores were not aggregated for test-retest stability analyses. Correlations ≥ .50 are considered large (Hopkins, 2002). Third, inter-rater reliability was calculated using Pearson correlation coefficients between Period 2 and Period 7 raters at each of the five time points.
Fourth, we computed a series of one-way, fixed-effects multivariate analyses of variance (MANOVA) to determine the extent to which students scoring in the low-, moderate-, and high-risk categories according to Period 2 and Period 7 raters could be differentiated on behavioral (ODR) and academic (GPA and CF) outcomes over time. Specifically, low-, moderate-, and high-risk groups according to Fall and Winter scores as rated by Period 2 or Period 7 teachers were contrasted on ODRs, GPA, and CF during the 2008–2009 and 2009–2010 academic years. Spring scores (2009) were also analyzed in terms of predicting year-end outcomes in the 2009–2010 academic year. We used SAS to compute each one-way MANOVA using the general linear model, with Wilks’s lambda used for significance testing. Significant MANOVAs were followed by univariate analyses of variance (ANOVAs). Significant ANOVAs were followed by post hoc Tukey-Kramer HSD comparisons with a criterion of p < .05. Namely, SAS automatically adjusts the Tukey test command for unequal sample sizes by performing the Tukey-Kramer test. This post hoc test does not assume homogeneity of variance across groups (the Tukey-Kramer test; SAS Institute). Effect sizes (ESsm) were computed to determine the magnitude of difference between groups using the pooled standard deviation in the denominator. More specifically, effect sizes were computed to compare the magnitude of differences between two groups: (a) low to moderate risk, (b) low to high risk, and (c) moderate to high risk. For each computation, the differences between means (e.g., Mhigh – Mlow) were divided by the pooled standard deviations for both groups being compared ([SDhigh + SDlow]/2) to obtain the effect size.
Fifth, we conducted an additional set of analyses with the initial SRSS ratings to determine the extent to which predictive validity of the SRSS with extant school-wide data could be improved if students were identified as low, moderate, or high status by both raters (Period 2 and Period 7 teachers). Consistent with earlier studies (e.g., Ennis et al., in press; Menzies & Lane, 2010; Oakes et al., 2010), we used regression procedures to determine how well Fall 2008 SRSS scores (in this study, the SRSS categorical variable: low, moderate, or high, XSRSScategoricalscore) as rated by only Period 2, only Period 7, and both Period 2 and Period 7 teachers (in combination) at the onset of the first school year (Fall 2008) predicted students’ year-end (a) ODRs (YODR), (b) GPA (YGPA), and (c) course failures (YCF) during the 2008–2009 and 2009–2010 academic years. For this set of analyses, in addition to looking at Period 2 and Period 7 raters’ scores (low, moderate, or high) independently, we also explored the utility of both raters. We did not combine Period 2 and Period 7 raters’ scores into an aggregate score. Instead, we analyzed the data to explore common ratings from two perspectives, meaning both teachers rated a student as placing in the low-risk category, moderate-risk category, or high-risk category. Each data analysis step was completed based on the data provided; missing data were not imputed.
Results
Reliability
Internal consistency
Cronbach’s α values exceeded .80 (Nunnally & Bernstein, 1994) for both raters at all five time points except for second period raters at the first time point (Fall 2008, α = .76; see Table 2). Specifically, alpha values for second period raters were .76, .81, .81, .81, and .82, respectively. Alpha values for seventh period raters were .85, .87, .85, .82, and .83, respectively. Overall, these seven items constituting the SRSS showed high internal consistency (see Table 2 for alphas values for deleted variables). The intercorrelations between items on the SRSS and the total score yielded statistically significant results at the p < .0001 level for both raters at all time points over the 2 academic years (see Tables 3 and 4).
Internal Consistency Estimates Periods 2 and 7 Over Time.

Under the column labeled “Alpha,” the first coefficient is the overall alpha coefficient for the given rater and time point. The remaining alpha coefficients are the estimated alpha coefficient if the items were removed. The column labeled “r With Total” is the corrected item-total correlation.
Period 2: n = 1,762; Period 7: n = 1,524.
Period 2: n = 1,692; Period 7: n = 1,752.
Period 2: n = 1,508; Period 7: n = 1,518.
Period 2: n = 1,779; Period 7: n = 1,734.
Period 2: n = 1,601; Period 7: n = 1,507.
Intercorrelations Period 2.
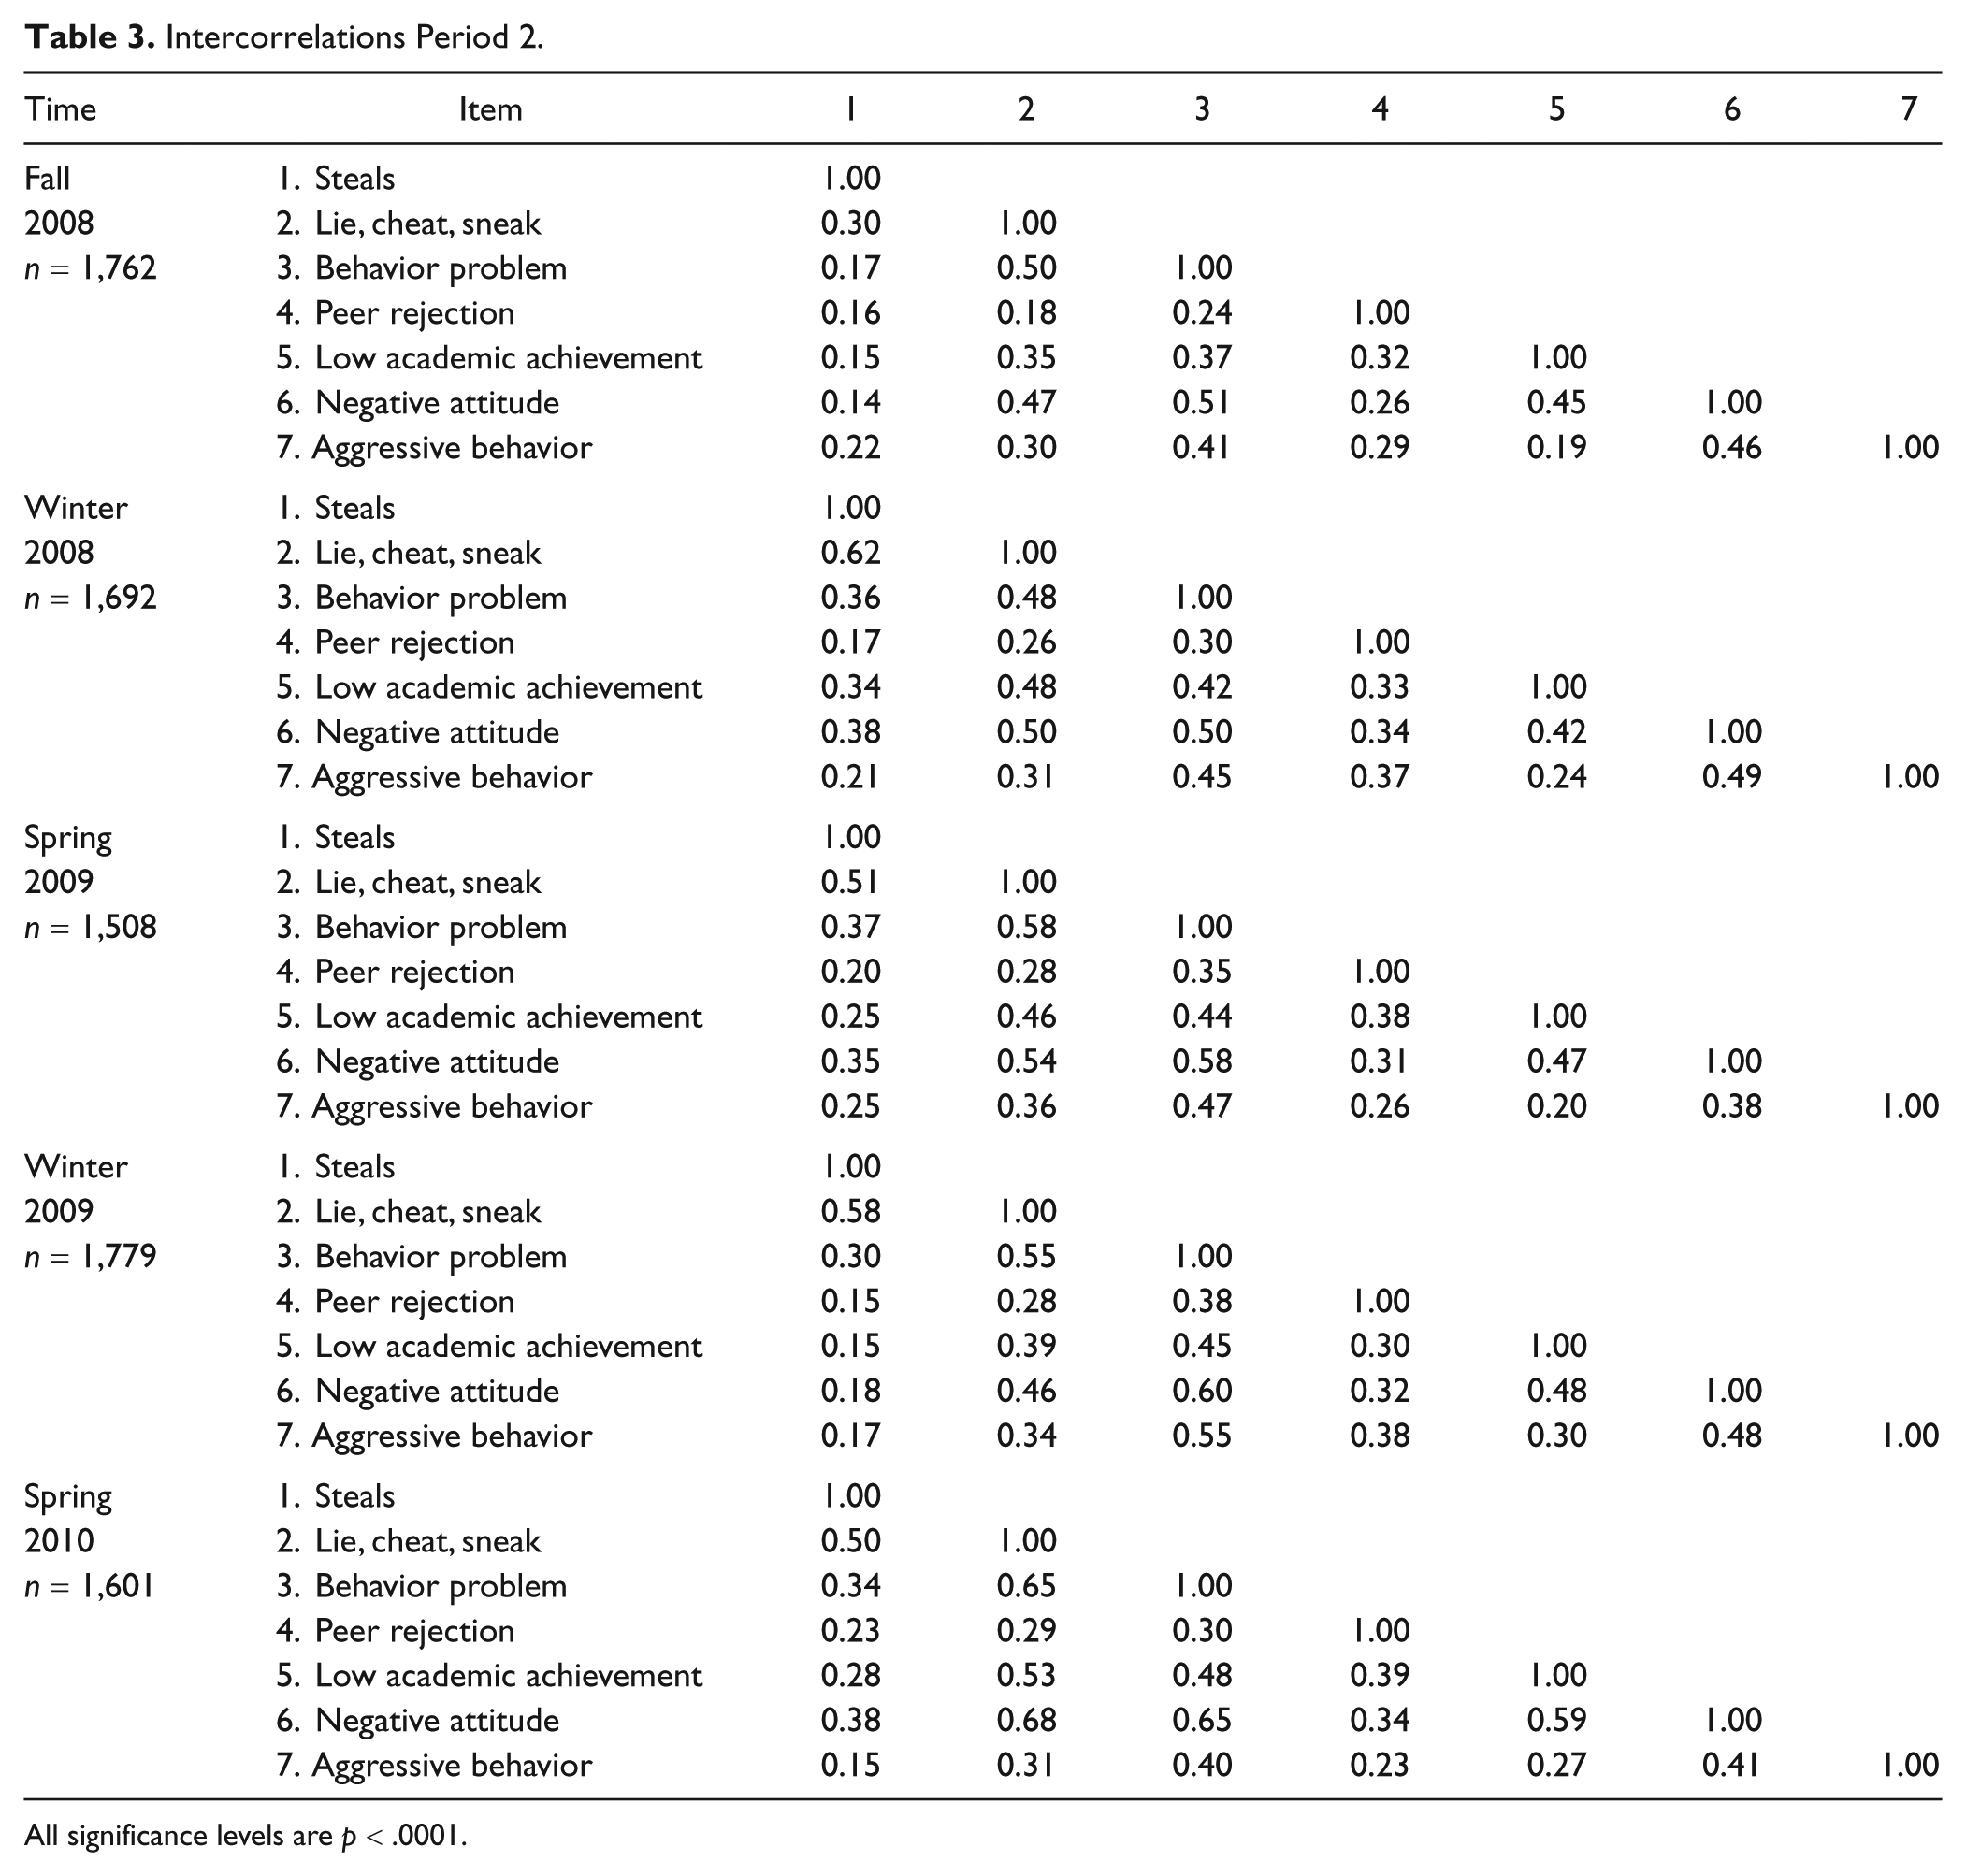
All significance levels are p < .0001.
Intercorrelations Period 7.
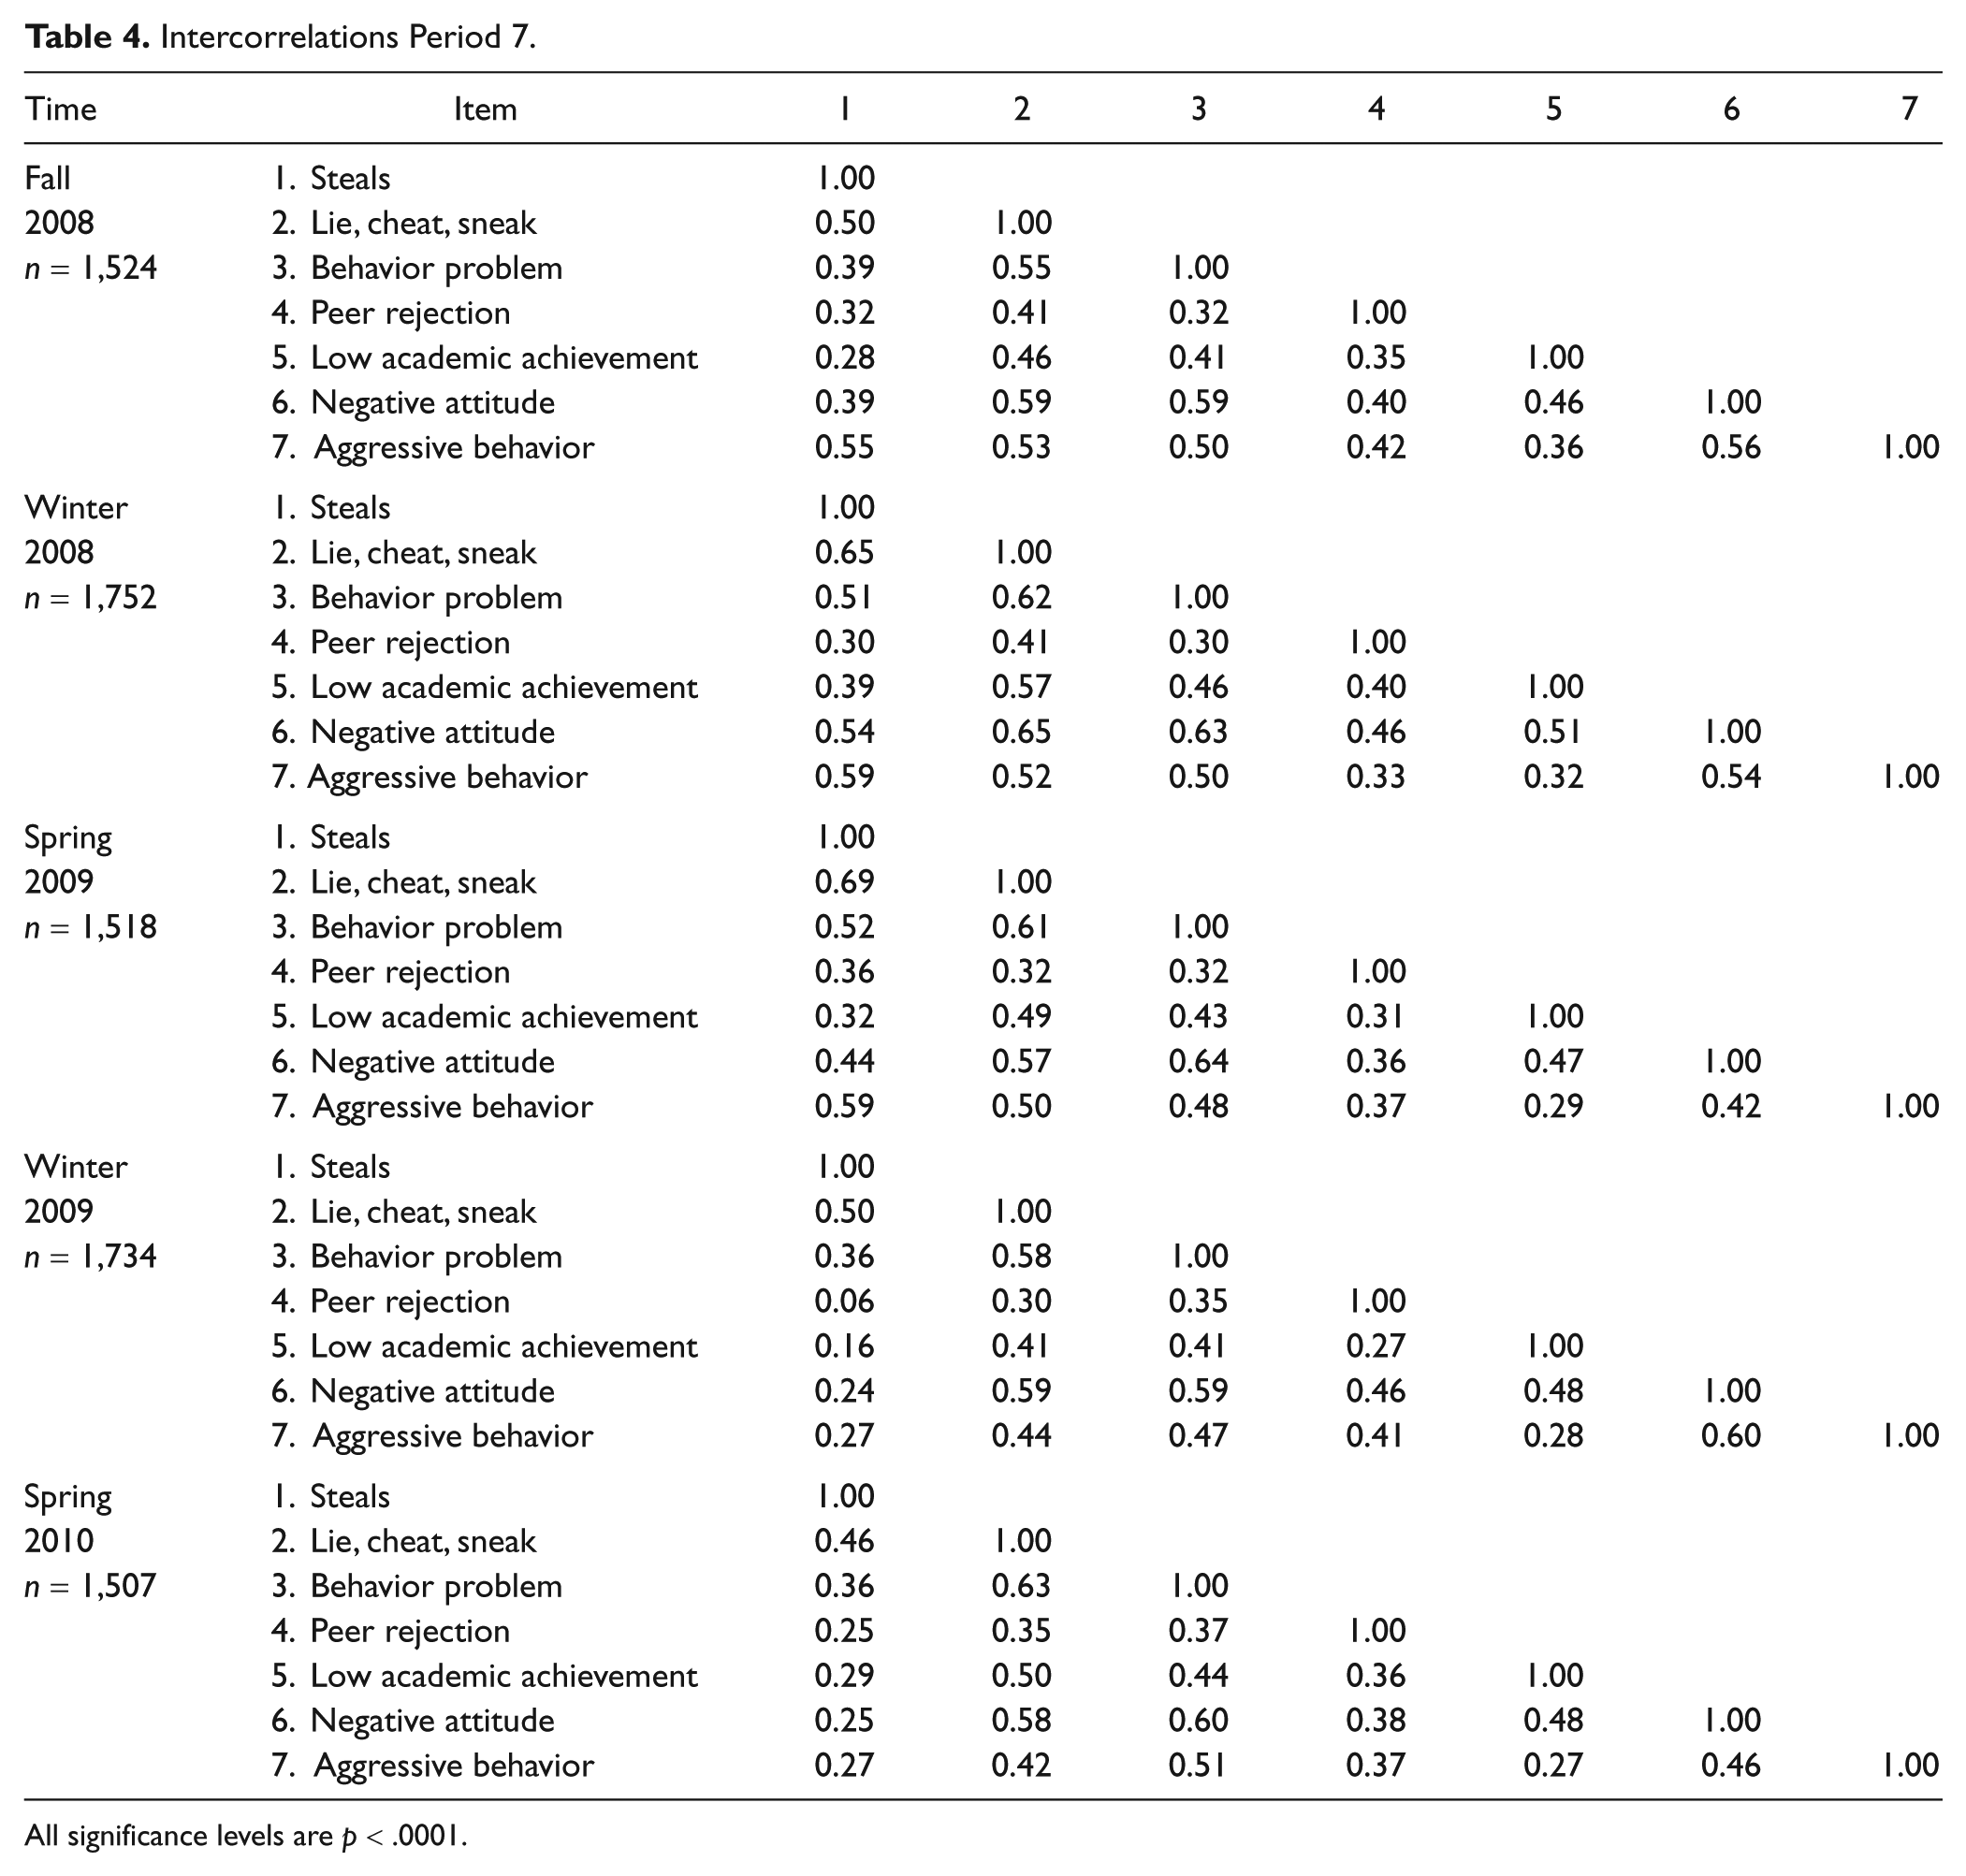
All significance levels are p < .0001.
Test-retest stability
Test-retest stability was computed for Period 2 and Period 7 teacher ratings provided at each of the five screening points, with durations between screenings ranging from 10 to 82 weeks (see Table 5). Coefficients of the resulting 20 comparisons ranged from .23 to .75, with all correlations statistically significant (p < .0001; see Table 5 for test-retest stability estimates). Test-retest stability estimates for Period 2 and Period 7 teachers ratings were comparable at each administration (e.g., Fall 2008 to Winter 2009: Period 2 r = .28 and Period 7 r = .29). The Spring 2009 to Spring 2010 comparisons were exact for both raters, meaning they both yielded the same correlation coefficients (r = .35). Correlations within a given year were higher (range: .47 to .75) than across academic years (range: .23 to .35).
Test/Retest Stability.
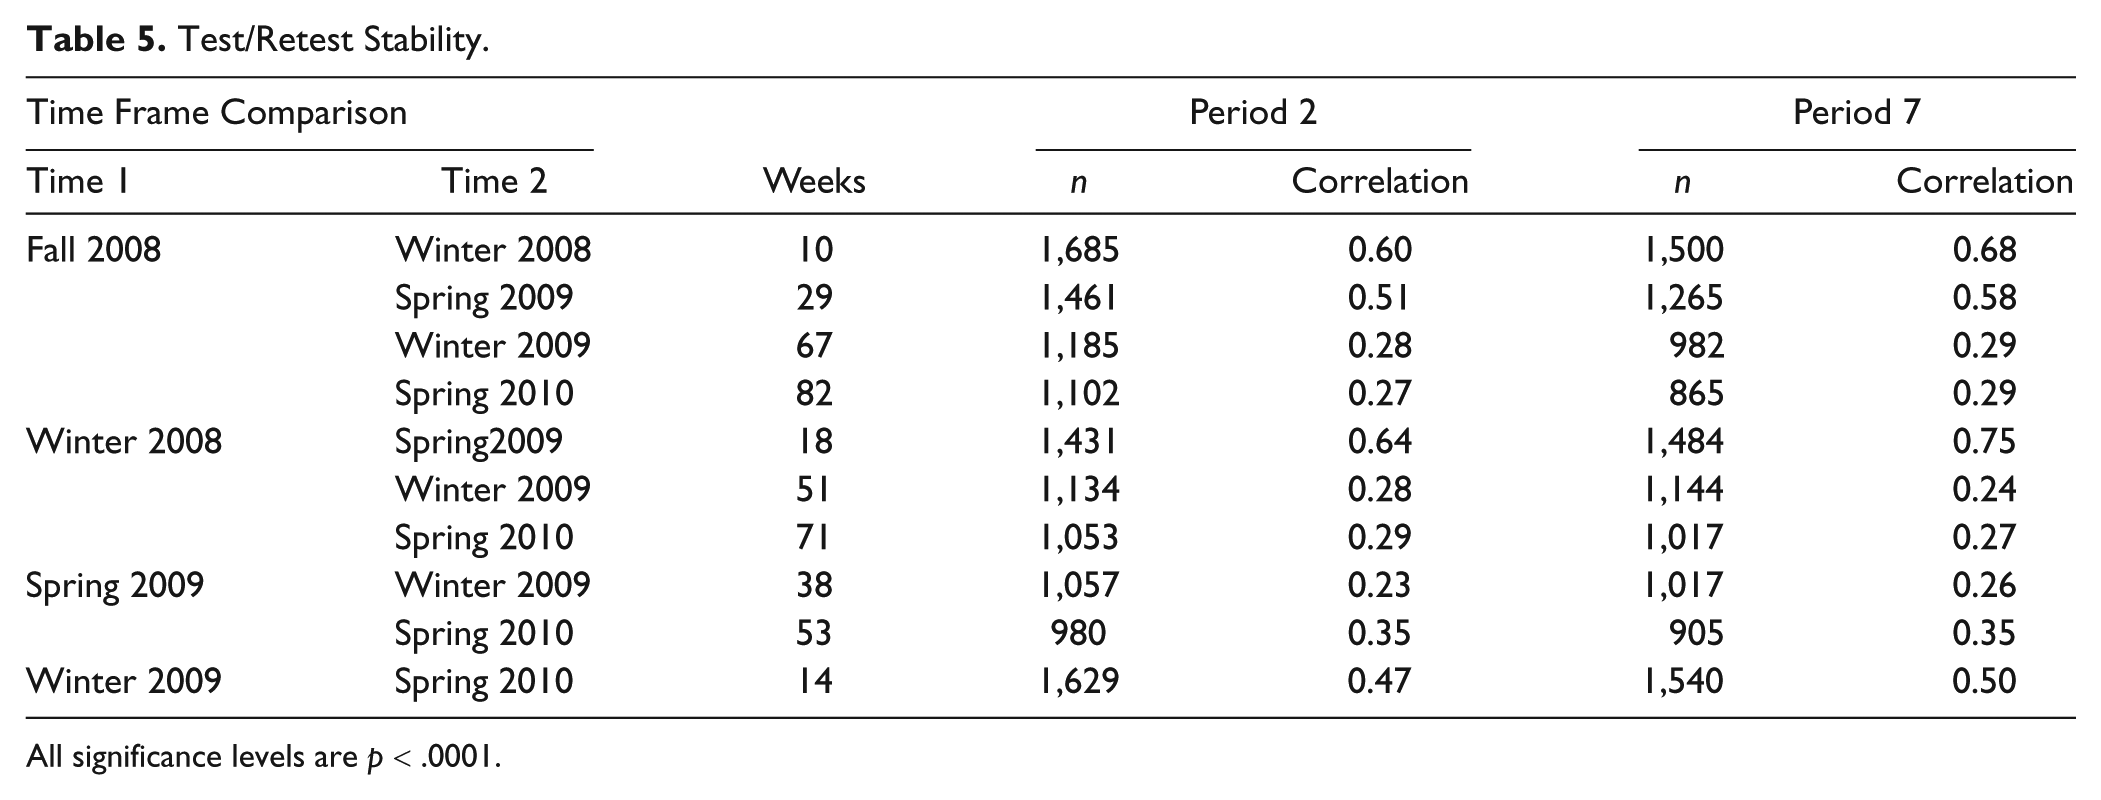
All significance levels are p < .0001.
Inter-rater
Results indicated a statistically significant correlation between Period 2 and Period 7 raters (p < .0001), as evidenced by the following Pearson correlation coefficients: Fall 2008, r(1519) = .28; Winter 2008, r(1663) = .40; Spring 2009, r(1313) = .39; Winter 2009, r(1700) = .29; and Spring 2010, r(1486) = .43.
Predictive Validity
In Table 6, we report outcomes of analyses conducted to determine the extent to which (a) Fall 2008 and (b) Winter 2008 SRSS scores as rated by Period 2 and Period 7 teachers predicted year-end ODR, GPA, and CF values for the 2008–2009 academic year. We also report analyses conducted to determine the extent to which (a) Fall 2008, (b) Winter 2008, (c) Spring 2009, and (d) Winter 2009 SRSS scores as rated by Period 2 and Period 7 teachers predicted year-end ODRs, GPAs, and CFs values for the 2009–2010 academic year.
Behavioral and Academic Characteristics of Risk Groups Using the SRSS.
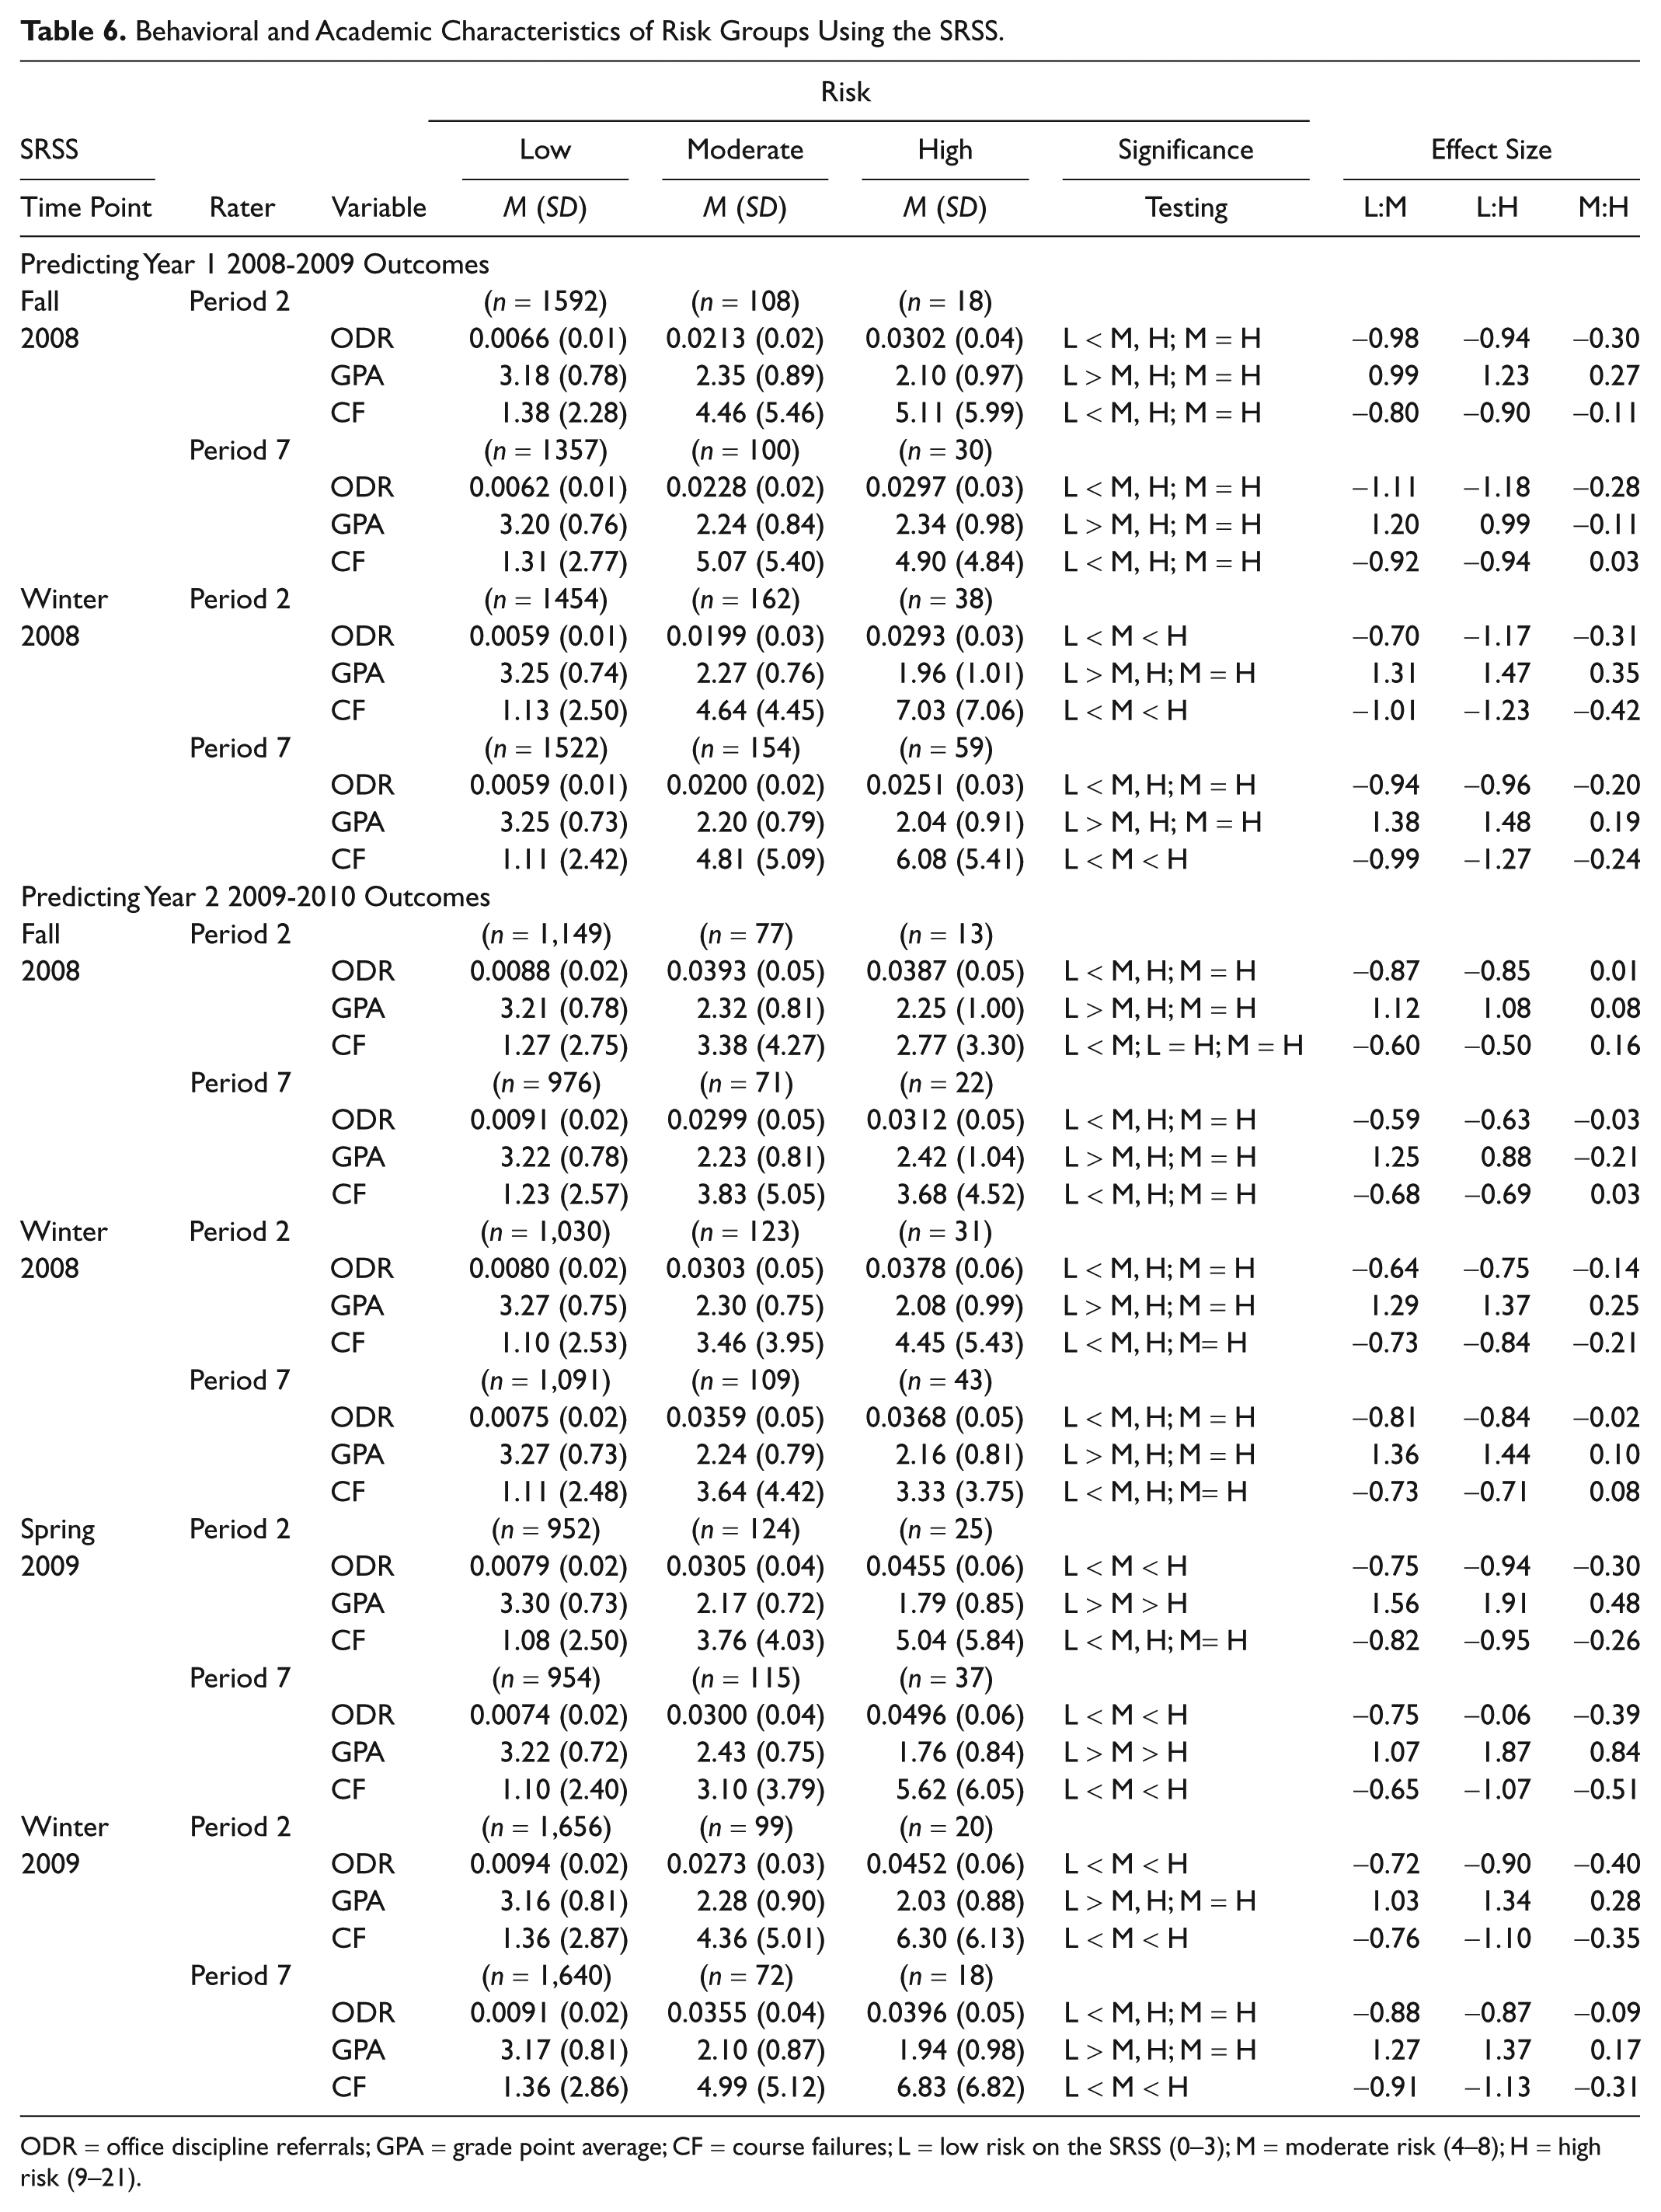
ODR = office discipline referrals; GPA = grade point average; CF = course failures; L = low risk on the SRSS (0–3); M = moderate risk (4–8); H = high risk (9–21).
Predicting Year 1 outcomes, using Fall 2008 scores
Results of a MANOVA comparing low-, moderate-, and high-risk groups according to Fall 2008 Period 2 ratings on behavior (ODRs) and academic (GPA, CF) characteristics yielded a significant multivariate effect, Wilks’s lambda = .90, F(6, 3426) = 32.05, p < .0001, accounting for 10% of the explained variance between groups. Findings of univariate ANOVAs indicated a group effect for ODR, F(2, 1715) = 64.01, p < .0001; GPA, F(2, 1715) = 72.09, p < .0001; and CF, F(2, 1715) = 61.67, p < .0001. The low-risk group could be differentiated from the moderate- and high-risk groups on ODR, GPA, and CF, with the lower risk group having significantly fewer ODRs and CFs and significantly higher GPAs during the 2008–2009 academic year than the moderate- (ES = −0.98, −0.80, and 0.99, respectively) or high-risk (ES = −0.94, −0.90, and 1.23, respectively) groups. There was not a statistically significant difference between moderate- and high-risk groups on ODR, GPA, or CF variables (ES = −0.30, 0.27, and −0.11, respectively).
The same pattern of results was observed for Period 7 ratings. Results of a MANOVA comparing low-, moderate-, and high-risk groups according to Fall 2008 Period 7 ratings on behavior (ODRs) and academic (GPA, CF) characteristics yielded a significant multivariate effect, Wilks’s lambda = 84, F(6, 2964) = 43.79, p < .0001, accounting for 16% of the explained variance between groups. Findings of univariate ANOVAs indicated a group effect for ODR, F(2, 1484) = 87.69, p < .0001; GPA, F(2, 1484) = 86.13, p < .0001; and CF, F(2, 1484) = 87.45, p < .0001. The low-risk group could be differentiated from the moderate- and high-risk groups on ODR, GPA, and CF, with the lower risk group having significantly fewer ODRs and CFs and significantly higher GPAs during the 2008–2009 academic year than the moderate- (ES = −1.11, −0.92, and 1.20, respectively) or high-risk (ES = −1.18, −0.94, and 0.99, respectively) groups. There was not a statistically significant difference between moderate- and high-risk groups on ODR, GPA, or CF variables (ES = −0.28, −0.11, and 0.03, respectively).
Using Winter 2008 scores
Results of a MANOVA comparing low-, moderate-, and high-risk groups according to Winter 2008 Period 2 teachers’ ratings on behavior (ODRs) and academic (GPA, CF) characteristics yielded a significant multivariate effect, Wilks’s lambda = .78, F(6, 3298) = 71.03, p < .0001, accounting for 22% of the explained variance between groups. Findings of univariate ANOVAs indicated a group effect for ODR, F(2, 1651) = 96.90, p < .0001; GPA, F (2, 1651) = 172.05, p < .0001; and CF, F(2, 1651) = 171.66, p < .0001. The low-risk group could be differentiated from the moderate- and high-risk groups on GPA, with the lower risk group having significantly higher GPAs during the 2008–2009 academic year than the moderate- (ES = 1.31) or high-risk (ES =1.47) groups. There was not a statistically significant difference between moderate- and high-risk groups on GPA (ES = 0.35). In terms of ODR and CF data, the Winter 2008 scores could differentiate all three risk groups on these variables, with the low-risk group having significantly fewer ODRs and CFs than the moderate-risk group, which had significantly fewer ODRs and CFs than the high-risk group.
Results of a MANOVA comparing low-, moderate-, and high-risk groups according to Fall 2008 Period 7 ratings on behavior (ODRs) and academic (GPA, CF) characteristics during the 2008–2009 academic year yielded a significant multivariate effect, Wilks’s lambda = .77, F(6, 3460) = 78.64, p < .0001, accounting for 23% of the explained variance between groups. Findings of univariate ANOVAs indicated a group effect for ODR, F(2, 1732) = 99.43, p < .0001; GPA, F(2, 1732) = 203.26, p < .0001; and CF, F(2, 1732) = 186.04, p < .0001. The low-risk group could be differentiated from the moderate- and high-risk groups on ODR and GPA, with the lower risk group having significantly fewer ODRs and higher GPAs during the 2008–2009 academic year than the moderate- (ES = −0.94 and 1.38, respectively) or high-risk (ES = −0.96 and 1.48, respectively) groups. There was not a statistically significant difference between moderate- and high-risk groups on ODR or GPA variables (ES = −0.20 and 0.19, respectively). All three groups could be differentiated on CF, with the low-risk group having significantly fewer CFs than students in the moderate-risk group who have fewer CFs than the high-risk group.
Predicting Year 2 outcomes, using Fall 2008 scores
Results of a MANOVA comparing low-, moderate-, and high-risk groups according to Fall 2008 Period 2 ratings on behavior (ODRs) and academic (GPA, CF) characteristics at the end of the second academic year (2009–2010) yielded a significant multivariate effect, Wilks’s lambda = .87, F(6, 2468) = 28.03, p < .0001, accounting for 13% of the explained variance between groups. Findings of univariate ANOVAs indicated a group effect for ODR, F(2, 1236) = 62.17, p < .0001; GPA, F(2, 1236) = 54.61, p < .0001; and CF, F(2, 1236) = 20.82, p < .0001. The low-risk group could be differentiated from the moderate- and high-risk groups on ODR and GPA, with the lower risk group having significantly fewer ODRs and significantly higher GPAs during the 2009–2010 academic year than the moderate- (ES = −0.87 and 1.12, respectively) or high-risk (ES = −0.85 and 1.08, respectively) groups. There was not a statistically significant difference between moderate- and high-risk groups on ODR or GPA (ES = 0.01 and 0.08, respectively). In terms of CF, the low-risk group had statistically significantly fewer CF than the moderate-risk group (ES = −0.60). However, the other risk groups were not differentiated in terms of statistical significance tests. Yet effect sizes suggest moderate differences between low- and high-risk groups (ES = −0.50).
Results of a MANOVA comparing low-, moderate-, and high-risk groups according to Fall 2008 Period 7 teachers’ ratings on behavior (ODRs) and academic (GPA, CF) characteristics during the second academic year (2009–2010) also yielded a significant multivariate effect, Wilks’s lambda = 89, F(6, 2128) = 21.62, p < .0001, accounting for 11% of the explained variance between groups. Findings of univariate ANOVAs indicated a group effect for ODR, F(2, 1066) = 28.65, p < .0001; GPA, F(2, 1066) = 60.59, p < .0001; and CF, F(2, 1066) = 34.41, p < .0001. For Period 7, raters’ Fall 2008 scores showed the same predictive pattern in terms of Year 1 and Year 2 outcomes, although the magnitude of the prediction was slightly less when predicting ODRs and CFs. Namely, the low-risk group could be differentiated from the moderate- and high-risk groups on ODR, GPA, and CF, with the lower risk group having significantly fewer ODRs and CFs and significantly higher GPAs during the 2009–2010 academic year than the moderate- (ES = −0.59, −0.68, and 1.25, respectively) or high-risk (ES = −0.63, −0.69, and 0.88) groups. There was not a statistically significant difference between moderate- and high-risk groups on ODR, GPA, or CF variables (ES = −0.03, −0.21, and 0.03).
Using Winter 2008 scores
Results of a MANOVA comparing low-, moderate-, and high-risk groups according to Winter 2008 Period 2 teachers’ SRSS scores on behavior (ODRs) and academic (GPA, CF) characteristics during the second academic year (2009–2010) yielded a significant multivariate effect, Wilks’s lambda, = .81, F(6, 2358) = 44.17, p < .0001, accounting for 19% of the explained variance between groups. Findings of univariate ANOVAs indicated a group effect for ODR, F(2, 1181) = 62.23, p < .0001; GPA, F(2, 1181) = 122.59, p < .0001; and CF, F(2, 1181) = 56.59, p < .0001. Namely, the low-risk group could be differentiated from the moderate- and high-risk groups on ODR, GPA, and CF, with the lower risk group having significantly fewer ODRs and CFs and significantly higher GPAs during the 2009–2010 academic year than the moderate- (ES = −0.64, −0.73, and 1.29, respectively) or high-risk (ES = −0.75, −0.84, and 1.37) groups. There was not a statistically significant difference between moderate- and high-risk groups on ODR, GPA, or CF variables (ES = −0.14, 0.25, and −0.21).
Results of a MANOVA comparing low-, moderate-, and high-risk groups according to Fall 2008 Period 7 teachers’ ratings on behavior (ODRs) and academic (GPA, CF) characteristics during the second academic year (2009–2010) yielded a significant multivariate effect, Wilks’s lambda = 78, F(6, 2476) = 54.61, p < .0001, accounting for 22% of the explained variance between groups. Findings of univariate ANOVAs indicated a group effect for ODR, F(2, 1240) = 92.27, p < .0001; GPA, F(2, 1240) = 136.38, p < .0001; and CF, F(2, 1240) = 52.77, p < .0001. The same pattern of results was observed for Period 7 ratings according to the Winter 2008 time point on all three variables. The low-risk group could be differentiated from the moderate- and high-risk groups on ODR, GPA, and CF, with the lower risk group having significantly fewer ODRs and CFs and significantly higher GPAs during the 2009–2010 academic year than the moderate- (ES = −0.81, −0.73, and 1.36, respectively) or high-risk (ES = −0.84, −0.71, and 1.44, respectively) groups. There was not a statistically significant difference between moderate- and high-risk groups on ODR, GPA, or CF variables (ES = −0.02, 0.10, and 0.08, respectively).
Using Spring 2009 scores
Results of a MANOVA comparing low-, moderate-, and high-risk groups according to Spring 2009 Period 2 teachers’ ratings on behavior (ODRs) and academic (GPA, CF) characteristics during the second academic year (2009–2010) yielded a significant multivariate effect, Wilks’s lambda = .74, F(6, 2192) = 59.50, p < .0001, accounting for 26% of the explained variance between groups. Findings of univariate ANOVAs indicated a group effect for ODR, F(2, 1098) = 69.35, p < .0001; GPA, F(2, 1098) = 175.17, p < .0001; and CF, F(2, 1098) = 69.92, p < .0001. The last screening time point differentiated between the three risk groups in terms of ODR and GPA, with the low-risk group having statistically more ODRs and lower GPAs than the moderate group, which had statistically more ODRs and lower GPAs than the high-risk group. However, the low-risk group could be differentiated from the moderate- and high-risk groups on CF, with the lower risk group having significantly fewer CFs during the 2009–2010 academic year than the moderate- (ES = −0.82) or high-risk (ES = −0.95) groups. There was not a statistically significant difference between moderate- and high-risk groups on the CF variables (ES = −0.26).
Spring 2009 scores of Period 7 raters differentiated between all three groups on all three variables. Results of a MANOVA comparing low-, moderate-, and high-risk groups according to Spring 2009 Period 7 teacher ratings on behavior (ODRs) and academic (GPA, CF) characteristics during the second academic year (2009–2010) yielded a significant multivariate effect, Wilks’s lambda = 76, F(6, 2202) = 53.49, p < .0001, accounting for 24% of the explained variance between groups. Findings of univariate ANOVAs indicated a group effect for ODR, F(2, 1103) = 104.69, p < .0001; GPA, F(2, 1103) = 124.51, p < .0001; and CF, F(2, 1103) = 69.97, p < .0001. Students in the low-risk group had significantly fewer ODRs and CF and higher GPAs than students in the moderate-risk group, who had significantly fewer ODRs and CFs and high GPAs than students in the high risk group.
Using Winter 2009 scores
Winter 2009 scores yielded the same pattern of results in predicting Year 2 outcomes, as did the Winter 2008 scores in predicting Year 1 outcomes. Results of a MANOVA comparing low-, moderate-, and high-risk groups according to Winter 2009 Period 2 teachers’ ratings on behavior (ODRs) and academic (GPA, CF) characteristics during the second academic year (2009–2010) yielded a significant multivariate effect, Wilks’s lambda = .90, F(6, 3540) = 30.73, p < .0001, accounting for 10% of the explained variance between groups. Findings of univariate ANOVAs indicated a group effect for ODR, F(2, 1772) = 49.84, p < .0001; GPA, F(2, 1772) = 71.21, p < .0001; and CF, F(2, 1772) = 67.86, p < .0001. The low-risk group could be differentiated from the moderate- and high-risk groups on GPA, with the lower risk group having significantly higher GPAs during the 2009–2010 academic year than the moderate- (ES = 1.03) or high-risk (ES =1.34) groups. There was not a statistically significant difference between moderate- and high-risk groups on GPA (ES = 0.28). In terms of ODR and CF data, the Winter 2009 scores could differentiate all three risk groups on these variables, with the low-risk group having significantly fewer ODRs and CFs than the moderate-risk group, which had significantly fewer ODRs and CFs than the high-risk group.
Results of a MANOVA comparing low-, moderate-, and high-risk groups according to Winter 2009 Period 7 teachers’ ratings on behavior (ODRs) and academic (GPA, CF) characteristics during the second academic year (2009–2010) yielded a significant multivariate effect, Wilks’s lambda = 89, F(6, 3450) = 35.10, p < .0001, accounting for 11% of the explained variance between groups. Findings of univariate ANOVAs indicated a group effect for ODR, F(2, 1727) = 62.14, p < .0001; GPA, F(2, 1727) = 77.61, p < .0001; and CF, F(2, 1727) = 75.90, p < .0001. The low-risk group could be differentiated from the moderate- and high-risk groups on ODR and GPA, with the lower risk group having significantly fewer ODRs and significantly higher GPAs during the 2009–2010 academic year than the moderate- (ES = −0.88 and 1.27, respectively) or high-risk (ES = −0.87 and 1.37, respectively) groups. There was not a statistically significant difference between moderate- and high-risk groups on ODR or GPA variables (ES = −0.09 and 0.17, respectively). The three groups could be differentiated on CF, with the low-risk group having significantly fewer CFs than the moderate-risk group, who had significantly fewer CFs than the high-risk group.
Multiple raters: Are they necessary?
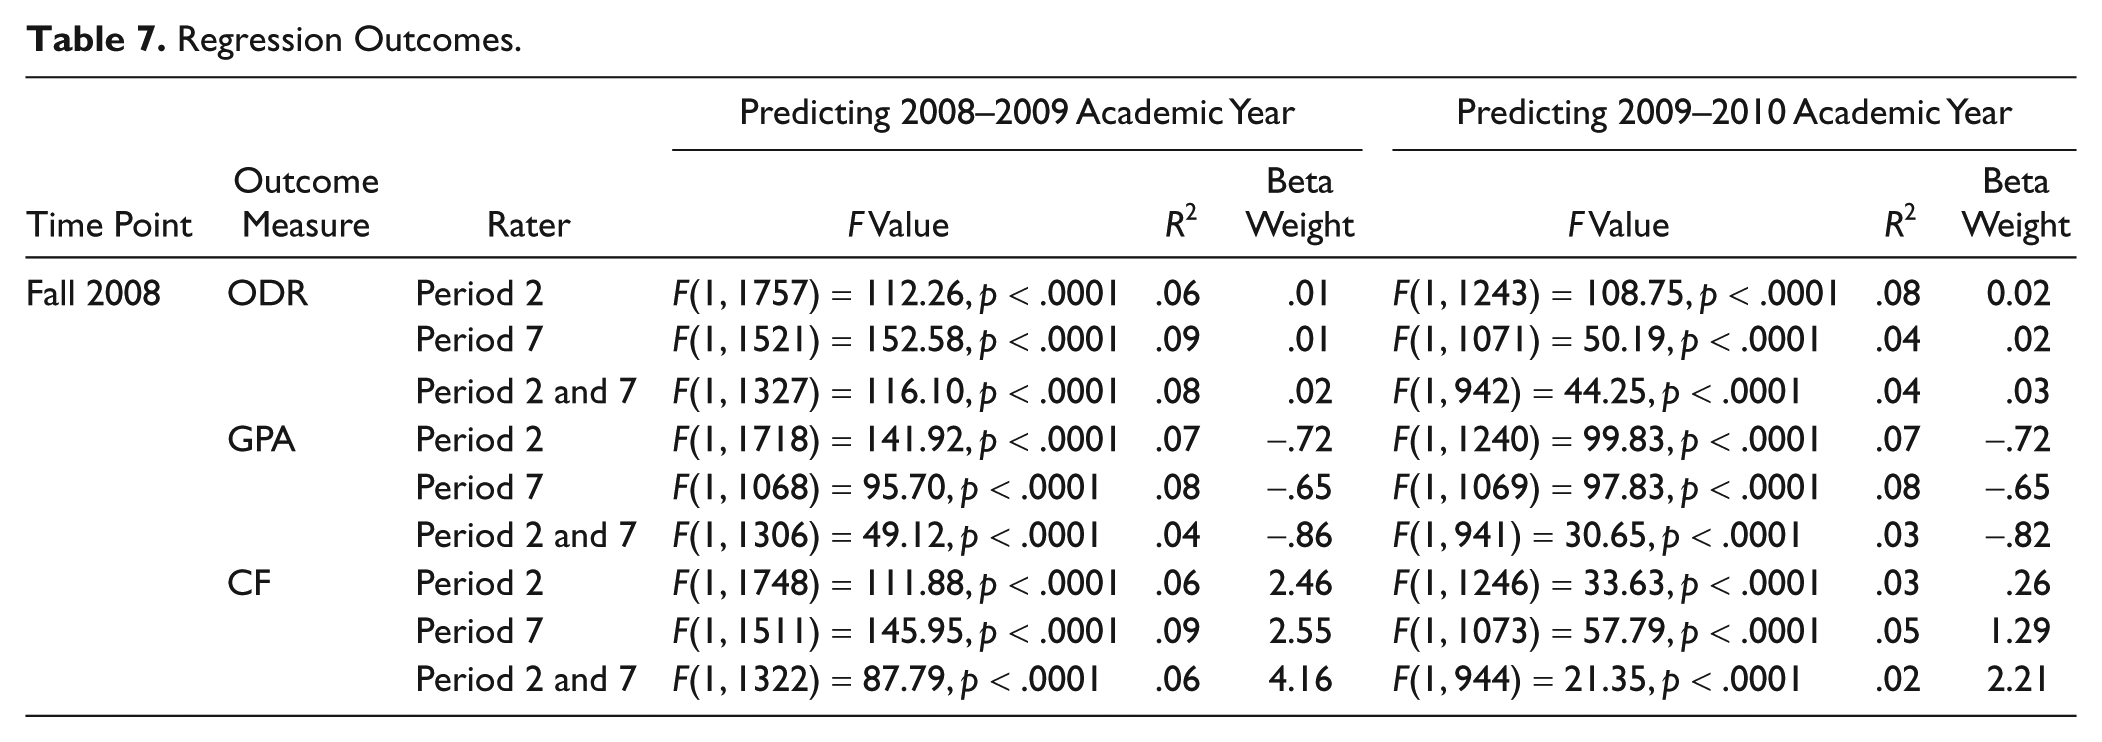
In Table 7, we provided results of a series of regression analyses. Results indicated Fall 2008 SRSS categorical risk status scores according to only Period 2, only Period 7, and Period 2 and 7 teacher ratings combined (e.g., both teachers indicating low, moderate, or high risk) predicted ODR rates, GPA, and course failures for the 2008–2009 and 2009–2010 academic year. The proportion of explained variance was consistently low, regardless of raters, in each instance. Yet the proportion of explained variance was highest with Period 7 teachers as the raters. Requiring two teachers to indicate a cause for concern did not improve the predictive validity of the SRSS. This indicated that students with higher levels of risk, as measured by the SRSS—particularly as rated by Period 7 raters—just 6 weeks after the school year began, were likely to have higher ODR rates, lower GPAs, and more course failures relative to students with lower levels of risk.
Regression Outcomes.
Discussion
The high school years pose significant challenges to even the most adept students but are a particularly formidable time for high school students with and at risk for EBD (Parker et al., 2006; Roderick & Camburn, 1999; Seidman et al., 1996; Sinclair et al., 2005; Wagner et al., 2005). Fortunately, three-tiered models of prevention are available to provide a method of meeting students’ individual needs, including students with EBD, within a system of coordinated supports increasing in intensity (Sugai & Horner, 2002).
Central to these models is accurate identification of which students require secondary and tertiary supports (Lane et al., 2009). Moreover, accurate, feasible measurement systems are a must for determining which students need more than primary prevention efforts. While such systems are available for use, especially in the elementary years, there are very few available for use at no cost at the high school level (e.g., SDQ).
Although the SDQ is a reliable, valid, and no-cost instrument for use at the high school level, it is viewed by some as being rather cumbersome with respect to preparation, administration, and scoring (Lane et al., 2007). This need for reliable, valid, no-cost, and feasible tools for use in middle and high schools led us to the purpose of the current study: to extend the current literature base on the reliability and validity of the SRSS for use at the high school level. A recent study by Lane et al. (2008) provided initial evidence for the utility of the SRSS at the high school level indicating high internal consistency, test-retest stability, convergent validity with SDQ, and predictive validity (ODRs and GPA). However, this study included one small rural school, thereby limiting the generalizability of the findings. The intent of this study is to extend this work by examining the reliability and validity of the SRSS in a larger rural fringe high school (a census-defined rural territory that is less than or equal to 5 miles from an urbanized area, as well as a rural territory that is less than or equal to 2.5 miles from an urban cluster). We explored internal consistency, test-retest stability, inter-rater reliability, and predictive validity.
The SRSS: A Reliable Measure at the High School Level
In the current study, internal consistency estimates ranged from .76 to .82 for Period 2 teacher ratings and from .82 to .87 for Period 7 teacher ratings. Thus, internal consistency was strong for both raters at each of the five administrations. These findings were highly consistent with the internal consistency estimates reported by Lane et al. (2008), which ranged from .78 to .86 for instructional raters and from .79 to .84 for noninstructional (e.g., study hall) raters. However, in the current study, ratings occurring after lunch had higher internal consistency estimates than those occurring in the morning. The time of day during which students were evaluated (e.g., before or after school) was not examined in the previous study. The exploration of time of day during which ratings occurred extends this line of inquiry and confirms the established internal consistency of the SRSS as used in the high school setting.
Next, test-retest stability estimates suggest Period 2 and Period 7 teacher ratings were highly similar, and in some cases exact (Spring 2009 to Spring 2010, r = .35). As expected, correlation coefficients for short test-retest intervals within a given year (e.g., 10 weeks to 29 weeks) were higher (r ranging from .47 to .75, with all but one above .50; Hopkins, 2002) than correlation coefficients for longer test-retest intervals across academic years (e.g., 38 weeks to 82 weeks; r ranging from .23 to .35). However, all test-retest stability estimates were statistically significant (p < .0001), even at the 82-week interval. Collectively, these findings again parallel results of the Lane et al. (2008) study, which reported (a) comparable test-retest stability estimates for both raters and (b) higher reliability estimates within academic years (instructional raters: r ranging from .44 to .71; noninstructional raters: r ranging from .39 to .73) than test-retest stability estimates across academic years (instructional raters: r ranging from. 22 to .30; noninstructional raters: r ranging from .30 to .43), with all statistically significant. Findings from these analyses confirm the stability of SRSS scores over time, adding evidence to the reliability of the SRSS for use as a benchmarking tool for behavioral performance at the high school level.
In addition to being internally consistent and stable across 2 academic years, SRSS scores were also identified as consistent across raters. Namely, inter-rater reliability results suggest SRSS scores were statistically significant (p < .0001) at each of the five screening time points, with correlation coefficients generally increasing within each academic year from the initial reliability estimates. For example, inter-rater reliability estimates increased from .28 at the initial Fall 2008 administration to .40 in Winter 2008 and .39 in Spring 2009. Similarly, the next year the inter-rater reliability estimate increased from .29 in Winter 2009 to .43 in Spring 2010. Again, these findings were comparable to the Lane et al. (2008) study, which reported inter-rater reliability estimates ranging from .35 to .46 in the first academic year and .19 to .50 in the second academic year. Thus, additional evidence is established for inter-rater reliability of the SRSS when used at the high school level.
Collectively, these analyses provide additional evidence to support the reliability of the SRSS for use in a rural fringe high school, as evidenced by high internal consistency estimates, test-retest stability up to 82 weeks, and inter-relater reliability. In addition, there is also evidence to support the validity of the SRSS in this context.
The SRSS: A Valid Measure at the High School Level
In predicting Year 1 outcomes, Fall scores were able to differentiate the low-risk from the moderate- and high-risk groups on ODR, GPA, and CF, with the low-risk group having significantly more ODRs and CFs as well as higher GPAs than the moderate- or high-risk groups. However, it was not possible to differentiate between the moderate- and high-risk groups on these variables. Using the Winter score, predictive validity improved as expected given (a) teachers had an increased amount of time to interact with the students, thereby learning more about their academic and behavioral performance patterns, and (b) the interval between the Winter screening scores and the year-end scores was smaller than the interval between Fall screening scores and year-end scores. In this case, both second- and seventh-period teacher ratings were able to differentiate between all three groups in terms of course failures, with each risk group having a statistically higher number of course failures. Period 2 teacher ratings could also differentiate the low-, moderate-, and high-risk groups in terms of ODRS; however, this was not true for Period 7 teacher ratings. When predicting GPA, Fall and Winter scores from Period 2 and Period 7 raters yielded similar results: Low-risk groups could be differentiated from moderate- and high-risk groups, but not between the moderate- and high-risk groups. The lack of distinction between the moderate- and high-risk groups is an important finding, suggesting any level of risk is cause for concern and warrants further consideration, a point we will address further in terms of educational implications.
Comparable findings were also noted when examining long-term predictive validity (across 2 academic years) of the initial Fall 2008 ratings in predicting Year 2 outcomes: The two risk groups (moderate and high) could not be differentiated. These findings were consistent with Lane et al. (2008), who also reported significant differences between the low-risk group relative to both the moderate- and high-risk groups, with the low-risk group having fewer ODRs and higher GPAs. Yet, as in the current study, the moderate- and high-risk groups could not be differentiated on these variables. However, it should be noted that the Lane, Kalberg et al. study only explored the predictive validity of the initial Fall ratings (Time 1) to Year 2 performance outcomes. Short-term predictive validity (within a single academic year) was not explored. The current study extends this line of inquiry by exploring short-term as well as long-term predictive validity.
In terms of long-term predictive validity, SRSS scores at the end of the first year provided by Period 7 teachers were able to differentiate all three groups of students (low-, moderate-, and high-risk status) on ODR, GPA, and CF. Specifically, according to these ratings, students with low-risk status earned significantly more ODRs, failed more classes, and had a lower GPA than students in the moderate-risk group, who earned more ODRs, failed more classes, and had a lower GPA than students in the high-risk group during the following academic year.
Although preliminary in nature, collective findings of the predictive validity studies suggest that for most time points, the SRSS—regardless of rater—distinguishes between students in the low-risk group from students in the moderate- and high-risk groups on important behavioral (ODR) and academic (GPA and CF) outcomes. Furthermore, given more time to interact with students, teachers’ Winter ratings improve in terms of predictive validity, particularly with respect to course failures. End-of-the-year scores (particularly those scores of teachers working with students later in the day) are highly accurate in predicting student outcomes in terms of ODR, GPA, and CF 1 year later.
In terms of educational implications, we offer three suggestions. First, when looking at initial Fall ratings, we encourage school-site leadership teams to consider supporting students in the moderate- and high-risk groups at the earliest possible juncture given the results of this study suggest students with either moderate- or high-risk status tend to experience negative outcomes. This additional support is particularly necessary if students’ risk status has not improved by the second behavior screening assessment (see Lane et al., 2008, for examples).We recognize it may be challenging to introduce secondary and tertiary levels of preventions for students in both the moderate- and high-risk ranges due to resource issues (e.g., time, money, personnel) as well as make the shift in thinking associated with general education teachers assuming the role of interventionists for students for whom primary prevention is insufficient. It may be helpful for teachers to conceptualize these additional supports as simply differentiating instruction in academic, behavioral, and social domains given that teachers are often quite skilled at differentiating academic instruction. Yet regardless of the challenges, given that outcomes are negative for both risk groups, as evidenced by lower GPAs, more course failures, and higher rates of ODRs, it is essential to intervene to prevent these deleterious outcomes from manifesting. However, as we will discuss later, it is important that these suggestions be interpreted with caution due to sample size issues. Specifically, there were very few students placing into the high-risk categories, which may have reduced the statistical power to detect differences between the moderate- and high-risk groups.
Second, given the collective findings of predictive validity analyses, it would appear that Spring screening data—particularly scores provided by teachers’ evaluations of students with whom they work later in the school day—hold particular promise for predicting students’ behavioral and academic performance during the following year. One highly practical application of this information is to use data to provide supports ideally over the course of the summer or at the onset of the following academic year. For example, it would be possible to analyze Spring screening data in conjunction with other data collected as part of regular school practices to identify students who may benefit from secondary or tertiary supports upon return from school during the following academic year. The school-site leadership team at the school presented in this article did just this, establishing a number of secondary and tertiary supports for returning students for whom primary prevention efforts were insufficient. One secondary support included a mentoring program for 10th-, 11th-, and 12th-grade students. Rising 10th-, 11th-, and 12th-grade students rated as moderate or high risk by the second- or seventh-period teachers during Spring 2010, who also earned a cumulative GPA ≤ 2.75 and more than two ODRs during the 2009–2010 school year, were invited to participate in this year-long support. Each student interested in participating was assigned an individual teacher mentor with whom he or she met each week. The mentors were volunteer teachers who were given specific parameters for working with their student; the goal of the program was to focus on academic achievement, character development, problem-solving skills, relationships with adults and peers, and school attendance.
Third, when considering issues of teacher time needed to complete screenings, if a school-site leadership team decides to involve only one rater, we recommend having teachers evaluate students with whom they teach later in the instructional day. Results of logistic regression procedures clearly indicate Period 7 teacher ratings were actually more predictive (although by a nominal amount) than Period 2 teacher ratings and Period 2 and Period 7 teacher ratings combined. It may be that Period 7 teachers were privy to behaviors that could be characterized as more colorful or lively behavior students tend to exhibit after lunch toward the end of the school day. Liberty’s school-site team was concerned that one rater may be insufficient in detecting students and perhaps students need to be identified as having a concern according to more than one teacher before support is offered. Results of this study indicate this is not the case. Ratings of students’ behavior later in the course of the school day are sufficient to distinguish between which students will—and will not—earn more ODRs, earn lower GPAs, and fail more classes.
Yet we strongly encourage each of these recommendations and considerations to be considered with caution in light of the limitations discussed in the following section.
Limitations and Future Directions
The findings of this study replicate and extend this line of inquiry, suggesting the SRSS may be an effective tool in screening students at-risk for antisocial behaviors at the high school level. However, the results must be interpreted in light of the following limitations. First, this study was only conducted in one moderate-to-large, rural fringe high school whose student body was predominately Caucasian. To establish generalizability, additional studies at the high school level must be conducted in more diverse schools, in other locales (e.g., suburban and urban areas), and in other geographic regions.
Second, as in the Lane et al. (2008) study, there were a relatively small number of students scoring in the high-risk category. For example, in Fall 2008, Period 2 teachers identified only 18 students in this high-risk category. The number for students scoring in the high-risk category varied by rater and time point, with numbers ranging from 18 (Fall 2008, Period 2 rater; Winter 2009, Period 7 rater) to 59 (Winter 2008, Period 7 rater). Given the low sample sizes for this risk category, definitive conclusions cannot be drawn with respect to the predictive validity in discriminating between risk groups. Additional replication is necessary to establish the generalizability of these findings. It is possible that this lack of differentiation between moderate- and high-risk groups may indicate the need for either including additional items to the current SRSS measure or a more sensitive measure for use at the high school level. However, we strongly recommend continuing this line of inquiry to explore the utility of the current instrument at the high school level with additional schools and greater numbers of students in the high-risk category before looking toward another tool. As mentioned previously, it is quite possible there may not have been sufficient power to detect differences between the moderate- and high-risk categories.
Third, as explained in the Method section, there were challenges associated with data collection, particularly during the 2009–2010 school year. Namely, the Fall 2009 screening data were not able to be analyzed given the first item (steals) was inadvertently omitted from the screening tool. Also, due to changes in the ODR data collection systems, Fall 2009 Quarter 1 ODR data were not collected and recording consistently. Therefore, the 2009–2010 ODR rates reflect only Quarters 2, 3, and 4 data rather than the entire academic year, as was reported for the 2008–2009 academic year. Consequently, it was not possible to examine changes in the rates of ODRs earned across academic years. Given the challenges with data collection noted in this study, we recommend future inquiry to explore methods of improving data collection at the high school level. In our own work, we have been working to establish new systems and structures for educating K-12 leadership teams on the importance and value of consistent, accurate data monitoring. We have also been working directly with superintendents and district-level data management teams to establish reliable, valid data collection systems to ensure the accuracy of the information collected, with the goal of providing precise answers to important questions (e.g., Which students are likely to earn office discipline referrals this year? Which students are in danger of failing courses?) and inform intervention efforts.
Fourth, although the school-site leadership team elected to institutionalize behavior screenings as part of regular school practices, some teachers were resistant and required multiple prompts from the team to complete the SRSS as requested. Future research is needed to explore teacher perceptions of the screening tools, with particular attention to issues of feasibility and utility. The field needs additional information on the bridges and barriers to implementing school-wide screening procedures at the high school level (Lane et al., 2009).
Fifth, this article presented psychometric evidence of the reliability and validity of the SRSS. Yet certain measurement issues such as dependency within the current sample and reliability of the existing cut scores should be considered when interpreting the results. Unlike traditional tests of individual differences, the SRSS respondent is the teacher, not the student. In addition to student characteristics, scores may reflect rater characteristics as well, possibly inflating internal-consistency reliability. Moreover, because teachers are rating all students in their Period 2 and Period 7 classes (in contrast to a design in which students provide independently completed self-report ratings), ratings within each class are not independent. It is possible that any rater bias would tend to increase the alpha coefficients. However, the precise impact of the nesting factor is unknown. In the future, multi-rater studies could determine whether the variance due to rater is negligible or large and whether differences among raters influence reliability. In the current study, we were analyzing data collected as part of regular school practices as part of a comprehensive, integrated, three-tiered model of prevention. The school used these data to (a) monitor the overall level of risk evident in a building over time and (b) identify students who might benefit from additional supports in the form of secondary (Tier 2) and tertiary (Tier 3) supports (see Lane et al., 2009). Consequently, these measurement issues could not be addressed. However, we do think the issues of dependency as well as reliability of the existing cutoff scores are important considerations warranting future inquiry. Namely, the intent of this article was to extend this line of inquiry at the high school level by presenting standard psychometric analyses of the SRSS implemented in one high and not to explore the accuracy of the existing cutoff scores for the SRSS as established by Drummond (1994). We encourage more sophisticated studies examining (a) reliability estimates for the scores analyzed (e.g., low-, moderate-, and high-risk categories) and (b) samples collected to avoid the nested nature of the data currently analyzed (e.g., psychometric studies in which a large number of teachers across multiple geographic regions randomly select and rate just one student in their class to allow for independent ratings). Clearly, such large-scale investigations would warrant significant grant funding. Yet given the costs associated with not supporting students with antisocial behavior tendencies, the investment is more than justified (Kauffman & Brigham, 2009; Wagner et al., 2006; Walker et al., 2004).
Finally, we also remind the reader that although Liberty High School conducted assessments—including the SRSS behavioral screening tool—as part of regular school practices, it did receive technical assistance in analyzing its data and identifying supports for students for whom primary prevention efforts were insufficient. As such, future research will need to examine the degree to which school-site leadership teams can design, implement, and evaluate such integrated programs of support in isolation from university partnership or other sources of support.
Summary
Despite these limitations, this study extends the knowledge base with respect to the reliability and validity of the SRSS for use in the high school setting. Findings provide additional evidence to suggest the SRSS may be a reliable and valid tool for use with 9th- through 12th-grade students attending rural fringe high schools. In addition to establishing internal consistency, test-retest stability, and inter-rater reliability, results indicated that students with higher levels of risk, as measured by the SRSS—particularly as rated by Period 7 raters—just 6 weeks after the school year began, were likely to have higher ODR rates, lower GPAs, and more CFs relative to students with lower levels of risk. Although this is the first study examining the utility of the SRSS in a moderate-to-large, rural fringe high school, school-site leadership teams at high schools may want to consider conducting screenings later in the day (e.g., after lunch), particularly if they elect to have only one rater complete the screening tools. However, before schools make decisions as to whether one rater is sufficient at the high school level, we encourage additional inquiry to establish inter-rater reliability at the high school level. Given most high schools afford approximately 45 min instructional blocks, we need to be certain this is sufficient time to yield accurate SRSS scores predictive of important outcomes (behaviorally, socially, and academically) for high school students.
Footnotes
Acknowledgements
We would like to thank the reviewers for their thoughtful, detailed feedback. We greatly appreciate your input in shaping this study.
Declaration of Conflicting Interests
The authors declared no potential conflicts of interests with respect to the authorship and/or publication of this article.
Funding
This research was supported in part by the Project support and include a technical assistance grant from the Tennessee Department of Education (#GR-10-27642-00) and NICHD grant # P30HD15052 to Vanderbilt University. For inquiries regarding this article, please contact Kathleen Lynne Lane, Ph.D., Department of Special Education, Peabody College, Box 328, Vanderbilt University, Nashville, TN 37203-5721,