
Abstract
In this article, we explore the individual and organizational outcomes associated with a move from traditional buildings to three green buildings. Our findings revealed that high-level organizational measures were not notably affected by the move. Changes were, however, seen in physical well-being and perceived environmental comfort. The primary drivers were air quality and lighting. The need to consider human factors/ergonomics in green building design has been recognized by the Green Building Council of South Africa as an industry standard and as the starting point for the development of an interior design rating tool. Longer-term impacts of green buildings on organizationally relevant indicators still need to be established.
Keywords
Contributions from ergonomists studying employee well-being in green buildings could influence green building standards in South Africa.
There is growing evidence from several scientific disciplines that human activities – especially people’s reliance on fossil fuels (but also deforestation and poor agricultural practices) – have resulted in severe degradation of multiple ecosystem services, which now threatens human well-being in many parts of the world (Intergovernmental Panel on Climate Change, 2007). The most publicized impacts are referred to as climate change or global warming. Millions of people are threatened by changing weather systems, and the places in which they choose, or are forced, to live exacerbate these natural phenomena. Widely publicized examples include the devastation caused by Hurricanes Sandy and Katrina and famine caused by crop failures in East Africa.
In addition to pumping more carbon dioxide (CO2) and methane (CH4) into the atmosphere, people’s continued dependence on fossil fuels for energy needs has led to increasingly desperate (and environmentally damaging) extraction methods, sometimes resulting in the contamination of related natural resources – for example, the Deep Water Horizon oil spill or the contamination of groundwater from exploratory “fracking.”
The need to combat such environmental damage is now of global concern. The Intergovernmental Panel on Climate Change (2007) noted that significant mitigation gains could be achieved from better building design and that the biggest potential gains were in developing countries. People now spend a considerable amount of time in buildings (estimates are between 80% and 90%; see Klepeis et al., 2001), so it is not surprising that an important component of human energy use comes from the built environment. It is estimated that building use contributes as much as 40% of energy consumption in industrially developed countries (Pérez-Lombard, Ortiz, & Pout, 2008). Office buildings also consume proportionately more than other types of buildings, with the energy consumption arising primarily from heating, ventilating, and air conditioning (HVAC) and lighting systems.
Energy consumption levels are particularly relevant in South Africa, given its heavy reliance on coal-fired power stations (approximately 90% of power generation comes from this source; see Spalding-Fecher & Matibe, 2003), which has a significant impact on the environment and on increased CO2 in the atmosphere. South Africa has the highest greenhouse gas emission in Africa (Carbon Dioxide Information Analysis Center, 2009), partly because of its relatively sophisticated built environment infrastructure and partly because of its reliance on fossil fuels for energy generation.
Against this background, there is increasing interest in South Africa to develop green buildings. Large organizations are beginning to incorporate green design principles when building new offices or when refurbishing old ones, and recently, a green building rating system was launched (details provided later). Over and above the environmental benefits associated with green buildings, it has been suggested that such buildings can offer occupants a healthier and more productive workspace. However, there is still relatively little empirical research on the individual and organizational outcomes associated with green building design (Singh, Syal, Grady, & Korkmaz, 2010), and the results of studies that have been published are inconsistent (Hedge & Dorsey, 2012; Heerwagen & Zagreus, 2005).
The aim of our research was to contribute to this growing body of literature by tracking changes in employees’ well-being, productivity, absenteeism, presenteeism, and propensity to continue working for an organization across different green-rated buildings. First, however, we explain what we mean by green buildings and describe the South African green building rating system. We also provide a “green ergonomics framework” as a lens through which to view and understand the human occupancy of green buildings.
Green Buildings
The U.S. Environmental Protection Agency (2010) defines green in the context of building as “the practice of creating structures and using processes that are environmentally responsible and resource-efficient throughout a building’s life-cycle.” In 2008, the Green Building Council of South Africa (GBCSA) launched its first building-rating tool, derived from an Australian rating system, called GreenStar South Africa (GreenStar SA) Office. With the GreenStar SA rating system, one looks at a range of design elements for reducing the impact of the building on the environment, including energy, water, emissions, building materials, land use, integration with transport systems, and building management practices. The rating system allows for up to 100 points to be obtained in nine categories and uses a star rating system based on the number of total points achieved; that is, 45 to 59 points (four stars), 60 to 74 points (five stars), and 75 to 100 points (six stars).
The GreenStar SA Office tool also encourages the design of a productive, healthy, and comfortable working environment through a focus on indoor environmental quality (IEQ). The factors that determine good IEQ are derived from multiple research sources, including environmental health (Evans, 2003), environmental engineering (Heschong, Wright, & Okura, 2002), environmental psychology (Parsons, 1991), and environmental ergonomics (Hedge, 2000). In general, the research findings suggest that building occupants would benefit from increased ventilation, better air quality (notably more fresh air in the ventilation system and reduced volatile organic compounds [VOC] levels), reduced flicker on lighting components, increased daylight, external views, thermal comfort, and greater control over workplace environmental conditions. Given the competing demands of energy savings, cost savings, and occupant satisfaction, it is not always possible (or perhaps even necessary) to meet all these IEQ demands.
A green ergonomics framework forces one to look at IEQ in a different way. Green ergonomics looks at how those of us in human factors/ergonomics (HF/E) might apply ergonomics knowledge to conserve, preserve, and even restore natural environments and how we might draw inspiration and lessons from natural systems on how ecosystems are able to integrate and be sustainably efficient and productive (Thatcher, 2012). Such an examination leads us to understand green ergonomics as a bidirectional interplay between humans and nature (see Figure 1).
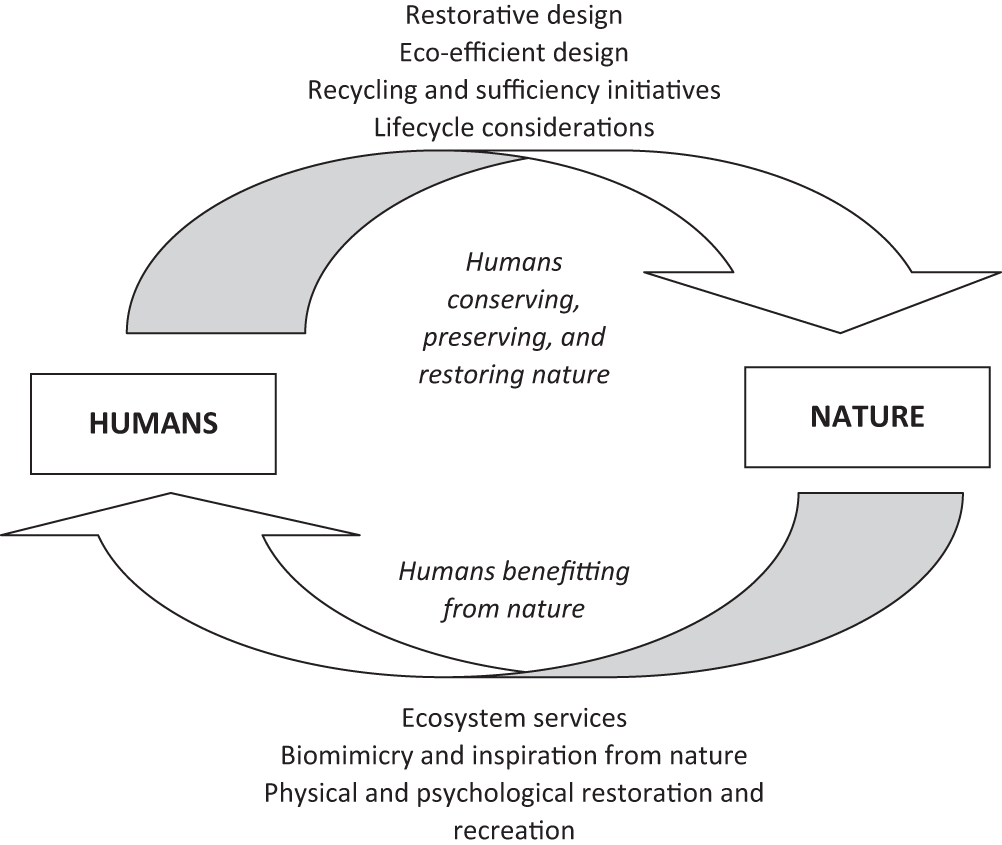
Bidirectional relationships for green ergonomics.
From this perspective, not every green building design intervention that addresses IEQ is necessarily environmentally sustainable. For example, increasing ventilation for higher airflow levels might well necessitate increased energy use for the HVAC system. Similarly, not every environmentally sustainable design solution is necessarily good for human well-being. For example, increasing the daylight component of lighting might result in unnecessary glare or thermal discomfort. On the whole, ergonomics considerations are rarely, if ever, taken into account when designing green buildings (Hedge & Dorsey, 2012).
This Study’s Green Buildings
In this study, we were interested in investigating which of the building design elements specified in the GreenStar SA Office tool were likely to make the biggest impact on occupant well-being and productivity. From the outset, we recognized that this would be a difficult task, as most building designs incorporate multiple IEQ design elements that are not under the control of the researchers. On the other hand, green buildings are more likely to incorporate multiple “good” IEQ design elements than are traditional buildings. Using a range of green buildings allowed us to map the different IEQ factors against any changes in individual and organizational well-being outcomes associated with the move from traditional to green buildings.
The three buildings in this study were from Nedbank, a large South African commercial banking organization; two buildings were given a four-star rating and one building obtained a five-star rating, although each building had different design features. The first building, Nedbank Phase II (36,246 m2), located in Johannesburg, was first occupied in August 2010 and achieved a rating of 46 points (see Figures 2 and 3). This was the first building accredited under the GreenStar SA Office Version 1 rating tool. Nedbank Phase II features a ventilation system with a rate of fresh air intake twice the national standard, a monitoring system for CO2 levels connected to the ventilation system, reduced-flicker lighting systems that are movement sensitive, interior paints and carpeting with reduced VOC levels, and 80% of the office area having exterior views. Phase II also has a rainwater catchment system, a “black” water treatment facility, and 95% recycled steel in the main frame of the building.

Phase II building exterior.
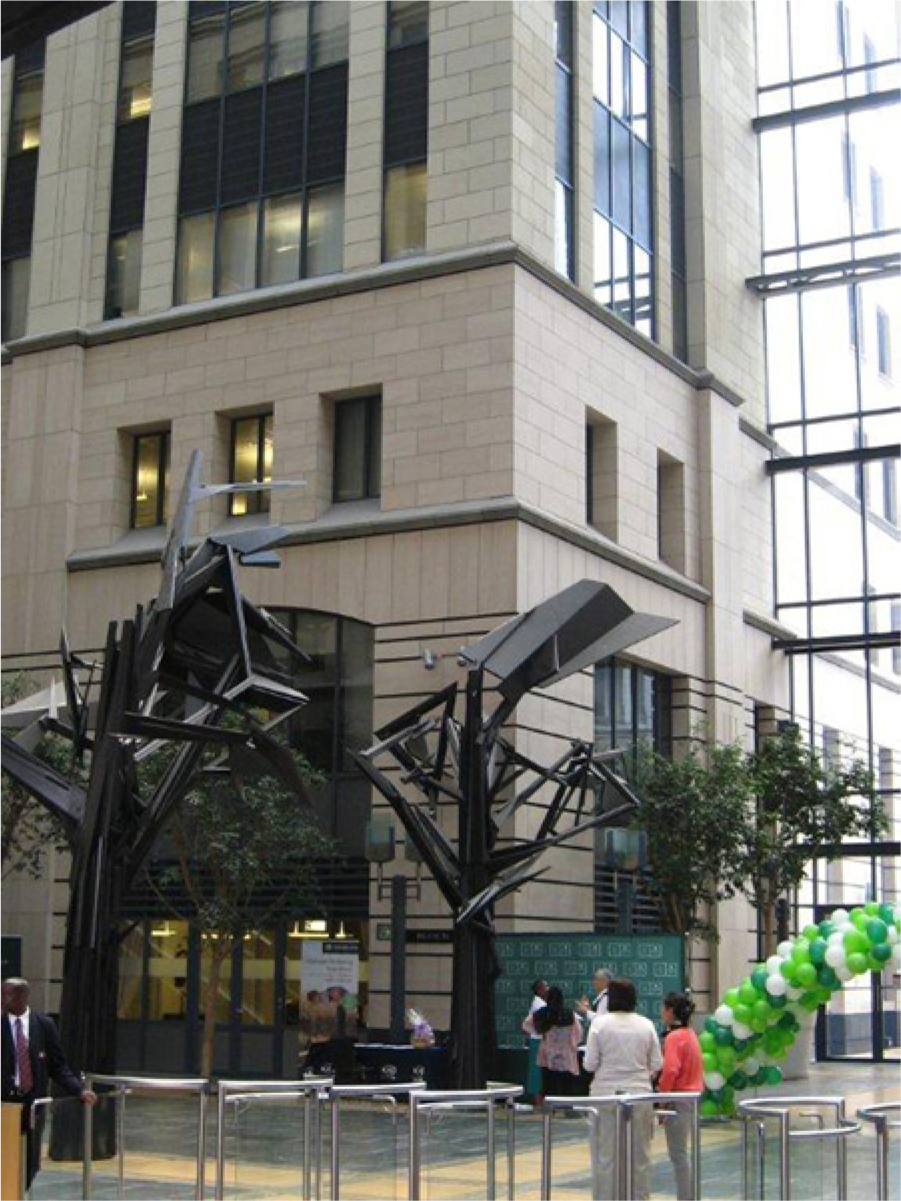
Phase II building atrium.
The second building, Umhlanga Ridgeside (9,294 m2), located just outside Durban, was occupied in March 2011 and achieved a rating of 52 points (see Figures 4 and 5). It was one of the first five buildings accredited with the same rating tool. Ridgeside has a ventilation system with a rate of fresh air intake 50% higher than the national standard, a monitoring system for CO2 levels, reduced-flicker and movement-sensitive lighting, exterior sun shading, and reduced VOC levels, and 60% of the office area has exterior views. Ridgeside has a rainwater collection system, indigenous landscaping, a 30% fly-ash component in cement for the building, and measures to encourage pedestrians and cyclists.
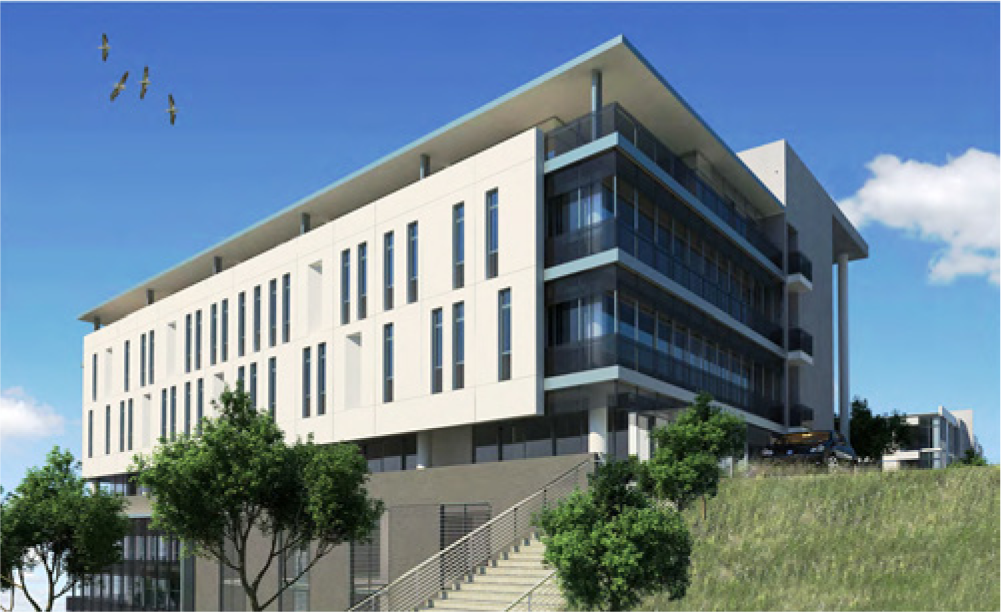
Ridgeside building exterior.
Ridgeside building atrium.
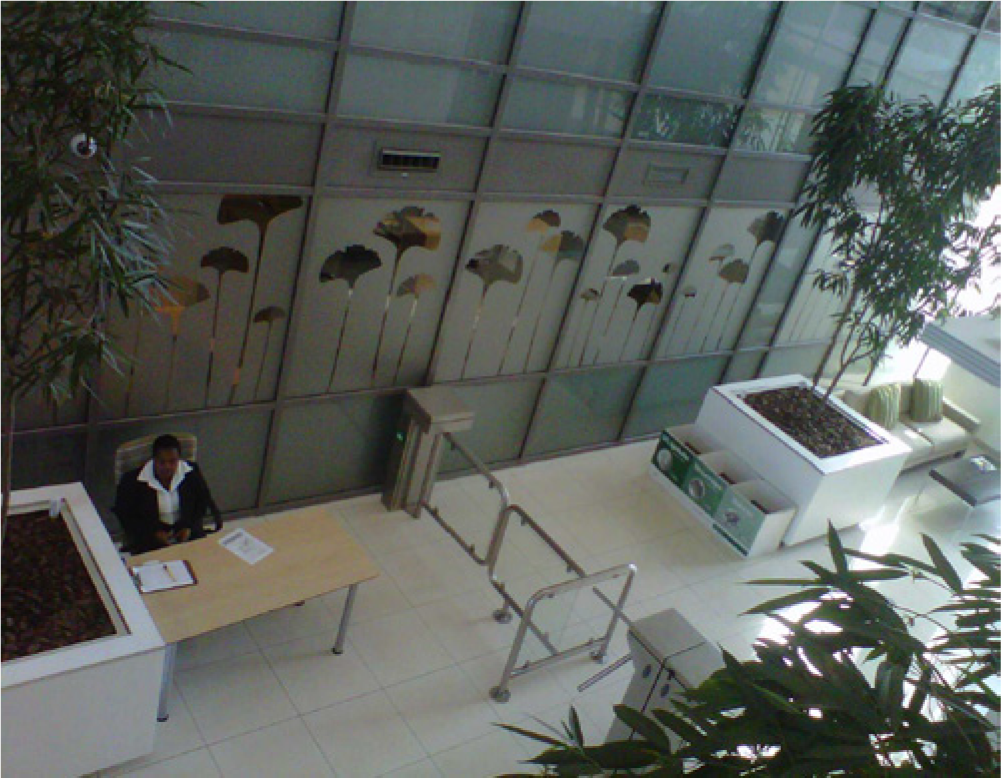
The third building, Menlyn Maine Falcon building (15,943 m2), located in Pretoria, was occupied in June 2012 and achieved a rating of 62 points (see Figures 6 and 7) – a five-star rating. It was one of the first 10 buildings accredited with the same rating tool. The Falcon building has a ventilation system with a rate of fresh air intake 50% higher than the national standard, movement-sensitive lighting, exterior sun shading, and reduced VOC levels, and 30% of the office area has exterior views. The Falcon building has a rainwater collection system, a 30% fly-ash component in cement for the building, and a green wall in the foyer.

Falcon building exterior.

Falcon building atrium.
A summary of the IEQ credits for each building is shown in Table 1.
IEQ Credit Points for Each of the Buildings
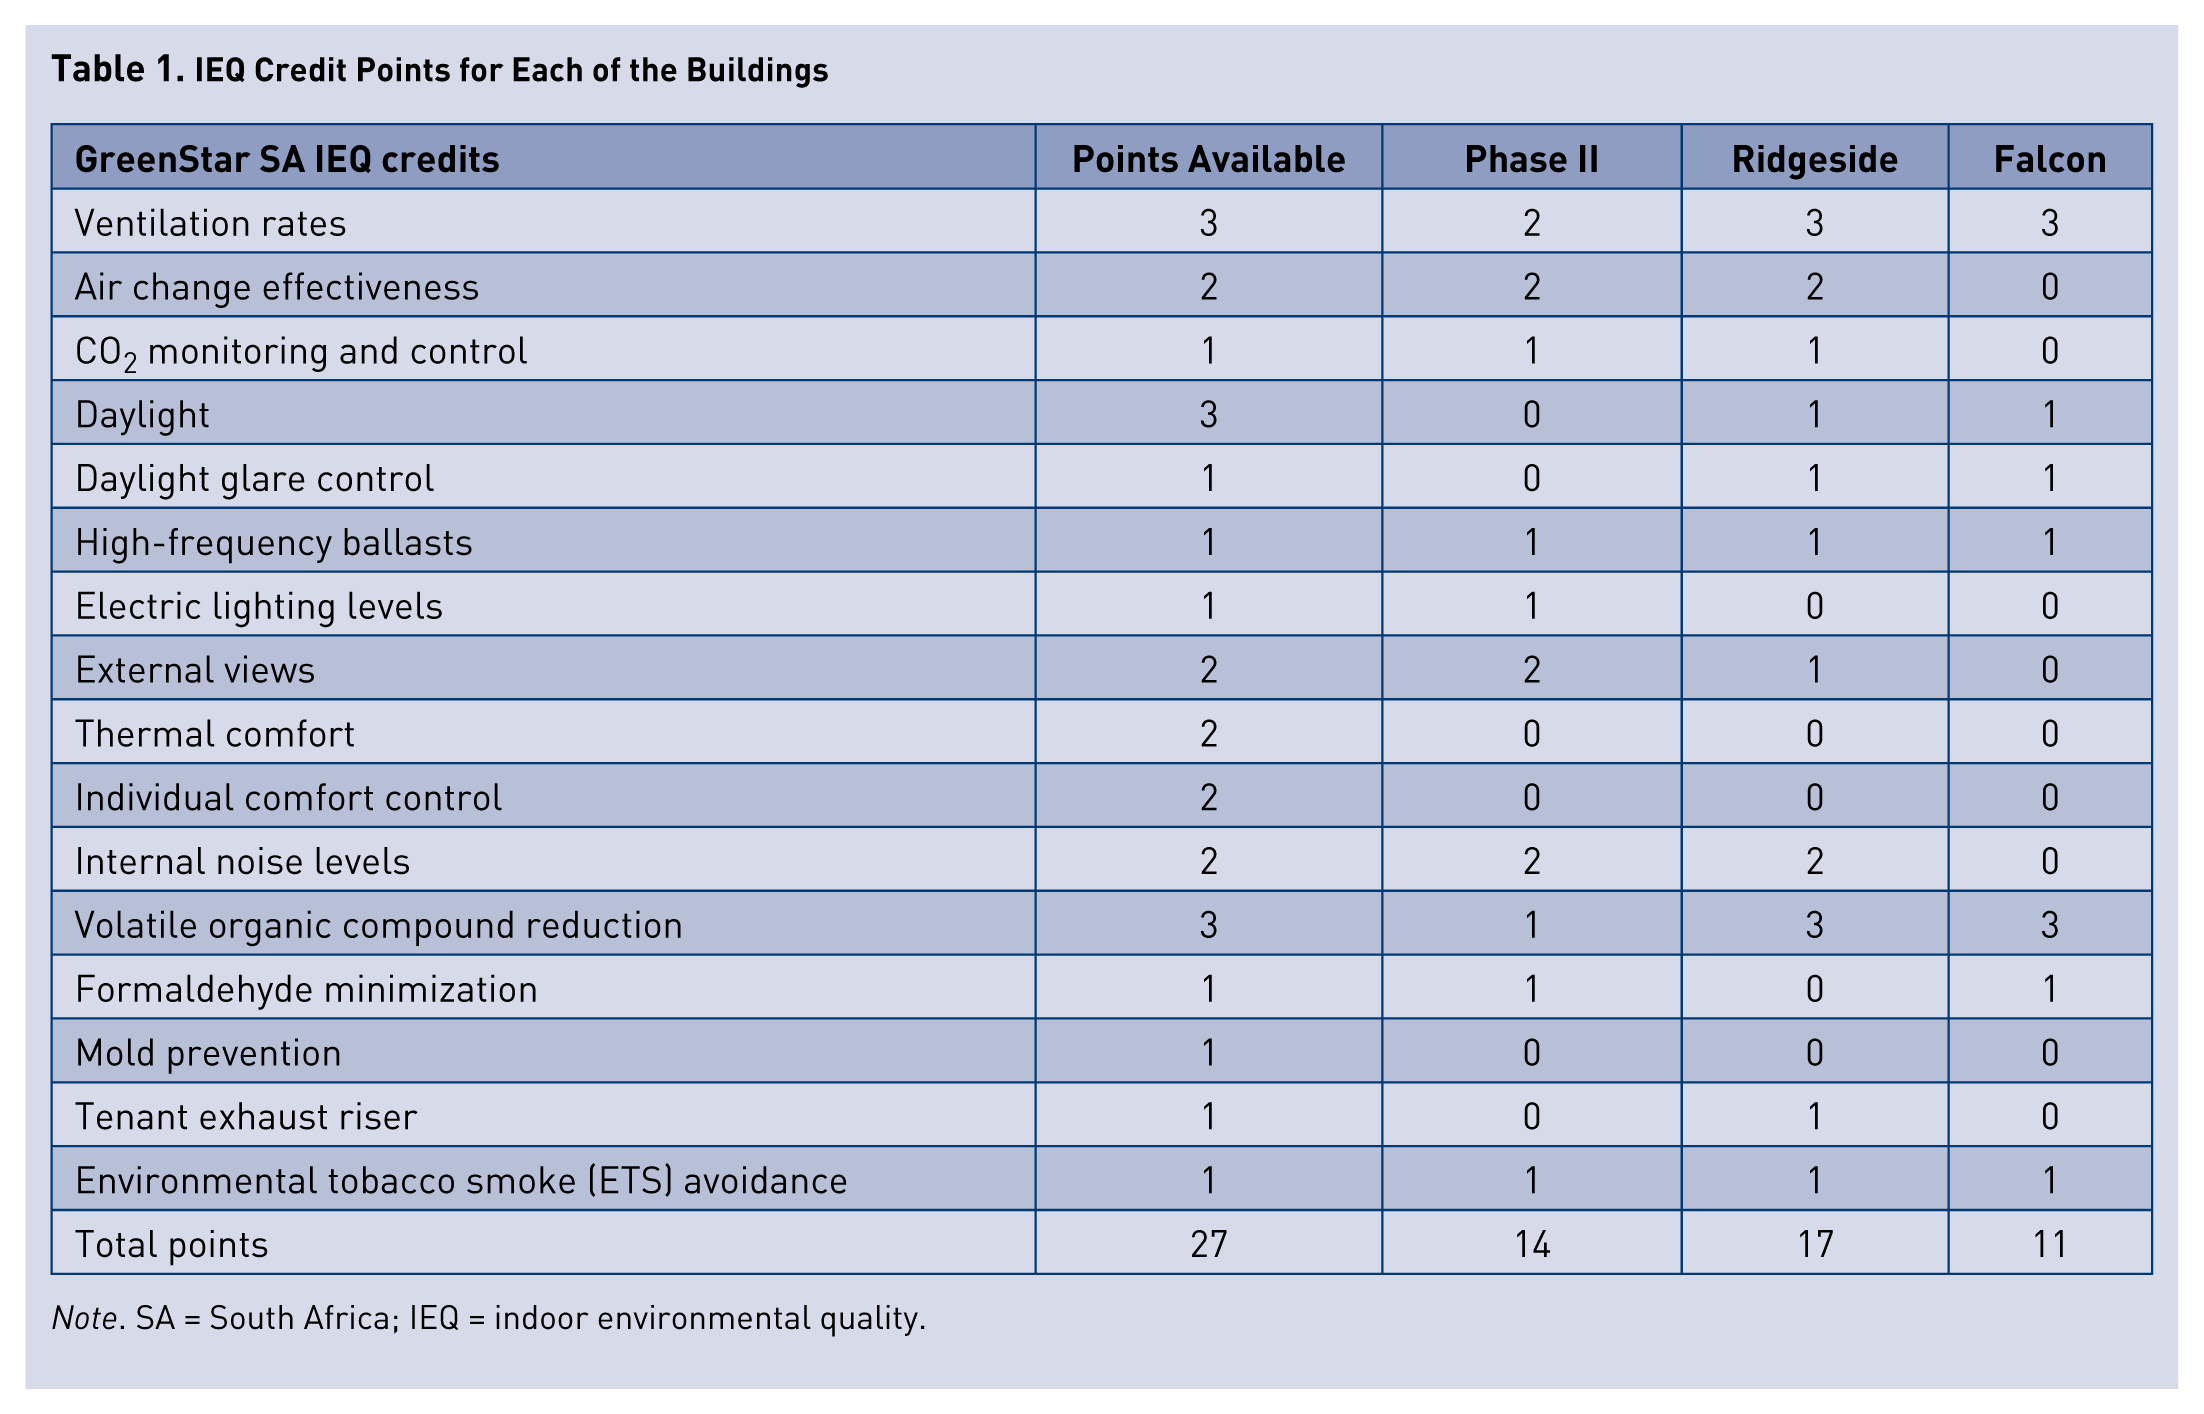
Note. SA = South Africa; IEQ = indoor environmental quality.
Evaluating the Impact on Well-Being and Productivity
We administered a 74-item online survey 3 months preoccupancy and again 6 months postoccupancy. The survey consisted of biographical details; building use information; psychological well-being (Tennant et al., 2007); physical well-being and perceptions of the physical environment (Hedge et al., 1996); self-reported absenteeism, presenteeism (i.e., coming to work when one is not feeling well and probably should have taken sick leave), and productivity; job satisfaction; propensity to continue working for the organization; and attitudes toward the natural environment. We chose these variables on the basis of Heerwagen’s (2000) assessment of the important components for determining the organizational and human factors success of green buildings.
We used the employee number to match the preoccupancy responses to the postoccupancy responses for each respondent and matched-pair t tests to test for statistically significant differences (p < .05 as the statistical level of significance). In total, we received 325 matched responses: 161 from Phase II, 56 from Ridgeside, and 108 from Falcon building. In the Phase II sample, there were 51 men and 102 women with a mean age of 41.36 years (SD = 9.88). In the Ridgeside sample, there were 15 men and 41 women with a mean age of 43.08 years (SD = 8.35). In the Falcon sample, there were 45 men and 62 women with a mean age of 39.67 years (SD = 8.88). Nine respondents did not indicate their gender.
Because design attributes varied among the three green buildings, we decided to treat them as separate case studies for the purpose of reporting the data. The results of the high-level well-being and productivity measures are reported in Table 2, and the more detailed analysis of the perceptions of the built environment is reported in Tables 3 and 4. For the Phase II and Falcon buildings, the high-level measures mostly remained unchanged, with one component decreasing significantly during this period of data collection. (Presenteeism was significantly higher in the Phase II building, and job satisfaction was significantly lower in the Falcon building.) For the Ridgeside building, most of the high-level measures remained statistically similar, with one component (physical well-being) improving significantly during the data collection period. It is important to note that each of these aspects also could have been influenced by factors in the organization or broader environment other than the change in buildings.
Pre- and Postoccupancy Differences on Well-Being and Productivity Measures
Pre- and Postoccupancy Differences on Perceptions of the Physical Environment
Percentage of Respondents Who Experience a Negative Impact Every Day Postoccupancy

Employees’ perceptions of the physical environment produced interesting patterns of significance. For the Ridgeside and Falcon buildings, we noted a trend toward significant improvements across the data collection period. For the Ridgeside building, the improvements were predominantly related to ventilation and air quality aspects, and for the Falcon building, the improvements were predominantly with air quality. Both buildings experienced a significant decrease in one aspect, which could be attributed to commissioning problems in the early occupation phase. At the Ridgeside building, there were problems with the lighting system, and at the Falcon building, problems with the rainwater collection system resulted in unpleasant odors.
The Phase II building showed a general trend toward significant decreases in perceptions of the quality of the physical work environment (with the exception of decreased noise and improved ventilation, although this aspect was also experienced by some occupants as too drafty). The provision of 50% or 100% higher ventilation rates compared with the national standard did not appear to make a significant impact, suggesting that 50% more ventilation than the national standard is sufficient. Further ventilation provisions would simply be more energy intensive. Noise appeared to be problematic in all three buildings.
Lessons Learned and Way Forward
Heerwagen (2000) noted that when it comes to green buildings, “it’s not how green you make it – it’s how you make it green” (p. 354). Each of the green buildings reported here achieved a GreenStar rating but with a varying number of points achieved for the IEQ component. In fact, the building that achieved a five-star rating achieved fewer IEQ points than the two four-star-rated buildings. The building with the highest IEQ points also showed the most positive impacts on building occupants.
Examination of Table 1 in conjunction with Table 2 suggests that the most important components of IEQ are ventilation and air quality. Intuitively, this finding makes sense, as one can hardly function optimally without appropriate air (flow and quality). Singh et al. (2010) also noted that air quality in particular is a pivotal aspect of IEQ affecting well-being. Other aspects, such as thermal comfort or lighting, can easily be personally controlled. For example, an occupant can put on more clothes if the temperature is perceived to be too cold, or provide additional desk lighting if illumination is perceived to be insufficient (Waite-Chuah, 2012).
The lack of significant changes in thermal comfort measures is not surprising, given that these features were not targeted in the building design. Keep in mind that this analysis is based on only three buildings measured 9 months apart. It is possible that some of the (high-level) measures of well-being and productivity might manifest only after much longer periods or that different patterns will emerge when different IEQ credits are targeted. For this reason, we continue to collect data and are completing survey administration for 1 year after occupation on all three buildings. Analysis of these data might produce a different pattern. Since collecting data for these three buildings, we are expanding the pool of evaluated buildings. In addition, we have started data collection in one building in Cape Town and two in Johannesburg, and will start collecting data in another two buildings in the coming months.
The results also demonstrated that commissioning of the building designs is an important component of occupant perceptions. We were pleased to note that the measure regarding perceptions of the physical work environment was sensitive to these issues. A possible follow-up study would involve interviewing building facilities managers about how to appropriately commission a green building so that it meets the “green” targets while maintaining optimal work environment conditions for the occupants. We also noted that the type of result that emerges from this kind of research method (pre- and postoccupancy comparisons) depends on what type of office environment occupants were in before. For the Phase II and Falcon buildings, the employees were occupying Grade A office spaces that already possessed many of the IEQ attributes targeted in the GreenStar rating tool.
Another important outcome from the study was that two innovation credits were awarded to each building for this pre- and postoccupancy survey method. Additionally, the study design was considered to be sufficiently innovative within the South African green building environment for the GBCSA to consider this type of assessment as an industry standard for green buildings when developing Version 2 of the GreenStar Office tool.
Hedge and Dorsey (2012) have shown how the contribution of ergonomics can go even further through the incorporation of ergonomics as an innovation point in the design of interior building spaces in the Leadership in Energy and Environmental Design (LEED) rating system. Sensitizing the South African green building community to ergonomics issues has meant that ergonomics credits can now be obtained in the new GreenStar South Africa Interiors Tool. In addition to the IEQ credits, credits can also be obtained for the ergonomic layout of workstations and workspaces or for the use of ergonomically certified furniture, fittings, and equipment.