
Abstract
As 3-D content migrates to the laptop, it is important to understand if customers can perceive quality differences between the 3-D technologies and to know if they feel any discomfort with close-up viewing of 3-D displays. In this study, we compared the quality and viewing comfort of active, passive, and autostereoscopic (glasses-free) 3-D displays. We found that participants were able to discern differences in 3-D quality and comfort on laptop computer displays in realistic viewing conditions within a short period. Although the active and passive displays were comparable, the autostereoscopic display was rated lower in quality and viewing comfort.
As 3-D content moves into the home, it is important to understand how the different technologies are perceived for both quality and comfort.
Three-dimensional content used to be limited to the occasional special-effects movie in a theater or a theme park, but recently 3-D-enabled devices have proliferated, including handhelds, TVs, and laptops. A TechCrunch article noted, “Understanding just what this kind of technology is doing to our bodies may help us better use it in the future. The only problem is that technology tends to far outpace research” (Crook, 2011).
Authors of some much-publicized research from the University of California, Berkeley, examined the ergonomic impact of 3-D content at varying viewing distances. In their research, Shibata, Kim, Hoffman, and Banks (2011) examined changes in visual discomfort at near (44-cm), midrange (77-cm), and far (10-m) viewing distances for stereoscopic 3-D content. Shibata et al. found that viewing stereoscopic 3-D objects that seemed to recede behind the screen (uncrossed disparity) resulted in greater visual discomfort at the far viewing distance than at near. Conversely, viewing stereoscopic 3-D objects that seem to project out of the display (crossed disparity) resulted in greater visual discomfort at near distance. (See the sidebar for more information.)
As 3-D content moves out of the theater and becomes more common on computing devices used in homes, schools, and workplaces, it is important to better understand the ergonomic implications of viewing 3-D content at closer viewing distances. This article describes a study that is a first attempt to explore this issue. We examine both the perceived comfort of 3-D content on laptop computers and people’s ability to distinguish quality differences between technologies.
Exploring 3-D Technologies
Recently, our consumer marketing team in the laptop division of Hewlett Packard approached us on the human factors team to see if we could help them determine which of the available technologies for stereoscopic 3-D would be the best for use on a laptop. Currently, two types of stereoscopic 3-D technologies predominate: active and passive. Both require the user to wear glasses while viewing the display in order to perceive the stereoscopic 3-D effect. Active (shutter) displays require relatively bulky “smart” glasses that use a liquid-crystal technology, whereas passive displays require thin polarized glasses similar to those commonly provided in movie theaters.
At the time of our study, autostereoscopic 3-D, a technology that provides stereoscopic 3-D without the need for glasses, had just emerged in the consumer landscape. Autostereoscopic 3-D technologies are intriguing from a user experience perspective because by eliminating the need for glasses, they can reduce the monetary cost to the user associated with adopting stereoscopic 3-D, and they eliminate the discomfort often associated with the glasses. However, because autostereoscopic displays are relatively new, there is a lack of published research on the impact of this technology on user comfort and viewing experience.
In general, for television viewing, active displays are thought to provide a superior overall 3-D viewing experience compared with passive displays (Kender, 2011). However, it is unknown whether active displays would still be considered superior to passive displays with the smaller display sizes and closer viewing distances associated with laptop computers. The primary goals of this study were to determine if viewers would discern 3-D quality differences between active and passive 3-D technologies when viewing content on a laptop display and how the active and passive viewing experiences compared with the viewing experience on the newer autostereoscopic technology. Our secondary goal was to assess perceived user comfort and acceptability of the three technologies.
We recruited 18 participants who enjoy viewing 3-D content in theaters and like to watch movies on their laptop computers. These users were our target demographic because they would be (a) highly likely to view 3-D content on a laptop, (b) predisposed to enjoy this experience, and, (c) theoretically, more discerning with regard to quality issues. In our screening process, we purposely excluded people who had experienced problems while viewing 3-D, reported being physically unable to see stereoscopic 3-D, or did not know how 3-D would affect them because they had not recently watched a movie in 3-D.
For the experiment, we tested the displays with three sequential 15-min clips selected from the movie Cloudy With a Chance of Meatballs. The three clips were judged by the experimenters to have similar 3-D content; specifically, the selected 15-min clips included 3-D content that mostly receded behind the screen and had three or fewer instances of 3-D content that projected out of the screen.
Participants viewed each clip on laptops equipped with headphones and a passive, active, or autostereoscopic display. The passive and the autostereoscopic displays were both 15 in.; but because of equipment availability, it was necessary to use a 17-in. display for the active display condition.
Each display panel had full high-definition resolution of 1,920 × 1,080 pixels. The room was dimly lit, measured at ≤ 1 lux at the participant stations with all screens off. Screen glare was reduced during testing by positioning the laptop displays away from the direction of the light source. Three 3-D display stations (see Figure 1) were used, with one participant per station. Participants viewed a single 15-min clip on each display and were allowed to adjust their seating and laptop display position (tilt and distance) to optimize comfort and viewing at each station.

Lab setup.
After watching a 15-min clip at a display station, participants were given time to answer a questionnaire, stretch, and relax before rotating to the next display station. Across participants, the order of the three 3-D display stations was counterbalanced, and each clip was viewed an equal number of times on each display.
After arrival at the lab, each participant completed a baseline comfort rating using a visual analog scale (VAS) developed for use in 3-D studies and described in Yang et al. (2012). The questions in this instrument are divided into five symptom categories: external ocular, internal ocular, visual, physical, and motion sickness. Using a VAS enables the user to mark his or her discomfort on a continuous scale from 0 = no pain to 100 = extreme pain instead of assigning discomfort to a discrete rating of none, mild, moderate, or severe.
After viewing the 15-min clip at each station, participants rated each display on 3-D quality and rated their current level of comfort. The 3-D quality section required users to rate the laptop on a 9-point Likert scale based on smoothness, clarity, crispness, sharpness, ghosting, level of quality, and consistency of 3-D images from different angles. Subjective comfort was rated with the same VAS that was used to measure baseline comfort at the beginning of the study.
After interacting with all laptop 3-D displays, participants rank-ordered each laptop in terms of overall 3-D quality and overall comfort. These rankings were included as a way for users to sum up their experience with each display.
Perceived 3-D quality and perceived comfort data were analyzed with a repeated-measures ANOVA and Bonferroni post hoc test. The results show that users perceived 3-D quality and comfort differences between the 3-D technologies.
Perceived 3-D Quality
The autostereoscopic display was rated significantly worse than the active display on all 3-D quality preference questions, including smoothness, crispness, clarity, sharpness, ghosting, level of quality, and consistency of viewing angles (see Figure 2). The autostereoscopic display was also rated significantly worse than the passive display on measures of clarity, sharpness, ghosting, and consistency of viewing angles. There was no significant difference between the autostereoscopic and passive displays on participant ratings for smoothness, crispness, and level of quality. Participants perceived no significant difference between the active and passive displays on measures of smoothness, crispness, clarity, ghosting, sharpness, level of quality, and consistency of viewing angles.
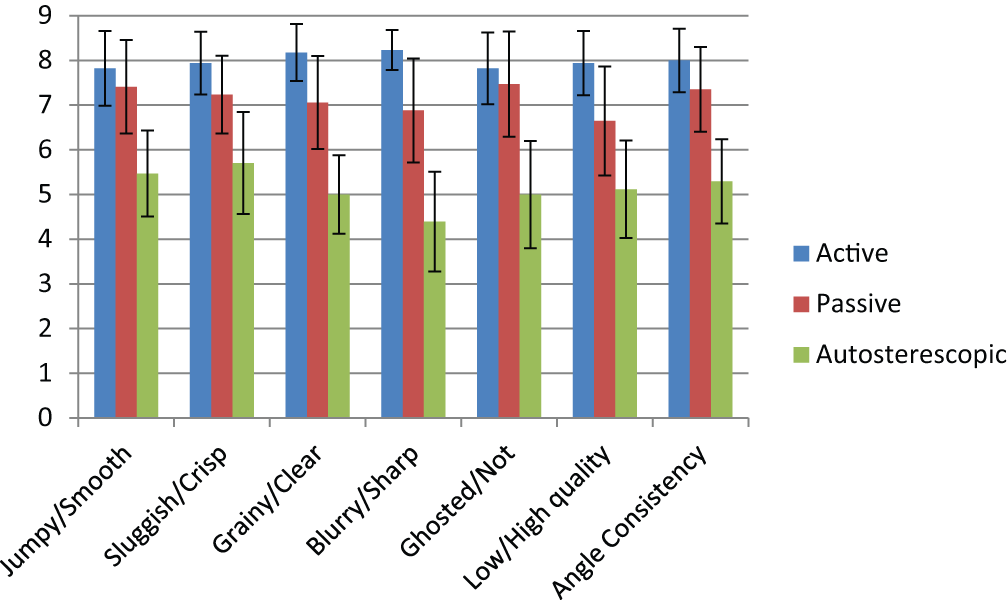
Mean quality preference rating for each display. Error bars represent a 95% confidence interval.
Perceived Comfort
Participants reported relatively low levels of discomfort after 15 min of exposure (mean discomfort across all measures was 6.25 with a range from 0 to 100). They also reported significantly higher levels of general physical discomfort, blurred vision, eye irritation, and trouble focusing for the autostereoscopic display compared with the active display (see Figure 3). In addition, participants said that they experienced significantly more blurred vision for the autostereoscopic display compared with the passive display and a significantly higher level of eye irritation for the passive display compared with the active display.
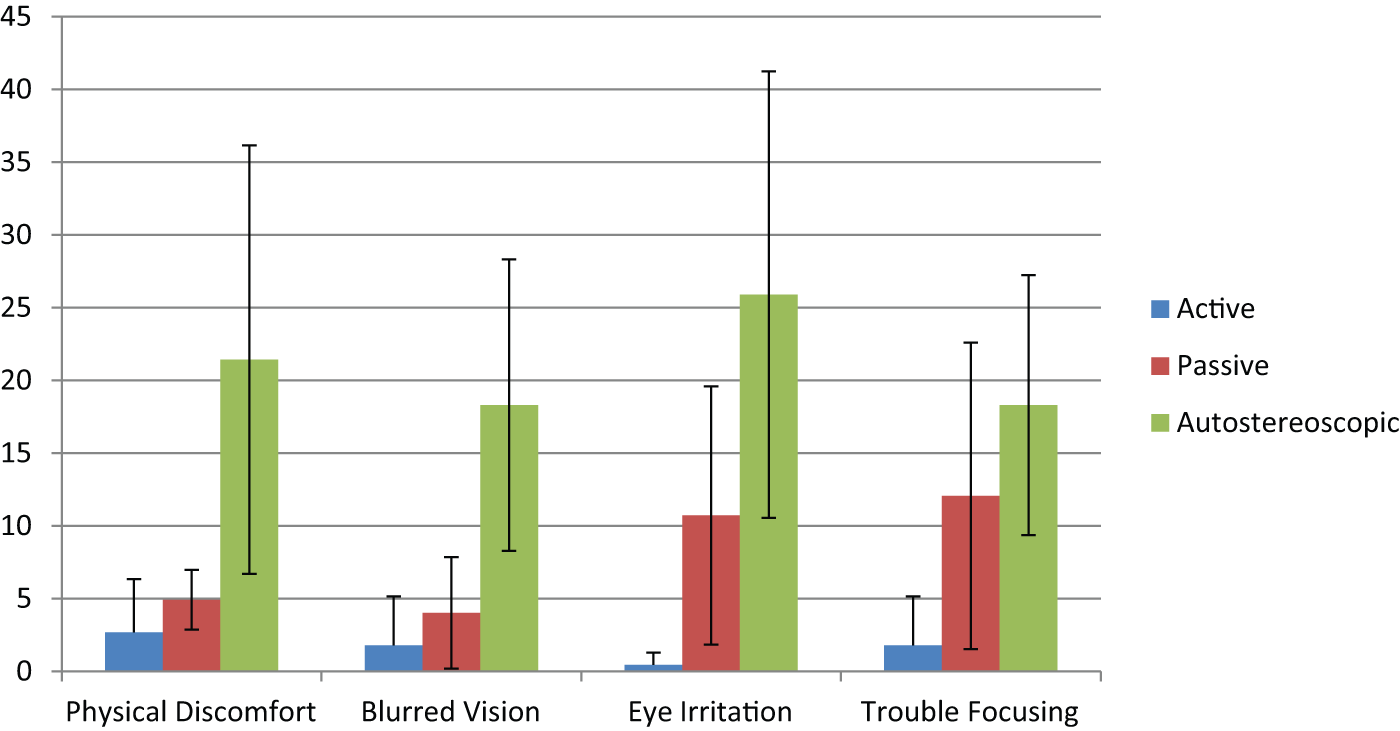
Mean discomfort rating for each display (0-to-100 scale). Error bars represent 95% confidence interval.
Overall Ranking
After experiencing all three displays, participants completed an overall ranking. The autostereoscopic display was ranked last in both overall 3-D quality and overall comfort. The active display was ranked highest for overall 3-D quality (see Figure 4), whereas the passive display was ranked highest for overall comfort (see Figure 5).
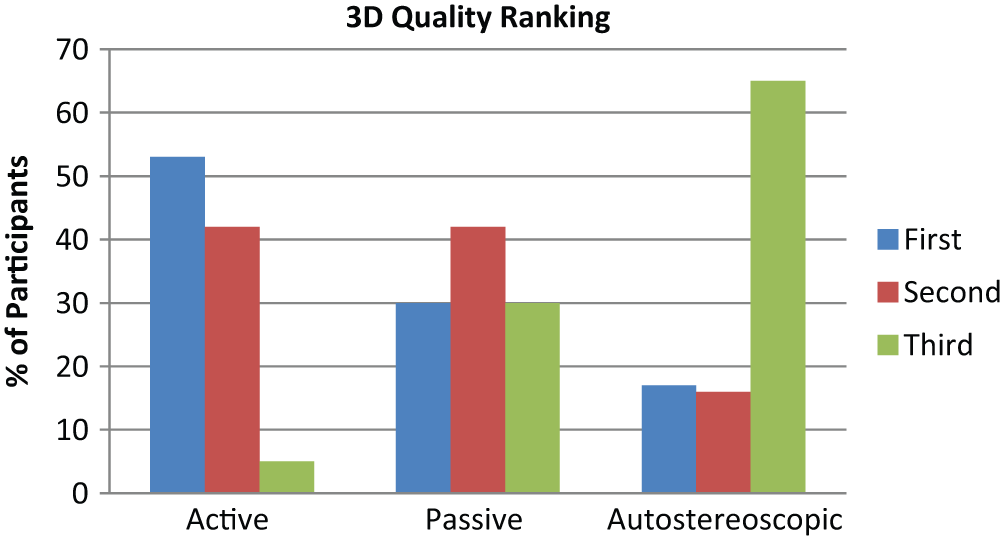
Overall quality ranking for each display.
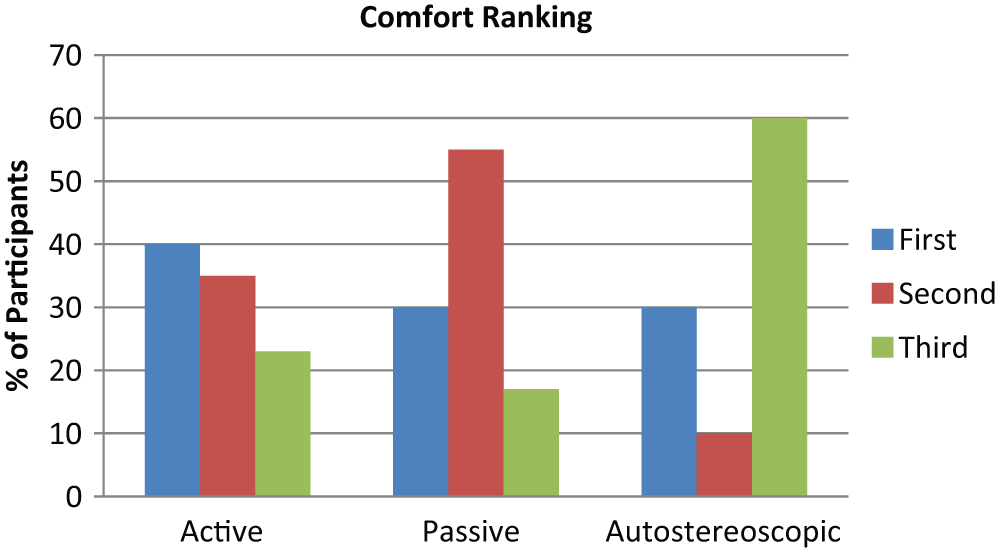
Overall 3-D comfort ranking for each display.
This finding was surprising to because it did not reflect the perceived comfort rating data; however, participant feedback indicates that the higher overall comfort ranking for the passive display was a result of the bulkiness and discomfort users experienced while wearing the active glasses, which weighed 56 g compared with 21 g for the passive glasses (see Figure 6). This finding was not reflected in our comfort ratings because the questionnaire did not include any questions pertaining to the comfort of the glasses.
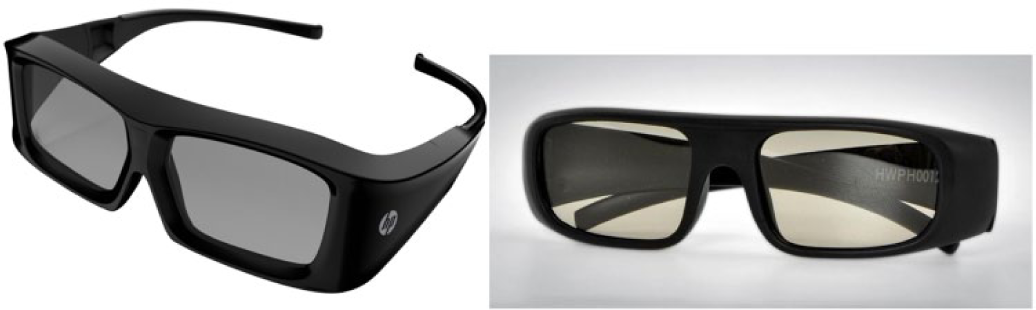
Active versus passive glasses.
Discussion
Given the results of this study, it is apparent that experienced 3-D viewers can readily perceive significant quality and comfort differences among active, passive, and autostereoscopic 3-D technologies even after relatively short durations (15 min on each display). Because the same 3-D clips were viewed across participants using all three display technologies, the higher perceived discomfort ratings and lower overall comfort ranking observed for the autostereoscopic display condition are almost certainly attributable to the poorer quality of the image provided by the autostereoscopic display rather than to any differences in the stereoscopic 3-D effect across the individual clips.
The active and passive display technologies perform nearly identically, but each offers slight advantages over the other. Consistent with expectations, active 3-D displays provide a slightly higher-quality 3-D experience. On the other hand, when the characteristics of the glasses hardware are taken into account, passive displays provide a somewhat more comfortable 3-D viewing experience. The comfort differences observed between the active and passive displays in this study are likely attributable to the greater weight of the active shutter glasses compared with the passive glasses and to the fact that participants were not allowed to use the interchangeable nose pieces for the active glasses. Interestingly, the way in which the active glasses wrapped around the participants’ faces probably reduced airflow over the eyes and may have resulted in the lower levels of eye irritation and trouble focusing observed with the active display.
Initial user comments indicated that getting a 3-D experience without having to buy glasses would be a major selling point, especially for those with larger families who might have to buy several pairs of glasses. Half the participants initially liked the idea of not having to wear glasses and were excited by the new technology. However, these same participants found the autostereoscopic display to be unacceptable in quality and comfort. Therefore, although viewing 3-D content without the need to wear some sort of glasses might be an attractive option for viewers, autostereoscopic displays as currently designed do not appear to offer a 3-D quality or comfort experience comparable to other competing active and passive technologies when viewing stereoscopic 3-D content on laptop computer displays.
Limitations
Although the findings of this study are compelling, we acknowledge a number of limitations. First, the 3-D displays we employed were of different sizes. We had originally planned to use 15-in. displays for each of the 3-D viewing conditions but had to use a 17-in. display for the active display condition and 15-in. displays in the passive and autostereoscopic display conditions. It is possible that the larger display area may have contributed to the fact that the active display outperformed the passive and autostereoscopic displays.
Nevertheless, all the displays were set to the same 1,920 × 1,080 resolution, and we observed very small differences between the active (17-in.) and the passive (15-in.) display conditions. If the larger display size had biased participants to be more positive toward the active display, we would have expected a larger and more consistent advantage for the active display compared with the passive display across a broader range of 3-D quality and perceived comfort ratings.
A second limitation is that only participants who enjoyed 3-D movies and enjoyed watching movies on their laptops were recruited for this study. This recruiting method may have resulted in a sample that was more positively predisposed to the experimental conditions or that may have come to the study with a pre-existing bias toward the more familiar active or passive technology. However, these participants were experienced viewers of 3-D in theaters and, if biased, would likely be biased in favor of the passive technology because of its greater familiarity. The pattern of results does suggest this likelihood to be true.
It is more likely that the 3-D enthusiasts recruited for this study were positively predisposed toward 3-D technology in general rather than one technology in particular. It is possible that including more casual 3-D viewers in future research might yield stronger discomfort results or highlight differences between technologies not observed here.
Third, participants viewed the 3-D content for only 15 min on each display. Although this period was long enough to observe significant differences in perceived 3-D quality and perceived comfort, longer exposure durations might have resulted in larger differences between technologies. It is unlikely that we would have observed a different pattern of preferences across the three types of technologies given longer exposure to the 3-D content.
Finally, because the 3-D content used in this study receded behind the screen, it provided the least potential visual stress. Larger effects on perceived comfort would likely be observed with content that included higher levels of stereoscopic 3-D content that projects out from the screen.
Conclusion
Our study revealed that participants were able to discern differences in 3-D quality and comfort among active, passive, and autostereoscopic laptop computer displays in realistic viewing conditions. The more mainstream active and passive display technologies outshone the new autostereoscopic technology.
Although the autostereoscopic display did not fare as well as the other displays, if 3-D demand and the desire for a glasses-free experience continues in the marketplace, it will likely drive improvements in this type of display. Additionally, as the use of 3-D continues to increase in the home, at school, and in the workplace, it is likely that more attention will be paid to the potential discomfort caused by 3-D viewing in general, and the technology that emerges as the winner will offer not only the highest quality for viewing but the safest and most comfortable experience.
SIDEBAR 1: Factors Associated With Discomfort During Stereoscopic 3-D (S3D) Viewing
To create a stereo 3-D (S3D) image, stereoscopic displays take advantage of the sense of depth (stereopsis) that an individual perceives in a scene whereby each eye sees the image slightly differently because of the different positions of the eyes in the head. Objects at different distances result in different horizontal positions of those images on each retina, and these relative position differences, together with monocular cues, create the sense of depth. By manipulating the positions of the left and right eye images, S3D content can enhance the sense that objects are receding into or projecting out of the display.
Approximately 10% to 15% of viewers of S3D report visual discomfort. These discomfort reports are problematic for the widespread adoption of S3D technology at home, at work, and in education. A number of factors might underlie the visual discomfort experienced by some S3D viewers. In this sidebar we provide a basic overview of the primary mechanisms believed to be associated with the comfort of the S3D experience (also see Howarth, 2011; Lambooij & Isselsteijn, 2009; Yang & Sheedy, 2010).
Vergence-Accommodation Conflict
Accommodation refers to the action of the ciliary muscles to change the shape of the lens to bring an object into focus. Vergence refers to the rotation of the eyes to move them in the direction of an object. In real-life viewing, the vergence plane and the accommodation plane are the same. With S3D, the surface of the display (the focal plane) is at one distance, but the objects in the scene with crossed and uncrossed image disparity result in a vergence plane closer or farther than the focal plane. This disparity creates a conflict between the vergence and the accommodation responses. The stronger the experience of depth, the greater the presumed conflict, possibly resulting in greater visual stress and discomfort.
In real life, objects in a scene that are not the point of focus appear blurred. The amount of blurring depends on their relative depth from the focus. These blur gradient cues influence perception of depth. In S3D, all the objects in a scene are in the same focal plane and consequently will appear clearer than they would in real life. The clarity of these objects creates a strong accommodation stimulus and may exacerbate the vergence-accommodation conflict, potentially resulting in additional stress on the visual system.
Image Disparity
To enhance the S3D experience, content creators manipulate the simulated depth by varying the magnitude and direction of the disparity of the left- and right-eye images. In real life, the sense of stereopsis is influenced (among other things) by the individual’s interpupillary distance. However, the disparity selected in creating the S3D content is unlikely to match the interpupillary distance of every viewer. So, for a given level of image disparity at a given viewing distance, individuals with a smaller interpupillary distance will have a greater sense of depth than will individuals with a larger interpupillary distance.
Individuals experiencing a stronger sense of depth with S3D content may be more likely to experience visual discomfort (Kooi & Toet, 2004), arguably because of an increase in the vergence-accommodation conflict associated with the enhanced sense of depth. In general, a retinal disparity in the range of 1° is considered within the range at which successful and comfortable image fusion can occur (Lambooij & IJsselsteijn, 2009).
Display-Related Image Distortion
Inappropriate accommodation induced by the vergence-accommodation conflict is likely the major source of blurring that one experiences when viewing S3D images. However, the choices that are made in creating and rendering S3D content and the type of technology used to display and view that content affect the quality of the stereoscopic image.
Cross talk is the primary image distortion associated with the display technology. It results when image information intended for one eye bleeds over to the other. The effect of cross talk is a blurred image, and this blurring may result in decreased viewing comfort. In their study, Kooi and Toet (2004) found that manipulations that created the greatest amount of distortion in the S3D image (vertical disparity, image blur, and cross talk) were rated the least comfortable.
Movement
Some viewers of S3D report symptoms of motion sickness, such as dizziness and headache. It is unlikely that S3D image characteristics alone underlie these symptom reports. It is more likely that the movement of the image, in combination with the S3D image characteristics (e.g., image clarity; Yang & Sheedy, 2010) and the increased sense of engagement with the S3D content, result in a heightened sense of movement (Howarth, 2011). This heightened sense of movement may conflict with the viewer’s vestibular system and lead to the reported motion sickness symptoms.
Researchers have only begun to scratch the surface regarding the sources of discomfort associated with S3D viewing. Additional research is necessary to understand the mechanisms involved and determine how to mitigate these experiences through changes in the way designers capture, render, and display content and the optimal levels of exposure to S3D in various environments.
References
Footnotes
Author Note:
The authors of this article are U.S. government employees and created the article within the scope of their employment. As a work of the U.S. federal government, the content of the article is in the public domain.