




Abstract
We conducted this study to investigate the effect of smart parking systems on parking search times in large parking lots. Smart parking systems are systems that provide real-time parking spot availability information to drivers. We used discrete event simulation to model a university parking lot and estimate how much time could be saved without physically implementing a system for experimentation. We found that smart parking systems can reduce search times by an average of 11 s. This shows potential for a multi-lot smart parking system that might save a larger amount of time and reduce harmful vehicle emissions.
Discrete event simulation can show whether benefits are balanced by costs in saving time and reducing environmental impacts.
Finding parking can be a frustrating experience in any large city. One characteristic of an advanced civilization is its ability to transport large numbers of people in an efficient manner. As parking facilities grow large, drivers need advanced methods of parking to reduce inefficiencies in finding spaces.
Smart parking systems (SPSs) have arisen in high-density population areas to help drivers find parking. SPSs employ monitors at entrances, exits, and individual spaces to keep track of space usage and direct drivers to open spaces. Additionally, SPSs can communicate with drivers with variable message signs and mobile/Internet interfaces (Lu, Lin, Zhu, & Shen, 2009; Maccubbin, 2000). In this article, we evaluate the benefits of SPSs on university parking search times using discrete event simulation (DES).
The university setting offers an opportunity for evaluating the benefits of an SPS. As a push for campus expansions grows around the country, university administrators face increasing demand for parking space (Brown-West, 1996). The question we sought to answer was, “How much time will an SPS save?” The time spent parking is important because it can lead to determining how much fuel and emissions can be saved by giving the driver more information.
A DES study involves creating a simulation model from real-world statistical data, ensuring that the model mimics the aspect of the real-world model being studied, experimenting with the model, and statistically testing the outputs of the two models. We collected data on arrival rates, parking durations, distances between spaces, departure rates from areas in the lot, and driving speeds and used those data to build a DES model in Arena simulation software. After we validated the model, we altered the logic to experiment with the application of an SPS. Finally, we compared the average parking search time of the two models to determine which, if any, was significantly lower.
A Smarter Way to Park
An SPS can be defined as any system that monitors parking occupancy and makes that information available to drivers who are searching for spaces. In this section, we examine state-of-the-art SPSs and explore parking studies that use DES.
Smart parking technology
SPSs come in different forms and vary in cost depending on the technology used and features provided. For example, Yan-Zhong, Li-Min, Hong-Song, Ting-Xin, and Zheng-Jun (2006) developed a basic SPS that uses individual sensors for every parking space. These sensors are connected to a wireless network to inform drivers of a lot’s capacity and the location of empty spots. It also updates the appropriate guiding nodes located at major intersections. The guiding nodes do not direct drivers to individual spots; rather, they guide drivers to parking areas with unused capacity.
Lu et al. (2009) published a paper on a sophisticated smart parking scheme called SPARK (i.e., Smart Parking). The scheme uses a communication network to send information to drivers and provide navigation. In the SPARK network, towers stationed around lots communicate with devices in vehicles to direct drivers to the nearest available spaces, inform drivers of spots available within multiple parking lots, and alert drivers of the probability of a lot’s being full by the time they arrive.
Heads Up!
A smart parking system (SPS) of any kind will be one more piece of information that a driver has to pay attention to. Given that the modern automobile is quickly filling with new gadgets, such as rearview cameras and infotainment systems, it is important that anything new the driver has to interact with keeps the driver’s attention focused on the road. The importance of maintaining the driver’s focus on the road is supported by theories that explain driving breakdowns when dual-tasking (e.g., driving and looking at a screen to find the nearest parking spot) as interference that occurs when two tasks compete for the same sensory and motor resources (Sheridan, 2004). If a driver can keep his or her eyes and head pointed toward the road, there will be less competition for those resources while the driver finds a parking space.
Borrowing a page from the domain of aviation, heads-up displays (HUDs) have long been considered for integration into the automotive domain (Tufano, 1997). Provided that the HUDs are configured correctly and do not occlude objects in the driver’s visual field of view, research suggests that drivers with HUDs may be better equipped to handle emergency situations than with a traditional heads-down display (HDD; Liu & Wen, 2004). More specifically, HUDs displaying navigational information allow drivers to spend more time looking at the road while feeling less stressed and taxed while driving (Medenica, Kun, Paek, & Palinko, 2011). Until HUDs become a standard in every vehicle, other head-up methods of disseminating parking information to drivers (e.g., variable-message signs and inset pavement lighting) should be favored to heads-down methods (e.g., placing a parking finder app on a cell phone).
How does the SPS evaluated in this study disseminate information to users? That is a good question! The method for relaying parking information to the driver was not modeled in this study. We were interested in the time saved after the driver receives the information; additionally, we reasoned that the results of the study would not be generalizable for the university if we modeled any one SPS technology. This assumption has both its pros and its cons. For example, different dissemination methods might take longer to relay information, or a driver may take time to consider two similar parking choices, and this time is not accounted for. We think these study limitations should be noted as the results are interpreted.
Parking simulation studies using discrete event simulation
We chose DES as the experimentation tool to determine how much time could be saved with an SPS, because it is an inexpensive solution that is effective when used with the correct empirical methods. DES helps researchers analyze systems through the modeling of system changes at discrete intervals in time. Researchers use DES to model systems such as manufacturing plants, computer networks, and parking lots (Kelton, Sadowski, & Swets, 2010). DES is a viable tool for studying the problems of evaluating the effect of real-time parking information on parking search time (Fries, Chowdhury, Dunning, & Gahrooei, 2010; Harris & Dessouky, 1997; Kelton et al., 2010; Lu et al., 2009).
For example, Lu et al. (2009) performed a simulation study to evaluate the effect of their SPARK scheme on a parking facility for a mall. They measured searching time delay (i.e., the time that elapsed from when a vehicle entered the lot to the instant that driver found a parking space). The article suggested that a decrease in the search time delay was found when the SPARK logic was used versus the real-world logic.
In another example, Fries et al. (2010) conducted a simulation study to evaluate the effect of real-time information on the parking activities on a rural campus. The real-time parking information was distributed to drivers via three variable-message signs placed along a perimeter road. Decreases of 15% (591 min) in downtown network delays were converted to dollars, and cost savings were found.
This study builds on the Lu et al. (2009) and Fries et al. (2010) studies in that it demonstrates SPS benefits under a different set of assumptions (e.g., there is no metered parking at the participating university), adds to the scarce DES parking literature, and provides a resource on which the participating university can conduct in-depth assessments of how SPSs can affect its unique parking environment.
The Parking Experiment
For our study, we chose the Earhart lot at Embry-Riddle Aeronautical University (ERAU). During fall and spring semesters, lots at ERAU are noticeably congested, resulting in long searches for parking spaces. This congestion is especially evident during the workweek at midday.
ERAU has a total of 21 distinct lots that service more than 5,000 faculty, students, and staff. ERAU lots are divided by driver type (i.e., faculty/staff, commuter students, and student residents). The Earhart lot is separated from the main campus by a four-lane, two-way road. Drivers usually park in Earhart and cross the road to participate in activities on the main campus during midday when the main campus lots are full. The portion of the lot that is under study has 234 regular parking spaces and 7 handicapped parking spaces. Earhart has distinctive entry and exit points, along with a well-defined perimeter, as seen in Figure 1.
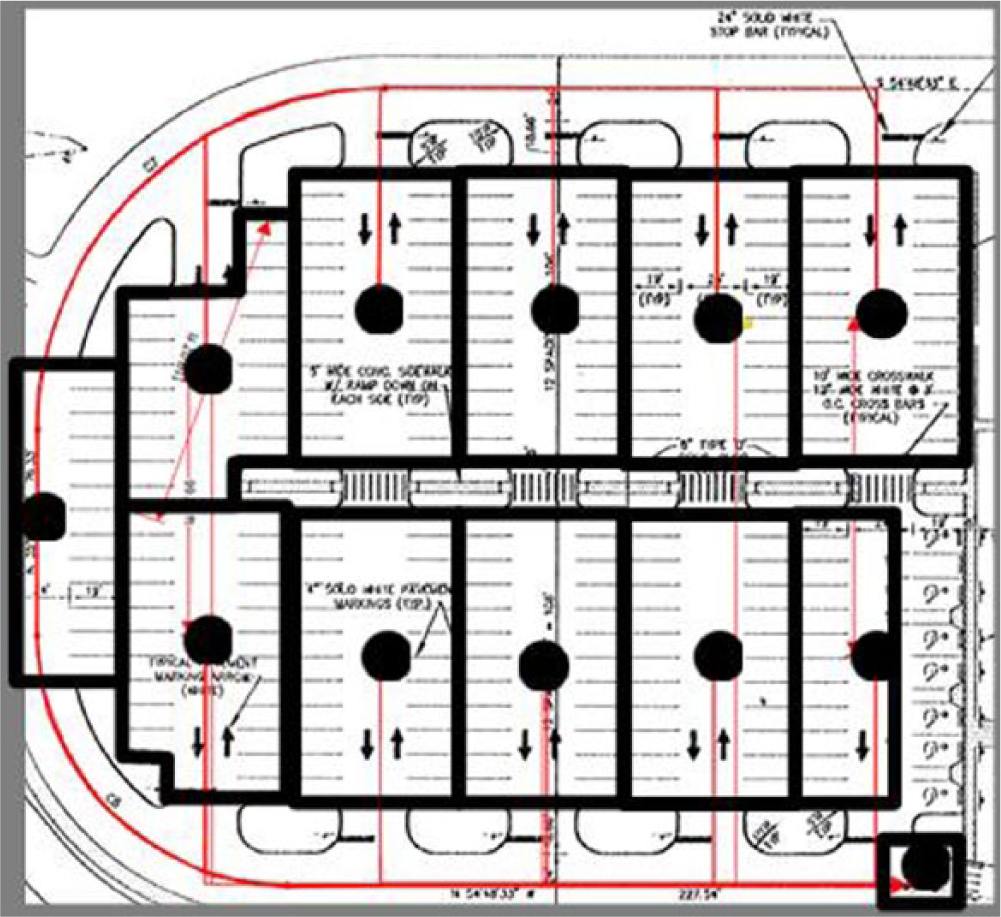
Blueprint with outlines of stations and circles representing station centers. Adapted from Cohen (1993).
Modeling assumptions
Law (2006) and Kelton et al. (2010) stated that all DES models would carry a set of assumptions about workings of the system that should not affect the variable of interest. These assumptions allowed us to ignore irrelevant variables and simplify the problem. This section summarizes the assumptions used for the study.
The parking lot activity was simulated for a period of 1.5 hr. We assumed parking search time would be greatest as the parking lot reaches maximum capacity, which we assumed would occur between the hours of 10:30 a.m. and 12:00 p.m.
The spaces are the resources of the parking system. We categorized them into units of about 24 spaces, or half of an aisle. These 11 units each had a resource capacity that equals the number of empty spaces in that unit. They were grouped into units for modeling ease. We based this modeling approach on that adopted by Yan-Zhong et al. (2006). In the simulation, each of the parking spaces has a distance equal to the midpoint of the unit that it belongs to. We assumed that for any parking unit, the time it takes to travel to the farthest spot away from the entrance would be negated by the time it takes to travel to the closest spot to the entrance. The stations and their midpoints (black dots) are shown in Figure 1.
We simulated parked car departures from the lot by adding capacity to the stations.
Under the SPS logic, drivers proceeded to available parking via the most direct route.
Model development
The first part of our experimental design included defining the descriptions of the systems under comparison. The models in this section are abstractions of how the systems operated. For clarification, we refer to the DES model that represents the real Earhart lot as the base model. We refer to the DES model that operates under an SPS as the experimental model.
In the base model, drivers arrived at the lot at different rates based on the time of day (i.e., half-hourly). After a driver entered the lot, the search began, and the parking search time clock started. We stopped the clock when a driver began parking in a spot. Drivers used a search behavior based on probabilities to find a space. When a driver found a space, he or she parked there. The driver remained parked for the entire simulation.
Given that parking search time was the variable of interest, we did not model parking durations and departures of cars. We modeled departures as events that add capacity to each station. In theory, a departure is another parking space addition and another opportunity to observe parking search times.
In the experimental model, drivers entered the parking lot at the same rate as in the base model. We assumed that drivers enter a lot only if it has an available spot. When they entered the lot, drivers were shown the nearest parking space. This dissemination occurred instantly. The closest available station with capacity was designated for the driver. Drivers, following the search behavior of minimizing walking disutility, chose to park in this spot. The capacity of the station decreased when a space was designated for a driver, which eliminated two drivers’ trying to park in the same spot. As with the base model, drivers who found parking remained parked, but departures were modeled as additional capacity.
Data collection
We collected the data needed for the computer-simulated model of the parking facility at the Earhart lot. The data used for the models were collected on 4 days (i.e., Monday through Thursday) from 10:30 a.m. to 12:00 p.m., when, through observations, Earhart appeared most full. This period was the maximum amount of time/conditions for which we could collect data because of outside constraints. All the model inputs and their units are shown in Table 1.
Data Collection for Modeling and Validation
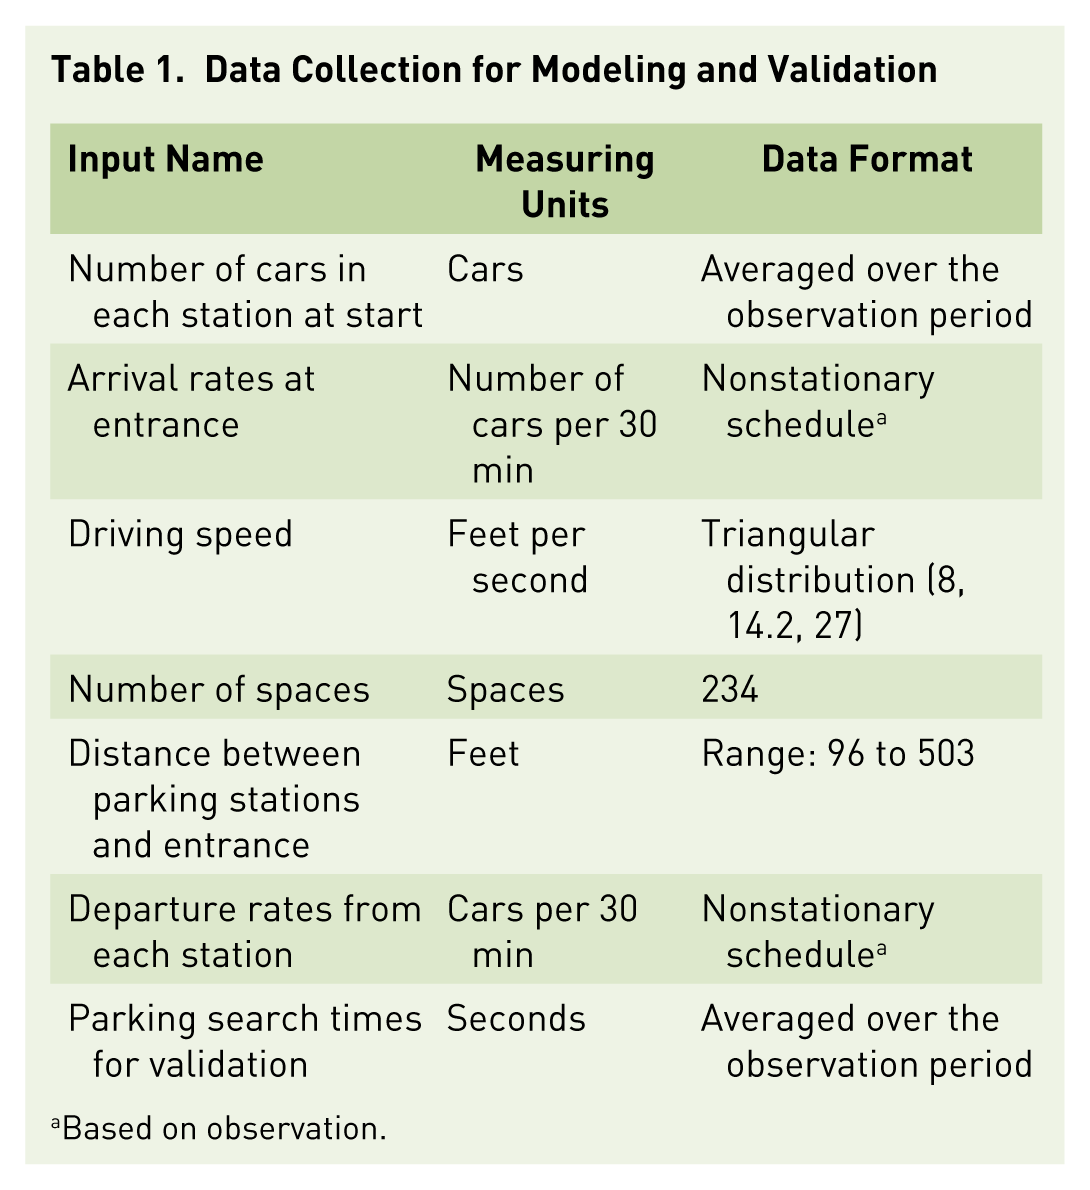
Based on observation.
We entered the arrival and departure rates into Arena in a schedule, since we determined that the observed fluctuations in the rates warranted a nonstationary arrival rate from the data collected, as clearly seen from Figures 2 and 3.
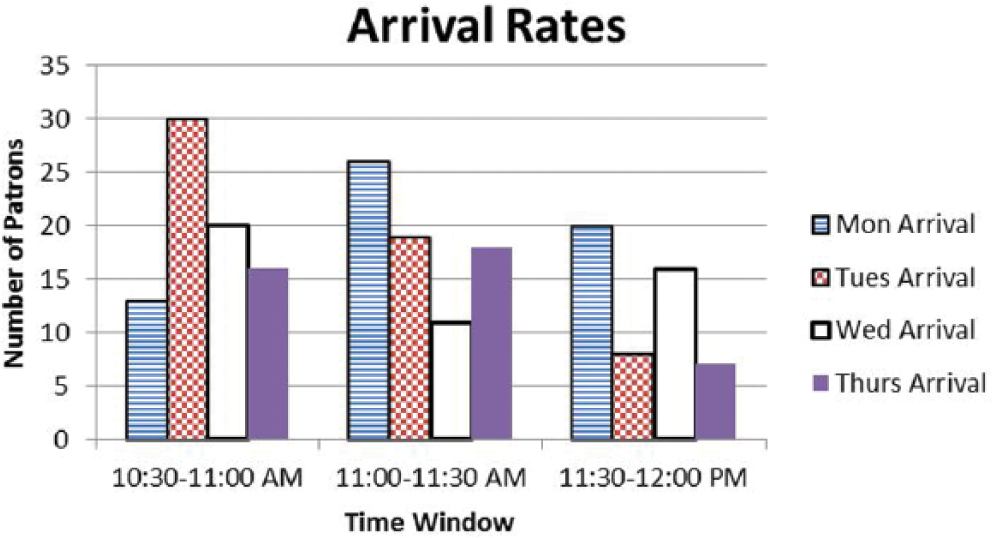
The arrival rates for each time window by day.

The departure rates for each time window by day.
Table 2 illustrates the parking space at the initialization of the model. The average number across the 4-day period was used as the initial number of parking capacity for the model.
Resource Capacity at 10:30 a.m.

We analyzed the distribution of driving speeds with a goodness-of-fit test. Goodness-of-fit tests allow for the testing of the null hypothesis of the data points fitting a particular distribution (Kelton et al., 2010). Based on the chi-square test for the best fit, a triangular distribution TRIA (8, 14.2, 27) was used to describe the driving speed within the parking lot (with p = .264).
Results
Validation
Before we constructed the experimental model, we validated the base model by comparing its parking search times with those of the real Earhart parking lot for 4 days between 10:30 a.m. and 12:00 p.m. The search times for the real lot and base model are plotted in Figure 4.

Parking search times for the real lot and base model.
On the basis of these results, we inferred that the base model was a valid representation of the real lot in terms of parking search time (t = 1.048, p = .298).
Experimental results
After we developed and validated the experimental model, we compared its 10-day parking search time mean with the 10-day search time mean of the base model. The samples were recorded from a simulation that was run for 10 simulation days at 1.5 hr a day. The parking search time is also displayed graphically in Figure 5.
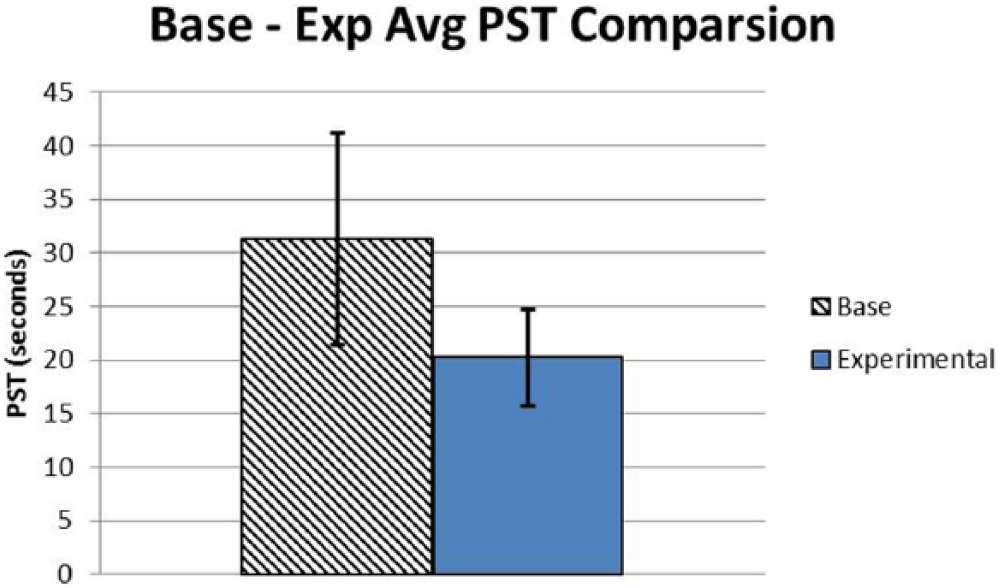
Parking search times for the base and experimental models.
We were able to show that drivers within the experimental model have significantly lower parking search times (M = 20.21, SD = 9.06) than drivers of the base model (M = 31.29, SD = 19.7); t = 12.709, p < .001). From these results, we see that in a lot with more than 200 spaces, an SPS can significantly decrease parking search time by an average of 11 s across a 10-day span.
The base parking search strategy is based on observed movements in the Earhart lot without an SPS. In the experimental model, however, the search strategy is based on checking the available capacity of parking spaces from the shortest to longest distance from the entrance. The quick dispersion of this knowledge is likely the key factor in reducing the parking search times of drivers in the experimental model. Because no time is wasted investigating stations that cannot be seen from the entrance, drivers experience a lower parking search time with an SPS. These findings support the conclusions (i.e., SPSs reduce search time) drawn from the Caicedo, Robuste, and Lopez-Pita (2006) study. However, the cost savings seem low, and the question arises: “Is it worth it?”
Economic Impact
Before adopting an SPS at ERAU, we first examined the cost of such a system. The costs for an SPS to govern the Earhart lot can be estimated from an informal costing method proposed by the authors of a field study analyzing the costs of an SPS for Bay Area Rapid Transit (U.S. Department of Transportation, 2008). The California Partners for Advanced Transit and Highways researchers estimated that a parking system of that nature would have a capital cost ranging from $150 to $250 per space, and the annual maintenance and operations cost would range from $50 to $60 per space (U.S. Department of Transportation, 2007). Using the lowest estimates, an SPS of this type for Earhart would have a capital cost of $35,100 and $11,700 in yearly operations and maintenance costs, respectively.
Next, we examined how the SPS might affect the environment. The U.S. Environmental Protection Agency (2011) estimated that 423 g (0.93 lbs) of tailpipe carbon dioxide (CO2) is emitted by the average car after driving 1.6 km (1 mile). We know from our data collection that drivers most frequently drove at a rate of 4.83 m/s (0.003 miles per second) or 17.38 km (10.8 miles) per hour. Using this number, we estimated that an 11-s time saving equates to drivers traveling 48.28 m (0.03 miles) during a 2-week period. During our simulation, 633 drivers were generated, which equates to a collective savings of 30.56 km (18.99 miles) traveled during the 2-week simulation period. In a typical 19-week semester, that is a savings of 290.33 km (180.41 miles).
We conclude that if an SPS were installed, the lot under study would save 64.3 kg (141.76 lbs) in generated CO2 emissions. The CO2 saved by the SPS would be enough to fill about 36 m3 (9,500 gallons). A word of caution: Although that may sound like a lot, consider how the CO2 generated by those cars will be measured in tons (the average car generates 5.1 tons of CO2 in a year), whereas the savings from this SPS for this lot alone will be measured in kilograms.
Ultimately, 11 s is a small amount in the scheme of a student’s entire day. Although the current parking search time and environmental savings do not justify an expensive system, it is likely that an economy of scale could be taken advantage of as more drivers share the cost of a university-wide system and receive greater benefits. Moreover, one limitation of our study was that we sampled only a portion of parking search times for any given driver. One assumption we came across as we searched for an explanation for our low search time savings was that because the lot was across the street from the main campus, it can be assumed that most drivers entering the lot entered as a last resort and had already been searching for some time. That assumption means additional time would have been saved had the SPS governed multiple lots instead of the one lot in this study.
Conclusion
In this article, we investigated how SPSs affect parking search time using discrete event simulation. Our results confirm that an SPS can make a positive difference in how people use parking lots by reducing search time. As society develops and grows in size, there will be a need to update the transportation infrastructure to accommodate this new growth. New SPS technology is a promising tool to improve the search process as lots grow larger.
Although our findings were significant and savings could be realized with an SPS, the costs of the system outweigh the benefits in this case. There is reason to believe, however, that the benefits of an SPS would be magnified on a greater scale in which there were many lots to choose from, much like the study conducted by Fries et al. (2010). The next step in determining whether or not an SPS would be beneficial to ERAU is to model multiple parking lots to get a more accurate depiction of parking search time savings and their economic impact.