
Abstract
Quality questionnaires are not just written; they are designed, and few HF/E professionals have education or training in this area. Questionnaires are considered tools for collecting data regarding the topic of interest. We hope to nudge questionnaire designers to be more attentive to their conversation with respondents. Specifically, questionnaire designers need to consider the respondent’s mental model and shape the mental model so that all respondents share a common perception of the task and understand what is asked of them. Incorporating perceived affordances and Web-based cultural conventions into questionnaires will reduce respondent burden and reward researchers with usable information.
By careful use of question wording, response options and scales, visual design, and personalization, questionnaire designers can glean better information to inform their research.
Although these questionnaires vary considerably in quality, value, and scientific merit, the findings are often treated equally. In addition, the data are often collected from an opt-in, nonrandom sample of convenience, which may or may not be representative of the population of interest.
In empirical studies, questionnaires and surveys are the most commonly used research tool in the areas of public opinion, psychology, sociology, and political science (Saris & Gallhofer, 2007). Their findings apply equally to the field of human factors/ergonomics (HF/E). A cursory analysis of the number of hits on the words questionnaire and survey in the Proceedings of the Human Factors and Ergonomics Society between 2009 and 2014 showed that about one third of the articles contained either word.
Despite HF/E’s heavy use of questionnaires and surveys, few HF/E professionals have received any formal training in their design and use. The purpose of this article is to describe the nature of questionnaires/surveys and to encourage questionnaire designers to consider the complexity of their design task. In the interest of simplicity, we have used the terms questionnaire and survey interchangeably.
In this article, we consider questionnaires as conversations and offer suggestions for improving questionnaire construction. We place an emphasis on the importance of considering the respondent’s mental model.
What is a Questionnaire?
Most practitioners and researchers describe questionnaires as tools to gather information that is not readily accessible by examining an individual’s performance or behavior. Typically, discussions on the nature of questionnaires focus on gathering subjective data, although questionnaires can also be used to gather objective data, such as date and place of birth, age, respondent’s name and address, and so on.
Class discussions on this topic yield definitions such as “Questionnaires are ordered arrangements of items (questions) intended to elicit the evaluations, judgments, comparisons, attitudes, beliefs, or opinions of respondents” or “An instrument for conveying the respondent’s opinion on a topic to the questioner with a minimum loss of information and a maximum of clarity.” These definitions are consonant with the definitions provided at http://www.visualthesaurus.com/, which defines a questionnaire as “a form containing a set of questions; submitted to people to gain statistical information” and “a printed document with spaces in which to write.”
Most researchers and practitioners consider questionnaires as tools or instruments; it is a rare individual who considers them as a means of communication. However, the questionnaire as a communication tool has long been the position of the leaders in the field of questionnaire design.
In 2007, Smyth, Dillman, and Christian emphasized the impact that context has on both normal conversation and on how people interpret and respond to survey questions. Those researchers also expanded the traditional context factors, such as interviewer’s presence and question order, to include the visual layout of Internet surveys. According to Bradburn (2000, p. 3), as early as 1934, Bingham and Moore described a questionnaire as “a conversation with a purpose.” In 1974, Sudman and Bradburn defined a survey interview “as a micro-social system consisting of three roles held together by a common task reflected in the questionnaire” (Bradburn, 2000, p. 3). Sudman and Bradburn’s social system included an interviewer who asks, a respondent who answers, and a common task, which is the area defined by the researcher. In 1984, Batson (as cited in Sudman, Bradburn, & Schwarz, 1996, p. 10) described a questionnaire as “a transfer of meanings between the three participants through the medium of language.” In the following sections, we will consider why a questionnaire can be considered a conversation and how thinking about them as conversations should influence questionnaire design.
Questionnaires, like conversations, exist in a context that implies a mental model. Jay Forrester (MIT’s guru of system dynamics) provides insightful comments on the intimate relationship between mental models and conversations: The mental model is fuzzy. It is incomplete. It is imprecisely stated. Furthermore, within one individual, a mental model changes with time and even during the flow of single conversation. The human mind assembles a few relationships to fit the context of a discussion. As the subject shifts, so does the model. Each participant in a conversation employs a different mental model to interpret the subject. Fundamental assumptions are different but are never brought into the open. (as cited in Schrage, 2000, p. 13)
Forrester’s description applies to both oral and written conversations and indicates the complexity of communication in a questionnaire. The following examples show only the tip of the communication iceberg that needs to be considered in questionnaire design and reinforce the need to help shape and commonize the respondent’s mental models. We provide examples in four areas: how the wording of questions shapes the answers, how response options/scales shape the responses, how visual design influences responses, and the need to personalize the conversation.
How the Wording of Questions Shapes the Answers
Let us look at two questions used in the Gallup Poll (Newport, 2012; Table 1). In the first question, the respondent defines the context; in the second, the context (“fair or unfair to you, personally”) is clearly stated. The addition of “to you, personally” in the second question resulted in an increase of 17% of the respondents agreeing and reduced the percentage of those with no opinion from 6% to 2%. How does one explain these changes?
How Questions Shape the Answers
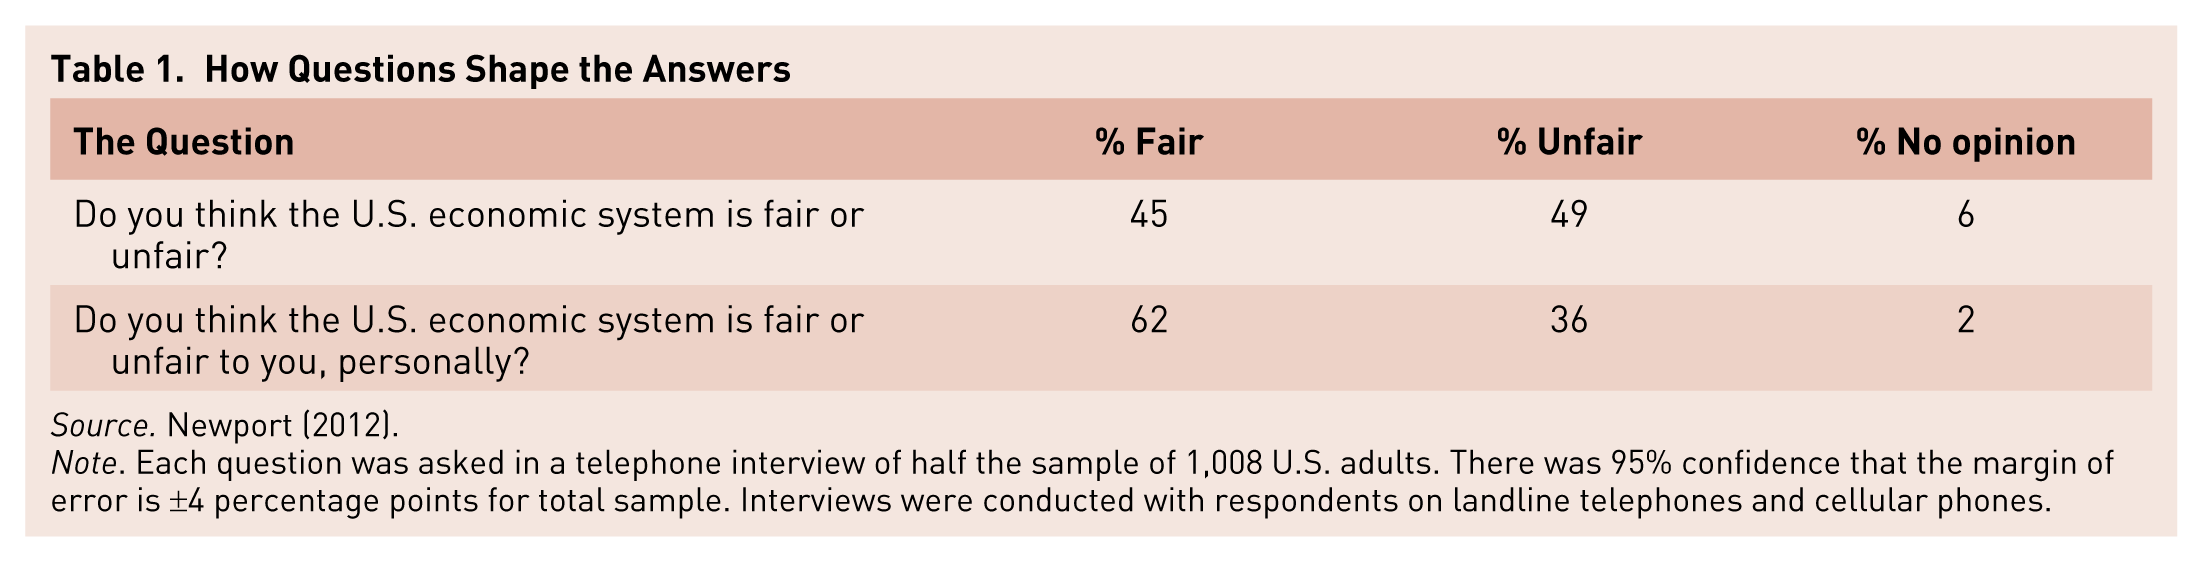
Source. Newport (2012).
Note. Each question was asked in a telephone interview of half the sample of 1,008 U.S. adults. There was 95% confidence that the margin of error is ±4 percentage points for total sample. Interviews were conducted with respondents on landline telephones and cellular phones.
Norbert Schwarz (1999) stated, As researchers, we tend to view our questionnaires as measurement devices that elicit information from respondents. What we frequently overlook is that our questionnaires are also a source of information that respondents draw on in order to determine their task and arrive at a useful and informative answer. (p. 103)
The results shown in Table 1 clearly reflect the impact of clarifying the context on the respondents’ response.
The findings are similar when people are asked to report about the seriousness of crime in the United States and in their neighborhood. Slightly more than half (54%) reported that crime was a serious problem in the United States, but only 11% saw it as a serious problem in their neighborhood. The reality is that during the time these data were collected, the crime rate had decreased (Saad, 2011), a fact that reminds us that questionnaires reflect opinions and beliefs, which may differ from reality.
In 1974, Loftus and Palmer had participants view a video of an automobile accident and estimate vehicle speed at the time of the accident. They were asked, “How fast were the cars going when they [smashed, collided, bumped, hit, contacted] each other?” The mean speeds in miles per hour were as follows: smashed, 40.5; collided, 39.3; bumped, 38.1; hit, 34.0; and contacted, 31.8. Changing the verb induced different mental models in the respondents, and they reported faster or slower speeds.
A week later, the respondents were asked, “Did you see any broken glass?” Despite the fact that there was no glass resulting from the accident at the scene, 32% of the participants whose question used the word smashed reported the presence of glass, whereas only 14% of the participants whose question used the word hit reported the presence of glass. The impact of the words chosen in framing the question clearly influenced both the respondent’s mental model of the event and his or her recall of the event.
Clearly, questions do shape the answers. Schwarz (1999, p. 93) described the work of Shuman and Presser (1981), who asked respondents to consider “the most important thing for children to prepare them for life.” When asked to select a response from a list of items, 61.5% chose the alternative to think for themselves. However, only 4.6% volunteered a similar answer when the response was open-ended.
The common thread in all the foregoing points is that if accurate data are to be obtained, questionnaire designers need to attend meticulously to detail and nuance, and properly test and evaluate each question before distributing the questionnaire to the desired population.
How Response Options/Scales Shape the Answers
Questionnaire designers also influence response choice by the scales that they provide to the respondents. In 1991, Schwarz, Knauper, Hippler, Noelle-Neumann, and Clark asked respondents to rate their success in life. Respondents were provided with one of two 11-point scales. In one case, the numeric values ranged from −5 (not at all successful) to +5 (extremely successful); in the other, numeric values ranged from 0 (not at all successful) to 10 (extremely successful). Whereas 34% of the respondents selected a value between −5 and 0 on the scale from −5 to + 5, only 13% selected the equivalent values (between 0 and 5) on the scale ranging from 0 to 10. The discrepancy may be attributed to different understandings of zero as a midpoint or as a total lack of any success. The negative-to-positive scale implies a bipolar dimension, because the two poles refer to the presence of opposing attributes (success and failure). However, the scale with only positive numbers suggests a unipolar scale, referring to different levels of success.
The impact of scale selection on response was also clearly demonstrated by Smyth et al. (2007). In an Internet survey, they asked, “How many hours per day do you typically study? Would you say . . . .” The respondents were presented with one of the three response options shown in Table 2.
Response Options to the Question, “How many hours per day do you typically study? Would you say . . .”
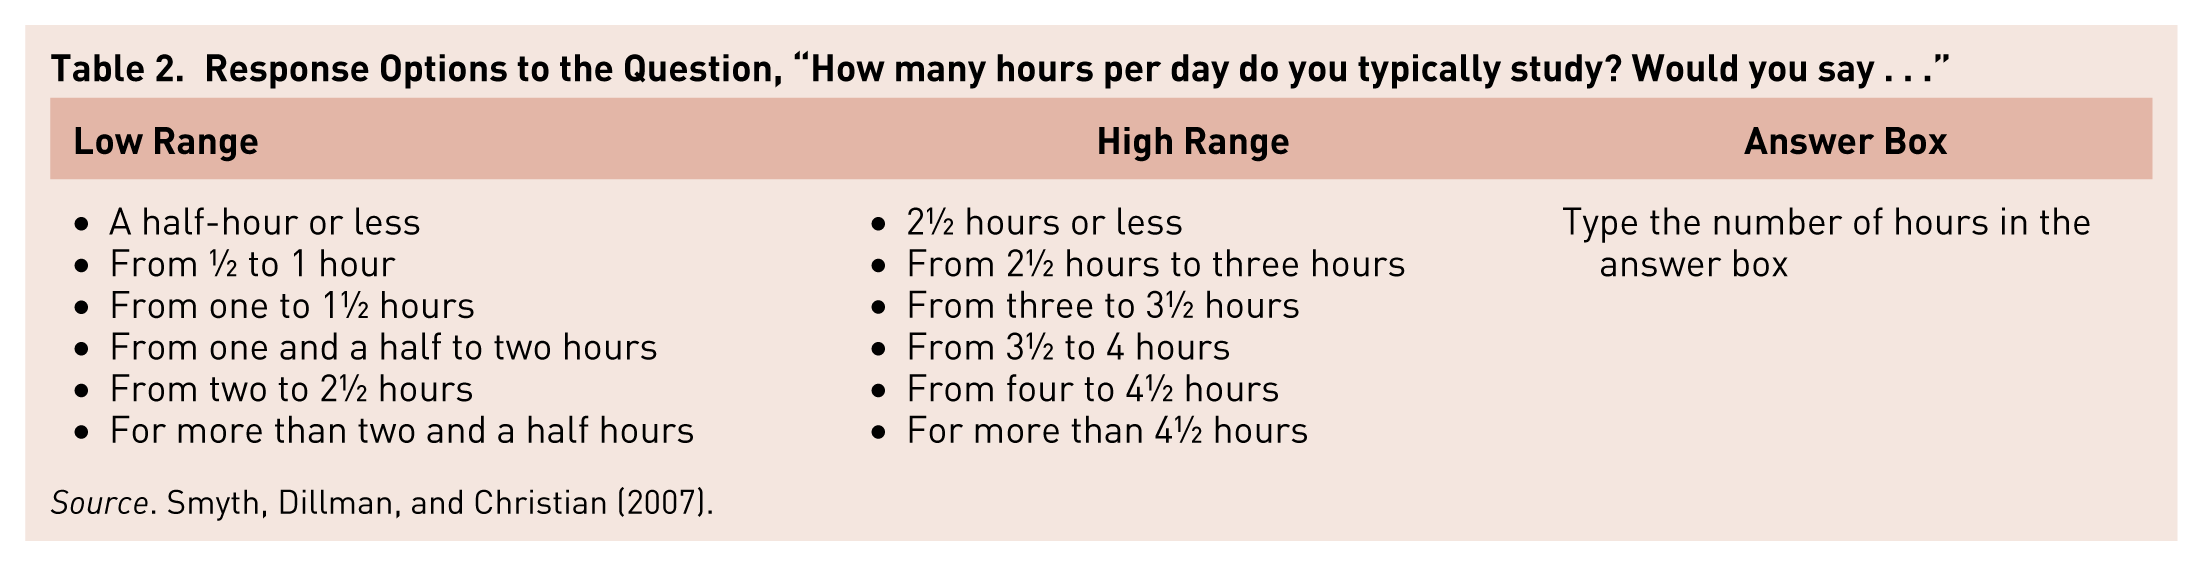
Source. Smyth, Dillman, and Christian (2007).
The percentage of respondents reporting hours studying per day as a function of the response option format is provided in Table 3. The statistically significant chi-square value (123.38, p = .000) indicates the impact of providing respondents with what they perceived to be the expected range of responses. The percentages are clearly flipped between the respondents who received the low-range and high-range response options.
Percentage of Respondents Reporting Hours Studying per Day as a Function of Response Option Format
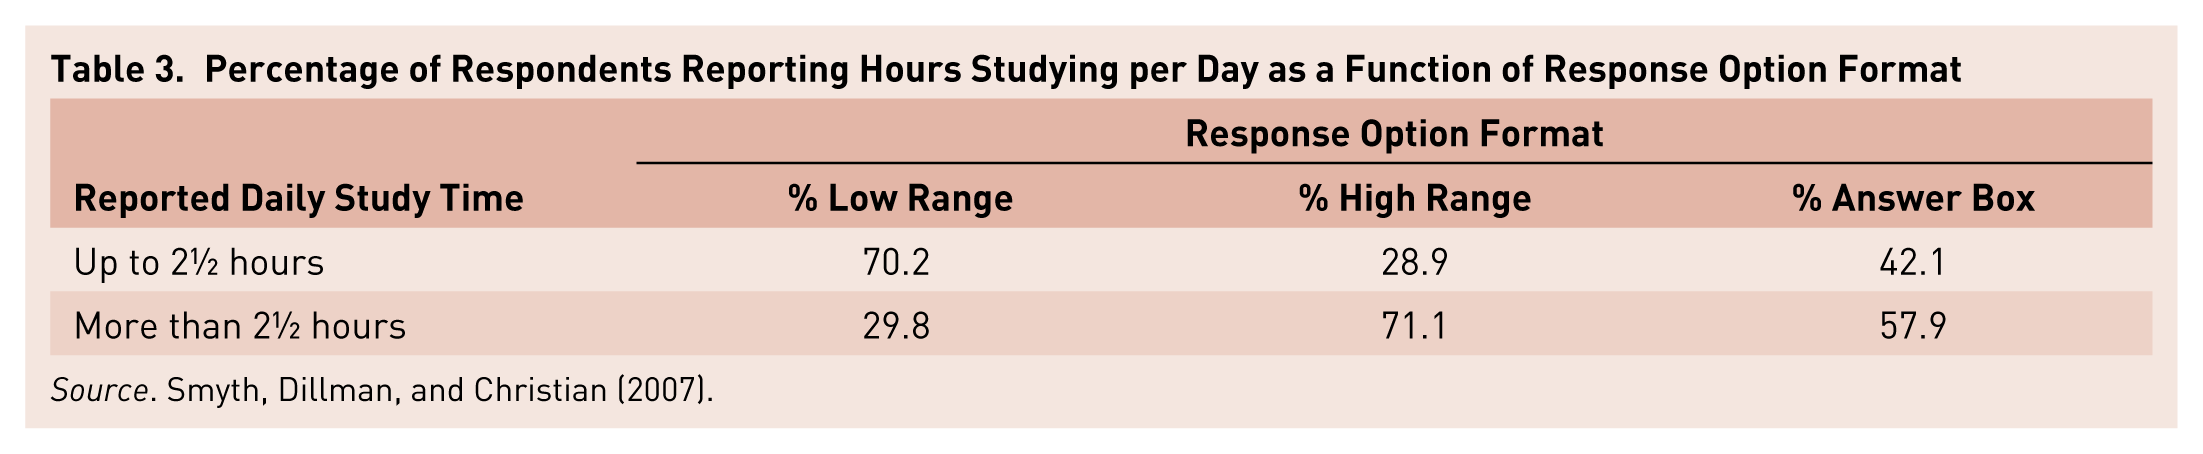
Source. Smyth, Dillman, and Christian (2007).
It should be noted that the “answer box respondents” (who were not provided with an expected range) reported durations that would lead to different conclusions. Because all these data were self-reported, we cannot determine which data are closer to reality, but we do know that respondents who used the answer box were not biased by the response options context effect.
Similar findings of the impact of providing the expected range of responses have been reported in both Web and telephone samples for the number of hours spent on a computer and the number of hours spent watching TV (Schwarz, Hippler, Deutsch, & Strack, 1985; Smyth et al., 2007). It is apparent that the information communicated by the range of responses provided by the questionnaire designer clearly influenced the respondents.
The message to questionnaire designers is to follow the advice of Schwarz et al. (1985) and use open-ended response formats for behavioral frequency questions. Although this approach makes data analysis more difficult and increases respondent burden, it avoids leading the respondent. It also illustrates that in questionnaire design, as in any design, trade-offs must be made, for if the context of the question is not clear, the responses will be of little value.
How Visual Design Influences Responses
Much as a horizontal flat surface at an appropriate height from the ground would suggest a place for sitting, the visual presentation of response choices provides information to the respondent regarding what is expected. In the area of Web page design, Norman (n.d.) described these sources of information as perceived affordances that inform the user of the required action. Questionnaire designers must consider both perceived affordances and cultural conventions associated with Web site use (scrolling, pointing, clicking, etc.) as they design their questionnaire.
Let us consider the effect of varying text box size. In a paper survey, Christian and Dillman (2004) presented different box sizes for three open-ended questions and reported that larger boxes produced significantly longer answers with more themes. In a paper survey, Israel (2006) provided response boxes of seven different heights and reported that response length increased linearly with box size. In a Web-based survey, Linegang and Moroney (2012) provided respondents with either a one-line text box or a larger, six-line text box after the same question. The average number of words for the one-line text box was 15.1 compared with 23.3 words for the six-line text box.
Interestingly, this effect is not limited to respondents participating in questionnaire-based conversations. When a printing error provided larger spaces on a form used by interviewers, the interviewers provided significantly more detailed responses (Smith, 1995). In all these cases, the text box size informed the respondents of the response length expected by the questionnaire designer.
Respondents are commonly asked to provide the date on which they completed the form. If a blank line is used on which to record the date, the answers could include any of these six formats: 7/4/15; 7/4/2015; July 4, 15; July 4, 2015; the European format, 4 July 2015; or the ISO 8601 (International Standards Organization, 2014) format, 2015-07-04.
Dillman, Smyth, and Christian (2014, p. 182) described an experiment by Christian in which the percentage of respondents providing the date in the desired (two-digit month, four-digit year) format was increased from 44% to 57% by changing the response option format from two boxes of the same size with labels for month and year provided under each box, to two boxes with the smaller box labeled month and the larger box labeled year. The percentage responding in the desired format was increased to 94% by labeling the smaller box MM (for month) and the larger YYYY (for year) and adding the phrase, “Please provide your answer using two digits for the month and four digits for the year.”
Combining the spatial component of box size with explicit instructions more than doubled the percentage of respondents providing the data in the desired format from the baseline condition of two boxes of the same size. Thus principles of good visual design can be combined with written instructions to communicate the designer’s intention to the respondent. Similar findings apply to entering dollar/monetary amounts and telephone numbers. Making the required format apparent to the respondent reduces both respondent burden and data transfer errors.
A similar, but more critical, data entry problem is kilograms/ pounds confusion, which was listed in the top 10 patient safety concerns by the ECRI Institute (2015). Entering the patient’s weight in pounds can result in medication dosage errors if the dosage is based on kilograms.
Finally, a ballot is perhaps the simplest form of a questionnaire, except that unlike most questionnaires, voter (respondent) errors can be detected. There are two types of error: overvotes (selecting more than one choice) and undervotes (not selecting any choice on the ballot, either accidentally or intentionally). Perhaps the most infamous design is the butterfly ballot used in the 2000 U.S. presidential election, when approximately 29,000 votes were not counted, mostly because of overvotes, and the margin of victory in the state of Florida was 537 votes.
Unfortunately, voting errors are not that uncommon, and hundreds of thousands of voters have been disenfranchised by design-induced errors, such as listing candidates in multiple columns, placing different contests on the same screen page, placing response options on both sides of the candidates’ names, and varying format and style on different pages (Chen, Kimball, & Quesenbery, 2008).
The foregoing are a few of many possible illustrations of how respondents rely on visual aspects of the questionnaire as part of the answering process. Questionnaire designers need to use the principles of visual design to make the implicit, explicit.
The Need to Personalize the Conversation
If a questionnaire is to be a conversation, the designer and the respondent need to establish a relationship. Because many people have an understandable reluctance to respond to questionnaires, questionnaire designers should utilize the principles of social exchange theory judiciously to motivate potential respondents.
Social exchange incorporates elements such as reciprocation, consistency, social validation, liking, authority, and scarcity (Cialdini, 2001). By using reciprocation (including an unsolicited gift), the Disabled American Veterans Organization increased its contribution rate from 18% to 35% (Caldini, 2001, p. 76). A $2 prepaid incentive increased response rate from less than 35% to 60% in a survey dealing with driver’s licenses (Dillman et al., 2014, p. 49).
The following have been shown to increase response rate: addressing the respondent by name, offering to share the results, informing potential respondents that others have responded, providing immediate feedback of lottery results, using a high-salience questionnaire, and including a photo (Edwards et al., 2009). Gunning’s (1952) classic book provides some basic conversational recommendations for questionnaire designers: Use short sentences, familiar words, action verbs; use terms that the reader can picture; and, finally, write the way you talk.
The following are cases when social exchange theory was not applied. Consider this anecdote about a recent college graduate who received an e-mail with a link to a survey about his college experience. The potential respondent was addressed as “Dear Recent Graduate,” despite the fact that the university knew the respondent’s e-mail address and name. The respondent’s reaction was somewhat predictable: “I just spent four years at this institution, incurred a debt of $XXX,XXX, and they do not even know my name.” This reaction is not a good start for the intended conversation and reduces the probability of obtaining a response.
Also consider this question from the demographics section of a survey: “Check which of the following categories best describes you,” followed by a listing of races from the 2010 U.S. Census: “White; Black, African Am., or Negro; American Indian or Alaska Native”; and so on. The question is focused on the categories as opposed to focusing on the respondent and the conversation. A simpler and more socially sensitive question would have been, “I am,” followed by the listing of racial categories.
Conclusions
We have described some of the many peaks of the questionnaire-as-a-conversation iceberg. We hope that our nudge has convinced readers that quality questionnaires should be written as conversations. Specifically, questionnaire designers need to consider the respondent’s mental model and shape that mental model so all respondents share a common perception of the task and know specifically what is being asked of them. We strongly encourage incorporating perceived affordances and Web-based cultural conventions into questionnaires as a means for reducing respondent burden. This shift in questionnaire design will reward us with more valid and usable data.
Space constraints preclude a detailed discussion of strategies for designing questionnaires as conversations and developing mental models. If this article has piqued your interest you may be interested in the monograph on questionnaire design which is being prepared for the Human Factors and Ergonomics Society. The monograph will be available in 2017.