
Abstract
How can ergonomics professionals and students measure sound levels, light levels, and so forth when they don’t have access to the specialized equipment needed for that purpose? This article explores using free iPhone and Android apps. We found that most sound-level applications were acceptable (within about 2 dB or less), but the illumination applications were unacceptably inaccurate, in some cases off by 50%. The merits of other apps are also described, and sources for various applications, including biomechanical analysis (e.g., RULA, REBA), are provided.
Keywords
Examination of a variety of apps for measuring distance, lighting, and noise identifies some reliable and accurate tools.
The portability problem: For the roving corporate ergonomist who visits a plant and finds unexpected problems, the current solution is to return to the home office, borrow the equipment needed, and then fly back to the plant to follow up. Alternatively, to cover all contingencies, the ergonomist could bring suitcases full of equipment that could be needed for every trip.
The entry problem: For those working in health care or other controlled or secure contexts, especially laboratory or clinical environments, bringing in equipment other than phones could be prohibited.
The cost problem: For financially strapped universities, even getting a few hundred dollars to purchase equipment can be a challenge, so free equipment is desired. To teach students how to collect human factors/ergonomics data, enough equipment is needed so that each group in a class (often five to 10 groups) has a device and there are enough spares. To provide some cost examples, the standard high-quality meter for measuring illumination is the Konica Minolta T10A, which retails for $1,100. There are lower-quality meters that could be suitable for classroom use (e.g., Dr. Meter model LX 1330B), but even those meters cost about $40.
Modern smartphones with onboard sensors for light, sound, and movement, along with high-definition cameras, significant onboard processing, and free applications, have the potential to help solve these problems. Are the applications available for iOS and Android accurate enough for these purposes, especially in the hands of students or other novices? The purpose of this article is to describe our efforts toward answering this question.
For our evaluations of the ruler and sound measurement apps, we used two iPhone 6’s, one running iOS Version 8.1.3 and the other running 9.3.2. We used a different iPhone 6 (running Version 8.3) for the lux meter tests. For Android, we used a Samsung Galaxy S5 and a OnePlus 3, both running Android 6.0.1. Searches of the two app stores (iTunes, Google Play) and of the Internet (using Google) identified relevant applications.
Lux Meters
Measuring workplace lighting (light falling on a surface, or illuminance) and display output (light emitted or reflected by a surface, or luminance) is common practice in HF/E studies. Searching for software for these purposes using the term light meter usually leads to devices for photographic measurements, whereas searching on lux meter leads to devices for basic illumination measurements. Luminance measurement features are not yet found on smartphones.
Although there are probably 50 to 100 lux meter applications, the literature describing their use is limited. In an examination of seven iOS and Android applications, DIAL (2016) found there were significant differences between the measured and reference values, in some cases as large as an order of magnitude, with differences between applications and between phones running the same application. She concluded that current lux meter applications are not for serious use. To overcome some of the hardware issues, devices to improve the sensors have been created, including the Lumu (Scoblete 2015), which plugs into the iPhone audio port, and the Luxi incident-metering photosphere (Wilt, 2014). More recently, a sensor has been developed that plugs into the iPhone lightning port (at the bottom of the iPhone 7), which also provides the color temperature of incident light (Rehm, 2016; see also Berenguer, 2013a, 2013b). For those seeking a low-cost substitute for a photosphere, split a ping-pong ball in half.
Despite this recent and pessimistic review, potential updates to the hardware and software led to another evaluation. The applications tested, all free, are listed in Table 1.
List of Apps Used for Lux Meter Testing, iOS and Android With Screenshots of the User Interface. Values on screen are examples not taken under our test conditions. For results, refer to Figure 2
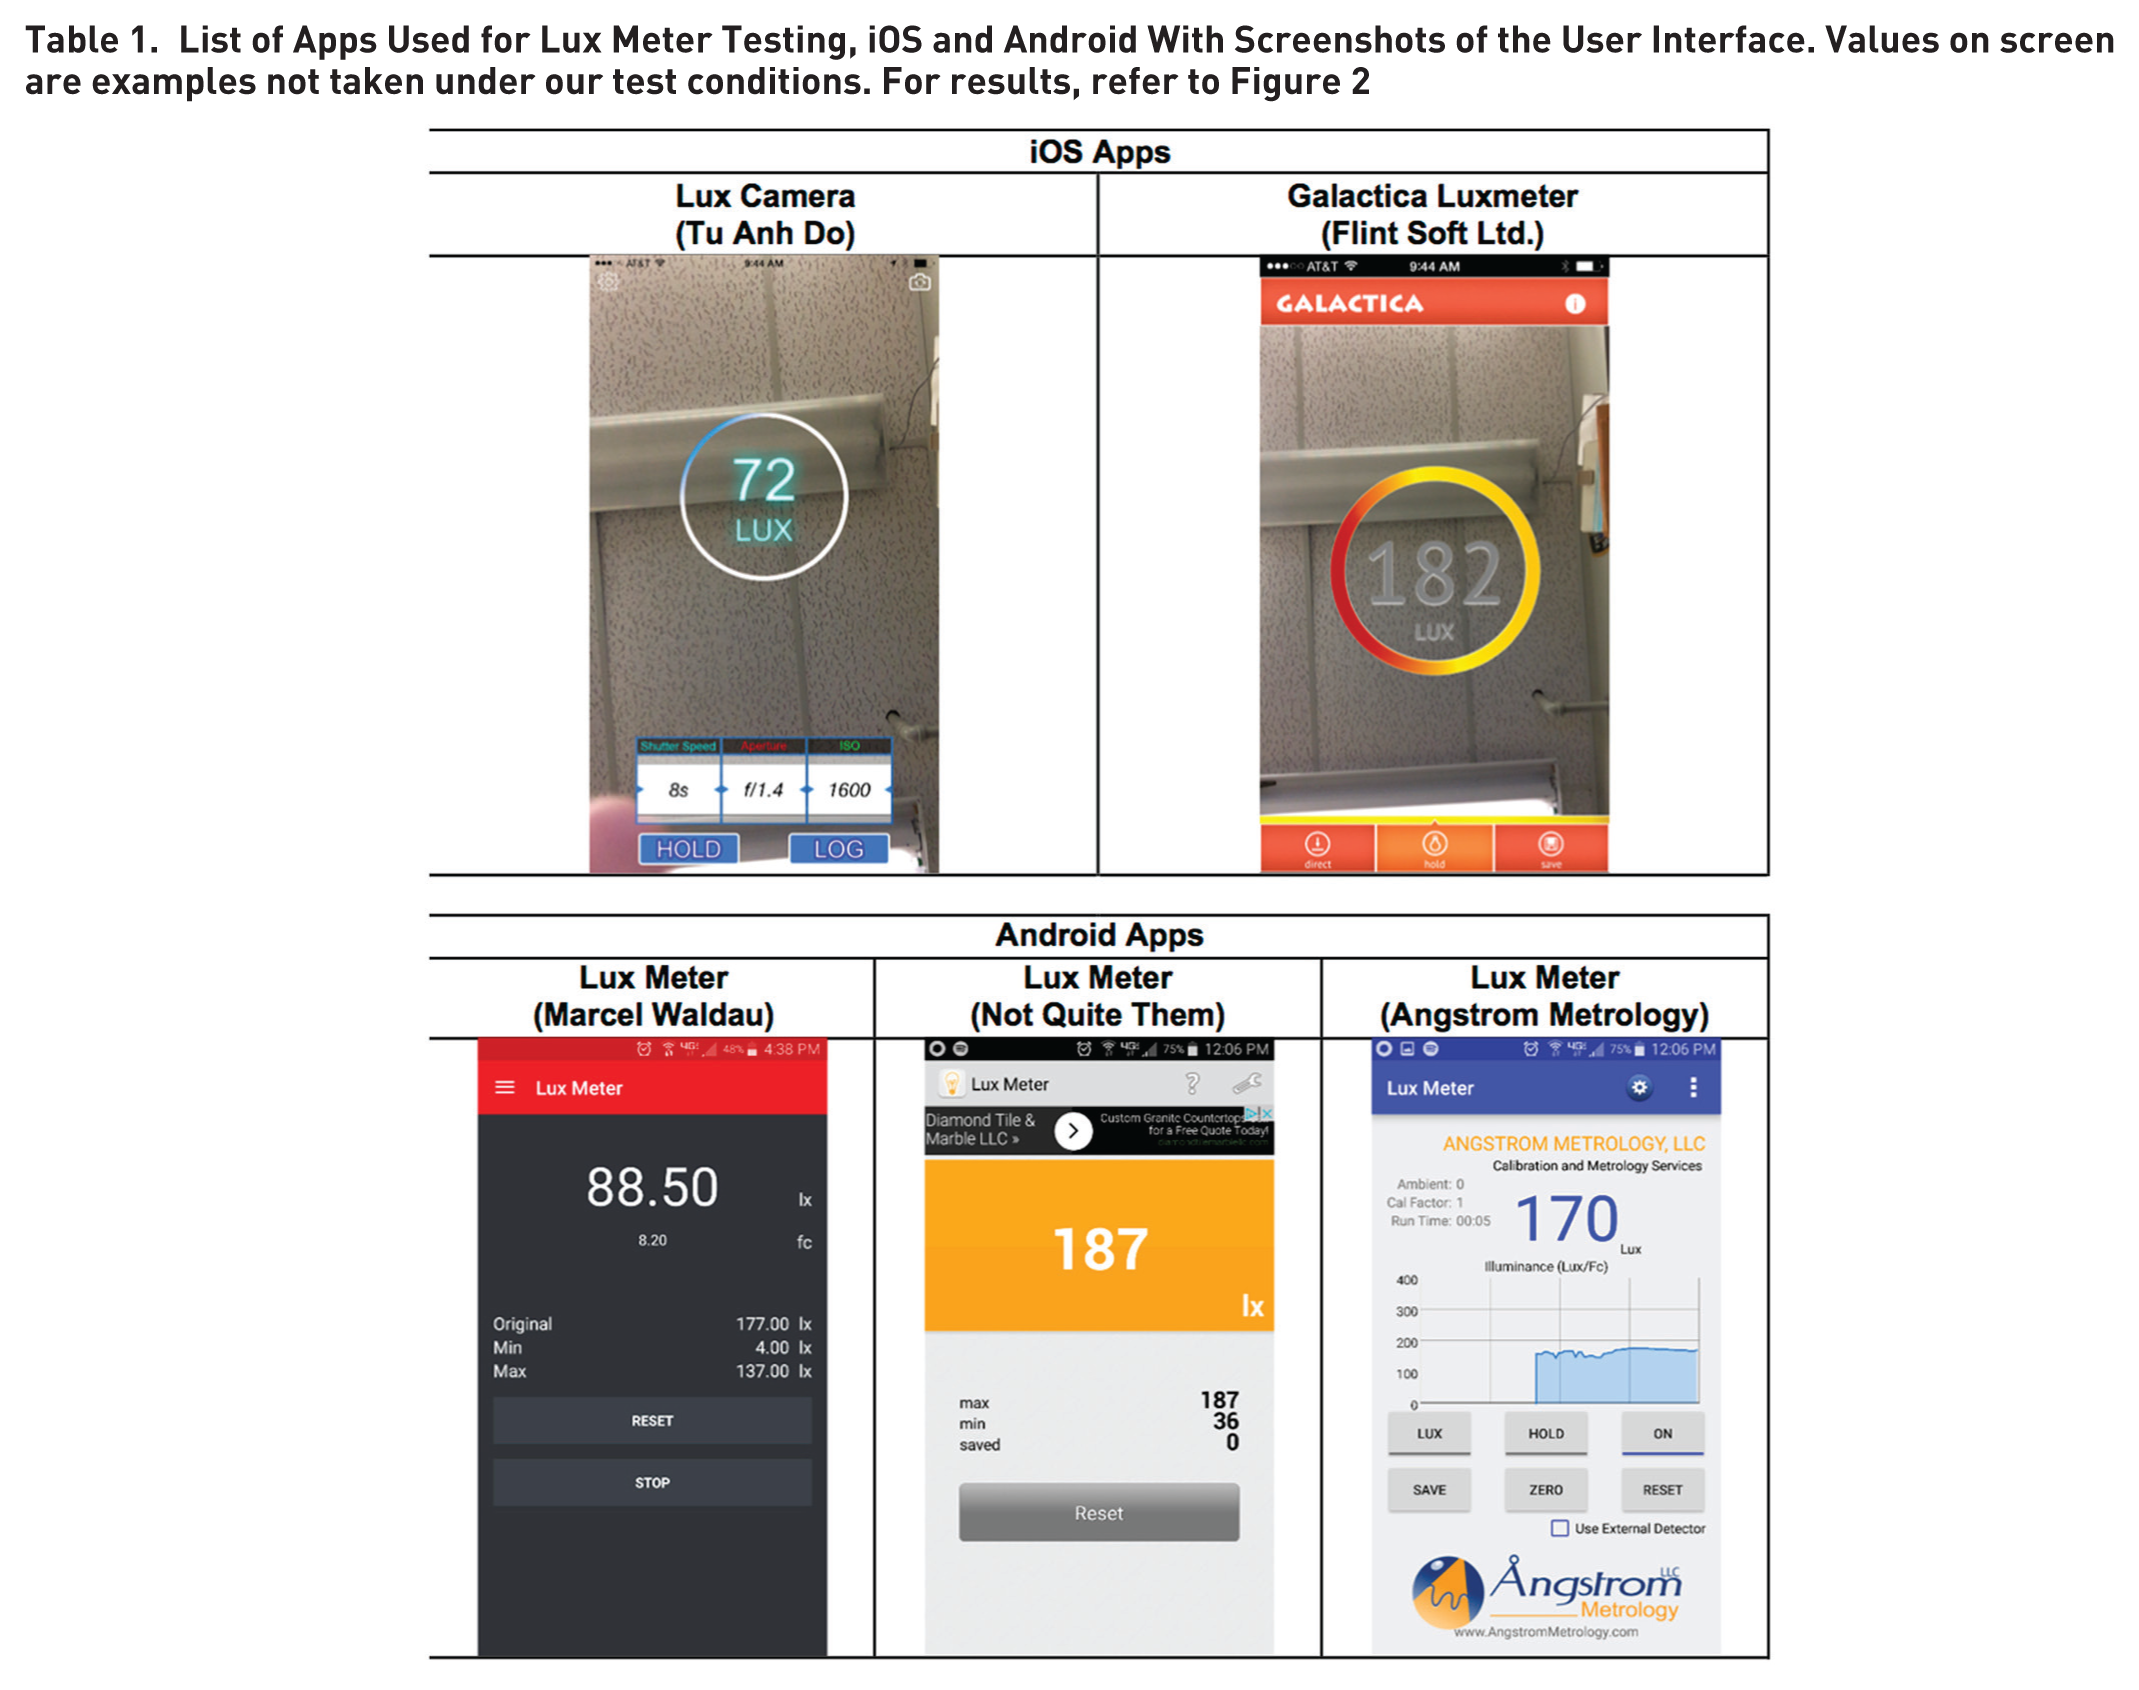
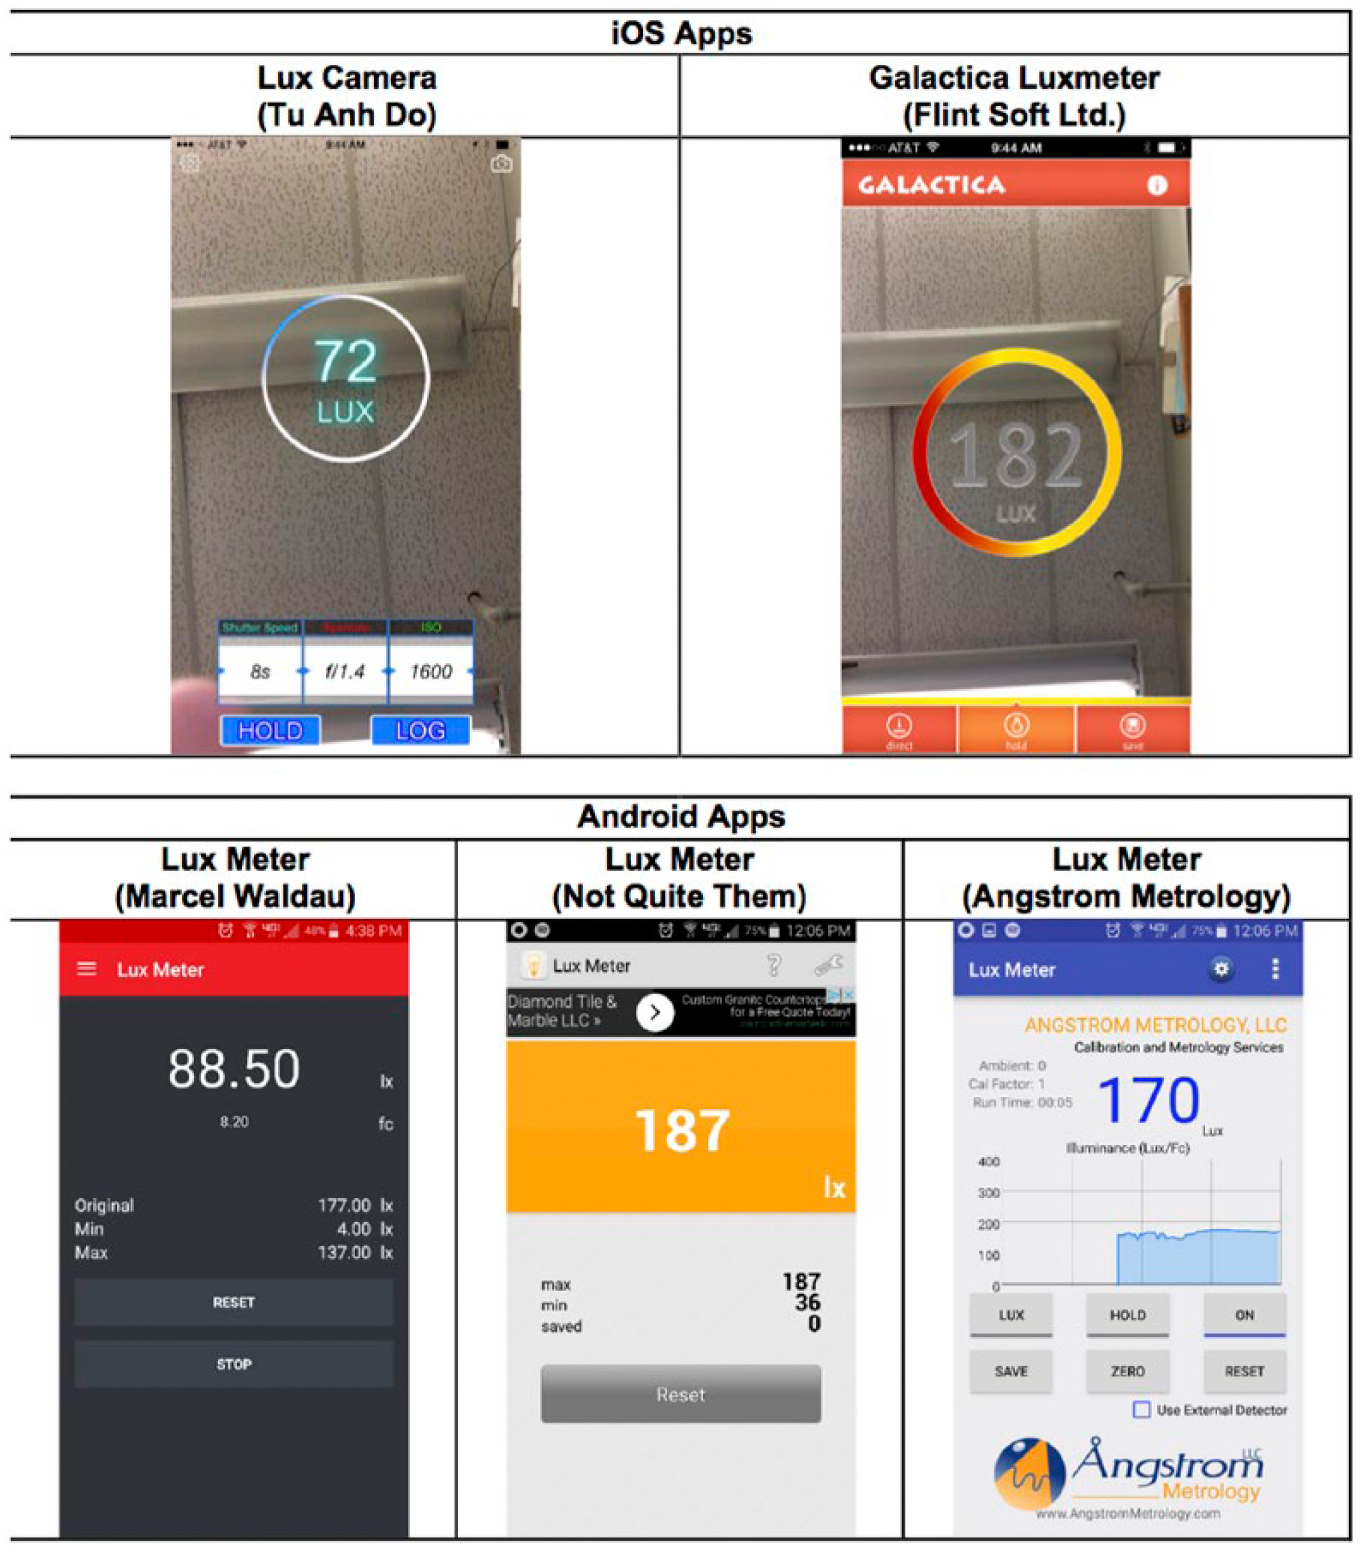
Light levels were assessed at levels critical for workplace lighting as per the 50/30/10 rule – 50 foot-candles (ft-c) where intensive work occurs (e.g., desktop), 30 ft-c for general office lighting, and 10 ft-c for hallways and stairwells (Beardsley, 1975). (Note: 1 foot-candle is about 10.7 lux.)
We found three locations at the University of Michigan Transportation Research Institute where levels should be consistent with the rule of thumb (Figure 1). Illumination was usually via fluorescent fixtures with F32T8 3500K (cool white) bulbs. The ground truth measurements were obtained using two Minolta T-1 illumination meters, which is a high-quality, self-calibrating device. When two T-1 meters were placed side by side, the illumination levels typically differed by 5 to 14 lux.
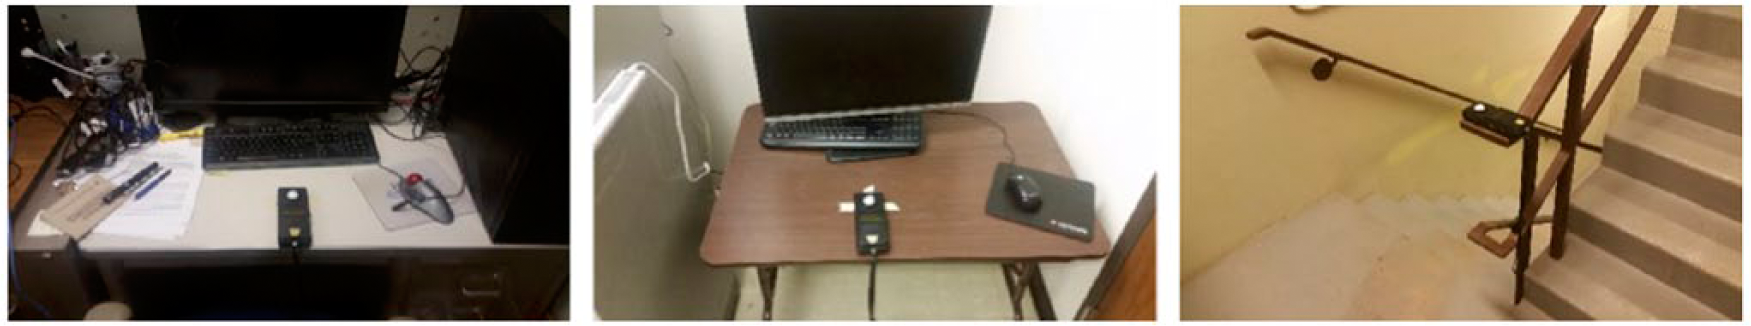
Pictured are the three locations in the University of Michigan Transportation Research Institute used to test the lux meters. From left to right, they are a well-illuminated desk area, a moderately illuminated lab station, and a dimly illuminated stairwell. Shown is one Minolta T-1 illumination meter.
We tested all apps using the front camera of the phones. The test procedure was to place the meter or the phone in the environment and launch the app as necessary. Care was taken that the camera or the photo sensor of the meter was in the same place for each test. Once positioned, the meter or app was given time to stabilize, about 3 to 5 s. To avoid erroneous measurements, the experimenters stood such that their shadows did not fall on the meter sensor while each measurement was being taken. After the measurement stabilized, the value was recorded and the next app or phone was positioned. At least two measurements were taken for each app.
If a measurement was not consistent with prior measurements, the phone was repositioned and the app was relaunched. This inconsistency occurred with the two largest luminance values of the Galactica Luxmeter app and the largest value of all three Android apps. Even after repetition, those values were substantially greater than those for the benchmark (the measurements from the Minolta T-1 meters). Furthermore, the measurements reported here were found to be repeatable in a less formal test conducted days later by the same individuals.
As shown in Figure 2, we found significant differences between best estimate (mean) of the illumination level (from the Minolta meters) and the iPhone applications, with applications having levels that ranged from half to double the true value. These differences with the expected values are too large for most HF/E work, and transforms or corrections were rejected because the measured values were directionally sensitive (a hardware limitation), a finding also reported by Berenguer (2013a, 2013b).
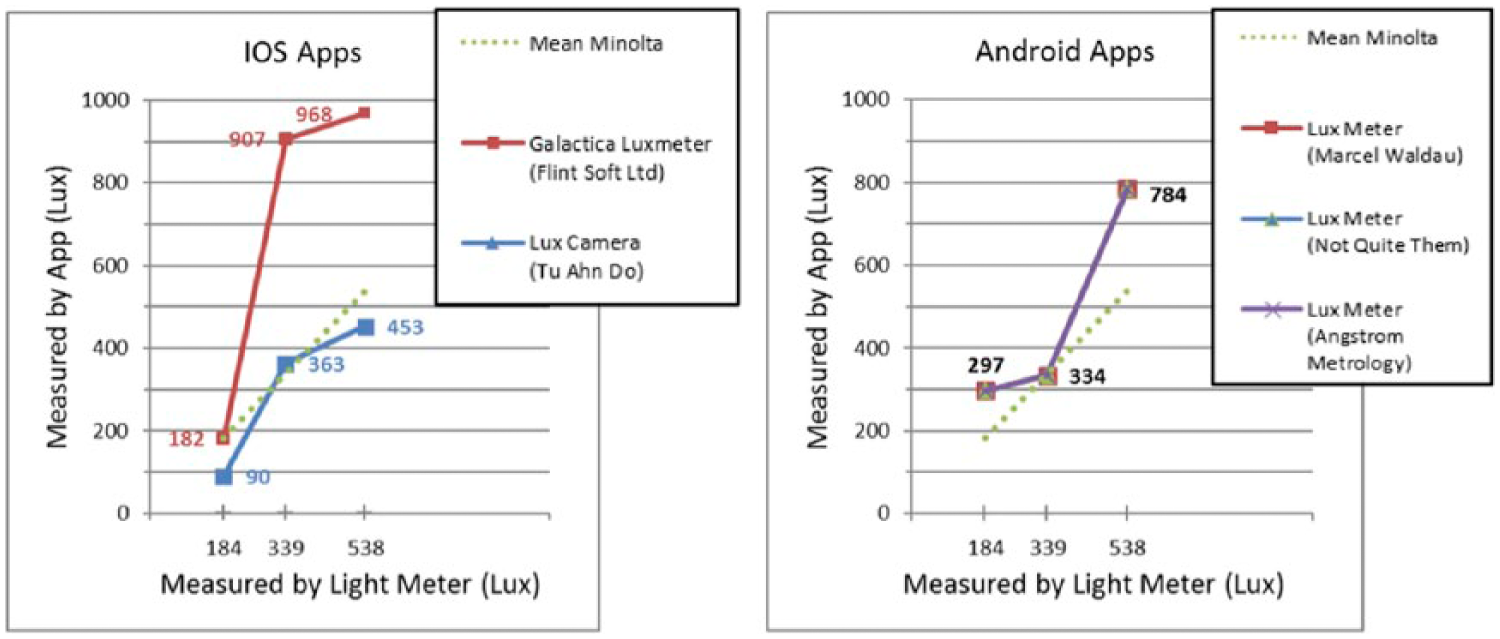
Light meter illumination levels. The Minolta meter values are on the x-axis.
Notice that for iOS there were large between-app differences, whereas for Android, the results were consistent (but nonetheless wrong), although the accuracy of the Android apps could be improved by calibration. According to the literature, the use of photospheres should improve the apps’ accuracy, but then a smartphone cannot be used as is. The effect of source distribution on measured illumination levels needs further investigation.
How good is good enough?
The answer to that question depends on the question (and the task) and expectations for the equipment. For low-cost light meters, personal experience of the first author indicates that errors on the order of 10% are fairly common. However, in making a decision about a threshold (is there 50 ft-c here?), probably something close to 2% is desired. With lighting, sometimes exact values for thresholds are not given but a range of thresholds is provided, depending on conditions (e.g., 30 to 50 ft-c), in which case probably a 5% error is acceptable.
One of the real-world challenges is that people not familiar with human factors/ergonomics do not appreciate what real data are like. So if a measured illumination level is reported to be 49 ft-c, it is assumed to be exactly that value, and if the performance requirement is 50 ft-c, then the light fails to meet the requirement. In those cases, errors need to be on the order of 1%, assuming that everything else about the measurement process can be controlled.
Real meter specifications are grouped into four categories from worst to best in the Deutsches Institut für Normung (DIN) 5032-7 standard (L, A, B, and C). (See sidebar for a list of identified standards.) L and A are comparable with the general precision class in Japanese Industrial Standard (JIS) 1609-1:2006. DIN B and C correspond to JIS general classes AA and A, respectively (Woo, 2014). To the best of our knowledge, these documents do not specify the error in the illumination level directly; rather, they specify the difference in percentage between the device V-Lambda and human V-Lambda (spectral sensitivity).
Based on a review of several device specifications, it appears the claimed accuracy for DIN B and C devices is ±3% and for other classes is ±5%; nevertheless, we have seen other values. At the current time, meters that cost about $100 are commonly class B or C. For less expensive meters, the JIS or DIN specifications are not listed and accuracy claims are uncommon. There does seem to be a gap, however, between the specified accuracy of lux meters and their actual accuracy, with the error depending on the spectral composition of the source (American Conservation Consortium, n.d.).
Sound Level Meters
In contrast to the paucity of published research on lux meters, we found several studies of smartphone sound level meters using the search term “iPhone sound level meter accuracy.” As an example, Kardous and Shaw (2014) examined 10 iOS apps out of 130 and four Android apps out of 62 that met criteria for an occupationally useful sound level meter. Based on laboratory measurements (a reverberant chamber in an acoustic laboratory, a pink noise source) of the iOS apps, they found Noise Hunter (inter•net2day), NoiSee (EA Lab), and SoundMeter (Faber Acoustical) had mean differences within ±2 dBA of the reference measurements, making them adequate for certain occupational measurements. The authors did not test Android-based apps.
In a later paper reporting many of the same results (Kardous & Shaw, 2015), the authors also reported data for one Android app that met their requirements, SPL Meter. For sound levels of 70 dB (conversation level), between-phone levels for that application were on the order of 10 dB, differences that are unacceptably large. However, for the iOS app, using a microphone compliant with the International Electrotechnical Commission (IEC) standard led to readings with ±1 dB of reference levels (Kardous, Shaw, & Murphy, 2016). See also Roberts, Kardous, and Neitzel (2016).
Murphy and King (2016) reported results that were generally consistent with those of Kardous and Shaw: that iOS apps led to measurements that were closer to reference values and that there were large between-manufacturer differences for Android phones. They also found that Sound Level Analyzer Lite (Toon, LLC) measurements were within ±1 dB of reference values.
Finally, other research (Fogola, Masera, & Bevacqua, 2015) shows significant accuracy problems for sound levels outside of the 60–80 dB intensity range and 250–4000 Hz frequency range.
For those seeking additional studies of sound level meter application performance, see Keene et al. (2013) and Nast, Speer, and Le Prell (2014).
How close would measurements be to reference values in the hands of typical users, namely, students?
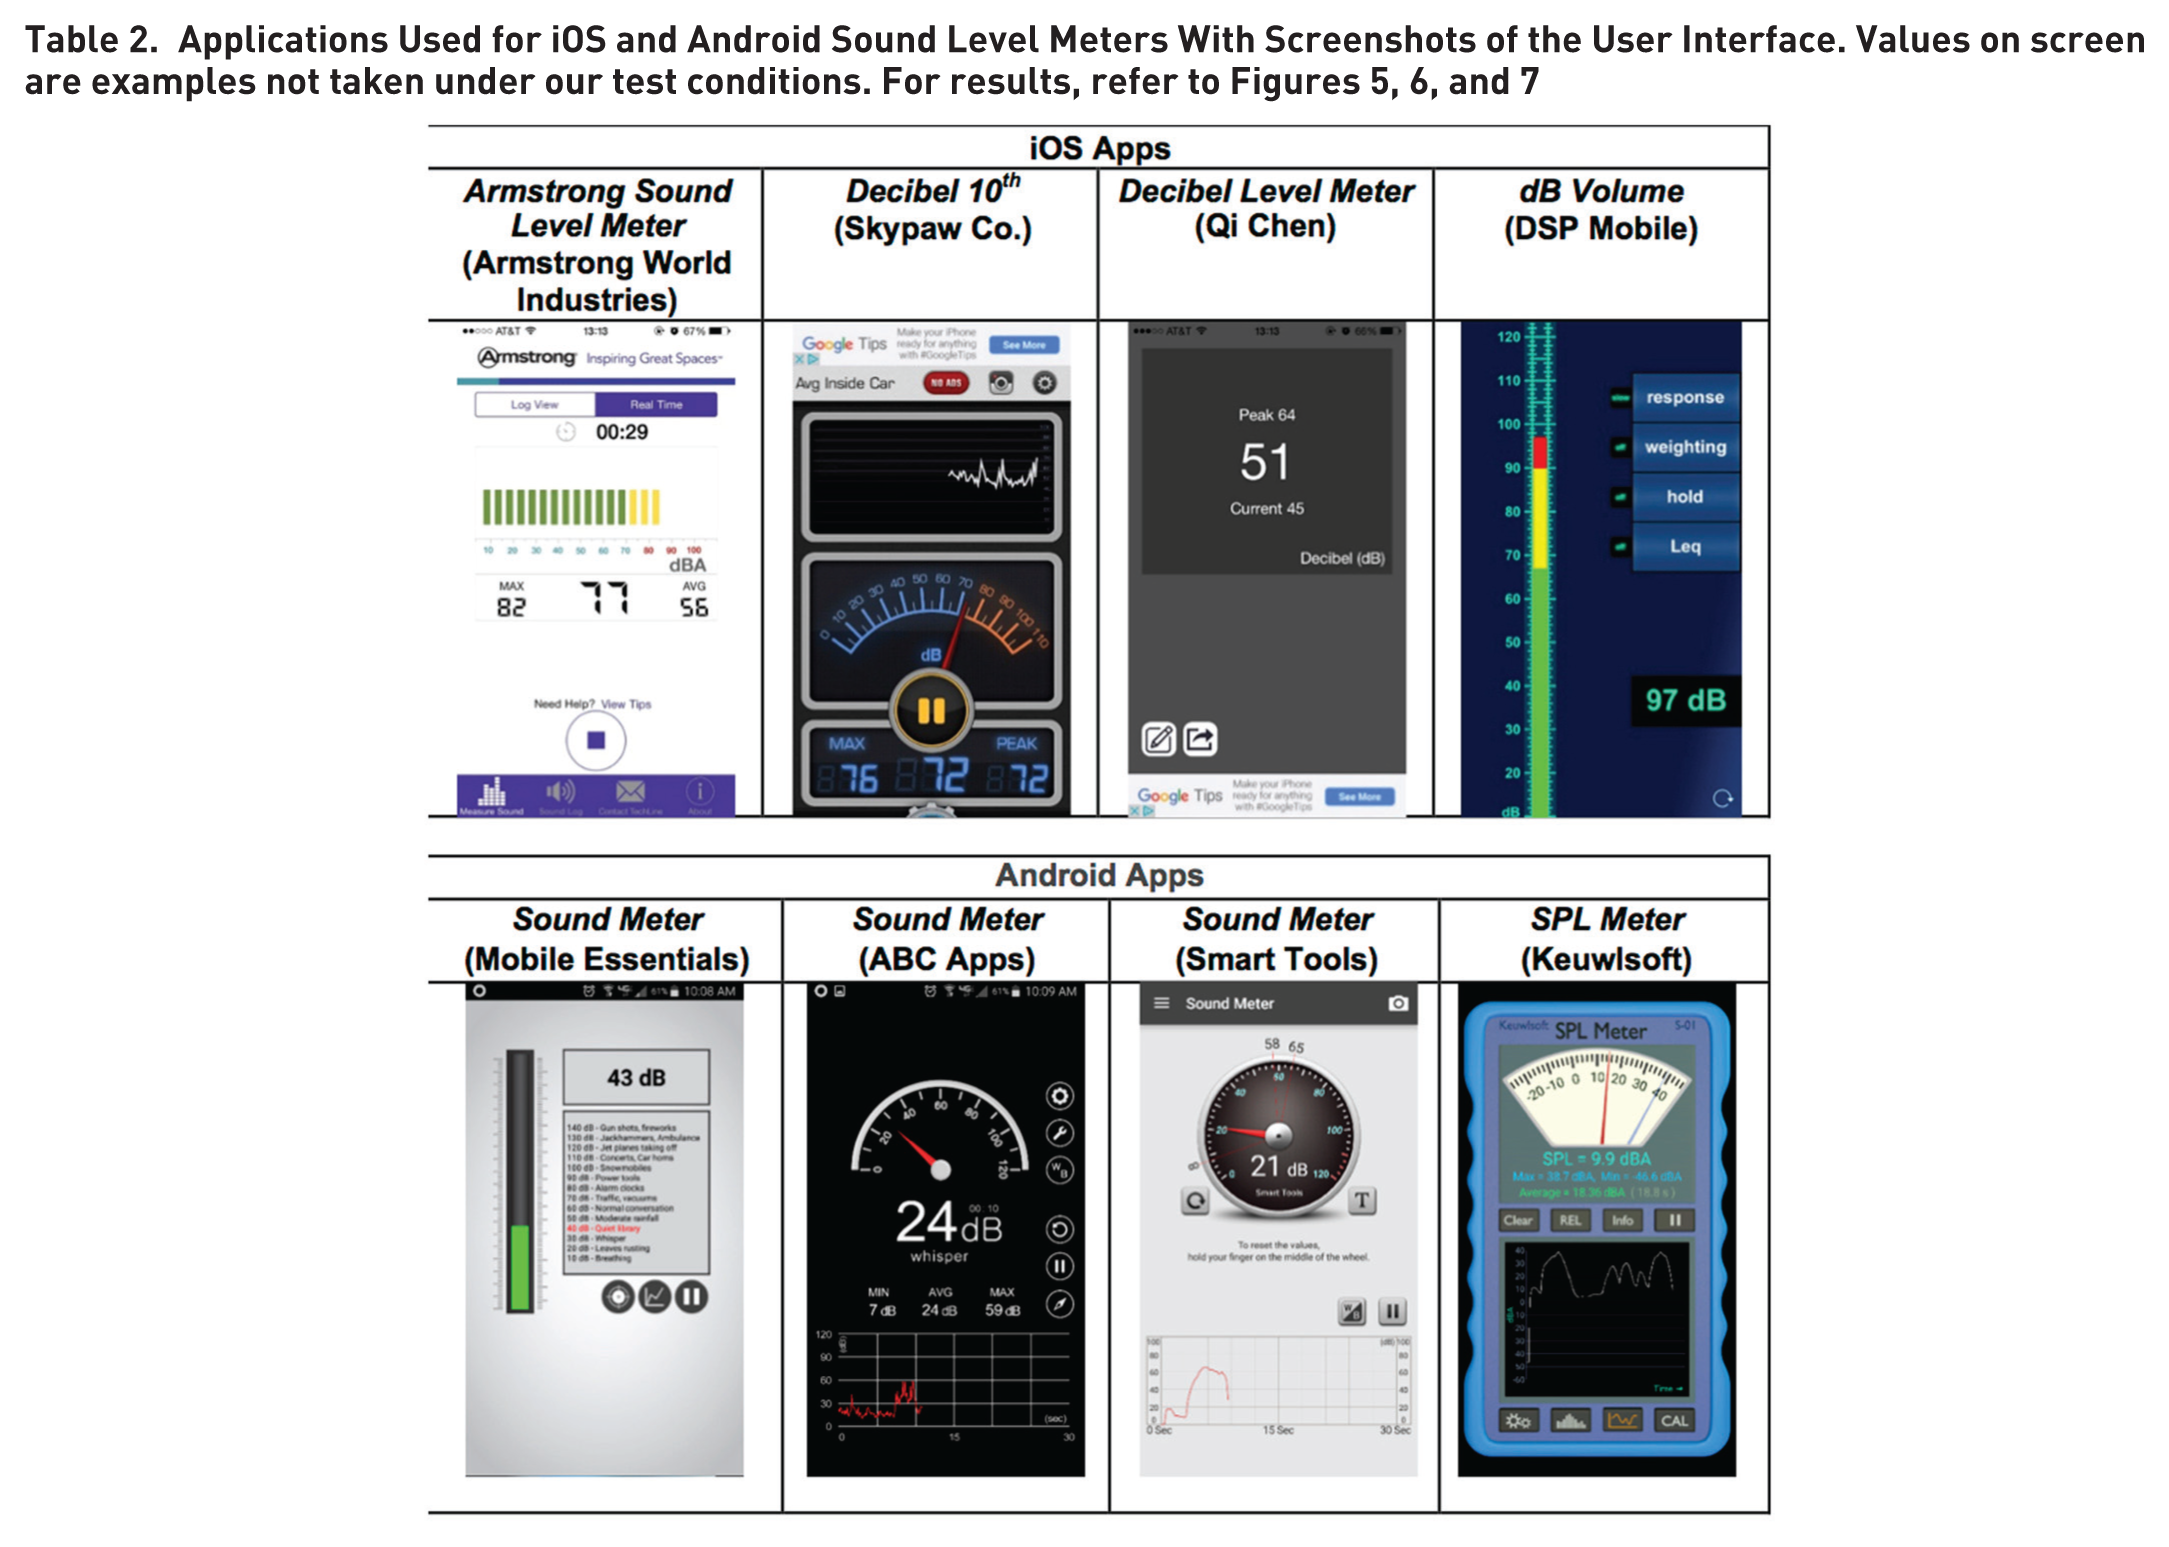
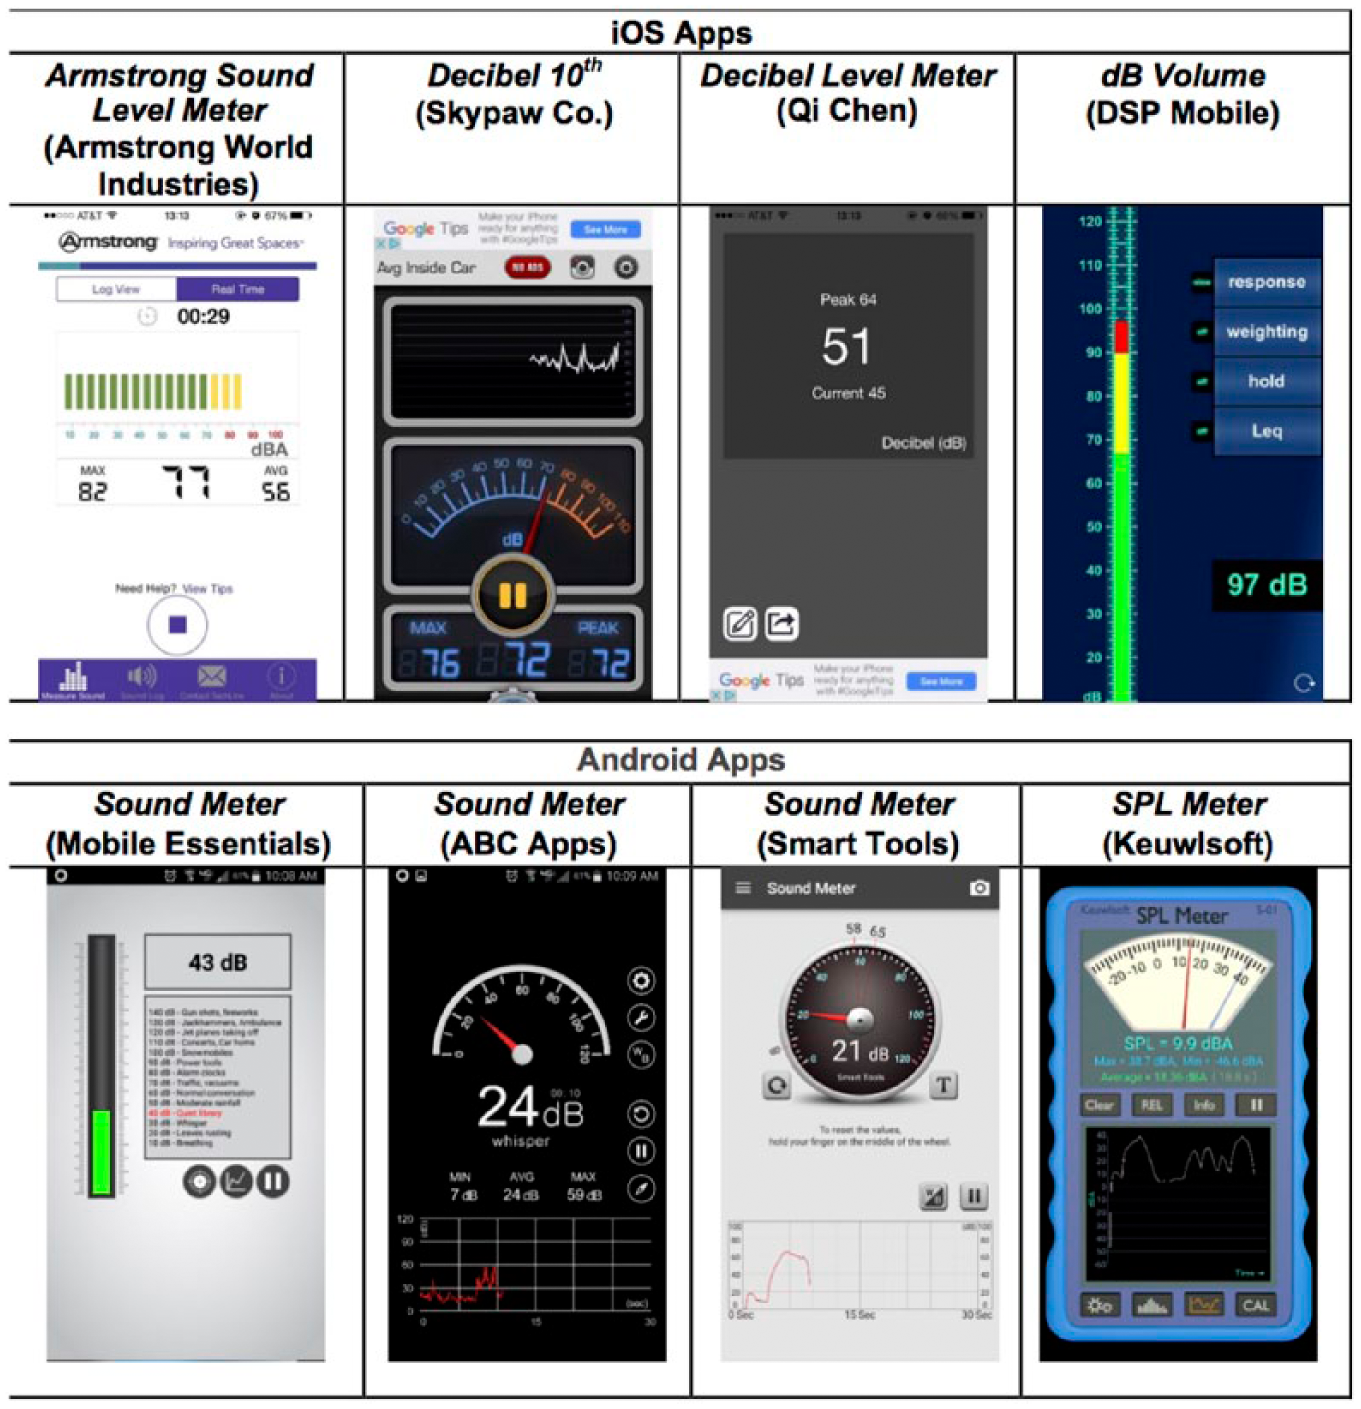
We answered this question using eight applications, four per phone (Table 2). Only SPL Meter for Android provided options for time or frequency weighting.
The ground truth was determined using two Extech 407730 sound level meters (accurate to ±2 dBA) and one Quest Electronics Model 2800 impulse-integrating sound level meter, supposedly also accurate to ±2 dBA but often much better. The Extech meters are typical of those used for sound surveys. The Quest meter was closer to laboratory quality and was calibrated using a Quest QC-10/QC-20 calibrator (114 dB, 1000 Hz tone). Similarly, we checked the Extech meters before taking measurements.
To determine sound level meter application accuracy, our reference sound was a recording of an air compressor on YouTube (https://www.youtube.com/watch?v=Xj5X-ydtyI4). We selected that recording because it is likely to be in a noisy workplace and the sound has no strong frequency peaks. The recording was played in a quiet office using an HP z420 desktop computer with two Sony SRS-48 external speakers, chosen because of their broadband response (Figure 3). The room was 9 ft wide × 7 ft deep × 8 ft high with a concrete floor and ceiling and gypsum board walls. The meters were 1 ft from the speakers, which were 2 ft apart.

Placement of sound level meters and speakers on the desk. Squares on checkerboard are 1 in. × 1 in.
The test procedure was to turn the sound source off, place the meter or phone in the environment, and then launch the app if needed. Care was taken that the microphone of the meters or the phones was in the same spot for each test. Next, we played the sound at five specified volumes. The volume controls on YouTube were set to maximum and the computer’s volume control was set to 1%, 11%, 21%, 31%, or 41%. These values were selected because they produced sounds that ranged from 60 to 90 dB when measured with the Quest meter. Depending on the conditions, sounds in that range can be annoying, interfere with speech, and, at the highest levels, be in conflict with Occupational Safety and Health Administration (OSHA)–specified exposure limits for an 8-hr workday. Accordingly, sounds in that range are of interest to human factors engineers and ergonomists. Furthermore, the Extech sound meters do not register sounds below 50 dB, and we needed to be well above their minimum performance level.
At each sound level, the app was given time to stabilize, about 3 to 5 s. Then the value was recorded and the next sound level was played. We took only one measurement at each level because informal pilot testing has shown the measurements to be stable given the consistency of the measurement process.
As shown in Figure 4, the Extech meters were consistent with each other, differing by 1.7 dBA (slow) at low levels but 3.8 dBA at higher levels. On average, they differed from the calibrated meter values by 1.5 to 2.6 dBA at higher levels. Given the size of these differences and the fact that levels close to 90 dBA are critical, use of the Extech meters could be discouraged. For that reason, we used the Quest readings (displayed to the nearest 0.1 dBA) as the standard in other parts of this evaluation.
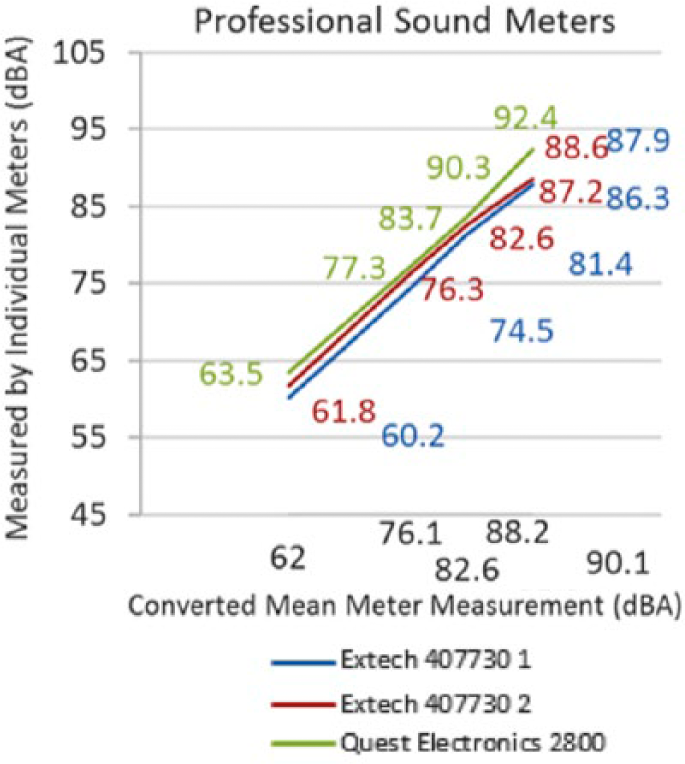
Results of sound meter testing. The Quest meter values are on the x-axis.
Keep in mind that there was only one Quest meter, so the size of between-meter differences for that type of meter is unknown. However, the design of the meter, its reputation, and the calibration procedure provide confidence in its accuracy. Informal checks over the course of this experiment showed that there were no changes in the reported calibration value.
As shown in Figure 5, the differences between iOS phones were typically about 1 to 2 dBA. Overall, the application levels were greater than professional sound level meter values by 1 to 2 dBA and sometimes much more, depending on the application. According to these data, the dB Volume application was closest to the ground truth, followed by Decibel 10th. The applications were at least as accurate as the data from a typical survey sound level meter, but they cannot be calibrated.

iOS sound level results. The professional sound level meter values are on the x-axis.
Note that in these figures and all other figures in this section, the professional meter’s results are used as the x-axis and the measurements of the apps are on the y-axis. Thus, the diagonal green line represents measurements identical to the professional sound meter, and the deviation of the apps from ideal is relative to that line.
In contrast to the iOS results, the uncalibrated Android apps were inaccurate (Figure 6), with Sound Meter (Smart Tools) giving the best results. Differences were 1 to 7 dBA for that application depending on the intensity examined.

Android sound level results, uncalibrated. The professional sound level meter values are on the x-axis.
However, the Android apps supported a user-entered calibration correction, computed as the mean error at the five intensities. The correction vastly improved the results overall (Figure 7), although the previously preferred application was now less accurate for levels close to 90 dBA.

Android sound level results, calibrated. The professional sound level meter values are on the x-axis.
The iOS apps were more consistent than the Android applications. For those seeking even more accurate results, Berenguer (2013a) found that using an external microphone (e.g., Mic-w) leads to a combination that meets the Class 2 specifications of IEC 61672. For those for whom accuracy is important (for example, to determine compliance with OSHA regulations), adding an external microphone is suggested.
How good is good enough?
Just as for lighting, the answer to this question depends on how the measurements are to be used. Sound level meters used to verify compliance with OSHA requirements in the United States must comply with American National Standards Institute (ANSI) standard S1.4. That document specifies that meters must meet one of three levels of accuracy: Type 0 used in laboratories, Type 1 used for precision measurements in the field (±1 dB), and Type 2 used for general-purpose measurements (± 2 dB; U.S. Department of Labor, n.d.). Type 2 meters are appropriate for determining compliance with OSHA regulations (Nast et al., 2014). Measurements outside the United States for occupational assessment, depending on the country, could be required to meet IEC 61672-1:2002.
Measurement accuracy requirements for product (e.g., motorcycles, lawn mowers, concrete mixers) sound levels are specific to product types and can cite ANSI or IEC standards (National Academy of Engineering, 2010). IEC 61672 accuracy requirements vary with the device class and frequency. For example, at 1 kHz, the requirements are ±1.1 dB for Class 1 and ±1.4 dB for Class 2. The accuracy values are greater by several decibels at other frequencies, increasing with frequency (Raeco, n.d.; Tingay, 2011). See also Norsonic (n.d.), Narang and Bell (2008), and Robinson and Tingay (2014) for calibration and related information.
Rulers
There are times when a human factors expert needs a ruler or tape measure but does not have either. Accordingly, we examined the accuracy of on-screen and photo ruler applications.
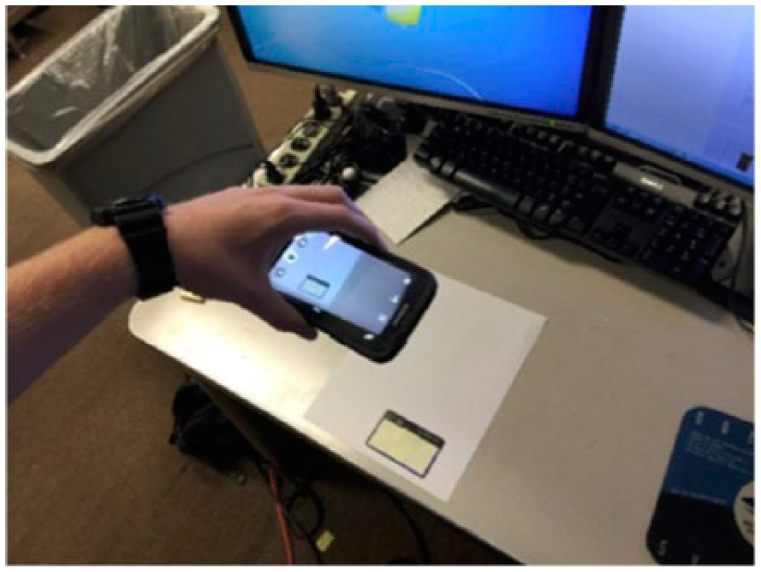
For an on-screen ruler, one places the object on top of the on-screen ruler image to measure its dimensions (Figure 8).
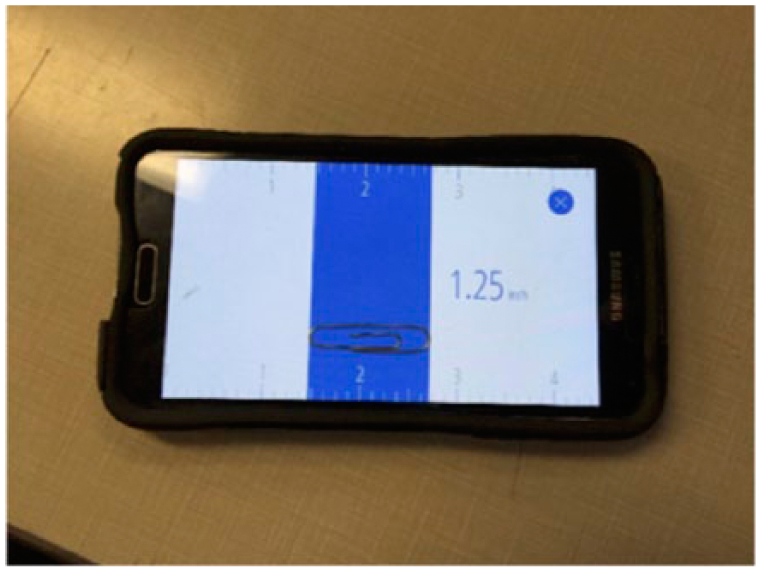
On-screen measurement of a paperclip using the Ruler app from Nixgame.
To measure objects larger than the screen, one marks off known lengths on the object using a pencil and then adds up the distances, just as one would measure a large object with a traditional ruler. This process can be slow and cumbersome, so another option is to use a photo ruler. With a photo ruler, one places an object with a known dimension on top of the object of interest and moves cursors between points of a known distance on the reference object and points to be measured on the object of interest. Images are photographed perpendicular to both surfaces (Figure 9).
Taking a photo to measure width of a piece of paper using the Ruler app by EXA Tools.
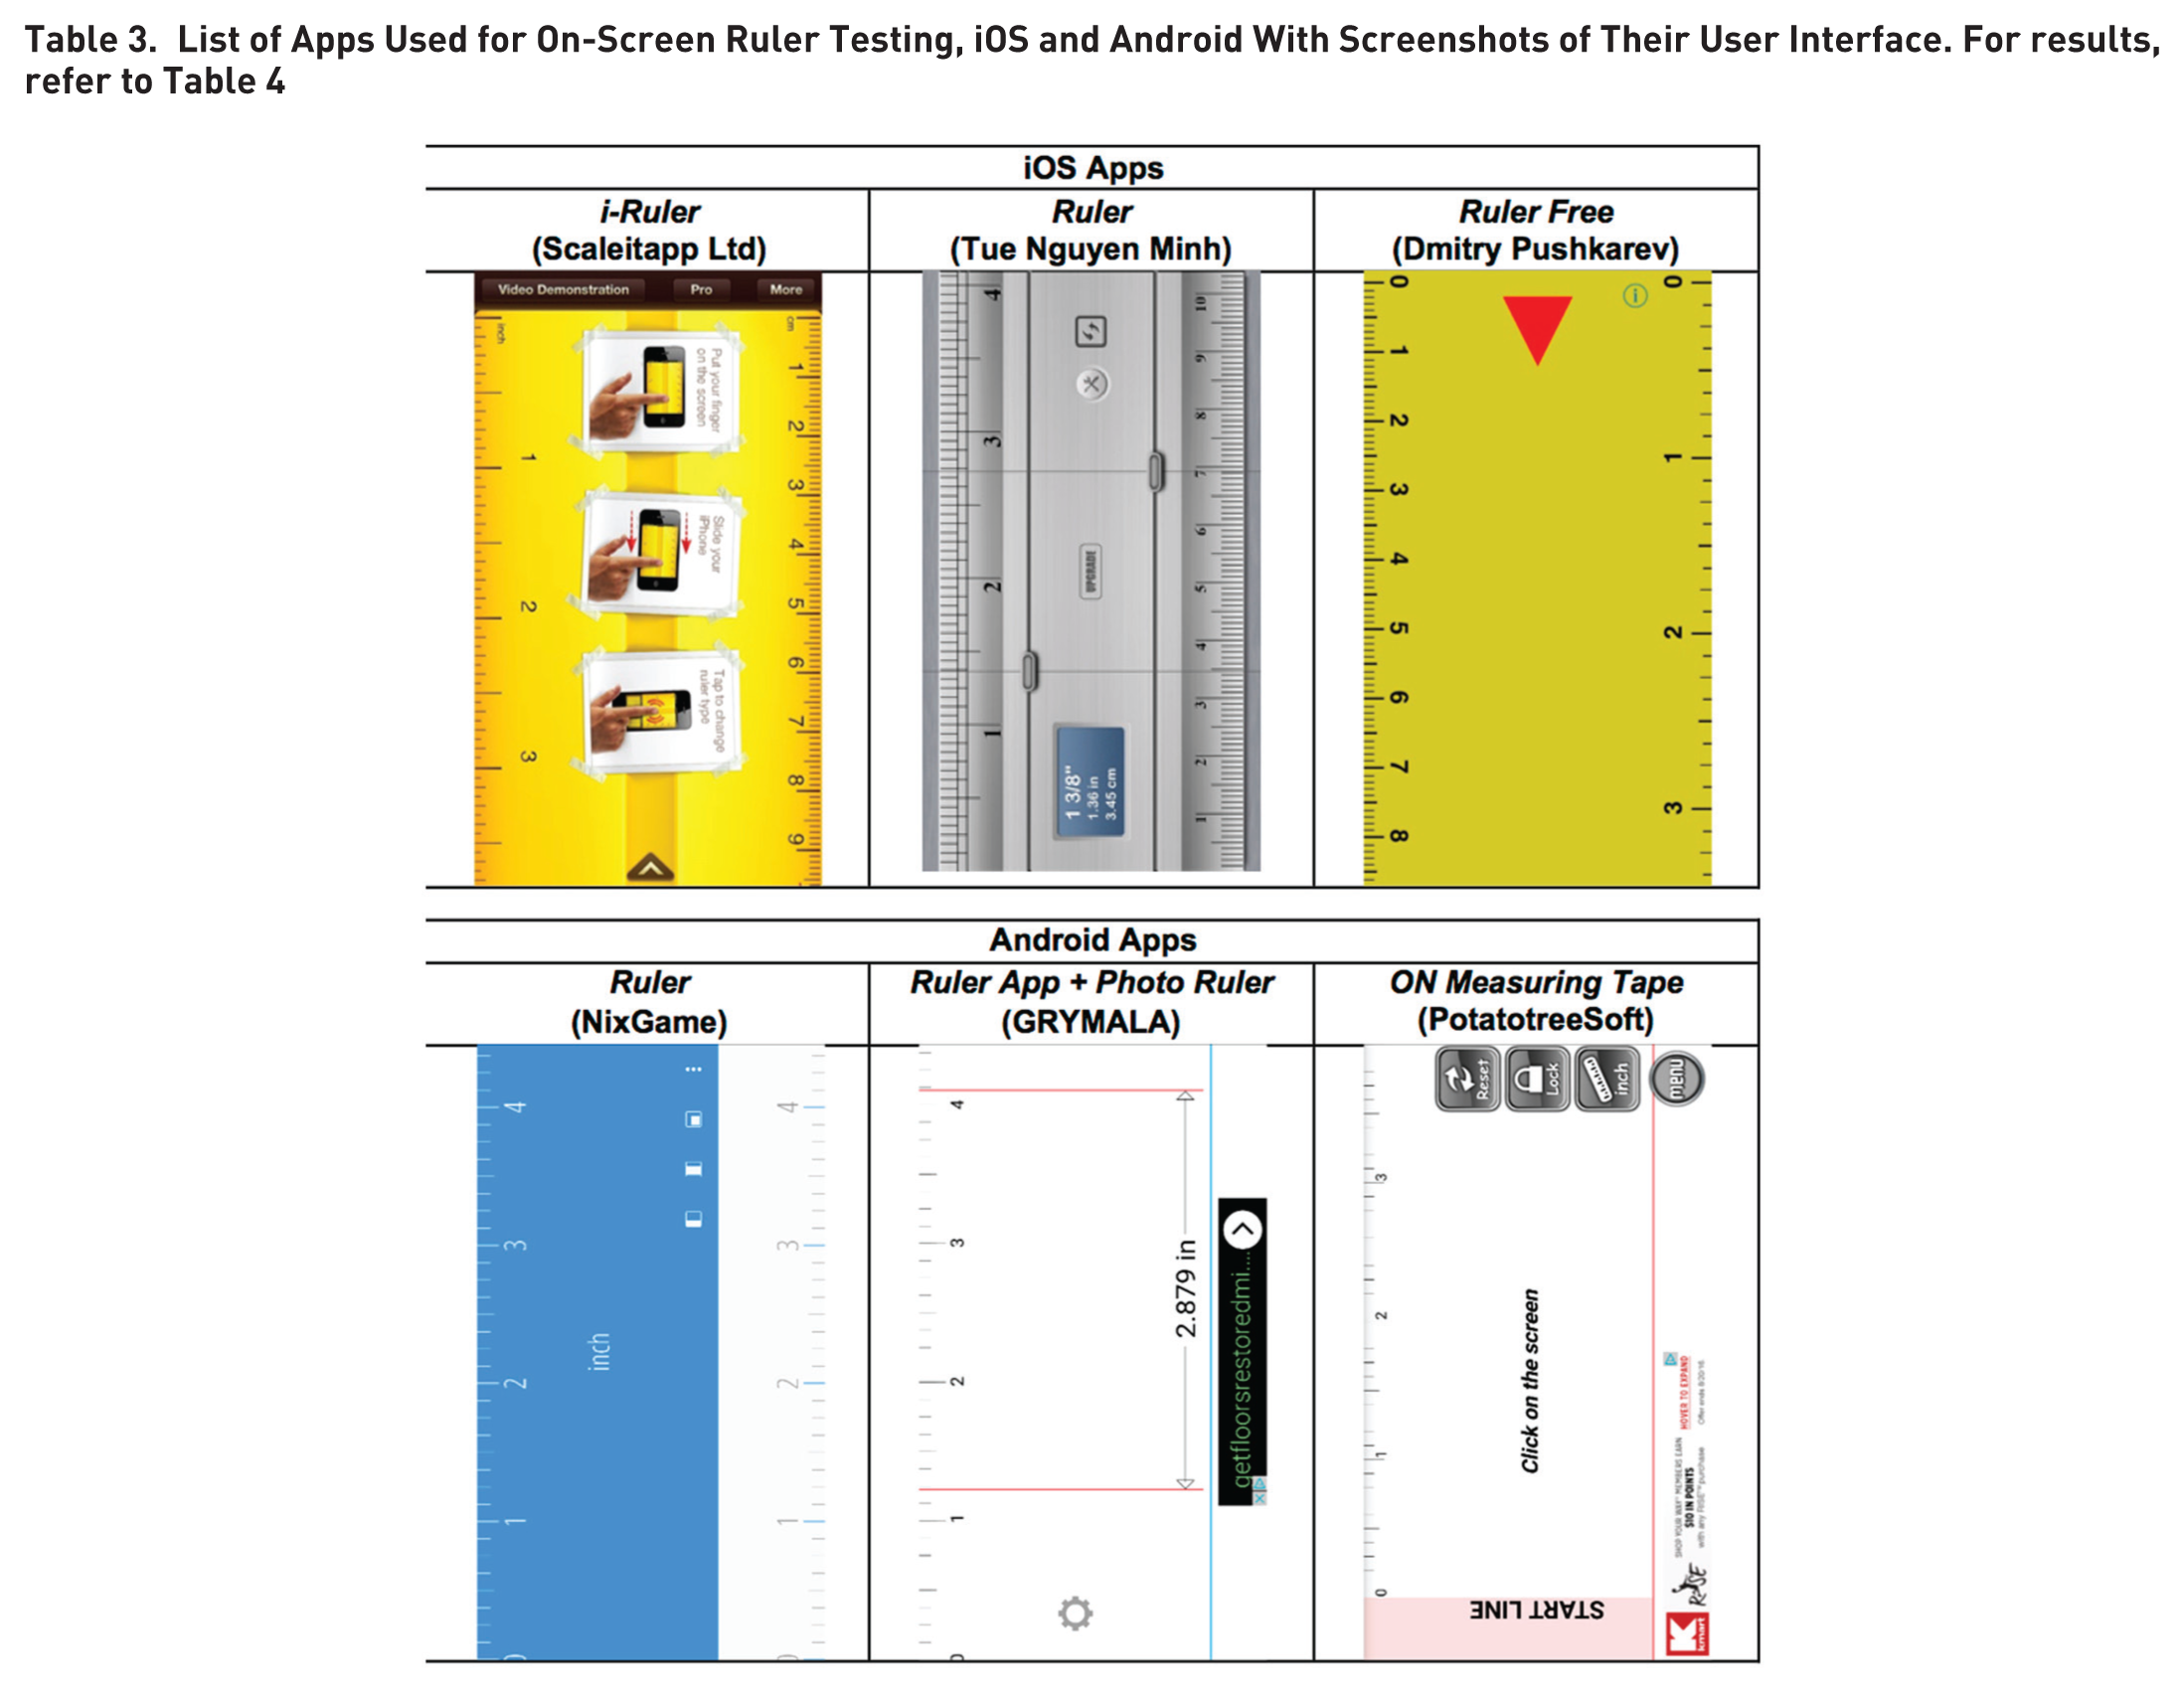
As we did not expect the rulers to be hardware dependent, only one phone was used for each operating system, a Samsung Galaxy S5 for Android (6.0.1) and an iPhone 6 for iOS (8.1.3). For each application, the reference objects were (a) a 1.25-in. paper clip, (b) an 8.5 × 11-in. piece of paper, and (c) an HP Compaq LA2405x computer monitor (21.9 in. wide). There were three iOS and three Android applications (Table 3).
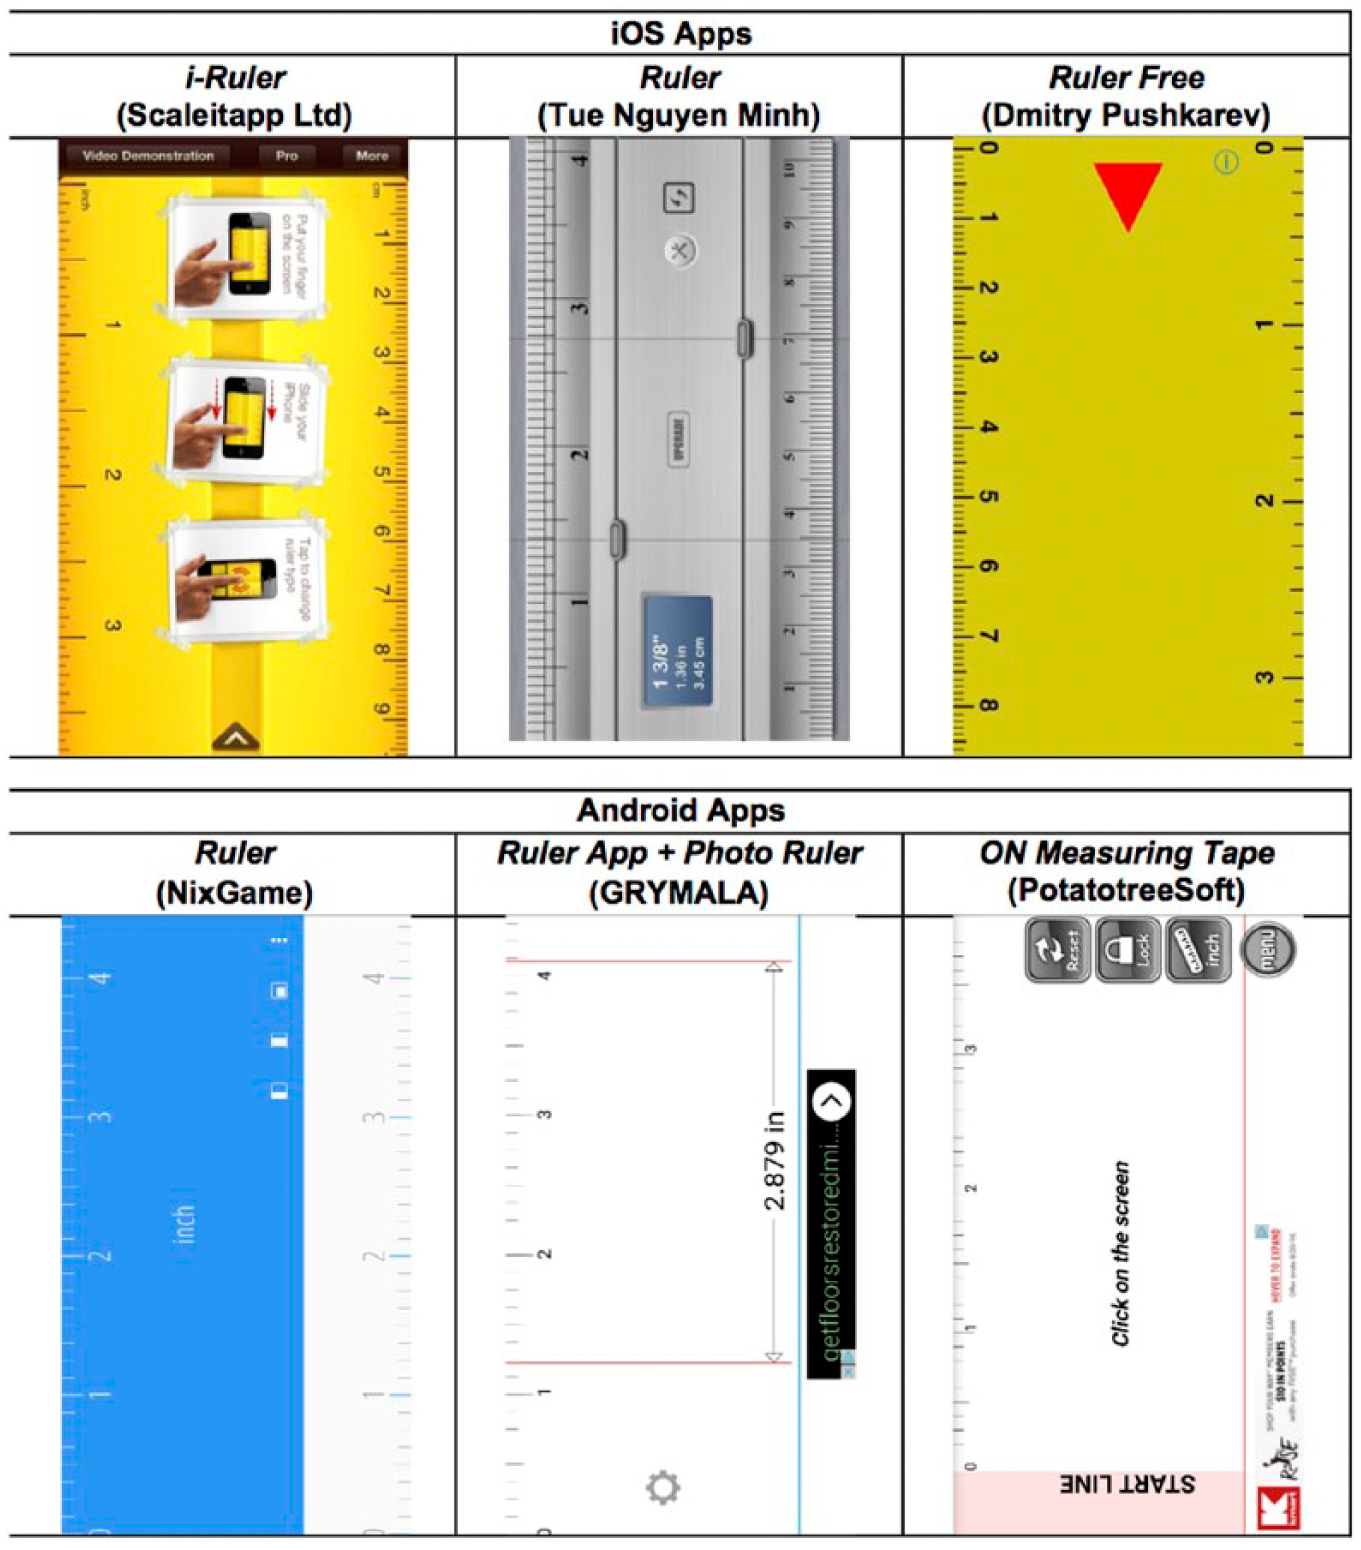
List of Apps Used for On-Screen Ruler Testing, iOS and Android With Screenshots of Their User Interface. For results, refer to Table 4
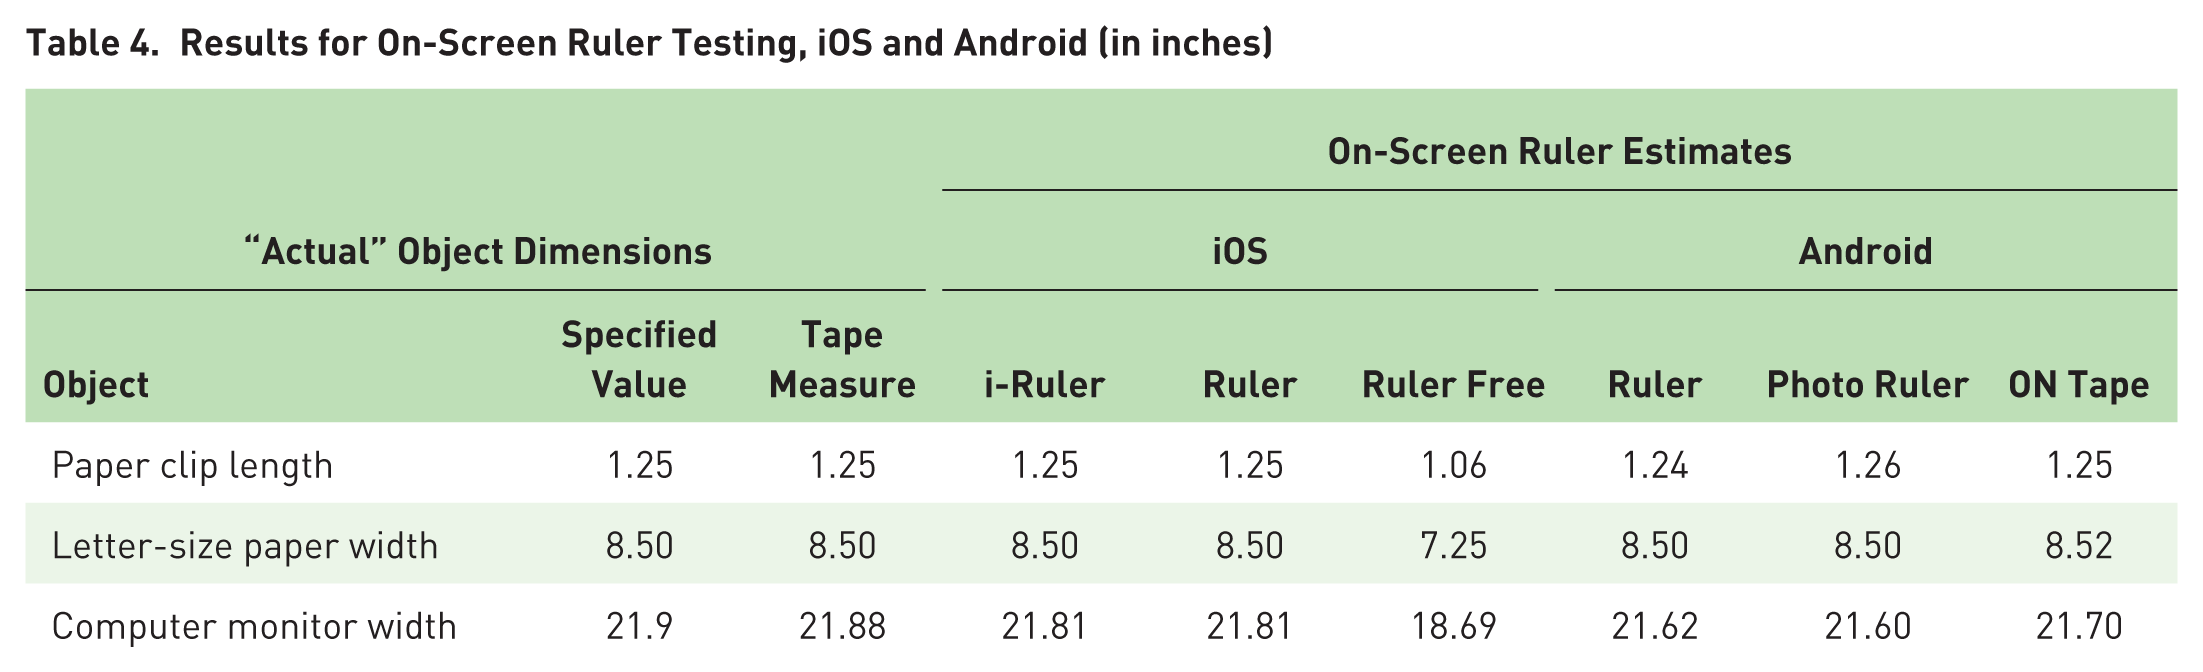
As shown in Table 4, there were almost no differences between the on-screen rulers examined except Ruler Free, which consistently underestimated length by about 15%. Otherwise, measurements were within about 0.5% of the true size, which is likely close to the error of making a measurement with an ordinary wooden or plastic ruler. We found i-Ruler on iOS and ON Tape on Android to be the best apps.
Results for On-Screen Ruler Testing, iOS and Android (in inches)
For photo ruler applications, a credit card is often a useful reference. Per International Organization for Standardization/IEC 7810, a credit card is 3.37 in. wide × 2.125 in. high. Four photo ruler applications were examined, two per operating system (Table 5).
List of Apps Used for Photo Ruler Testing, Android and iOS With Screenshots of Their User Interface. For results, refer to Table 6
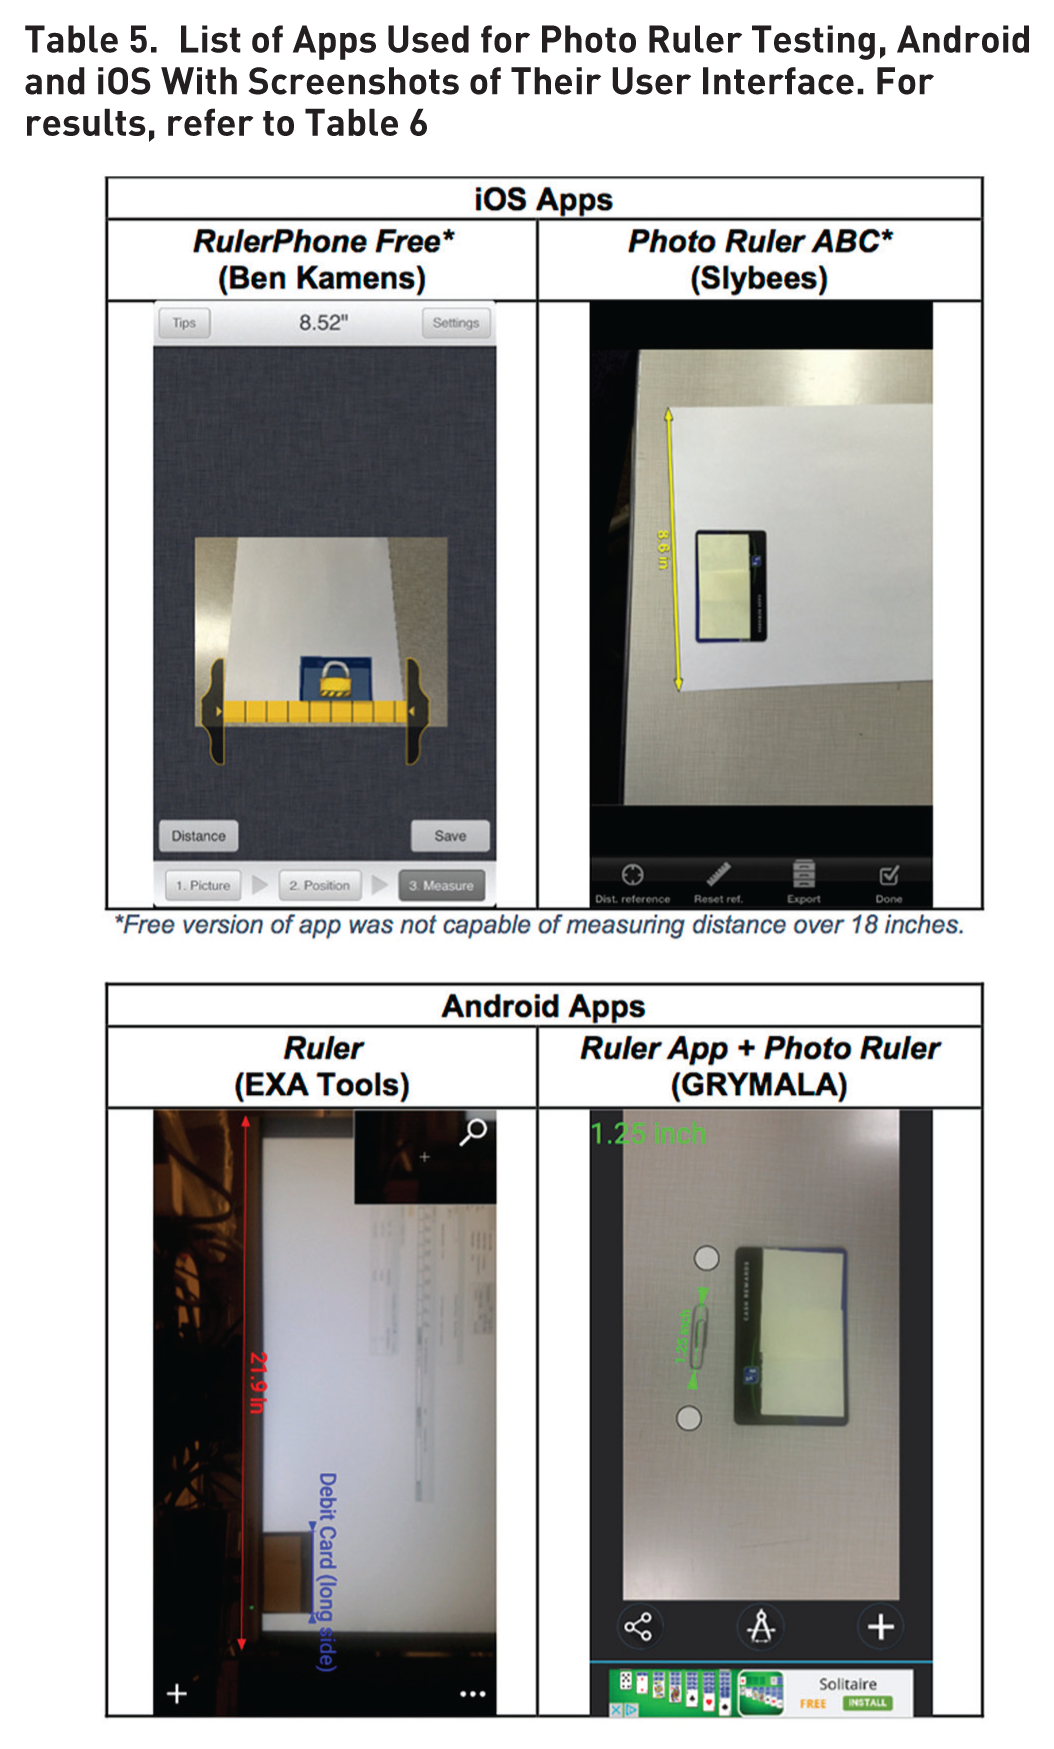
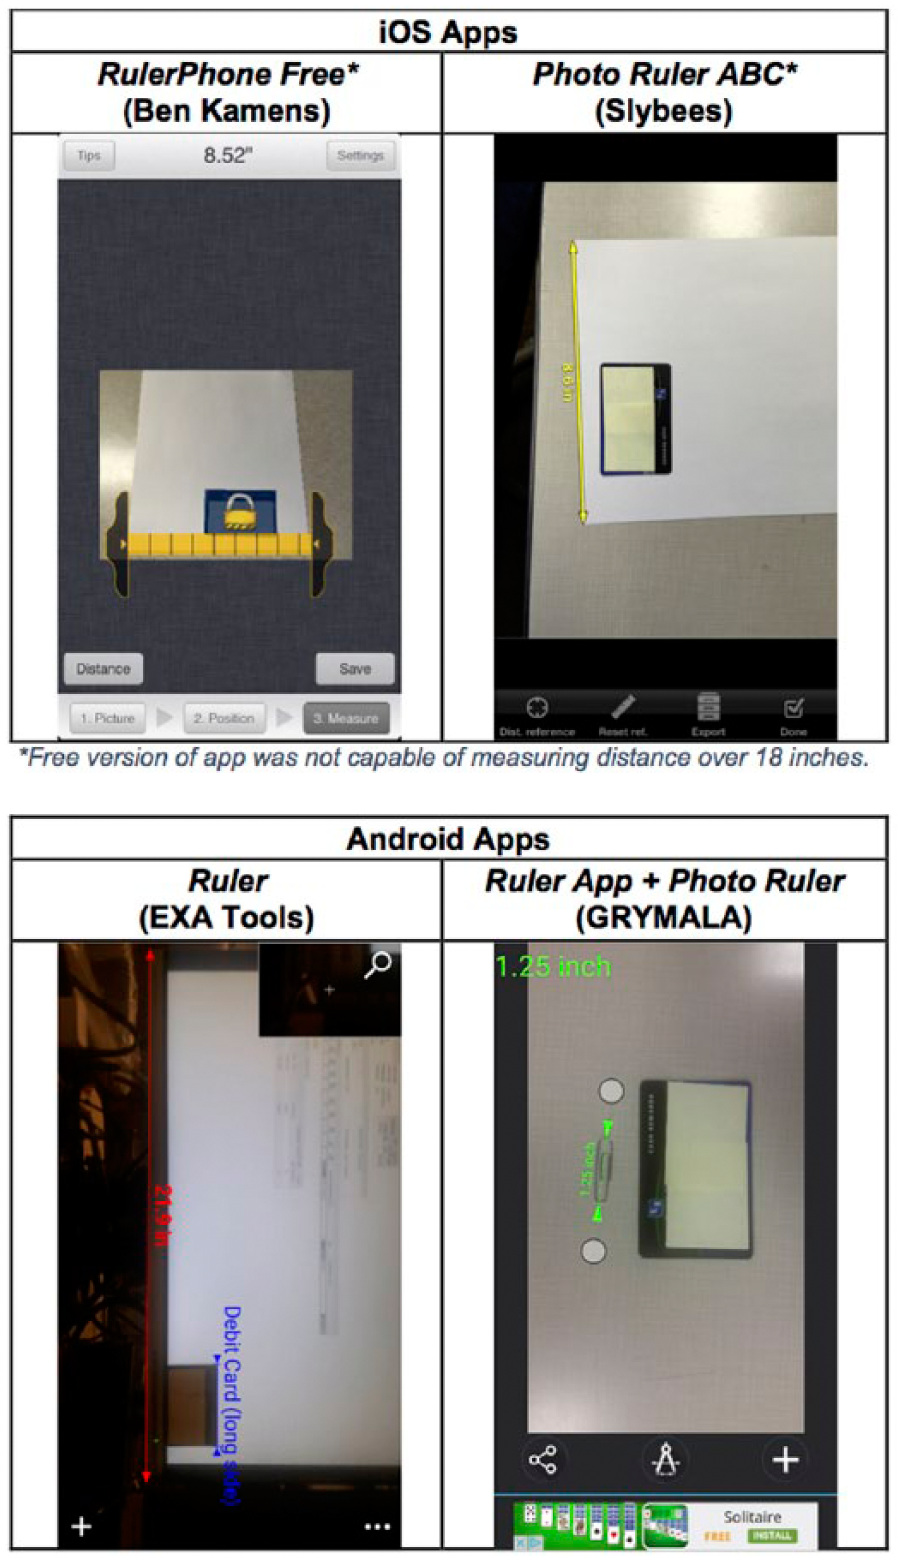
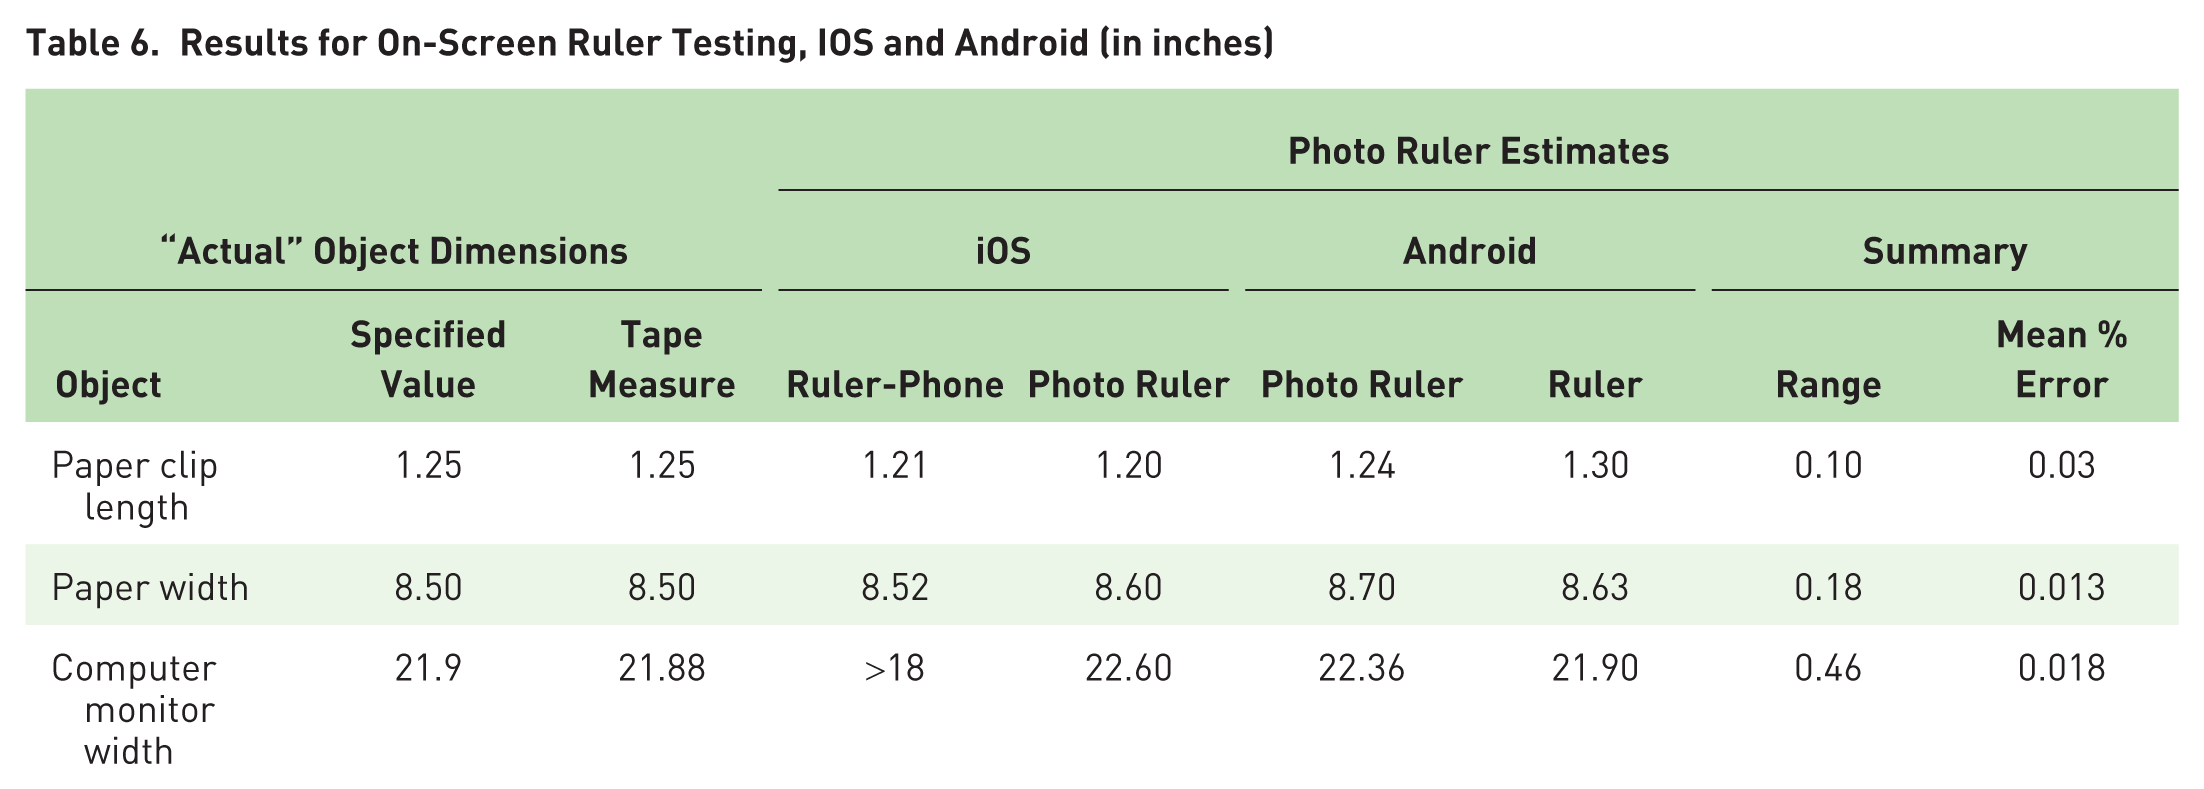
As shown in Table 6, photo ruler application errors were on the order of 2%. In contrast to the on-screen rulers, there was no human judgment in reading the value, although there was human input to the placement of the on-screen markers.
Results for On-Screen Ruler Testing, IOS and Android (in inches)
Other Human Factors Tools
In addition to measurement tools, numerous calculation and data collection tools are available online (Table 7), some of which are included in commercial packages, such as Siemens Jack and Ergoweb’s Job Evaluator Toolbox (personal communication, P. Budnick, July 2016). Readers of Ergonomics in Design are strongly encouraged to add to this list.
There are more calculation tools for physical ergonomics than for cognitive ergonomics. Growth is expected in the number of applications for health monitoring and physiological recording (e.g., heart rate, metabolic energy cost).
Examples of Other Ergonomics Applications

In some situations, human factors engineers may wish to collect vibration data. In our informal forays into this topic, we have not found many useful free applications. However, Vibroscope (Toon, LLC) and VibSensor (Now Instruments and Software) on iOS and Vibrations! (jjbunn) and Accelomate (Nocrapps Techonologies) on Android appear to have useful functionality.
Conclusions
We found no satisfactory applications for lux meters, although photospheres and meter-application-specific corrections may someday provide the desired level of accuracy. However, it is apparent that improvements in external sensors are occurring, and it seems reasonable to assume that adequate sensors will appear in the next few years.
For sound level measurements, we recommend DB Volume for iOS and Sound Meter (Mobile Essentials) for Android, but there are many other suitable free options. In terms of applications that are not free, Kardous and Shaw (2014) found two paid apps to be accurate, SPLnFFT (Fabien Lefebvre) and SoundMeter (Faber Acoustical). For those interested in higher-quality measurements, we have used the Faber SignalScope. This $50 spectrum analyzer app is extremely useful in describing sounds measured. Furthermore, for those who find phone size displays too small, this and many other applications run on tablets of various types (e.g., iPad).
For on-screen rulers, we recommend i-Ruler (Scaleitapp Ltd) for iOS and ON Tape (PotatotreeSoft) for Android. For objects larger than the screen, Photo Ruler (Slybees) for iOS and Photo Ruler (GRYMALA) for Android are recommended, although all applications that we examined provided sufficient accuracy, and there are many other viable options to consider.
Keep in mind that we examined only a subset of the numerous available applications. However, the basic recommendations hold. Generally, iOS apps provided more accurate results, and sound level and distance meter apps provided acceptable results. Measurements from lux meters were inaccurate, but ways to improve them should be considered. Additional evaluations are desired of the effects of directional sources on illumination measures for a variety of applications and the benefits of various photospheres to improve illumination measurement accuracy. Also needed is more information on the role of the spectral composition of the sources − in particular, their color temperature − on measurement accuracy. In addition, data are desired on the use of applications to measure vibration and acceleration. We therefore recommend that human factors specialists add sound level meters (or spectrum analyzers) along with ruler apps to their phones as standard equipment.
Phone technology continues to advance at a rapid pace, and this article will certainly not be the last on this topic. Those wishing to collect data in the future should consider the principles of good measurement listed here.
Include a range of test conditions that are most likely to be explored by practitioners. For lighting, conditions include stairways, general office workplaces, and desktops.
Focus on phones that are most common and that users are most likely to have.
Compare the phone application to a gold standard, such as a high-quality or laboratory-grade meter.
Take repeated measurements and make sure they are collected in a consistent manner by multiple users.
Finally, and most important, we recommend that both users of these applications and researchers examining them go beyond the basic measurements and record spectral data of the lights, sounds, and vibrations they are measuring. Low-cost, reliable applications for these purposes are becoming available. We encourage their use for two reasons. First, there continue to be questions about the accuracy of summary measurements, and that accuracy depends on the spectral composition of the source, for which data are desired. Second, and most important, these measurements are being collected to solve problems, and solving them involves knowing what the source of the problem is, which is identified by examining the spectral data.
We look forward to hearing about the experiences of others when using these applications.
Standards Identification
How the precision and accuacy of devices for measuring sound and light are determined is described in numerous national and international standards, listed below. The organizations responsible for those standards are encouraged to cite this paper to encourage the application of those standards.
American National Standards Institute. (1983). Specification for sound level meters (ANSI S1.4-1983)
American National Standards Institute. (2013). American National Standard practice for office lighting (ANSI/IESNA RP-1-04).
Commission Internationale de l’Eclairage (International Commission on Illumination). (2001). Lighting of work places – Part 1: Indoor (CIE S 008/E: 2001, ISO Standard 8995-1:2002(E)).
Comité Européen de Normalisation (European Committee for Standardization). (2002). Light and lighting – Lighting of work places – Part 1: Indoor work places (EN 12464-1:2002).
Deutsches Institut für Normung (German Institute for Standardization). (2017). Photometry – Part 7: Classification of illuminance meters and luminance meters (DIN 5032-7:2017-02).
European Union. (2003). Directive 2003/10/EC of the European Parliament and of the Council of 6 February 2003 on the minimum health and safety requirements regarding the exposure of workers to the risks arising from physical agents (noise) (EU Directive 2003/10/EC).
International Electrotechnical Commission. (2002). Electroacoustics – Sound level meters – Part 1: Specifications (IEC 61672-1:2002).
Japanese Standards Association. (2006). Illuminance meters – Part 1: General measuring instruments (JIS C1609-1:2006).
Occupational Noise Exposure, 29 C.F.R. §1910.95.
Footnotes
The data collection described in this article was supported by the University of Michigan Department of Integrated System in Design as part of the development of new activities for the Human Factors Engineering Short Course.