
Abstract
Quantifying user behaviors at sit-stand desks is critical to understanding the efficacy of these workstations to reduce exposures to prolonged sitting or standing. A custom after-market desk-mounted sensor predicting sit-stand desk use by measuring desk floor heights, desk user distances, and the temperature in front of the desk was tested. The authors performed sensor component testing, a survey of desk height ranges, and a logistic model to estimate gross posture and user presence with a 95.6% accuracy rate. This approach can aid researchers and ergonomists in understanding sit-stand desk use in the field, with the end goal of reducing sedentary work activities.
Keywords
Workplaces are becoming increasingly sedentary (Yang et al., 2016). Workers exposed to prolonged sitting have an increased incidence of musculoskeletal disorders (Waters & Dick, 2015; Zemp et al., 2016), and those exposed to prolonged standing have an increased risk of cardiovascular disorders (Smith et al., 2018). Other negative outcomes linked to sedentary behavior in the workplace include an increase in lost time, disability rates, and mortality rates (Buckley et al., 2015; Ekelund et al., 2016). Interventions to reduce sedentary activities at work range from worker training (Shrestha et al., 2016) to structured physical activity interventions (Lusa et al., 2020) to overhauling urbanized infrastructure (Capon, 2007), but a common intervention is a sit-stand desk. Sit-stand desks offer the worker the ability to alternate between seated and standing work, using postural variability to combat the negative effect of prolonged sitting (Buckley et al., 2015) and prolonged standing (Rempel & Krause, 2018). Unsurprisingly, successful sit-stand desk interventions rely on users regularly switching between sitting and standing postures (Bao & Lin, 2018; Diaz et al., 2019; Karol & Robertson, 2015; Venema et al., 2017). Since sit-stand desks can be a large investment for workplaces, it is useful to determine if users are effectively transitioning between standing and seated postures to mitigate the risks associated with sedentary work. Additionally, access to feedback on sit-stand desk usage may encourage users to change postures throughout the day. Last, measuring desk-use history may inform desk design or supplemental smart technology to facilitate appropriate use. Therefore, we propose a solution to provide a tool to help researchers and ergonomists unobtrusively quantify sit-stand desk behaviors to inform decision making and sit-stand desk design.
Tracking sit-stand desk behaviors—determining when those using the desk are standing or seated—may be desk-centric or user-centric, with user-centric methods being more common. Previous studies used self-reported measures (Graves et al., 2015; Venema et al., 2017) and accelerometer data (Coenen et al., 2017; McCrady & Levine 2009) to track whether users are seated or standing. While self-report metrics are inexpensive, they can be incomplete or (unintentionally) incorrect (Donaldson & Grant-Vallone, 2002). Accelerometers and similar products are purchased separately from the desk, and often placed on the thigh to infer behaviors indirectly (Kozey-Keadle et al., 2011). These techniques can be accurate when applied carefully, but can be limited by poor adherence if users need to take the accelerometer on and off each day. User-centric products that circumvent this limitation through a waterproof strap (Johnston et al., 2019) are still unable to discriminate if a user is sitting or standing at or away from their desk.
An alternative to these user-centric measures of sit-stand desk usage is to mount sensors on the desk itself. If feasible, the concept of an after-market sensor could allow these groups to flexibly investigate sit-stand desk behaviors in their practice or research program. Existing products produced by office furniture manufacturers communicate with the worker and can operate some sit-stand desk motors; their main purpose being to encourage transitions between sitting and standing at regular intervals (Sharma et al., 2019). However, most of these products are built into their motorized sit-stand desks and are currently barred from researchers, ergonomists, or small business owners who cannot afford a specialized desk. Additionally, there is a lack of published detail on how these built-in sensors are developed, tested, and validated. Our purpose was to construct and test an affordable sensor made from readily accessible components that can automatically detect whether a user is standing, seated, or absent from a sit-stand desk suitable for independent researchers or ergonomists. Manufacturers would also find benefit in incorporating these sensors into desk design for a built-in feedback system for users. Our methodology includes validating each component, conducting a survey of preferred desk heights to define testing parameters, and providing criterion validity for the sensor against novel conditions.
Method
Sensor Construction and Use
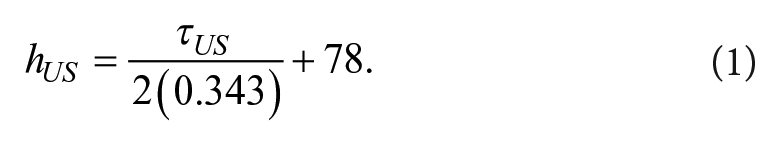
Our sensor consisted of three sensing components and an integrator, connected to a laptop through USB (universal serial bus; Figure 1A). The sensing components were an ultrasonic distance sensor to measure the desk height (HC-SR04, Elegoo Industries, Shenzhen, China), an infrared distance sensor to measure the user-desk distance (GP2Y0A02YK0F, Sharp Electronics, Osaka, Japan), and an infrared temperature sensor to discriminate the user from other furniture near the desk (IRTemp 54, Freetronics Pty Ltd, Maroondah, Australia). We used two different distance sensor types because the ultrasonic sensor interacted poorly with clothing, while the infrared distance sensor interacted poorly with tile floors. The three components interfaced with an Arduino Uno R3 (Arduino LLC, Turin, Italy) that performed computations and integrated the sensing components to predict if the desk user was sitting, standing, or away from the desk. The Arduino has a 20-pin bread board, an on-board 10-bit analog to digital (A/D) conversion platform, 31.5 kilobyte (KB) of storage and 2 KB of random access memory (RAM) to implement simple code autonomously. We mounted all parts in a rectangular foam-core housing that could be affixed to the underside of commercially available sit-stand desks (dimensions: 135 mm by 138 mm by 78 mm; Figure 1B). The Arduino was connected to a laptop computer through a serial USB port, which a Python script equipped with the pySerial package (Liechti, 2011) that sampled data at approximately 2 Hz. All incoming samples were time-stamped to allow accurate time-varying analysis where applicable.
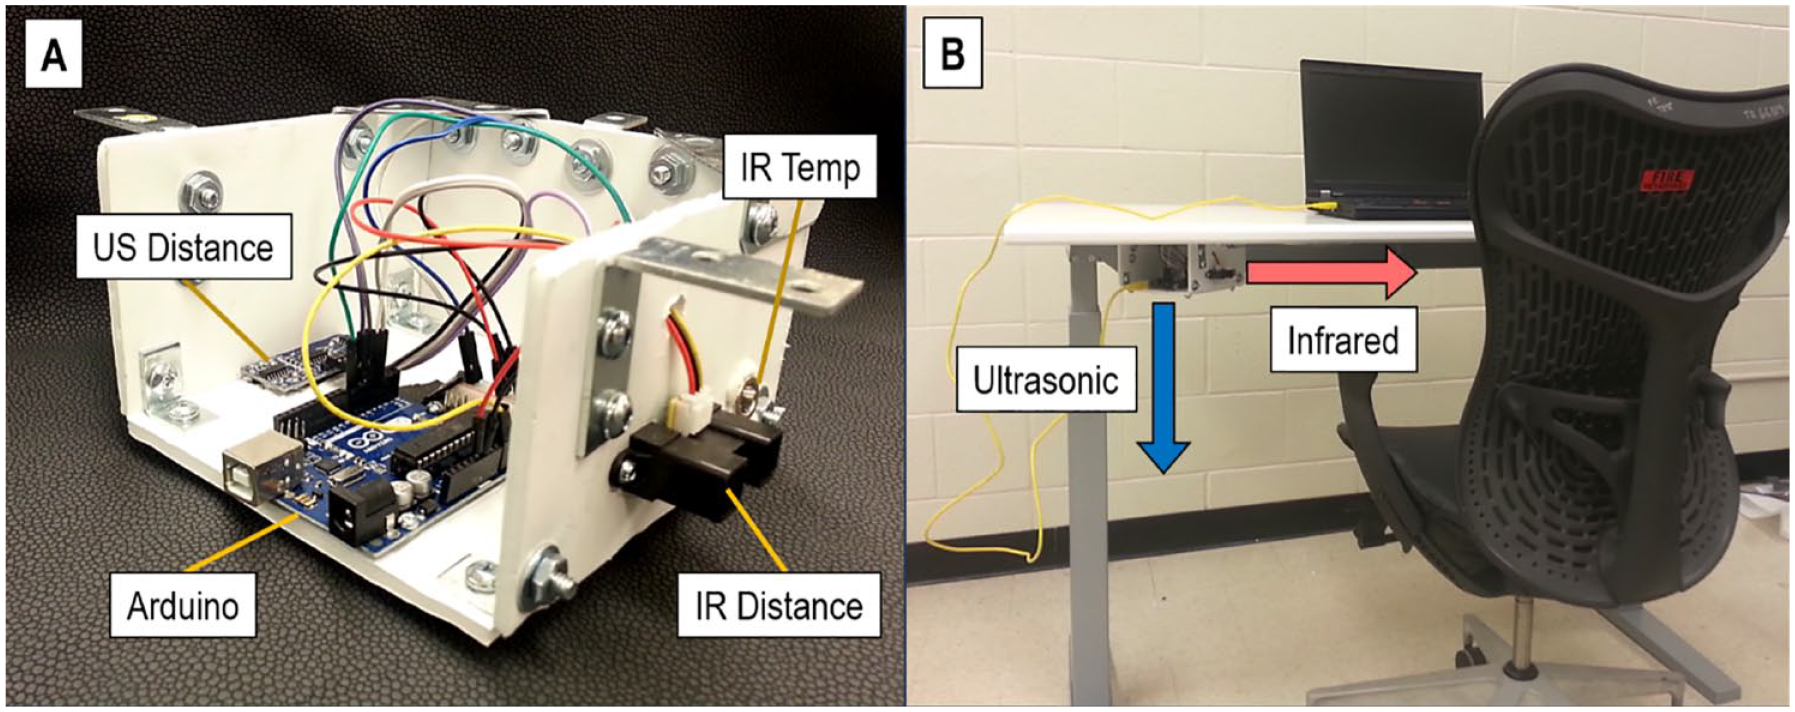
The sensor used in the present study. Panel A depicts relative positioning of components in the housing; Panel B depicts mounting to sit-stand desk underside relative to the user.
We ordered all electronic components through an online distributor and purchased housing components from a local hardware store: The total materials cost was US$56.62.
The ultrasonic sensor emitted a sound pulse that reflected off the floor and measured the time delay between the pulse emission and its return in microseconds, τus. Assuming a constant sound speed of 0.343 mm/µs, this information could be used to estimate the height of the desk relative to the ground, hus (Equation 1).
The 2 in the denominator accounts for the time taken for the ultrasonic pulse to reach the floor and return; the offset of 78 mm accounts for the height of the sensor.
The infrared distance sensor was aimed toward the user, measuring the horizontal distance between the sensor and the user. We developed a calibration curve (Equation 2) to convert the sensor’s A/D unit outputs into distances where xir is the raw output of the sensor and dir is the distance in mm corresponding to the raw input. The constants in Equation 2 are specific to the Arduino Uno R3’s a 10-bit A/D conversion software.
The infrared temperature sensor was also aimed at the user and measured the mean temperature in a one-radian solid angle within one metre of the sensor. We included the temperature sensor to discriminate between a person and other office furniture that may be placed in front of the desk such as a chair. An open-source module accessed from the manufacturer’s website (www.freetronics.com/irtemp) providing the “GetIRTemperature” function to return temperatures in °C.
Both the circuit diagram and code uploaded to the Arduino are provided in the Supplemental Material, available in the online version of this journal.
We performed an 8-hour drift test on each component to ensure its reading remained stable over time. A component drifted if we could fit a linear, exponential, or second-order polynomial function to sensor measurements.
Determining Appropriate Desk Heights to Validate the Sensor Against
In order to determine appropriate desk heights to test our sensor’s classification algorithm, we surveyed 72 participants (38 female, 34 male) to determine the range of preferred desk heights among a North American user sample. We recruited participants from a well-travelled foyer on the university campus for 8 hours during a weekday. We asked participants to perform a dexterous manual task (Perfection, Hasbro Inc., Providence, RI) for 60 seconds while standing and sitting at the height adjustable desk depicted in Figure 1B (Livello, Teknion, Toronto, Ontario, Canada). A trained experimenter helped each participant adjust the desk height in accordance to the Canadian Standards Association (CSA) guideline desk heights (CSA, 2000) allowing for slight changes based on user preference and then measured using a tape measure. The order of sitting and standing alternated between successive participants. This study was approved by an ethics review committee at the university, and all participants gave their written informed consent to participate.
Sit-Stand Desk Behavior Classification and Cross-Validation
We simulated the full range of sitting and standing desk heights from the survey using the same sit-stand desk in a laboratory environment. These data determined how accurately our sensor could detect if the user was standing at, sitting at, or away from the desk. Thirty samples were taken from the 1st and 99th percentiles of the standing and sitting desk height distributions; the desk height was set using an optoelectronic motion capture system (Optotrak Certus, Northern Digital Inc., Waterloo, Ontario, Canada). Forty of the 60 trials involved a single male participant (26 years, 1.75 m, 90 kg) simulating office work at the desk. For the other 20 trials, the participant stood at least 1 metre away from the desk outside of the thermal and infrared sensor’s field of view. Therefore, there were 20 trials with the user standing at the desk, 20 trials with the user sitting at the desk, and 20 trials with the user away from the desk equally split between standing and sitting desk heights. We recorded 5-second trials at each desk and user configuration in a random order. Mean readings from each sensor over the 5-second length of each trial were used for condition classification.
We performed a multinomial logistic regression to classify the three conditions (Stand/Sit/Away) and assessed its accuracy through fivefold cross-validation (Rodríguez et al., 2010). We split our data into five equal-sized folds where four folds (48 of 60 trials) were randomly selected to use as a training set; the remaining fold (12 of 60 trials) was used as a test data set to assess the regression’s accuracy. This process was repeated 1,000 times using bootstrap sampling to derive confidence intervals (CIs) for condition prediction. In addition to determining the percentage of testfold data matching the model predictions (agreement), we computed the accuracy, sensitivity, and specificity of each iteration of cross validation. All statistics were performed in RStudio (Version 1.0.143, RStudio Inc., Boston, MA) using the MASS and nnet packages (Venables & Ripley, 2002), with alpha levels of .05 where applicable.
To determine if our sensor was accurate enough, we compared the accuracy of all conditions from the fivefold cross-validation procedure to a threshold accuracy of 82.5%. This threshold represents the ability to correctly classify a single minute of data given 12 classifications a minute and seven correct classifications required to correctly classify that minute. If a single instance of any given condition could be classified correctly with 82.5% accuracy, this would give a 99% chance of our sensor correctly classifying any given minute of data. One minute was selected as the temporal resolution from previous work assessing transitions between standing and sitting (Bao & Lin, 2018; Riddell & Callaghan, 2017). The full derivation of this threshold is included as online Supplemental Material.
Results
Component Drift
The infrared temperature sensor showed small linear drift more than 8 hours (0.2 °C per hour; p < .05 for a linear fit), but the other components were stable over testing period. The standard deviations for each sensor—an indicator for the inherent noise in each component—from the drift test were 2.1 mm (ultrasonic height), 58.4 mm (infrared distance), and 2.0 °C (infrared temperature).
Desk Height Distributions
The survey results indicated no overlap between sitting and standing heights for both sexes (Figure 2). Participant stature and preferred standing desk height were strongly correlated; however, this relationship was weaker between stature and sitting desk heights and was not affected by participant sex (Table 1). Some participants desired a sitting height below the minimum desk height of 700 mm, seen in the rightward skew of the sitting distributions in Figure 2.
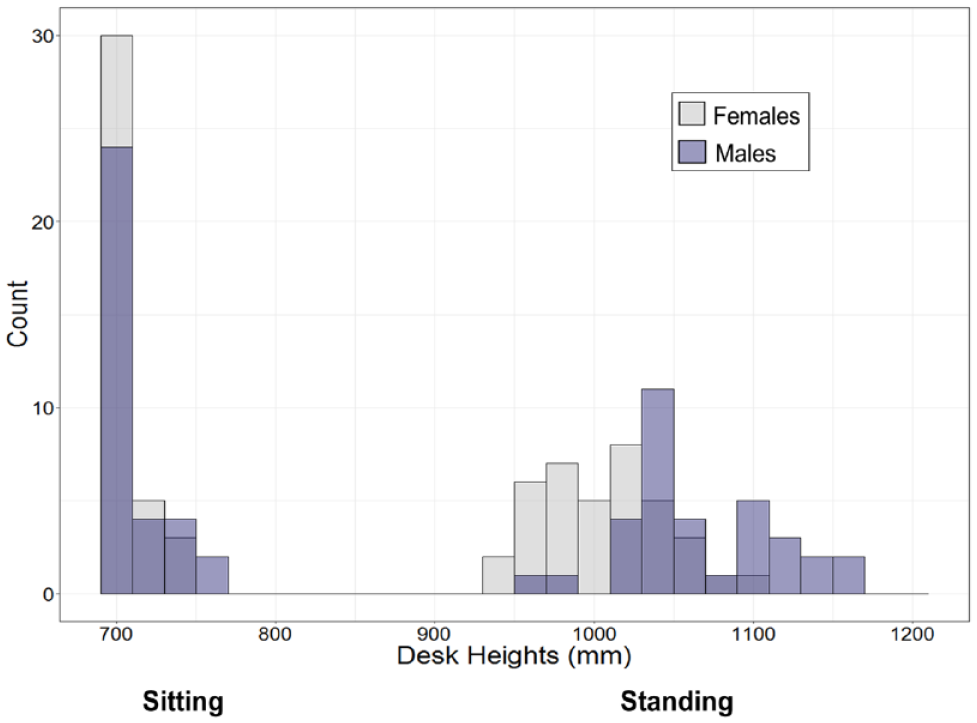
Histogram of standing (right) and sitting (left) desk heights separated by sex. The right skew of both male and female sitting distributions reflects the sit-stand desk used having a minimum height of 700 mm.
Prediction of Desk Heights From Stature
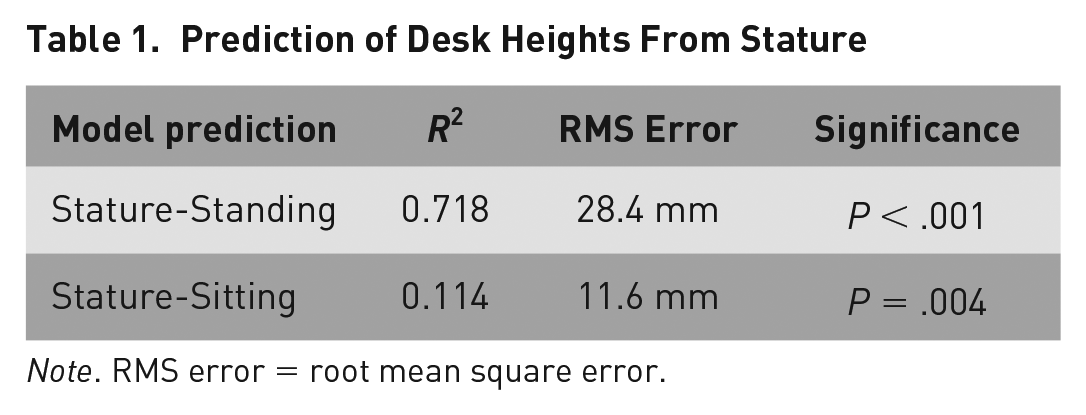
Note. RMS error = root mean square error.
Behavior Classification and Cross-Validation
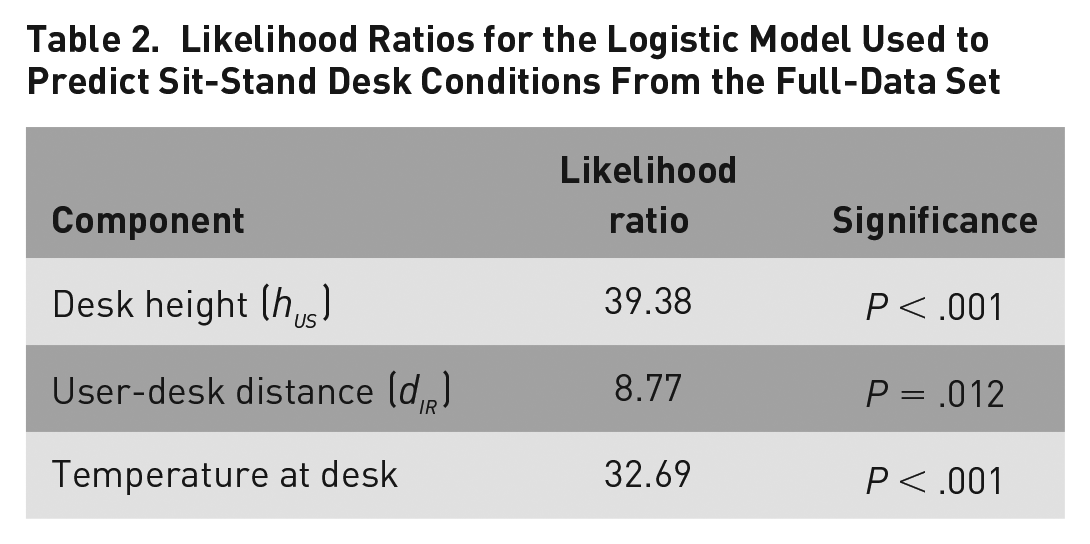
Our logistic model could correctly classify the full data set, with all three sensors being significant predictors of condition (Figure 3), although the ultrasonic height hus and temperature at the desk were stronger predictors than the distance between the desk and the user dir (Table 2). The bootstrapping cross-validation procedure determined our sensor had an overall agreement of 94.1% (95% CI [93.9%, 94.3%]). The sensitivity, specificity and accuracy of the sensor when classifying novel conditions were also high (95% CI [92.8%, 97.4%]), with the Stand and Away conditions having slightly higher error rates than the Sit condition (Table 3). All accuracy values surpassed our 82.5% threshold for a correctly classified minute; our sensor would erroneously classify 1 minute every 187,751 minutes given a minimum classification accuracy of 95.6% (95% CI [95.3, 96.0%]; 1 erroneous minute every 128,425 to 325,615 minutes) for a single user (Table 3).

Sensor component outputs and logistic model classification from the cross-validation study. The shapes indicate the model-predicted conditions when using the full data set; all conditions could be correctly sorted when the full data set was used to develop the logistic regression.
Likelihood Ratios for the Logistic Model Used to Predict Sit-Stand Desk Conditions From the Full-Data Set
Accuracy, Sensitivity, and Specificity of Condition Estimates From the Bootstrapping Validation
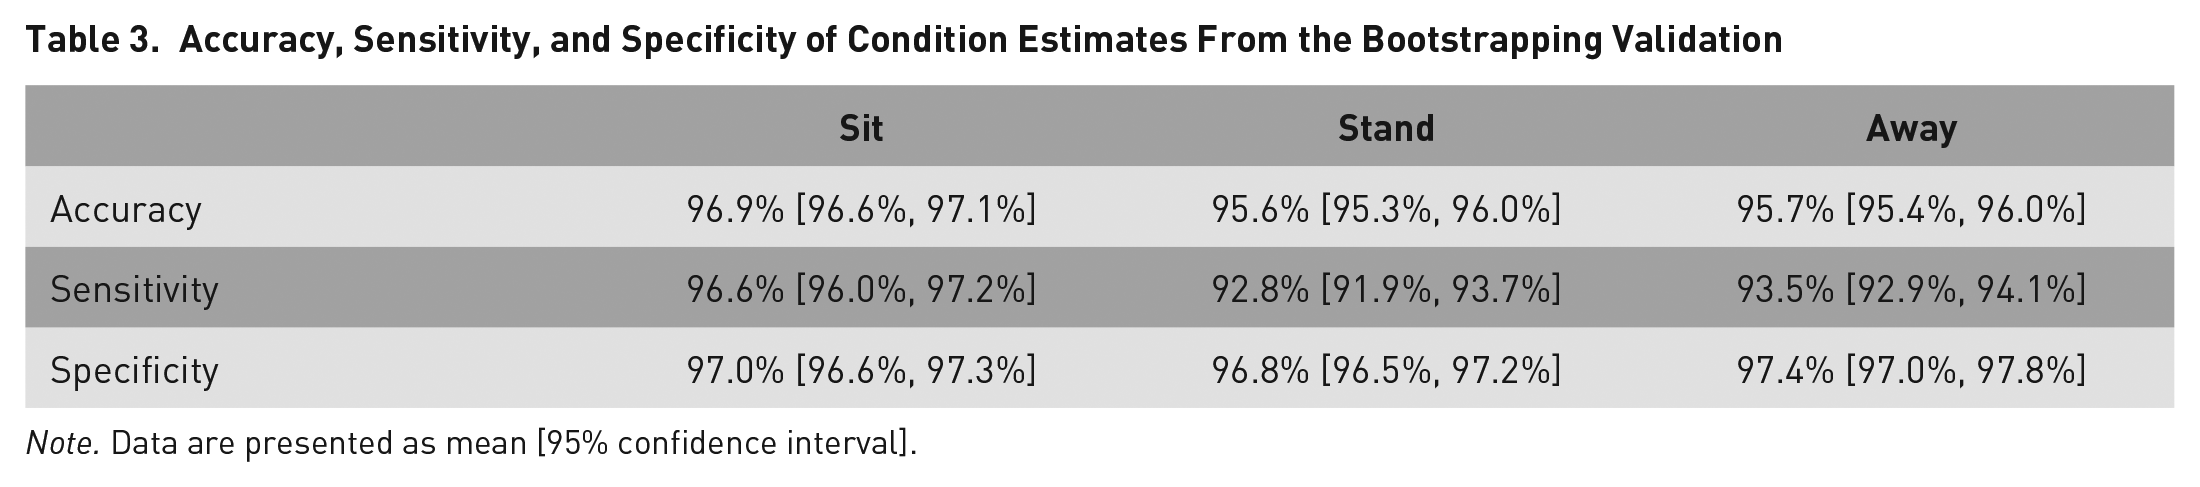
Note. Data are presented as mean [95% confidence interval].
Discussion
We show that the combination of accessible distance and temperature sensors mounted under a desk can provide sufficient information to classify sit-stand behaviors of a single subject in controlled settings. This work is the first step in providing a foundation for other researchers or practitioners to use these tools in field studies or workplace assessments. The sensor is not at a stage where it is ready for commercialization; our target audience excludes business management at the moment. However, manufacturers looking to implement these measures into their sit-stand desk can combine this information with monitor use history (Sharma et al., 2019) to produce more robust behavior-tracking algorithms at a marginal cost increase relative to the price of a sit-stand desk. From a design perspective, our two key takeaways for those trying to build their own cost-effective desk-mounted sensor are (1) desk height strongly predicts user behavior at a sit-stand desk and (2) the combination of localized temperature and proximity sensors can reliably discern user presence without any external inputs from the user.
The reliability of other groups using accelerometer-based measures ranges between 78.4% and 97.2% using comparable criteria to our bootstrapping cross-validation technique (Johnston et al., 2019; Kozey-Keadle et al., 2011; Lemaire et al., 2015). Our reported agreement, accuracy, sensitivity, and specificity are in the upper end of this range while having the benefit of being unobtrusive and not encumbering the user. Our reported accuracy also surpasses our 82.5% threshold needed to correctly classify a minute of data 99% of the time.
Our setup could better discriminate sitting and standing desk heights than determine if the users were or were not at the desk. This is likely because the highest seated desk height was much lower than the lowest standing desk height, the ultrasonic sensor was more stable than the thermal sensor, and the laboratory testing environment had tiled floors. Although the stability of the sound speed of air and desk height distributions are likely to remain consistent between workplaces, our findings are limited to workplaces with hardwood, tiled, concrete, thin carpet, or similarly minimal-echo absorbent flooring. Additionally, our pilot survey revealed that many users preferred desk heights lower than the minimum attainable desk height of 700 mm; however, minimum height recommendations for sit-stand workstations are lower than this (CSA, 2000). Additionally, users may choose to vary their desk height within a sitting or standing posture; our pilot survey data indicate that this would likely not affect the ability to separate the two postures since there is a 180 mm gap between the highest sitting height (760 mm) and the lowest standing height (940 mm) from our pilot study (Figure 2). We show here through our survey and validation studies that discriminating user posture on the basis of desk height is a reliable and robust measurement option. Existing motorized sit-stand desks likely have this information readily available for manufacturers to incorporate into software aimed at user feedback or user posture estimation.
The logistic regression favoured the temperature sensor when predicting user-presence. One potential reason for the low predictive ability of the infrared sensor could be interactions with the desk chair. We purposefully did not provide any instruction to move the chair away from the sit-stand desk during the Away conditions in order to mimic workplace chair-desk behaviors. Our participant tended to tuck the chair into the desk for every Away condition at standing desk heights; the sitting desk heights prevented the chair from being tucked under the desk (Figure 3). For discriminating user presence using a distance measure, this represents a worst-case scenario, since the tucked in chair was a similar distance to the sensor as the user would have been. There was also substantially greater noise in the infrared sensor compared to the other two components, although the 5-second averages used in the laboratory study aided in reducing this noise. A windowing average technique would limit the temporal resolution to detect changes in desk height or user-presence in field applications. A 5-second resolution (0.2 Hz) is orders of magnitude above the Nyquist frequency of gross posture changes over the workday: approximately seven to eight transitions per workday (~0.25 mHz; Bao & Lin, 2018; Riddell & Callaghan, 2017), making a 5-second window averaging approach feasible real-time approach to maintain prediction accuracy.
Environmental factors may affect the accuracy of the temperature sensor to discriminate user presence. One factor is the location of the thermal sensor relative to the underside of the desk. Since the temperature sensor volume has a conical projection, the upper surface of that cone contains the bottom surface of the desk table in our desk-sensor configuration. This effectively limits the volume of the cone that could contain the user, decreasing the signal to noise ratio. Lowering the temperature sensor away from the underside of the desk or bringing it closer to the user could increase the proportion sensing area occupied by the user, potentially increasing its accuracy. Also, males have higher surface body temperatures than females, with this difference having been reported to be correlated with sex differences in subcutaneous fat (Neves et al., 2017). However, our sensor detects clothing-surface body temperatures, which are 7 °C to 10 °C cooler than skin body temperatures (Potter et al., 2017). The ambient temperature in the laboratory study was climate controlled to 21 °C, similar to Western workplaces with sit-stand desks (Capon, 2007) and 2 °C to 8 °C cooler than typical clothing-surface temperatures (Potter et al., 2017). The temperature sensor could measure the ambient temperature and the projected conical volume temperature simultaneously to possibly correct for warmer working environments. However, we found the ambient temperature had large nonlinear drift due to the its proximity to the Arduino and was excluded from the logistic regression.
Conclusions
We constructed and tested a desk-mounted sensor that can predict sit-stand desk configurations with an estimated 94% agreement for an exemplar subject, comparable or better than more encumbering direct-measurement approaches (Kozey-Keadle et al., 2011; Lemaire et al., 2015). Obtaining this estimate required documenting a wide range sitting and standing desk heights, prompting our pilot survey. The controlled environmental factors and the nonoverlapping distributions of sitting and standing desk heights were the main contributors to this high prediction rate. A sensor similar to this is useful for field interventions or assessments, and the technology could be incorporated into sit-stand desk design.
Supplemental Material
Supplemental_Data – Supplemental material for Measurement of Sit-Stand Desk Usage by Desk-Mounted Sensors
Supplemental material, Supplemental_Data for Measurement of Sit-Stand Desk Usage by Desk-Mounted Sensors by Daniel Viggiani, Jeffery M. Barrett, Eric Will and Jack P. Callaghan in Ergonomics in Design: The Quarterly of Human Factors Applications
Footnotes
References
Supplementary Material
Please find the following supplemental material available below.
For Open Access articles published under a Creative Commons License, all supplemental material carries the same license as the article it is associated with.
For non-Open Access articles published, all supplemental material carries a non-exclusive license, and permission requests for re-use of supplemental material or any part of supplemental material shall be sent directly to the copyright owner as specified in the copyright notice associated with the article.