
Abstract
Women’s political representation exhibits substantial cross-national variation. While mechanisms shaping these variations are well understood for Western democracies, there is little consensus on how these same factors operate in less developed countries. Effects of two political institutions—electoral systems and gender quotas—are tested across 168 countries from 1992 to 2010. Findings indicate that key causal factors interact with a country’s socioeconomic development, shifting their importance and possibly even direction at various development thresholds. Generalizing broadly across countries, therefore, does not adequately represent the effects of these political institutions. Rather, different institutional changes are advised to increase women’s presence in national governments.
Women have secured the legal rights needed to participate in politics in all but a handful of countries; however, their representation in national politics lags far behind their proportion in society. In mid-2011 women held 19.6 percent of single/lower house parliamentary seats internationally, 23 of the 189 highest ranking United Nations diplomatic posts, and just 14 women held elected posts as heads of state. The circumstance in many countries has mirrored the slow progression of women’s parliamentary representation globally (12 percent in 1985, 16.4 percent in 2005). From 1992 to 2011, women’s parliamentary representation in Brazil increased from 7.4 to 8.6 percent, in India from 6.9 to 10.8 percent, in Russia from 8.7 to 14 percent, and in the United States from 11 percent to a scarcely more impressive 16.8 percent. On the other hand, countries such as Argentina, Costa Rica, Tanzania, and South Africa have seen women’s parliamentary representation nearly triple over the last two decades. In fact, Rwanda’s 2008 parliamentary elections resulted in the world’s first national legislative body with a female majority (56.3 percent). While women’s political advancement outside the industrialized world has accelerated in recent years, research either has been limited to Western democracies or has presented contradictory conclusions regarding how key causal mechanisms operate in the context of less developed countries.
A rich tradition of scholars have analyzed political, socioeconomic, and cultural factors to explain the substantial cross-national variations in women’s representation, generally finding that level of development does not play a significant role in these explanations. This makes sense if you consider that, as of early 2012, Rwanda, Cuba, Seychelles, South Africa, and Nicaragua ranked among the top ten countries by percentage of women in lower/single houses of parliament, while women in countries such as Britain, France, the United States, and Japan occupied relatively low proportions of parliamentary seats (ranking 54th, 70th, 78th, and 106th respectively). I argue, however, that level of development- when measured using economic and social proxies- interacts with key causal variables, shifting their importance and possibly even direction once a given level is reached. In 1998 Richard Matland introduced the concept of a development threshold, a minimum level of development that is required in order for the mechanisms found to be important by previous researchers to positively affect women’s political representation. To test Matland’s hypothesis I highlight two political variables—electoral systems and national gender quotas. In-depth examination of these variables offers particular significance because, as political institutions, they are more easily manipulated than ideological or socioeconomic factors to achieve the goal of gender parity in national politics. Results support Matland’s basic insight of a development threshold, indicating that broad cross-national generalizations fail to adequately represent the effects of these political institutions.
I assemble an original cross-national time-series data set for 168 countries from 1992 to 2010. Although I build models that comprehensively analyze cross-national variations in women’s political representation, this is not my primary goal. Instead, I provide rigorous empirical evidence to support Matland’s hypothesis of a development threshold, revealing how the causal processes of particular political institutions vary across countries depending on their level of socioeconomic development. I demonstrate this in two ways. First, I replicate aspects of previous studies, but focus considerable attention on the ways in which electoral systems and national quotas differ by including interaction terms with level of development. Subsequently, I treat development as a scope condition, where countries are analyzed separately according to level of socioeconomic development. I conclude by arguing that, while most women in politics researchers have generalized their findings across entire populations of countries, the same mechanisms that increase the percentage of women in parliaments in developed countries do not have an equivalent effect in less developed countries and vice versa. This empirical analysis provides evidence to suggest that the majority of existing models need to be reframed to account for the heterogeneity introduced by level of development. By presenting novel analysis from an original data set, I am also able to engage the contradictory findings of the few studies that specifically examine the causal mechanisms of women’s political representation in less developed countries.
The political advancement of women has broader implications beyond the formal significance of justice and equality. Achieving gender balance in national governments can measurably improve the quality of policy making, both in relation to women’s specific needs and to the policy-making process more generally (Carroll 2001; Celis et al. 2008; Dahlerup 2010; Lovenduski and Norris 2004; Phillips 1995; Tolleson-Rinehart 2001). Women’s political visibility is also theorized to have a symbolic effect, potentially increasing women’s status and reducing societal gender inequalities more broadly (Hughes 2009; Paxton 1997; Paxton and Hughes 2007). In fact, some scholars argue that gender parity in politics is among the most important changes required to produce a system of gender equality in society (Chafetz 1990; Moore and Shackman 1996). Given these considerable implications, it is important to ask which, if any, institutional mechanisms support increases in women’s national political representation.
Political Institutions across Development Thresholds
Research examining cross-national variations in women’s political representation has proliferated over the past few decades (Hughes 2009; Kenworthy and Malami 1999; Krook 2010; Matland 1998; Moore and Shackman 1996; Paxton 1997; Paxton and Hughes 2007; Paxton and Kunovich 2003, 2005; Reynolds 1999; Rule 1987; Viterna, Fallon, and Beckfield 2008). However, with a few important exceptions (Hughes 2009; Kenworthy and Malami 1999; Krook 2010; Matland 1998; Viterna, Fallon, and Beckfield 2008), quantitative results rarely differentiate between mechanisms at play across levels of development. In fact, despite their universalizing assertions, statistical results can suffer from regional biases (often privileging Western democracies) rather than describing global trends (Krook 2010). Consequently, while the mechanisms shaping women’s representation in Western, industrialized countries are generally agreed upon, there is little consensus regarding how these same factors operate in the context of less developed countries (Hughes 2009; Krook 2010). Below, I consider what we do and do not know about the impact of key causal mechanisms across development thresholds.
Women’s Political Representation: Does Development Matter?
Cross-national analytic models have produced disparate and oftentimes contradicting conclusions when applied to less developed countries (Hughes 2009). Socioeconomic development affects resource availability and personal opportunities and directly affects a population’s well-being. Many believe that as the standard of living improves, women’s roles revolve less around tasks necessary for daily survival (i.e., collecting water), which enables greater independence and involvement in the public sphere (Krook 2010; Paxton and Kunovich 2005). As such, a developed economy can create more opportunities for women to acquire the qualifications needed to serve in top government posts. Conversely, others argue that women tend to enter politics during times of crisis, so that as economic distress becomes more severe women get involved in politics to advocate for changes that will ameliorate their immediate situations (Del Campo 2005). Clearly, that Rwanda and Sweden rank 1st and 2nd in women’s parliamentary representation, respectively, suggests that one cannot assume that women do better in Western, industrialized nations, nor is it reasonable to suppose that the factors aiding women in Sweden are the same as those advancing women in Rwanda.
Previous researchers generally use per capita GDP or energy use as proxies for a country’s level of development and find no direct, linear relationship to the percentage of women in parliament (Hughes 2009; Kenworthy and Malami 1999; Moore and Shackman 1996; Oakes and Almquist 1992; Paxton 1997; Viterna, Fallon, and Beckfield 2008). This makes sense if one considers that some industrialized countries, such as the United States and France, have relatively low female representation, while women in some poorer countries, such as Angola and Tanzania, occupy relatively large proportions of parliamentary seats. Matland (1998) and Krook (2010) use more nuanced measures of development that account for both social and economic factors. 1 Relying solely on economic performance overlooks the fact that resources are oftentimes distributed unequally. Instead, a mixture of both economic and social proxies provides a more accurate representation of a population’s well-being in a way that aggregated economics alone cannot (Inglehart and Norris 2003), which becomes more significant when looking at outcomes concerning social (in)equalities.
Development has occasionally been treated as a “scope condition,” where separate populations are defined according to level of development. This method allows scholars to isolate those factors operating in a specific set of countries, and determine whether or not the same mechanisms work in similar fashions across groups of countries (Mahoney and Goertz 2004). Matland (1998) was the first to apply existing models to separate samples of twenty-four OECD and sixteen less developed countries. His results show that the causal mechanisms emphasized by previous researchers, most notably electoral system, only become significant as a country’s level of development increases. Unfortunately, because of limited sample size and lack of regional variation, his findings do not hold up to tests of robustness. Additionally, on the basis of the time period of analysis, Matland cautions that female representation may be too low in less developed countries to discern broad patterns influencing representation. Today, levels of representation have soared in Africa and Latin America, making it an apt moment to revisit his analysis. Matland’s study is also limited in the range of independent factors he considers. The proliferation of gender quotas since 1998 enables an investigation of this important equalizing mechanism, and comparative data also facilitates the inclusion of more nuanced measures of the electoral system. However, if Matland’s basic insight of a development threshold can withstand more rigorous testing using a broader sample and larger set of causal factors, extensive theoretical revisions within the literature would be suggested.
Four more recent studies have followed Matland’s example of using development as a scope condition. Kenworthy and Malami (1999) apply established models across a sample of 20 developed democracies and a diverse group of 146 countries. While their results show few differences between the two samples, they do not analyze less developed countries in isolation. Viterna, Fallon, and Beckfield (2008) replicate Kenworthy and Malami’s analyses, but extend the models to a subset of 85 developing countries (defined by GDP per capita). The authors conclude that while level of development does not directly affect women’s parliamentary representation, key causal variables do vary significantly across samples. Hughes (2009) runs separate analyses across 36 high-income, 86 middle-income, and 63 low-income countries, concluding that previous models are less adequate when applied to low-income countries. Finally, Krook (2010) uses QCA to analyze 22 Western democracies and 26 sub-Saharan African countries, also finding that the causal importance of certain mechanisms varies between the two groups. While these studies make progress by isolating the causal mechanisms operating in less developed countries, they all arrive at different conclusions.
Electoral Systems: The Gender Advantage of Proportional Representation
A proportional-representation (PR) electoral system has been highlighted by most scholars as a fundamental factor predicting cross-national variations in women’s parliamentary representation (Kenworthy and Malami 1999; Matland 1998; Paxton 1997; Reynolds 1999; Rule 1987; Viterna, Fallon, and Beckfield 2008). In these systems, votes are cast for political parties or a party’s list of candidates, and the seats won is proportionate to the percentage of votes received (e.g., if a party receives 30 percent of the votes, they fill 30 percent of parliamentary seats). In contrast to majoritarian systems where parties put forward a single candidate and therefore have an incentive to appeal to the lowest-common denominator of voter preferences, parties in PR systems field multiple candidates and benefit by appealing to a diverse cross-section of voters. According to Paxton (1997), a PR system may buffer women by making them less risky candidates in comparison to a majoritarian system where female candidates stand in direct competition with men. However, not all PR systems select candidates in the same way. Legislators are chosen in the order they appear on candidate lists, so the position of female candidates matters (Paxton and Hughes 2007). In closed-list PR systems, political parties decide the candidates’ position on the list, while in open-list systems voters influence candidate location. Evidence has been mixed as to which system is better for women since it depends on whether political parties or voters are more likely to advance women (Paxton and Hughes 2007).
While the positive impact of PR systems on female representation has become a sort of dogma in the literature (Tremblay 2008), results vary when it comes to the generalizability of these findings for less developed countries. Kenworthy and Malami (1999) and Viterna, Fallon, and Beckfield (2008) find that PR systems have a positive effect on women’s representation in all countries, while Matland (1998), Hughes (2009), and Krook (2010) find that its significance only holds up in Western, industrialized democracies. This discrepancy suggests that the effects of what is arguably the most important causal mechanism are not fully understood and may operate differently across groups of countries.
Quotas: National Mandates of Gender Parity?
Twenty years ago only a handful of countries had legislation requiring a minimum number of female parliamentarians, whereas in recent years over 50 countries have adopted such legislation (Krook 2006; Tripp and Kang 2008). Gender quotas act as affirmative action policies intended to help women overcome obstacles to their election such as less political experience, cultural stereotypes, and/or incumbency. There are a variety of quotas that either reserve a set percentage of parliamentary seats or mandate a minimum number of candidates that parties must fill with women. Many countries, especially Western, industrialized democracies, have opted for voluntary party quotas rather than those established by national legislation. These are not legally binding, but instead are regulated internally by individual parties. Nationally mandated quotas, on the other hand, are codified in either electoral or constitutional law and are often accompanied by sanctions for non-compliance. National quotas can address various stages of the nomination process, either regulating the number of women elected (reserved seat quotas) or controlling women’s inclusion and/or placement on political parties’ candidate lists (legal candidate quota). Although national quotas encompass a diverse range of policies, leading experts in the field argue that all electoral and constitutional quotas represent a nation’s attempt to “fast track gender balance in politics” (Dahlerup 2006, 3), and therefore fall under the umbrella of national gender quotas. Quota legislation is generally laden with issues of compliance; however, women seeking parliamentary representation in countries with national mandates tend to have better outcomes compared to those with voluntary party quotas (Dahlerup 2006; Tripp and Kang 2008).
Reynolds (1999) and Paxton and Kunovich (2005) find that quotas do not have a statistically significant effect on women’s representation. However, neither study captures the time period when the most quotas were adopted (1995-2004). Tripp and Kang (2008) and Hughes (2009) use more recent data in their analyses and arrive at different conclusions regarding the measure’s statistical importance. While Hughes (2009) does not find statistical significance, Tripp and Kang (2008) do; however their measure combines both nationally mandated and voluntary party quotas while Hughes controls only for national quotas. Krook (2010) measures quotas based on either national codification or voluntary adoption by a major political party. She finds that it is neither a necessary nor a sufficient factor leading to increases in women’s representation in Western countries, but appears in three of the four QCA configurations in sub-Saharan African countries.
Despite this discord among quantitative studies, several qualitative analyses show that quotas may be especially important in emerging democracies and post-conflict societies (Bauer and Britton 2006; Dahlerup 2006; Krook 2006). In less developed countries equality between the sexes is often seen as an outcome that must be instituted, rather than a product of greater development (Dahlerup 2006; Dahlerup and Friedenvall 2005). Today advocates are less willing to wait the half century it took women to make gains subscribing to the “incremental approach” taken in Scandinavia and many Western European countries (Dahlerup and Friedenvall 2005). Quotas tend to be particularly popular in emergent democracies and postconflict societies because they confer an element of international legitimacy, but also because there is a political opening for quotas since these countries often begin from scratch designing political institutions and drawing up new constitutions (e.g., Afghanistan) (Bauer and Britton 2006; Dahlerup 2006; Krook 2006; Matland 2006; Tripp, Konate, and Lowe-Morna 2006). Conversely, across developed democracies the call for quotas has most often originated from women’s groups inside political parties, culminating in internally regulated party quotas rather than national legislation (Dahlerup 2006; Celis et al. 2008; Stevens 2007). Moreover, these countries often introduce quotas after women have already attained 20 to 30 percent of parliamentary seats, thereby minimizing their effects (Dahlerup 2006). The popularity of gender quotas, therefore, may be related to political transitions to democratic regimes, which encourages international acceptance and provides an opportunity for women’s movements to become involved in national politics (Dahlerup 2006; Hughes 2009). Thus, there are both external (desire for international legitimacy) and internal (e.g., timing, conflict, women’s movements) reasons why quotas are more likely to be adopted in less developed countries. It is also worth noting that larger statistical increases are possible in less developed countries given that they begin, on average, with low absolute levels of women’s representation.
Data and Methods
Using ordinary least squares (OLS) regression I examine political, socioeconomic, and cultural determinants of cross-national variations in women’s parliamentary representation across 168 countries from 1992 to 2010. I also apply models across samples of developed, developing, and least-developed countries, which allows me to assess the effects of key causal mechanisms across countries with varying levels of development. Data were compiled from a variety of sources including the United Nations, the World Bank, the Inter-Parliamentary Union, the CIA World Fact Book, the World Health Organization, and the Women’s Indicators and Statistics Database.
The robustness of my findings is verified through the use of partial plots and a variety of diagnostic tests (leverage [hat], hettest, Ramsey “reset,” Cook’s D, etc.). Because of the small sample size of the discrete models, error terms were plotted and show a normal distribution. As a result of multicollinearity, level of development and geographic regions are not included in the same model. The measure for developed countries is correlated at .83 with the dichotomous measure of Western countries. The mean Vif for the full model is 2.14, and no variables have a Vif higher than 4 or a tolerance less than .2. The results indicate that Seychelles (in 1992) and Rwanda (from 2003 to 2010) are outliers. These cases are removed from the analyses both individually and together, with no significant differences in the results. Because of the special importance of Rwanda, I choose to preserve these cases. Given the difficulty of instituting national gender quotas in majoritarian electoral systems, I also assess the correlation between quotas and PR electoral systems (.11).
Of the 192 independent states recognized by the United Nations in 2010, I have data for 168 countries. I do not analyze countries that lacked an elected national legislative body over the period, nor do I include countries considered dependencies or under trusteeship at any point during the time frame (see Supplemental Appendix at http://prq.sagepub.com/supplemental/ for list of countries). 2 Missing data are accounted for using multiple imputations in Stata 11.0, with all variables from the full model used to improve results. Imputed variables are highly correlated with the variables needing imputations. Cases missing are proportionally representative of the three development groups. 3 Running the analyses using a dummy variable for missing data produced no significant changes in the results.
Women’s Parliamentary Representation
The dependent variable is the percentage of seats occupied by women in single or lower houses of a country’s main legislative body. Percentages range between 0 and 56.3 percent, with a mean of 10.8 percent throughout the time span. Data were collected from the Inter-Parliamentary Union and the Women in Parliament Dataset (Paxton, Green, and Hughes 2008). The outcome, therefore, concerns the number of women in parliament rather than the effects of having more women in parliament (descriptive vs. substantive representation). This article, however, is predicated on the belief that greater legislative participation of women at least increases the possibility that women’s interests will be better represented (Carroll 2001; Celis et al. 2008; Dahlerup 2010; Phillips 1995; Wängnerud 2009).
Socioeconomic Development
Of primary importance to this analysis is the hypothesis that development shapes how electoral systems and quotas affect women’s representation in national legislative bodies. In most studies, level of development is measured using GDP or energy consumption per capita as proxies, which fails to account for social development, a crucial factor in understanding gender equality. For example, a country such as Equatorial Guinea, which the World Bank ranked in the top 20 by GDP per capita in 2008, would be characterized as a developed country using an exclusively economic definition. This ignores the actual health and welfare of the population, as well as the enormously skewed distribution of wealth, which when taken into consideration makes it a developing country. To address this I define development using the Human Development Index (HDI), a comparative measure incorporating life expectancy at birth; adult literacy rates; combined primary, secondary, and tertiary gross enrollment ratios; and the natural log of GDP per capita at purchasing power parity into a single 100-point scale. According to the United Nations (2008), HDI values can be used to categorize countries as developed (≥.9), developing (.5 to .899), and least-developed (<.5). Correspondingly, countries are coded into three dummy variables. As with any composite index, there are drawbacks in terms of data quality and reliability. However, the UN Development Program has gone to great lengths to systematize this measure, and it is widely used in the development literature as a reliable indicator of societal well-being (Inglehart and Norris 2003).
Women and Politics over Time
Many factors that affect women’s political representation are processes that unfold over time. Gender quotas, for example, commonly take a minimum of one election cycle for results to become visible. In addition, economic crises or upturns may have lagged effects on political outcomes. In spite of this, previous studies that examine variations in women’s parliamentary representation have generally been at single points in time. Paxton (1997), however, conducts a panel study across two points in time (1975 and 1988) to test for lagged effects, and her results indicate that there are good reasons to believe time matters. Recently, leading scholars in the field have called for more time-series analyses on the subject, arguing that it would enable researchers to find support for theories that have thus far generated weak evidence or to problematize theories that have generated strong empirical support (Hughes and Paxton 2007; McConnaughy 2007; Paxton, Hughes, and Painter II 2009; Ritter 2007). I include fixed effects for each year from 1992 to 2010 (reference) to address the oftentimes contradictory results of how key causal mechanisms work in less developed countries, while also addressing unit heterogeneity, a common issue in cross-sectional time-series analyses.
Electoral Systems and Quotas across Development Thresholds
To test Matland’s (1998) hypothesis of a development threshold and adjudicate between the disparate results reached by previous researchers looking at less developed countries, I focus on the effects of two important political institutions: electoral systems and national gender quotas. Not only are these two variables among the most important factors identified by previous researchers, but they also provide greater opportunities for intervention than structural and ideological factors.
Electoral systems are coded into four binary variables: majority/plurality (reference), mixed, open-list proportional-representation, and closed-list proportional-representation systems. If a given system is present it is coded as 1, otherwise it is coded as 0. While this coding system does not capture the full complexity and empirical messiness of these electoral systems, the simplification does allow for more straightforward analysis and also improves on the classifications used in previous studies, which generally do not distinguish between open- and closed-list PR systems.
National quotas are operationalized using a comprehensive definition that includes both reserved seat and electoral quotas. While the former regulates the actual election of women and the latter addresses the candidates running for elected office, both aptly represent the many ways that countries use national affirmative action strategies to increase women’s political representation (Dahlerup 2010, 19). Quotas are measured dichotomously, indicating whether the country has a nationally mandated quota (1) or not (0). I include only nationally legislated quotas rather than voluntary party quotas because, as nationally mandated legislation, these quotas are generally accompanied by sanctions for non-compliance providing an avenue for enforcement. There are drawbacks to this measurement choice however, especially for countries with dominant party systems. For example, South Africa’s African National Congress adopted a 30 percent quota for women on party lists, and as the leading political party this resulted in a jump in women’s parliamentary representation from 3 to 27 percent in a single election (1994). While more nuanced quantitative work on gender quotas is imperative, for the purposes of this analysis I include only those quotas that are codified in national law, and therefore easier to enforce and manipulate through legal channels. To examine whether the threshold mandated by the quota matters, I include a dummy variable for those quotas that require women to fill 30 percent or more of parliamentary seats and/or party list spots. 4
To analyze the effects of PR electoral systems and national gender quotas on women’s legislative representation across development thresholds I include interaction terms of these two variables with the dichotomous measure of development. I also run models across three separate samples of countries grouped by level of development.
Political, Socioeconomic, and Ideological Factors
While most studies stress the principal importance of a country’s electoral system in facilitating or hindering women’s access to political office, other country characteristics affect women’s entry into the political arena. Many women in politics researchers employ an analytic framework that distinguishes between “supply” and “demand” side factors. While the supply side deals with those aspects influencing whether or not women have the skills, experience, and desire to be considered in a pool of potential candidates, the demand side addresses those characteristics and institutions that facilitate (or impede) women moving from the pool of candidates into elected office (Paxton and Hughes 2007). I control for most factors found to be important by previous scholars. The variables fall into one of three categories: political, socioeconomic, and ideological/cultural factors.
The Political Structure
Women’s ability to actually get elected is structured by the nature of the political system. Institutional differences across political systems shape the level of demand for female candidates (Hughes 2009; Paxton and Kunovich 2003; Stevens 2007). In addition to electoral system and quota variables, I include the number of years since women won the right to vote, a measure of government effectiveness, the Freedom House (2012) measure of political rights, and a dummy variable for countries with a Marxist-Leninist national ideology. The longer women have been legally defined as citizens (first gained suffrage), the more integrated women should be into the country’s political fabric (Reynolds 1999). The variable is continuous, measuring the number of years since women won voting rights. Women’s ability to win office may also be affected by parliament’s capacity to actually implement policies. If parliaments are effectively powerless, female legislators may be more palatable to stand as tokens in a symbolic government. Conversely, more effective parliaments may be correlated with stronger democracy, which is theorized to benefit women’s access to political positions. To test this link, I include both the World Bank’s government effectiveness index and Freedom House’s political rights score. The government effectiveness index measures the ability of governments to effectively deliver public services, the quality of the bureaucracy, the competency of public servants, and the independence of the civil service from political pressures (World Bank 2010). 5 Values are indexed to have a mean of zero, with positive scores indicating better governance. The Freedom House political rights score combines estimates of government effectiveness with measures of electoral process autonomy and the extent of political rights. Scores range from 1 (most free) to 7 (least free). Finally, a dummy variable is included for Marxist-Leninist countries, which generally codify principles of equality into law and therefore may have higher percentages of women in parliament. 6
The Social Structure
Women’s position in society’s social structure affects the “supply-side” of politics (Hughes 2009; Paxton and Kunovich 2003; Stevens 2007). Political elites often have higher levels of education and professional experience. Although empirical evidence is mixed, it’s hypothesized that access to economic and social capital influences the factors that enable women to seek political office by providing them with the skills and experiences required of political officials (Hughes 2009; Kenworthy and Malami 1999; Matland 1998; Paxton 1997; Paxton and Kunovich 2003; Rule 1987; Tremblay 2008; Viterna, Fallon, and Beckfield 2008). I include female labor force participation (as percentage of total labor force, logged), the percentage of women that are literate (logged), and fertility rates (births per woman). These variables gauge the degree to which women are autonomous members of society and provide proxy measurements of the pool of women eligible for elected public office.
Ideological/Cultural Factors
Gender is a universal form of social categorization and a basis for cultural norms, and therefore gender role ideologies will also affect women’s access and electability to political positions (Paxton and Kunovich 2003, 2005; Ritter 2007). I follow previous studies by including geographic regions and religion as ideological measures. 7 Geographic fixed effects are common proxies for unmeasurable ideologies and cultures unique to specific regions of the world. The seven regional categories are Western (reference), Scandinavia, Eastern and Central Europe, Asia and the Pacific, Sub-Saharan Africa, Middle East and Northern Africa, and Latin America and the Caribbean. These measures also control for the possibility of spatially correlated errors (Viterna, Fallon, and Beckfield 2008). In order to account for intra-country variations, I measure the percentage of adherents to various religious groups rather than controlling for religion as a series of dummy variables (Paxton and Kunovich 2003). Keeping in line with previous studies I include the following religious categories: Protestant (reference), Catholic, Orthodox, Muslim, and Other.
Results
Table 1 reports the OLS regression results for 7 models run with the full sample of 168 countries. Table 2 shows the results when level of development is treated as a scope condition, with separate analyses of developed, developing, and least-developed countries.
OLS Regression Results for the Full Sample, Percentage Women in Parliament 1992-2010.
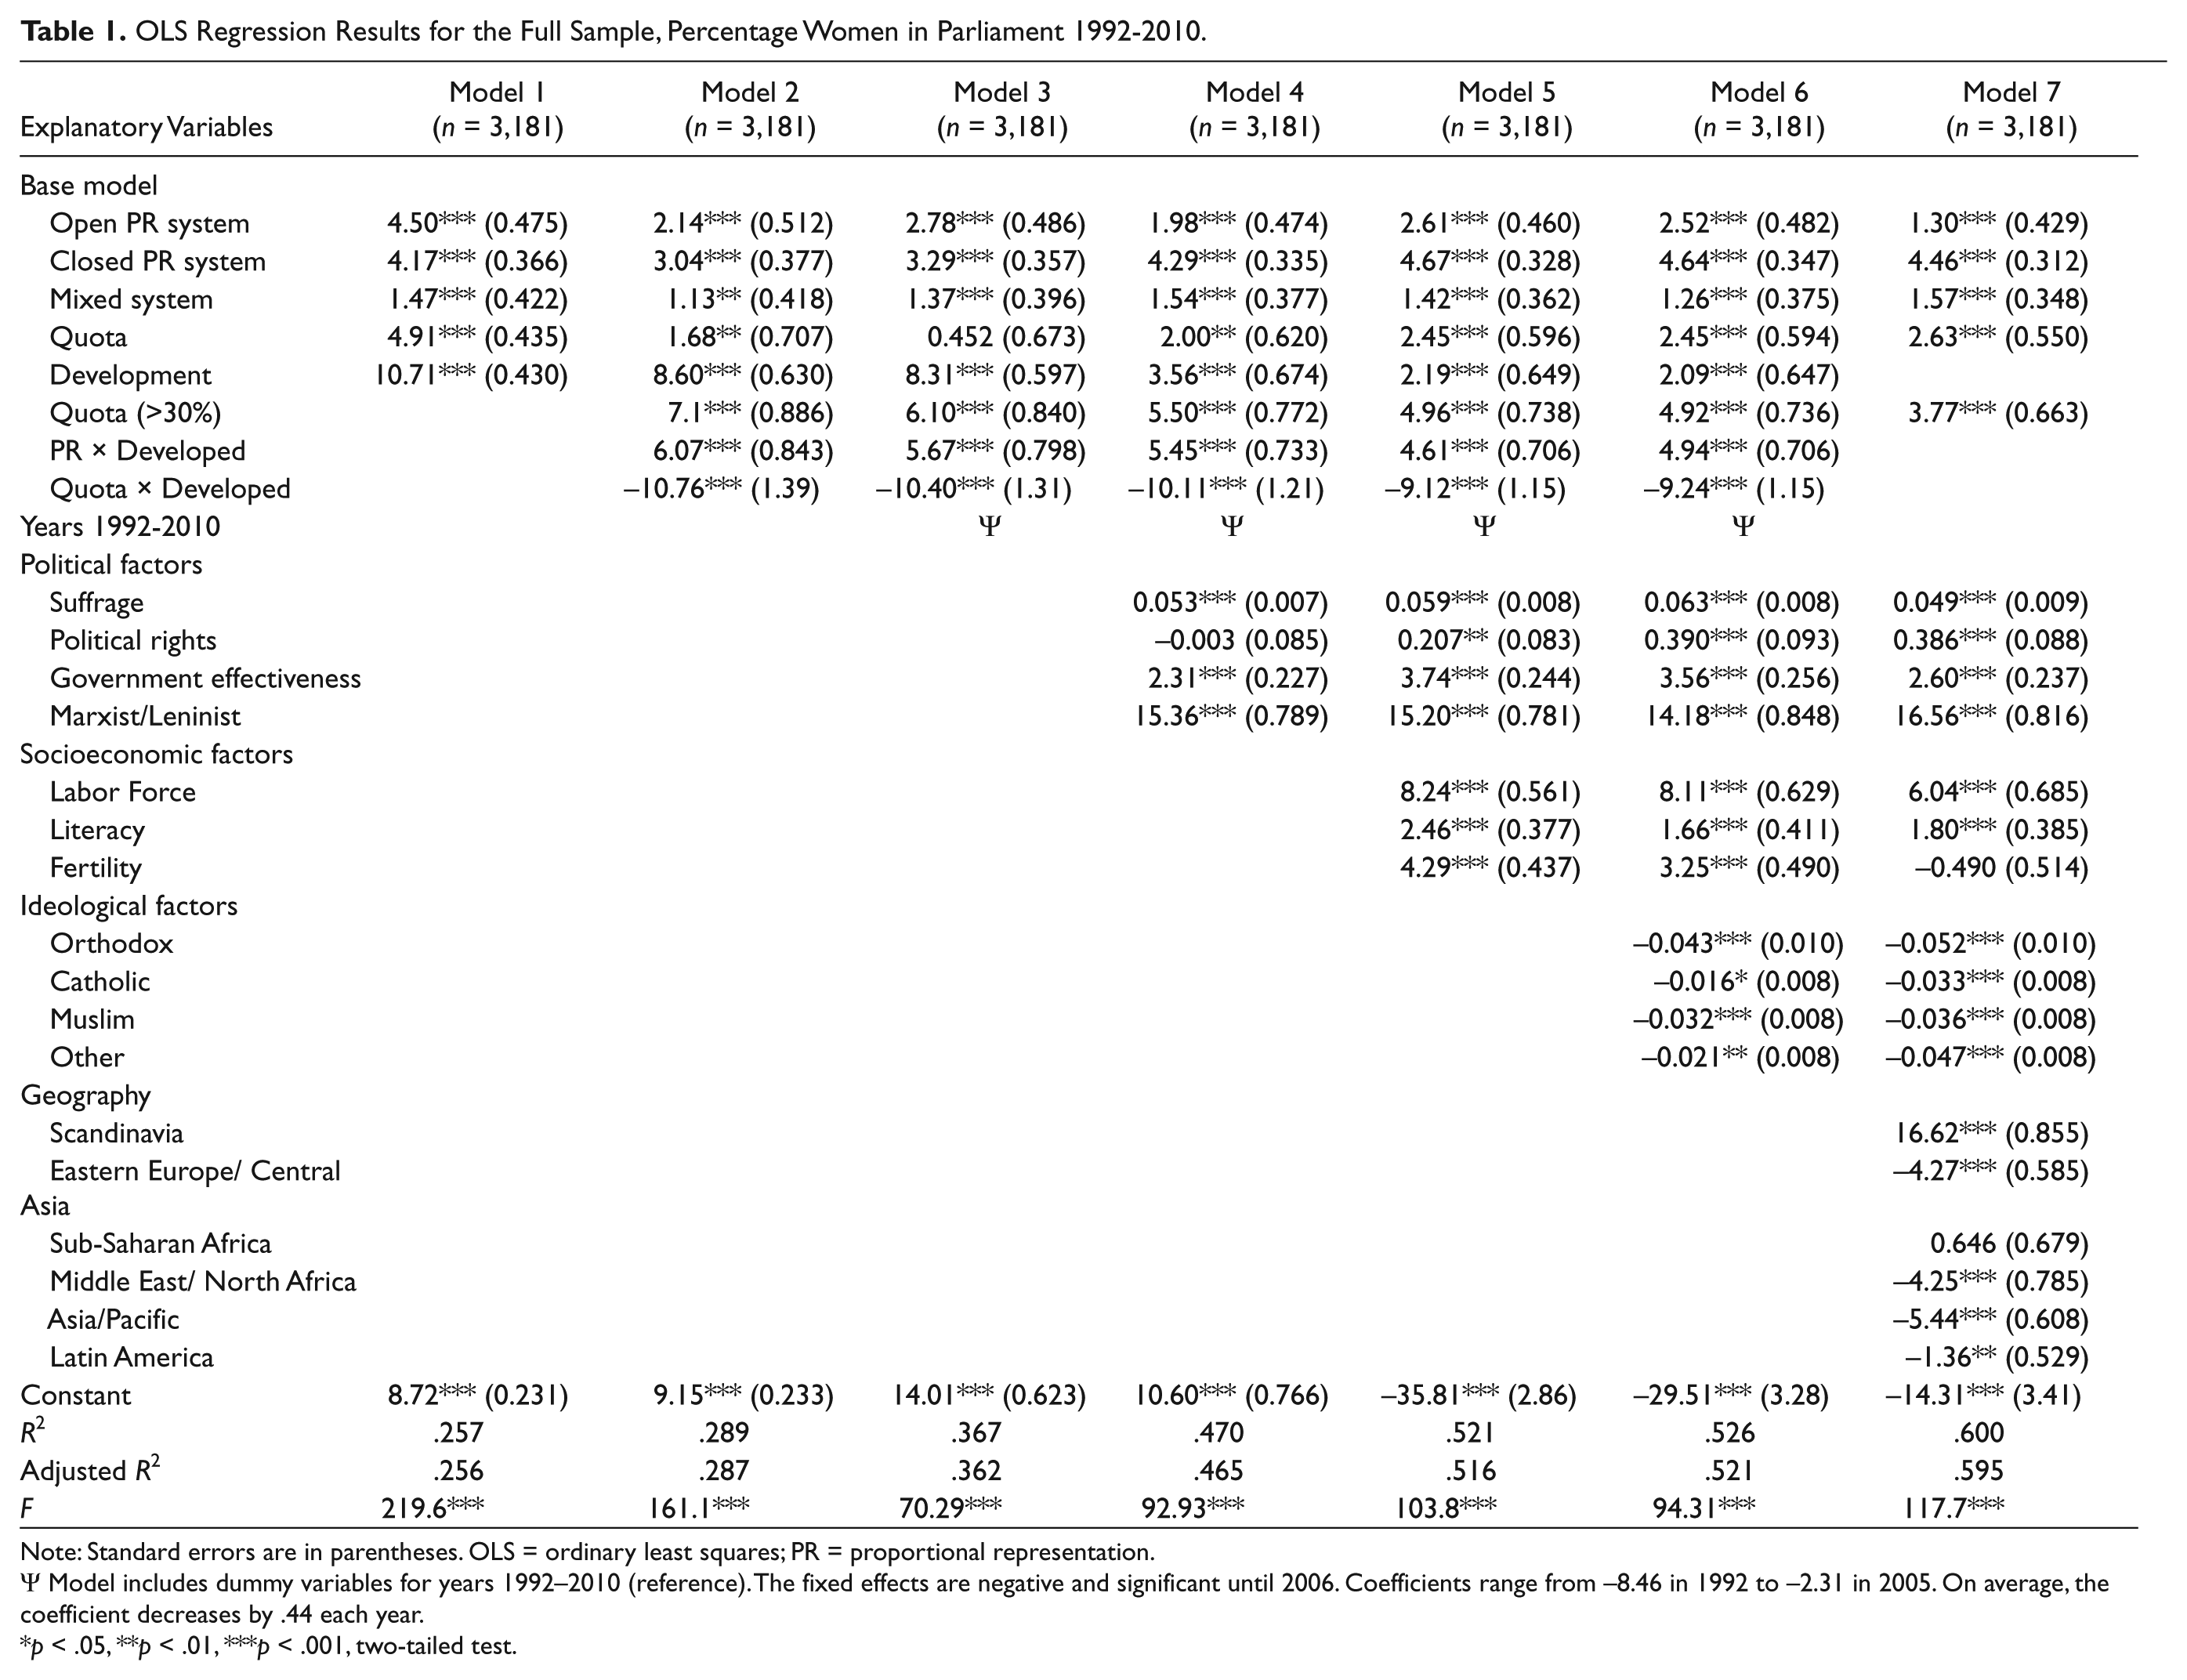
Note: Standard errors are in parentheses. OLS = ordinary least squares; PR = proportional representation.
Ψ Model includes dummy variables for years 1992–2010 (reference). The fixed effects are negative and significant until 2006. Coefficients range from −8.46 in 1992 to −2.31 in 2005. On average, the coefficient decreases by .44 each year.
p < .05, **p < .01, ***p < .001, two-tailed test.
OLS Regression Results for Developed, Developing and Least-Developed Countries, Percentage Women in Parliament 1992-2010.
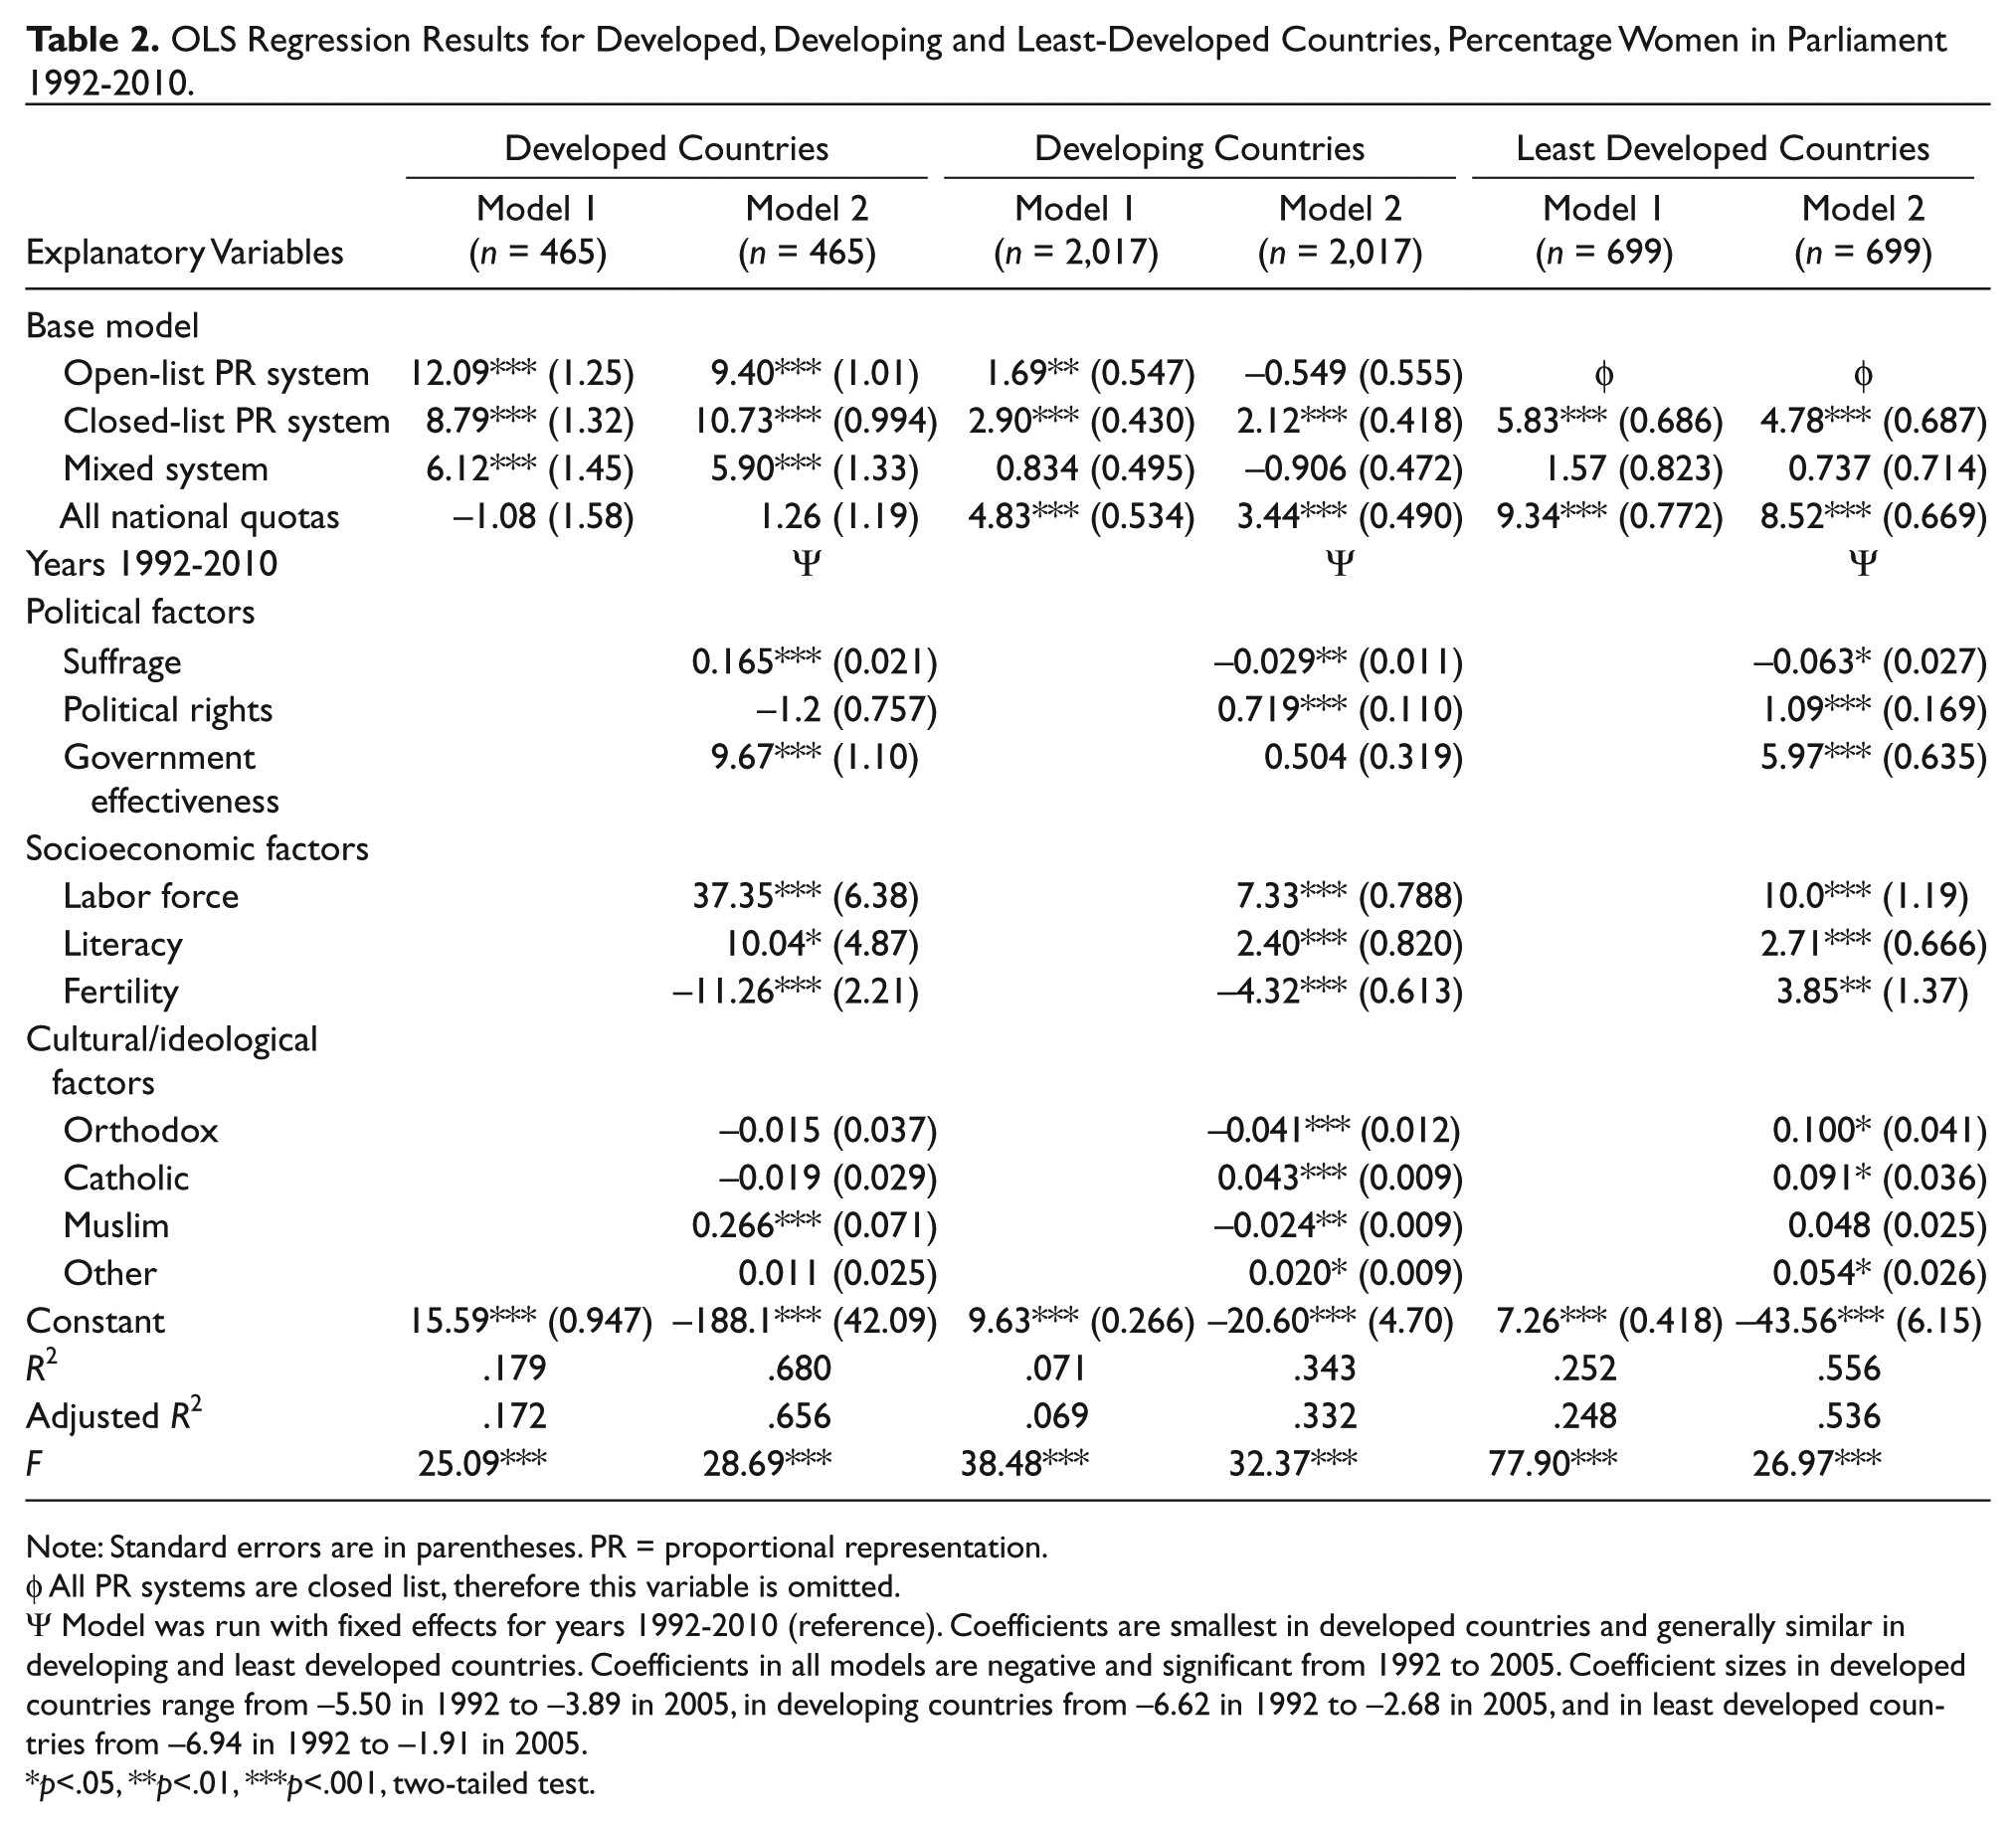
Note: Standard errors are in parentheses. PR = proportional representation.
φ All PR systems are closed list, therefore this variable is omitted.
Ψ Model was run with fixed effects for years 1992-2010 (reference). Coefficients are smallest in developed countries and generally similar in developing and least developed countries. Coefficients in all models are negative and significant from 1992 to 2005. Coefficient sizes in developed countries range from −5.50 in 1992 to −3.89 in 2005, in developing countries from −6.62 in 1992 to −2.68 in 2005, and in least developed countries from −6.94 in 1992 to −1.91 in 2005.
p<.05, **p<.01, ***p<.001, two-tailed test.
Model 1 in Table 1 includes only the main theoretical variables and explains about 26 percent of the cross-national variation of women’s representation. In the most complete models (models 6 and 7), approximately 53 and 60 percent of the variation is explained respectively. 8
Parity in Proportional Representation
Consistent with the findings of previous researchers, my results show that PR systems are substantively and statistically significant throughout all models. All things being equal, countries with a PR system have on average more women in parliament than those countries with majoritarian electoral systems. Closed-list PR systems are more beneficial to female parliamentarians than open-list systems. When compared to majoritarian systems and controlling for all other factors, closed-list systems have an average of 4.6 percentage points more women in parliament compared to 2.5 percentage points in open-list systems. In closed-list systems, voters are not able to reorder candidate lists as they do in open-list systems, and this appears to benefit women in the full sample. When PR system is interacted with level of development, it becomes an even stronger predictor of variations in the percentage of women in parliaments. Developed countries with a PR system have 6.1 percentage points more women in parliaments than developed countries with other electoral systems (4.9 in the full model). These results show that women seeking political office in developed countries with PR systems have a very significant advantage. To further illustrate how electoral systems work across thresholds of development, we can look at the scope models in Table 2. Closed-list PR systems are the most beneficial to women across all countries; however, the effect size is two to four times larger in developed countries. While a closed-list PR system gives women a 10.7 percentage point advantage in developed countries, the benefit is only 2.1 and 4.8 percentage points in developing and least-developed countries, respectively. Open-list PR systems are also more beneficial to women than majoritarian systems in developed countries (conferring a 9.4 percentage point advantage); though the effect is insignificant in developing countries. 9 While mixed systems are less favorable than PR systems, they do confer an advantage to women seeking representation in the full sample when compared to majoritarian systems. However, looking at the scope models, it becomes clear that these results are biased toward developed countries. All else being equal, the coefficient fails to reach statistical significance in developing and least-developed countries, indicating its effect is no different from majoritarian systems.
Figure 1 clearly shows that while women do better in all countries that use a PR system, the effect size is much larger in developed countries. This indicates that other factors are obscuring the beneficial effects of this electoral system in less developed countries. Nevertheless, in contrast to Matland (1998) and Hughes’s (2009) findings, my results show that both open- and closed-list PR systems do benefit women in less developed countries. However, it is also clear that these benefits do not work in the same fashion across countries, which supports Matland’s more basic insight about the presence of a development threshold that must be met in order for the full beneficial effects of a PR system to be seen. It is difficult to draw a line delineating an exact threshold of development and it is likely not linear as a PR system is more beneficial to women in least-developed versus developing countries. However, once countries achieve an HDI score above .9, the advantageous effects of PR systems double, triple, or even quadruple in size.
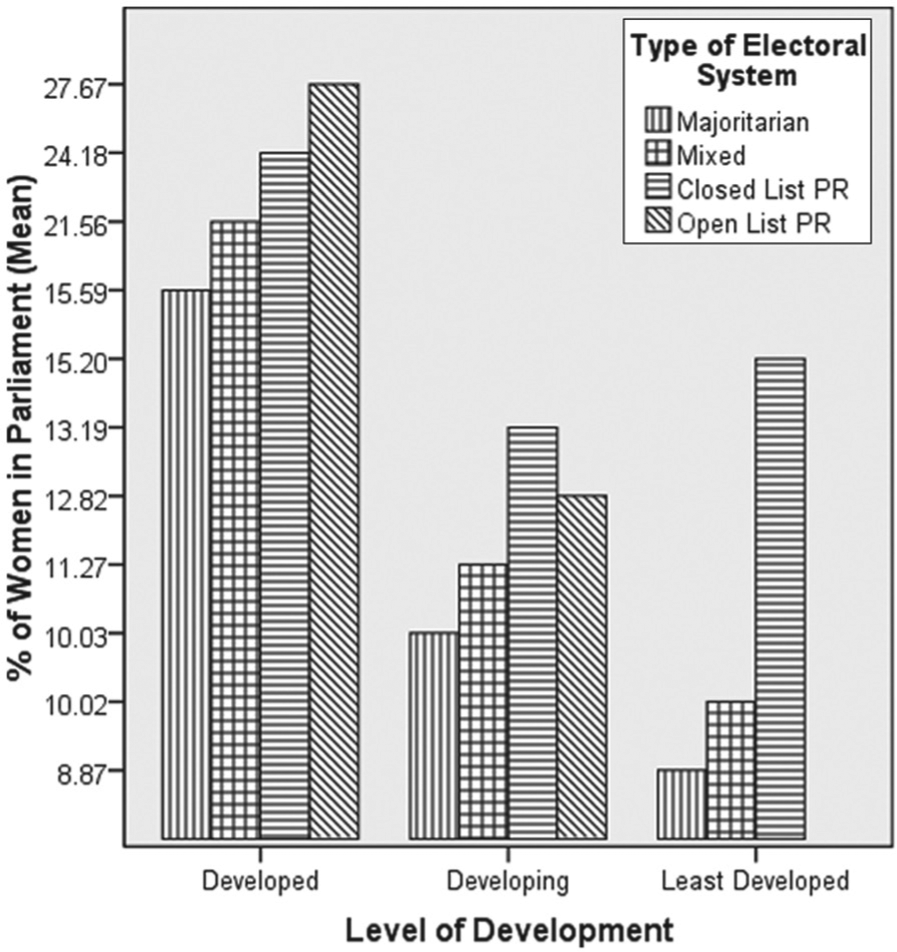
Average percentage of women in lower/single houses of parliament by level of development and electoral system.
Mandating Equality through Quotas
In contrast to previous research, my results show that the presence of nationally mandated gender quotas is significantly associated with cross-national variations in women’s parliamentary representation. Countries with nationally mandated quotas have between 2 and 4.9 percentage points more women in parliament than countries without such quotas. Quotas that mandate a 30 percent or greater threshold have an even stronger affect, with a 3.8 to 7.1 percentage point advantage over those countries that either lack quota legislation or have a quota mandating a threshold below 30 percent.
Once quotas are interacted with level of development, however, the sign of the coefficients change from positive to negative, but remain significant. This implies that a developed country with a quota actually has an inverse relationship to women’s parliamentary representation. In other words, when controlling for other factors, developed countries with quotas have about 9.2 percentage points fewer women in parliaments than developed countries without quotas. These results, however, should be interpreted with caution. To begin with, it is important to note that during the time period of analysis only five developed countries instituted national quotas. 10 Moreover, it is unlikely that quota legislation actively decreases the percentage of women in parliament. Instead, it is more probable that this is a spurious correlation, capturing the fact that the relationship is statistically insignificant in developed countries.
The discrete models in Table 2 give us a better sense of how quotas work across countries. Results show that there is no statistical difference between developed countries with and without quotas. By contrast, in developing and least-developed countries the relationship is significant and positive. The effect size is strongest in least-developed countries where women experience about an 8.5 percentage point benefit in comparison to similarly situated countries without quotas. Least-developed countries such as Rwanda, Uganda, and Burundi, which have all instituted national gender quotas, have considerably higher percentages of women in parliament than comparable countries in the region without quotas. In contrast to most cross-national analyses, these results indicate that there is a statistically significant relationship between nationally mandated gender quotas and increases in women’s parliamentary representation in less developed countries. The findings also demonstrate that results derived from large cross-national samples should be interpreted with caution, as they have the potential to be biased toward one subset of countries.
Figure 2 presents a graphical representation of these findings, showing that developed countries with quotas tend to have lower averages of women in parliament than developed countries without quotas. Conversely, national quotas in developing and least-developed countries lead to significant increases in the average percentage of women in parliament. These results show that a one-size-fits-all policy agenda advocating gender quotas to increase women’s representation in national legislatures does not make sense. Rather, policies require greater nuances and should be tailored to a country’s specific situation.
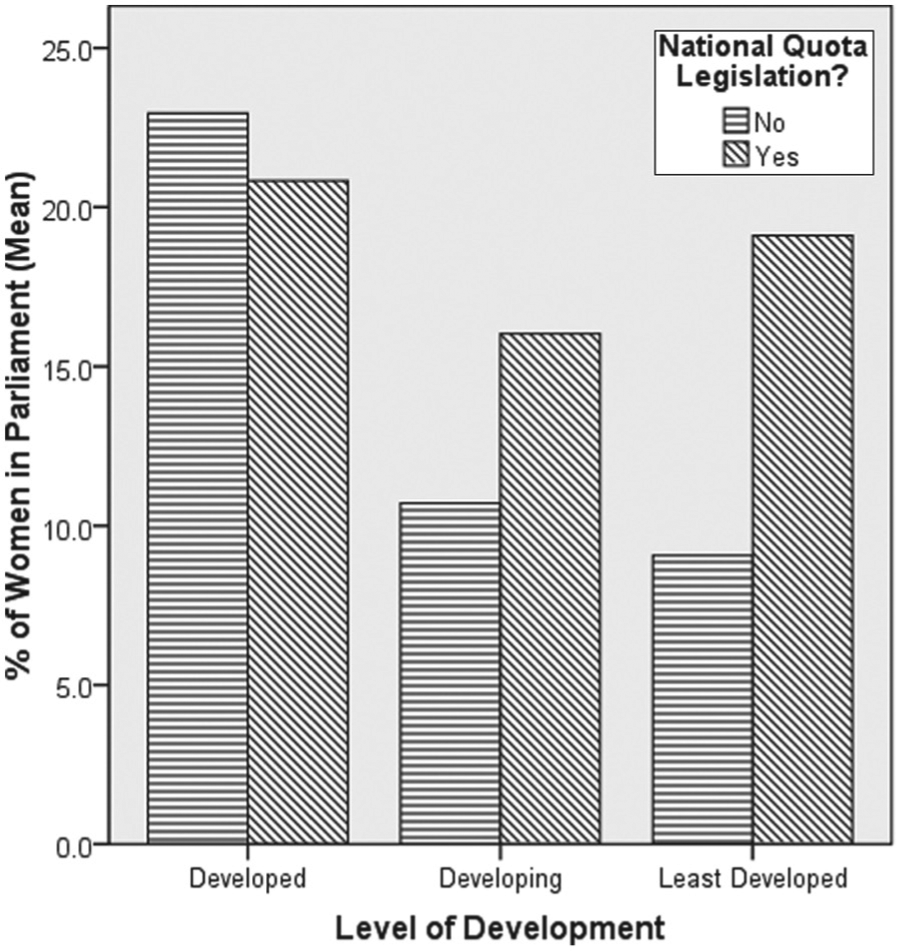
Average percentage of women in lower/single houses of parliament by level of development and national gender quotas.
The Supply and Demand of Women’s Political Representation
While highlighting the different effects of particular poli-tical institutions on women’s parliamentary representation across development thresholds is the primary intention of this article, other variables are also important to the analysis. First, we may note that annual fixed effects do not have much explanatory power (explaining about 11 percent of the variation), but do exist from 1992 to 2005 in all countries. In comparison to 2010, the preceding years have, on average, fewer women in parliament. Annual coefficient sizes are largest in least-developed countries and decrease as level of development increases. Second, socioeconomic development alone explains about 18 percent of the variation in women’s parliamentary representation. Developed countries have, on average, an 11.5 percentage point advantage over less developed countries, without controlling for other variables. The effect of this measure remains strong and significant across models. An exclusive focus on development, however, can be misleading and is not sufficient to explain why so many less developed countries rank among the highest when measuring women’s parliamentary representation. Instead, the effects of development interact with other variables in complex ways to drive levels of women’s representation. While this analysis does not allow us to pinpoint the exact threshold of development required for other variables to have an effect, we can identify how these variables work across three broad categories of socioeconomic development.
Institutional features of political systems help to shape the demand for female politicians. Alone, political factors explain about 27 percent of cross-national variation. The most striking finding among the political factors is the effect of a Marxist/Leninist ideology, which confers a 14 to 16 percentage point advantage to women in parliament over countries that do not subscribe to such tenets. Although these countries are generally authoritarian regimes that are unlikely supporting women’s equality based on feminist principles of fairness, the national doctrine of Marxism/Leninism emphasizes equality in all aspects of life. These systems assume both women and men will contribute to society outside of the home and family. Another interesting finding concerns the length of time since women won the right to vote. In both the full sample and in developed countries, the more time that has elapsed since women’s suffrage, the larger the percentage of women in parliament (although the effect is less than 1 percentage point). However, in developing and least-developed countries, every additional year since winning suffrage is associated with a slight decrease in the percentage of women in parliament. Many countries that gained independence post-1945 also instituted female suffrage at the same time, meaning it occurred at a time when women’s rights were part of an international dialogue of priorities, as well as a method of attaining some international legitimacy. For example, both Mozambique and Angola gained independence and passed women’s suffrage in 1975, and women currently hold 39.2 and 38.6 percent parliamentary seats respectively. This is significantly higher than other countries in the region that granted suffrage rights earlier. Finally, many agree that stronger democratic political institutions will enable higher female representation in national politics. The Freedom House measure of political rights, however, is insignificant in developed countries and has a positive effect in both developing and least-developed countries. Since a lower score on the political rights index corresponds to greater freedoms, one might assume a negative association. Quotas, however, tend to be most popular in post-conflict and even authoritarian regimes, potentially leading to higher female representation in countries considered to be less open and free.
While political features shape the demand for female politicians, social structure factors impact the supply of qualified female candidates. Socioeconomic variables alone explain about 18 percent of the variation in women’s parliamentary representation cross-nationally. Both education and labor force participation positively affect women’s parliamentary representation by putting more women into the pool of potential political candidates. The effect sizes of both variables, however, are more than double in developed countries. This suggests that there is a stronger association between having a larger pool of “qualified” candidates and greater representation in developed versus less developed countries. In developed and developing countries, higher fertility rates are associated with significant decreases in the percentage of women in parliaments (every additional child per woman associated with an average decrease of 11.3 and 4.3 percentage points, respectively). However, this relationship differs in least-developed countries where higher fertility rates are actually associated with greater percentages of women in parliaments. While fertility rates are considered a method of showing how tied women are to the home (and therefore excluded from the public sphere), in countries with more traditional gender role ideologies those women that represent an “ideal womanhood” may be more likely to be seen as acceptable political symbols. Therefore, where gender roles tend to idealize women as wives and mothers, those women with more children may be considered more electable to political office and therefore better candidates.
Ideological factors also impact the supply of female candidates by shaping the norms surrounding women’s roles outside of the home. On their own, these factors explain about 11 percent of cross-national variations. Religious affiliations are generally weak predictors of women’s representation both in the full and discrete models, while geographic regions have stronger effects. Interestingly, the fixed effect for Sub-Saharan African countries fails to reach significance, indicating no statistical difference from Western countries. Women’s political representation has soared in Africa recently, mostly fueled by quota legislation and the democratic transitions of several postconflict regimes.
Discussion and Conclusions
This analysis shows that models designed to explain variations in women’s parliamentary representation are a good fit for the developed world, but caution should be taken when generalizing across countries with lower levels of socioeconomic development. Using Matland’s (1998) research as a starting point, I show that development interacts with key causal mechanisms to impact their effects on women’s representation across countries. I demonstrate this by focusing considerable attention on two political factors that have been identified by previous researchers as key causal factors. The significance of using these variables to test Matland’s (1998) hypothesis of a development threshold is that as political institutions, they are more easily manipulated to increase women’s political representation than factors such as cultural ideologies or social features.
In contrast to some previous research, I find that the effects of PR systems are significantly related to increases in women’s parliamentary representation across all countries. However, the size of this effect is dramatically larger in developed countries, indicating that there is a threshold of development that must be reached before the full benefits of this type of electoral system is seen. In less developed countries, the benefits of PR systems may be obstructed by barriers that prevent party lists from going forward with female candidates. Matland (1998) argues that the failure of the PR system to work in women’s favor in less developed countries suggests that either demands for representation are not being forwarded by women—perhaps because they are politically inactive—or, within the parties, the perceived costs of nominating women are so great that parties prefer to run virtually all-male slates rather than risk the wrath of the voters by nominating women. I believe the latter is true and that without pressure for women’s inclusion, women may be unable to exploit the political opportunities provided by a proportional-representation system (Kittilson 2006).
The beneficial effects of PR systems may also be obscured in less developed countries because of other hindrances, such as corruption, internal conflicts, and/or more traditional cultural ideologies relegating women to the home and family. Additionally, specific electoral system features may differ in less developed countries, further interfering with female politicians’ bid for national office. This analysis shows that closed party lists can mitigate any sexism among voters by preventing women from being moved further down candidate lists (to essentially unelectable positions). Furthermore, features such as district magnitude and electoral thresholds also affect women’s chances of winning national political positions (Bauer and Britton 2006; Matland 1998; Paxton and Hughes 2007). Since political parties are the gatekeepers of candidate selection, variations in their structures and ideologies impacts electoral systems’ ability to aid women’s representation (Kittilson 2006; Paxton and Hughes 2007). Finally, causal combination could also play a role in less developed countries, with the beneficial effects of a PR system relying on the presence or absence of other factors (such as strong Left parties and active women’s movements) (Krook 2010). These nuances need to be included in further quantitative analyses, while in-depth case studies specifically comparing electoral systems in developed and less developed countries would offer insights as to why women do not experience the full rewards of a PR system in countries with lower levels of socioeconomic development.
In contrast to previous research, this analysis shows that nationally mandated quotas do have a statistical impact on women’s parliamentary representation. However, while legislation mandating a minimum percentage of parliamentary seats to be reserved for female candidates increases women’s representation in less developed countries, it is not statistically effective in developed countries. Industrialized democracies are less likely to adopt national quota legislation, and if they do it often occurs once women have already attained 20 to 30 percent of parliamentary seats, thereby limiting the beneficial effects (and curbing statistical significance) (Dahlerup 2006). In addition, in newer development discourses on equality between the sexes are seen as something that must be instituted rather than a consequence of higher development (Dahlerup 2006). Quotas, therefore, tend to be more popular in semidemocratic and postconflict countries, in part because they are perceived as conferring international legitimacy but also because these countries often begin from scratch building political institutions, drawing up new constitutions, and rebuilding parliaments, providing a political opening for quotas (Matland 2006; Tripp, Konate, and Lowe-Morna 2006). Furthermore, these results show that the threshold of representation mandated by the quota legislation matters. Those quotas reserving 30 percent or more parliamentary seats and/or candidate spots for women have significantly more women in parliament, often far surpassing the legislated threshold.
These findings have the potential to alter the discourse around how to increase women’s political representation. They indicate that a one-size-fits-all remedy to increase the proportion of women occupying seats in national governments does not make sense. Rather, the transition to a PR electoral system considerably helps women in the average developed country, but does less to aid women in less developed countries in the absence of other demands for representation. Conversely, women in developing and least-developed countries generally experience substantial gains after the adoption of national gender quota legislation, while this use of time and/or resources may be ill advised in developed countries. For example, the introduction of gender quotas in Costa Rica increased women’s parliamentary representation from 19 to 35 percent in one election, while six years after passing quota legislation in France the percentage of women in parliament rose from 10.8 to 12.2 percent. The five developed countries with the highest percentages of female parliamentarians all have PR systems, but none have national quotas. Rwanda is a postconflict country with very low levels of social and economic development; however, it does have a national quota and currently has the highest percentage of female parliamentarians in the world. Angola, Tanzania, Uganda, and Burundi all have relatively low levels of socioeconomic development, have adopted national quota legislation, and rank among the top twenty countries by percentage women in parliament. In fact, of the twelve less developed countries that rank in the top twenty, nine of them have national gender quotas. This pattern, however, does not hold for all countries. Women in Brazil, Niger, Panama, and Armenia, all less developed countries with national gender quotas, make up less than 10 percent of national parliaments. Likewise, in Ireland, Israel, and Greece, all developed countries with PR electoral systems, women hold relatively low proportions of parliamentary seats. Testing the specific features of quotas and PR systems, as well as the possibility of causal combination, would greatly improve our understanding of these differences.
More generally, these results suggest that rather than offering universal truths, comparative quantitative analyses can suffer from regional biases (often privileging Western democracies) (Krook 2010). Generalizing broadly across countries, therefore, does not adequately represent the effects of key causal mechanisms. The importance of determining the means to women’s political advancement goes beyond the formal significance of fairness and justice. Achieving greater gender equality in national governments improves the quality of policy making, both in relation to women’s specific needs and to the policy-making process more generally. Research shows that when women are underrepresented, issues such as sexual harassment, women’s health, and family policies may receive less attention (Hughes 2009; Wängnerud 2009). In addition, a diverse group of legislators enhances the democratic process more broadly by ensuring the representation of minorities, increasing the diversity of viewpoints, and heightening political competition (Bauer and Britton 2006; Kenworthy and Malami 1999; Reynolds 1999). Given these substantial implications, it is important to understand which, if any, institutional mechanisms support increases in women’s political representation. This research shows that different institutional changes are advised to increase women’s presence in national governments depending on contextual factors within specific country frameworks.
Footnotes
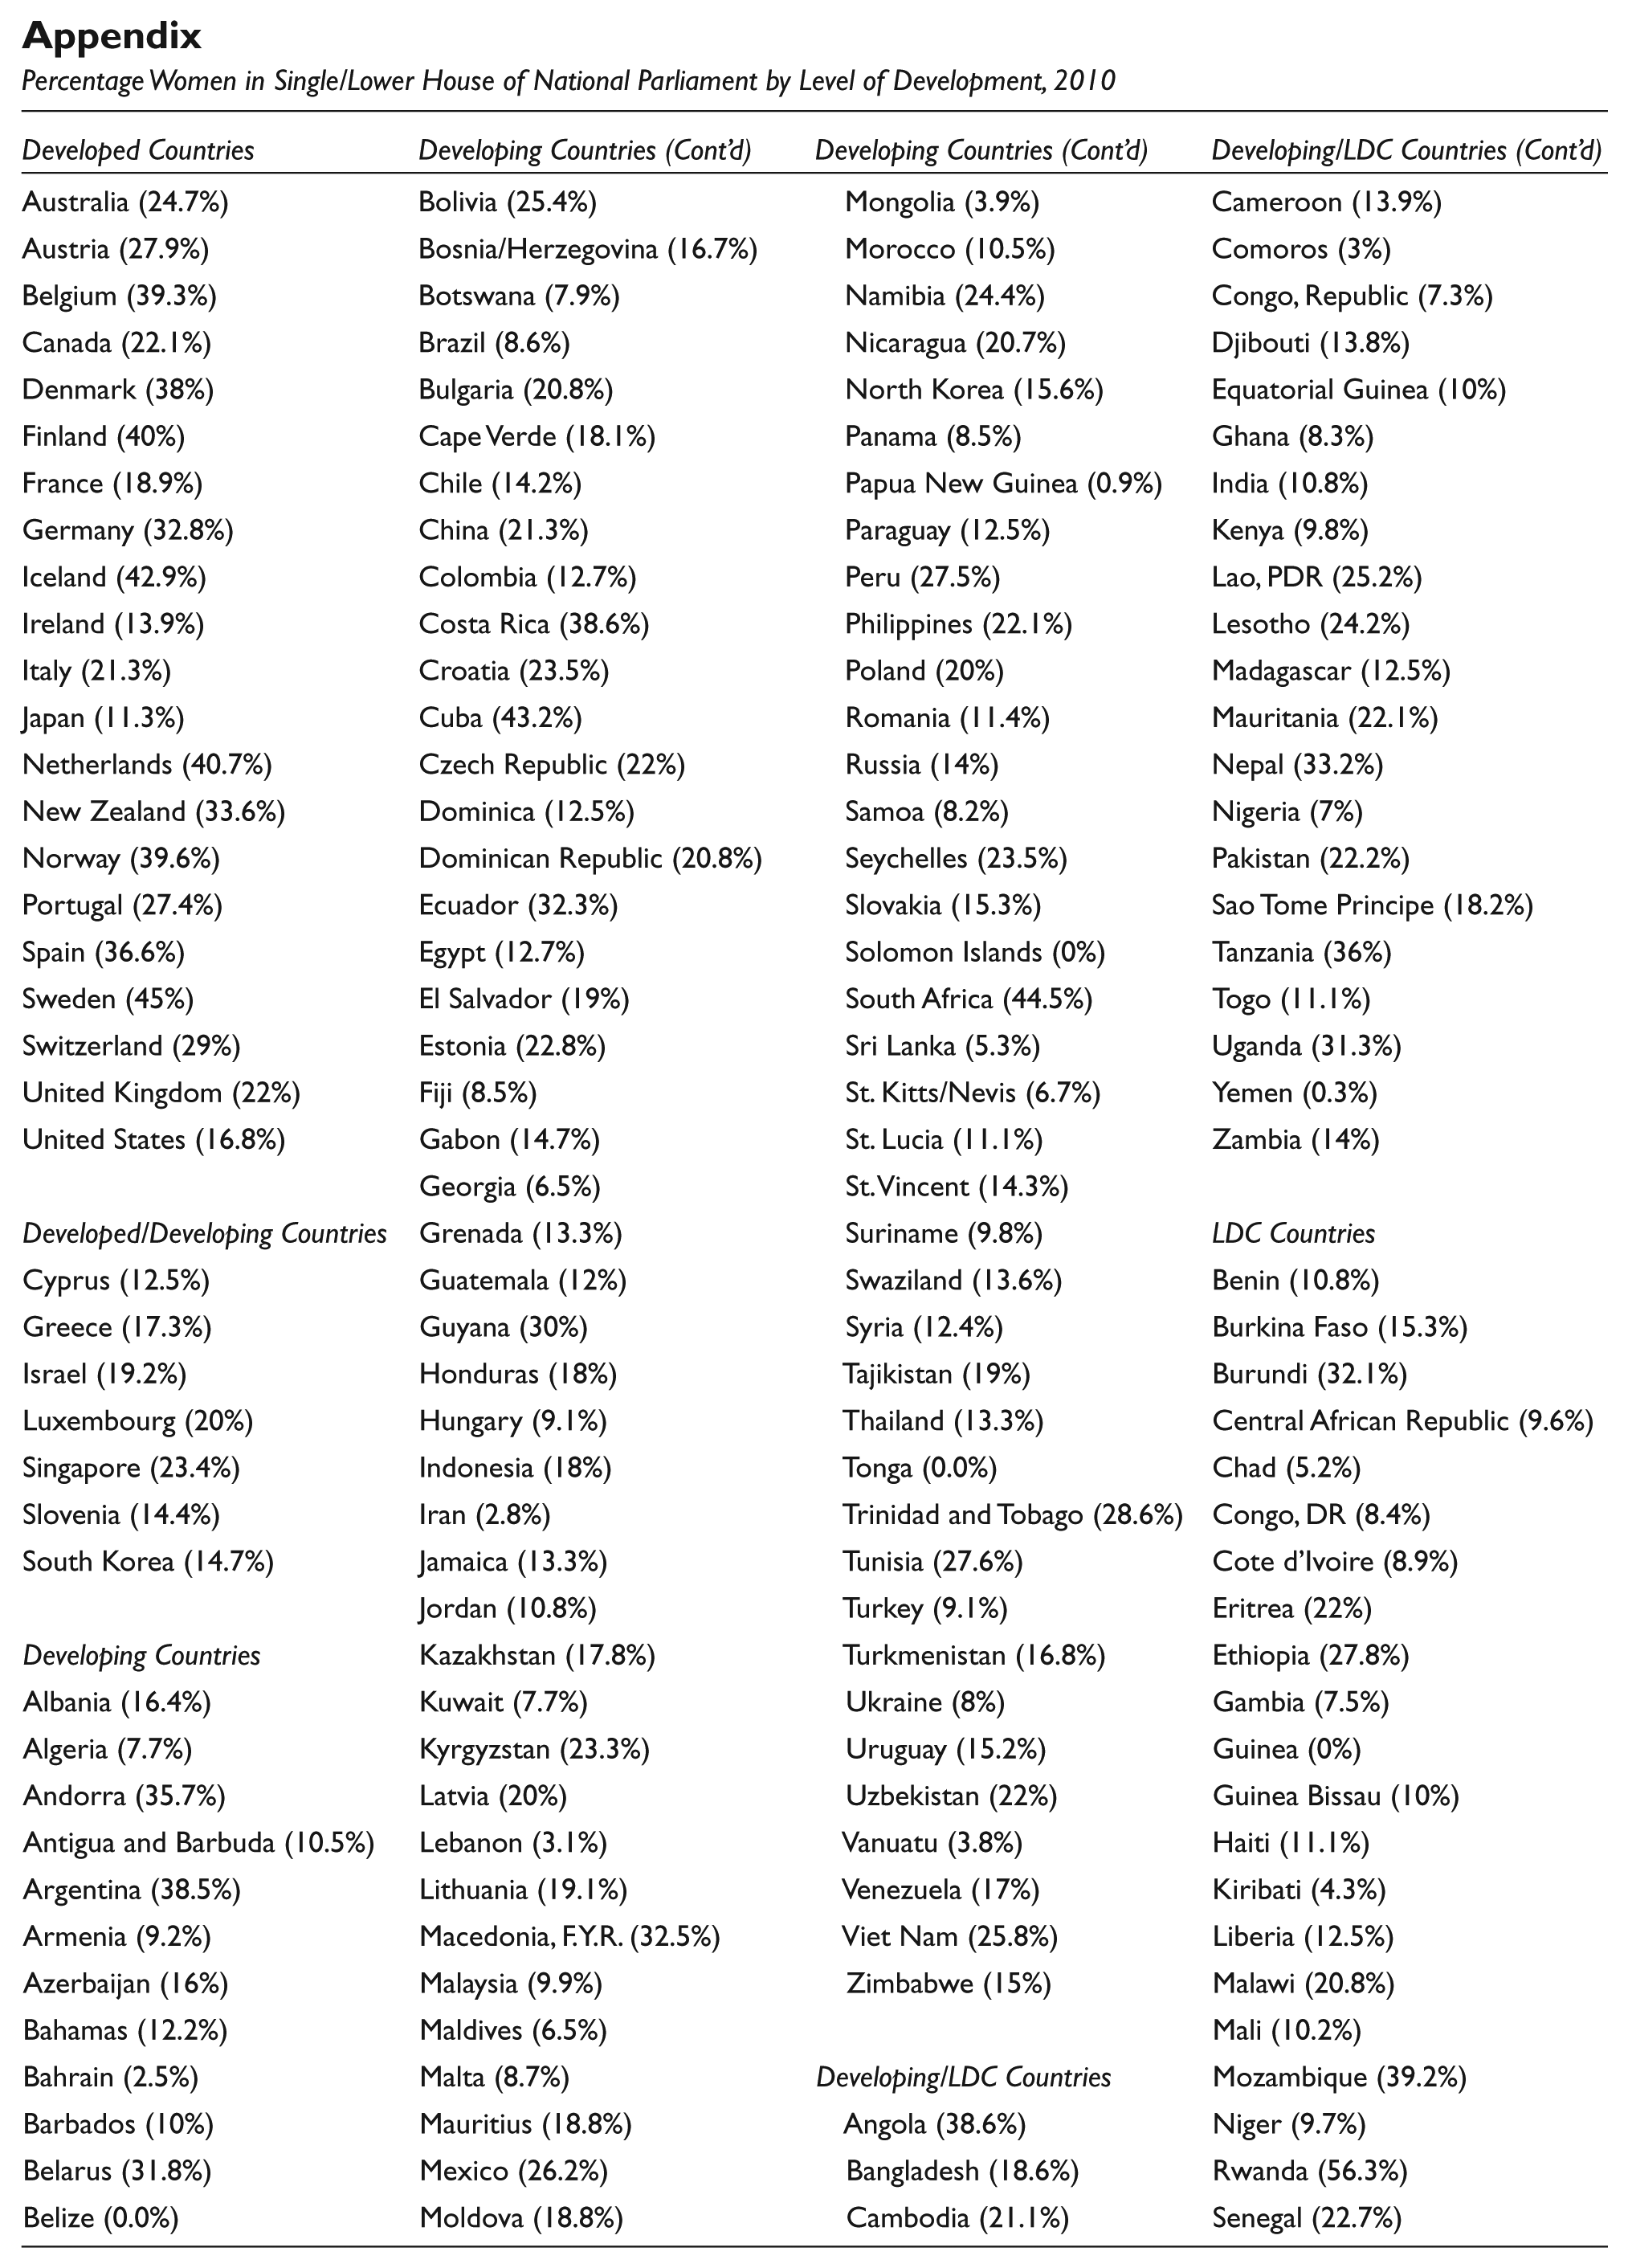
Appendix
Percentage Women in Single/Lower House of National Parliament by Level of Development, 2010
| Developed Countries | Developing Countries (Cont’d) | Developing Countries (Cont’d) | Developing/LDC Countries (Cont’d) |
| Australia (24.7%) | Bolivia (25.4%) | Mongolia (3.9%) | Cameroon (13.9%) |
| Austria (27.9%) | Bosnia/Herzegovina (16.7%) | Morocco (10.5%) | Comoros (3%) |
| Belgium (39.3%) | Botswana (7.9%) | Namibia (24.4%) | Congo, Republic (7.3%) |
| Canada (22.1%) | Brazil (8.6%) | Nicaragua (20.7%) | Djibouti (13.8%) |
| Denmark (38%) | Bulgaria (20.8%) | North Korea (15.6%) | Equatorial Guinea (10%) |
| Finland (40%) | Cape Verde (18.1%) | Panama (8.5%) | Ghana (8.3%) |
| France (18.9%) | Chile (14.2%) | Papua New Guinea (0.9%) | India (10.8%) |
| Germany (32.8%) | China (21.3%) | Paraguay (12.5%) | Kenya (9.8%) |
| Iceland (42.9%) | Colombia (12.7%) | Peru (27.5%) | Lao, PDR (25.2%) |
| Ireland (13.9%) | Costa Rica (38.6%) | Philippines (22.1%) | Lesotho (24.2%) |
| Italy (21.3%) | Croatia (23.5%) | Poland (20%) | Madagascar (12.5%) |
| Japan (11.3%) | Cuba (43.2%) | Romania (11.4%) | Mauritania (22.1%) |
| Netherlands (40.7%) | Czech Republic (22%) | Russia (14%) | Nepal (33.2%) |
| New Zealand (33.6%) | Dominica (12.5%) | Samoa (8.2%) | Nigeria (7%) |
| Norway (39.6%) | Dominican Republic (20.8%) | Seychelles (23.5%) | Pakistan (22.2%) |
| Portugal (27.4%) | Ecuador (32.3%) | Slovakia (15.3%) | Sao Tome Principe (18.2%) |
| Spain (36.6%) | Egypt (12.7%) | Solomon Islands (0%) | Tanzania (36%) |
| Sweden (45%) | El Salvador (19%) | South Africa (44.5%) | Togo (11.1%) |
| Switzerland (29%) | Estonia (22.8%) | Sri Lanka (5.3%) | Uganda (31.3%) |
| United Kingdom (22%) | Fiji (8.5%) | St. Kitts/Nevis (6.7%) | Yemen (0.3%) |
| United States (16.8%) | Gabon (14.7%) | St. Lucia (11.1%) | Zambia (14%) |
| Georgia (6.5%) | St. Vincent (14.3%) | ||
| Developed/Developing Countries | Grenada (13.3%) | Suriname (9.8%) | LDC Countries |
| Cyprus (12.5%) | Guatemala (12%) | Swaziland (13.6%) | Benin (10.8%) |
| Greece (17.3%) | Guyana (30%) | Syria (12.4%) | Burkina Faso (15.3%) |
| Israel (19.2%) | Honduras (18%) | Tajikistan (19%) | Burundi (32.1%) |
| Luxembourg (20%) | Hungary (9.1%) | Thailand (13.3%) | Central African Republic (9.6%) |
| Singapore (23.4%) | Indonesia (18%) | Tonga (0.0%) | Chad (5.2%) |
| Slovenia (14.4%) | Iran (2.8%) | Trinidad and Tobago (28.6%) | Congo, DR (8.4%) |
| South Korea (14.7%) | Jamaica (13.3%) | Tunisia (27.6%) | Cote d’Ivoire (8.9%) |
| Jordan (10.8%) | Turkey (9.1%) | Eritrea (22%) | |
| Developing Countries | Kazakhstan (17.8%) | Turkmenistan (16.8%) | Ethiopia (27.8%) |
| Albania (16.4%) | Kuwait (7.7%) | Ukraine (8%) | Gambia (7.5%) |
| Algeria (7.7%) | Kyrgyzstan (23.3%) | Uruguay (15.2%) | Guinea (0%) |
| Andorra (35.7%) | Latvia (20%) | Uzbekistan (22%) | Guinea Bissau (10%) |
| Antigua and Barbuda (10.5%) | Lebanon (3.1%) | Vanuatu (3.8%) | Haiti (11.1%) |
| Argentina (38.5%) | Lithuania (19.1%) | Venezuela (17%) | Kiribati (4.3%) |
| Armenia (9.2%) | Macedonia, F.Y.R. (32.5%) | Viet Nam (25.8%) | Liberia (12.5%) |
| Azerbaijan (16%) | Malaysia (9.9%) | Zimbabwe (15%) | Malawi (20.8%) |
| Bahamas (12.2%) | Maldives (6.5%) | Mali (10.2%) | |
| Bahrain (2.5%) | Malta (8.7%) | Developing/LDC Countries | Mozambique (39.2%) |
| Barbados (10%) | Mauritius (18.8%) | Angola (38.6%) | Niger (9.7%) |
| Belarus (31.8%) | Mexico (26.2%) | Bangladesh (18.6%) | Rwanda (56.3%) |
| Belize (0.0%) | Moldova (18.8%) | Cambodia (21.1%) | Senegal (22.7%) |
Acknowledgements
The author wishes to thank James Mahoney, Monica Prasad, Alberto Palloni, Jeremy Freese, and Charles Camic for their helpful comments on earlier drafts of this paper.
Declaration of Conflicting Interests
The authors declared no potential conflicts of interest with respect to the research, authorship, and/or publication of this article.
Funding
The authors received no financial support for the research, authorship, and/or publication of this article.