
Abstract
We examine how the growth in vote-by-mail and changes in voting technologies led to changes in the residual vote rate in California from 1990 to 2010. In California’s presidential elections, counties that abandoned punch cards in favor of optical scanning enjoyed a significant improvement in the residual vote rate. We also conduct the first analysis of the effects of the rise of vote-by-mail on residual votes. Regardless of the election, increased use of the mail to cast ballots is robustly associated with a significant rise in the residual vote rate.
A decade ago, the nation became aware that voting machines are not simply ciphers through which voters cast their ballots. Palm Beach County, Florida, provided the best illustration of how machine malfunction—exemplified by “hanging” and “pregnant” chad—and poor ballot design—exemplified by the “butterfly ballot”—could result in a vote being miscounted, if counted at all (e.g., R. C. Sinclair et al. 2000; Smith 2002; Wand et al. 2001).
The Florida fiasco resulted in a strong public demand for improved voting technology. This demand was made explicit by the Help America Vote Act (HAVA) of 2002, which mandated retirement of older voting technologies and resulted in billions of state and federal dollars being spent to retire old voting machines. The fiasco also led to a flurry of new research into the causes of “lost votes” due to voting technologies. 1 Within political science, this research has focused on explaining the residual vote rate in presidential elections as a function of the type of voting technology used by voters. (The residual vote rate is the percentage of ballots cast that either contain an over- or undervote for a particular election.)
Yet despite all of this research, at least two significant questions remain unanswered. First, despite the fact that American elections are noted for their long ballots, how voting technology affects residual votes for elections further down the ballot, such as for state and local offices or ballot measures, is still unknown. Second, at the same time that states and local jurisdictions across the country have retired their antiquated voting technologies, many of the same states and localities have seen a surge in voting by mail, either by liberalizing absentee ballot laws or mandating vote-by-mail altogether. How this transformation has affected residual vote rates remains unknown.
The purpose of this paper is to use recent elections in California as a laboratory to help address these two questions: (1) whether changes in voting technologies have the same effects in reducing lost votes in elections other than for president and (2) whether the rise of voting by mail has reinforced federal voting technology policy by lowering the number of lost votes in elections. The answer to the first question is a qualified “yes.” The answer to the second question is a qualified “no.”
California provides an apt laboratory for answering these questions because of its size, length of ballot, use of various voting technologies, and because of the importance of its ballot measures. Studying how voting technologies affect lost votes down the ballot is difficult in nationwide research because states are highly variable both in the number of offices that are up for election, including those on the statewide ballot, and in specifying the order in which offices appear on the ballot. The number of statewide offices in California is exceptional, which allows us to study the down-ballot effects with some precision. In addition, the general structure of the ballot is fixed across the state, allowing for local offices to be sandwiched between the statewide elections at the top and ballot measures toward the bottom of the ballot. 2 Moreover, because of the significant independent authority of the constitutional officers who are on the statewide California ballot, most of these positions are hotly contested. This minimizes (though does not eliminate) the problems that arise when studying low turnout elections. Finally, California is notable for the policy significance of its ballot measures. 3 Therefore, it is particularly important to understand how voting technologies affect residual vote rates for propositions as well as for elections.
Most importantly, California elections are administered at the county level. As a result, the adoption of new voting technologies was not coordinated by the state, but was conducted on a county-by-county basis. This fact allows us to control for demographic, election, and temporal fixed effects that might otherwise confound such an analysis.
Using a pooled cross-sectional time series dataset of California elections from 1990 to 2010, this paper finds the following:
The shift from Votomatic punch cards to optical scanning technologies has generally improved the residual vote rate in all types of elections in California. The transition from Votomatic punch cards to direct recording electronic technology (commonly known as “touchscreens”; henceforth “DREs”) in a few counties, which was reversed by a mid-decade decision of the Secretary of State, was also generally effective in reducing the residual vote rate, though less consistently than was the case with optical scanning.
The residual vote rate among California’s propositions has been reduced significantly because of the various rounds of voting machine replacement over the past decade. In 2008, for instance, we estimate that almost 107,000 more votes were counted in each of the ballot measure contests than would have been the case without the retirement of the Votomatic punch cards.
The rise of vote-by-mail in California has led to a steady rise in the residual vote rate up and down the ballot, undoing almost the entire benefit associated with improvements in voting technologies.
The remainder of the paper is organized as follows. The first section reviews “Previous Research” on the relationship between voting technology and residual votes. The second section reviews the “Data” that are analyzed in this paper. The third section “Method and Estimation” discusses issues of model specification and estimation. The fourth section reviews the “Results.” The fifth section is the “Conclusion.”
Previous Research
Research into the cause of lost votes since the 2000 Florida recount has focused on understanding how voting technologies influence whether the votes cast by voters—or that voters think they have cast—are in fact counted. A related question is whether there is something about particular technologies, especially the ballot layouts employed, that induce voters to abstain from or participate in particular elections on the ballot. The two questions are related empirically, but have different intellectual roots.
The second question, whether different technologies encourage abstention, was the focus of the voting technology literature before 2000, to the degree it existed. The dependent variable was “roll-off,” defined as the difference in the number of ballots cast for the election at the top of the ticket, usually president, and some election further down the ballot, including initiatives. The cause of roll-off was taken to be the evocatively termed “voter fatigue,” induced by the strain put on low-information voters, as they tried to navigate through a ballot that contained increasingly obscure offices, moving from top to bottom. This literature initially began with an interest in the effect of ballot design on roll-off, with the preeminent study being Walker (1966), which focused on ballot form (party list vs. office bloc). Eventually, research turned to the issue of voting technology itself.
Two consistent findings emerged from pre-2000 studies of roll-off that focused on voting technology. 4 First, mechanical voting machines regularly produced more roll-off than paper methods in voting on referenda. Second, electronic voting machines generally produced less roll-off in down-ballot elections.
Some of the earliest studies about voting technology and roll-off focused on ballot questions. These studies were in reaction to astonishingly high roll-off rates in referenda, comparing counties that used mechanical lever machines to counties that still used hand-counted paper ballots. For instance, Thomas (1968, Table 4) showed that the roll-off rates for constitutional revision referenda in Michigan held in 1958, 1960, 1961, and 1963 that were cast on paper ballots were 13, 13, 1, and −5 percent, 5 respectively, compared with rates of 39, 35, 17, and 5 percent in counties that used lever machines. 6
With only a couple of exceptions, the dependent variable in these older studies was roll-off, calculated as the difference between the total votes cast in the down-ballot election (or ballot question) and the election at the top of the ticket, even in those cases in which total turnout was reported by the state. Thus, the underlying behavioral model of this research—though never articulated directly—was that any over- or undervotes in the top election reflected a conscious abstention in that election. A notable exception was Asher, Schussler, and Rosenfield (1982), whose research was prompted by an inexplicable number of missing votes at the top of the ticket—roll-on, as it were—in an Ohio gubernatorial election.
Research into how voting technology can influence the act of voting shifted in response to Florida in two related ways. First, the office of concern moved to the top of the ballot, particularly in presidential years. Second, the dependent variable was recast as the “residual vote rate,” which was defined as total turnout minus the number of total ballots cast in a particular election, all divided by total turnout. Stewart (2011) recently reviewed this literature, finding numerous articles, books, and reports that have used the residual vote rate as a dependent variable. Almost all of these focus on the presidential election, with the only notable exceptions being Caltech/MIT Voting Technology Project (2001), Ansolabehere and Stewart (2005), Kimball and Kropf (2008), and Lott (2009). 7
In the mainstream post-2000 residual vote research, punch card systems consistently emerged as the biggest culprits in producing residual votes. The HAVA required that states retire this technology, in favor of DREs and optical scanners. One consequence of HAVA’s implementation is that roughly one million more votes for president were accounted for in the 2004 presidential election. The 2008 election showed comparable gains (Stewart 2010).
Despite all the research that has documented the effects of voting technologies on residual votes, two important questions remain unstudied. One is how voting technologies affect residual votes “down-ballot,” that is, for elections other than president or governor, especially ballot measures. Consequently, the pre-2000 interest in the effects of voting technology on the set of elections that are more consequential for state and local politics, and where technology appeared to have the biggest impact on outcomes, has been lost.
In a recent effort to initiate study of this question, Kimball and Kropf (2008) examined residual votes in 1,999 counties drawn from thirty four states in the 2004 presidential election. Their analysis demonstrated that like previous studies of residual votes, the type of voting technology employed had an important association with the residual vote rate. They also showed that the exact relationship between voting technology and residual vote rates was not the same at the presidential level compared with ballot measures. For example, they found that although punch cards were the worst-performing technology in terms of residual votes in presidential elections, punch cards were much better than lever machines or full-faced DREs in preserving votes on ballot measures.
However, their analysis was based on only one election year, choosing to study elections across thirty four states. Therefore, their analysis might not have fully controlled for the potential array of administrative, procedural, legal, and political differences that existed in that election over the set of states they study. In contrast, our panel study’s focus on California should shed better light on the causal connection between voting technologies and residual vote rates, while also keeping many administrative, procedural, and contextual factors constant (as our analysis is restricted to a single state).
Another important question that has been understudied is how residual vote rates differ by voting mode. Typically, residual vote studies assume that all of the ballots included in the analysis have been cast in identical ways in a county—with the same technology and using the same administrative procedures. While that assumption might not have been problematic in 2000, when the residual vote rate measure was invented and there were few ballots cast outside of polling places on Election Day, administrative practices have changed considerably since then. In some states like Oregon and Washington, all or nearly all ballots are now marked by voters before Election Day, outside of the administrative control of election officials, and sent by mail. In many other states (California being a prominent example), the number of ballots marked before Election Day and cast by mail has increased dramatically. In some places, voters can even vote before the election in a satellite-voting location (early voting).
Voters who mark their ballots outside a polling place or satellite-voting center cannot take advantage of technological means to check their marked ballots for common errors, like overvotes or undervotes. Thus, as vote-by-mail ballots are not subjected to the same checks for accurate recording of voter intent, we expect to find that residual vote rates will be greater for by-mail ballots compared with in-person ballots, all things being equal.
Data
The data from this paper were taken from the publication Statement of Vote, which is compiled after each statewide primary and general election by the California Secretary of State. These data include turnout (termed “total voters” in the report), number of residual votes (usually labeled “votes not cast in race”), and voting technology. When the number of residual votes was not reported explicitly, they were calculated by subtracting the number of votes for candidates or ballot measures from turnout.
The unit of analysis is the county-year. Counties are the appropriate geographic unit of analysis, because counties administer statewide elections. By obtaining data from multiple years, we create a panel dataset, which allows us to account for confounding county-specific effects in a simple, straightforward way that is described below, and which has been used in similar research in the past (Ansolabehere and Stewart 2005; Caltech/MIT Voting Technology Project 2001; Stewart 2006).
We gathered the relevant data for ballot measures, president, U.S. senator, and governor for the 1990–2010 period. We excluded the 1992 special election for U.S. senator, in which Diane Feinstein was elected to serve out Pete Wilson’s incomplete term. We also excluded ballot measures that appeared on primary ballots, because the electorates in those elections are significantly different from general elections, even taking into account that the electorates for on- and off-year general elections are likely to differ, as well.
Table 1 reports the statewide residual vote rates for presidential, gubernatorial, U.S. Senate, and proposition elections during this period. Overall, the residual vote rates have averaged, 1.7, 2.8, and 4.3 percent for president, governor, and senator, respectively. The presidential and gubernatorial elections are at the very top of the ballot in on- and off-years, respectively, so there is no surprise that these rates should be low. As stated in Section 13109 of the California Election Code, the U.S. Senate election is never at the top of the ballot and, in midterms, can be far down the ballot because all statewide positions appear above it. Therefore, it is unsurprising that the residual vote rate for U.S. Senate is always higher than the top-of-the-ballot elections, both overall, and in the year-by-year comparison.
Residual Vote Rates for President, U.S. Senate, and Ballot Measures, 1992–2008, and Governor, 1990–2010.
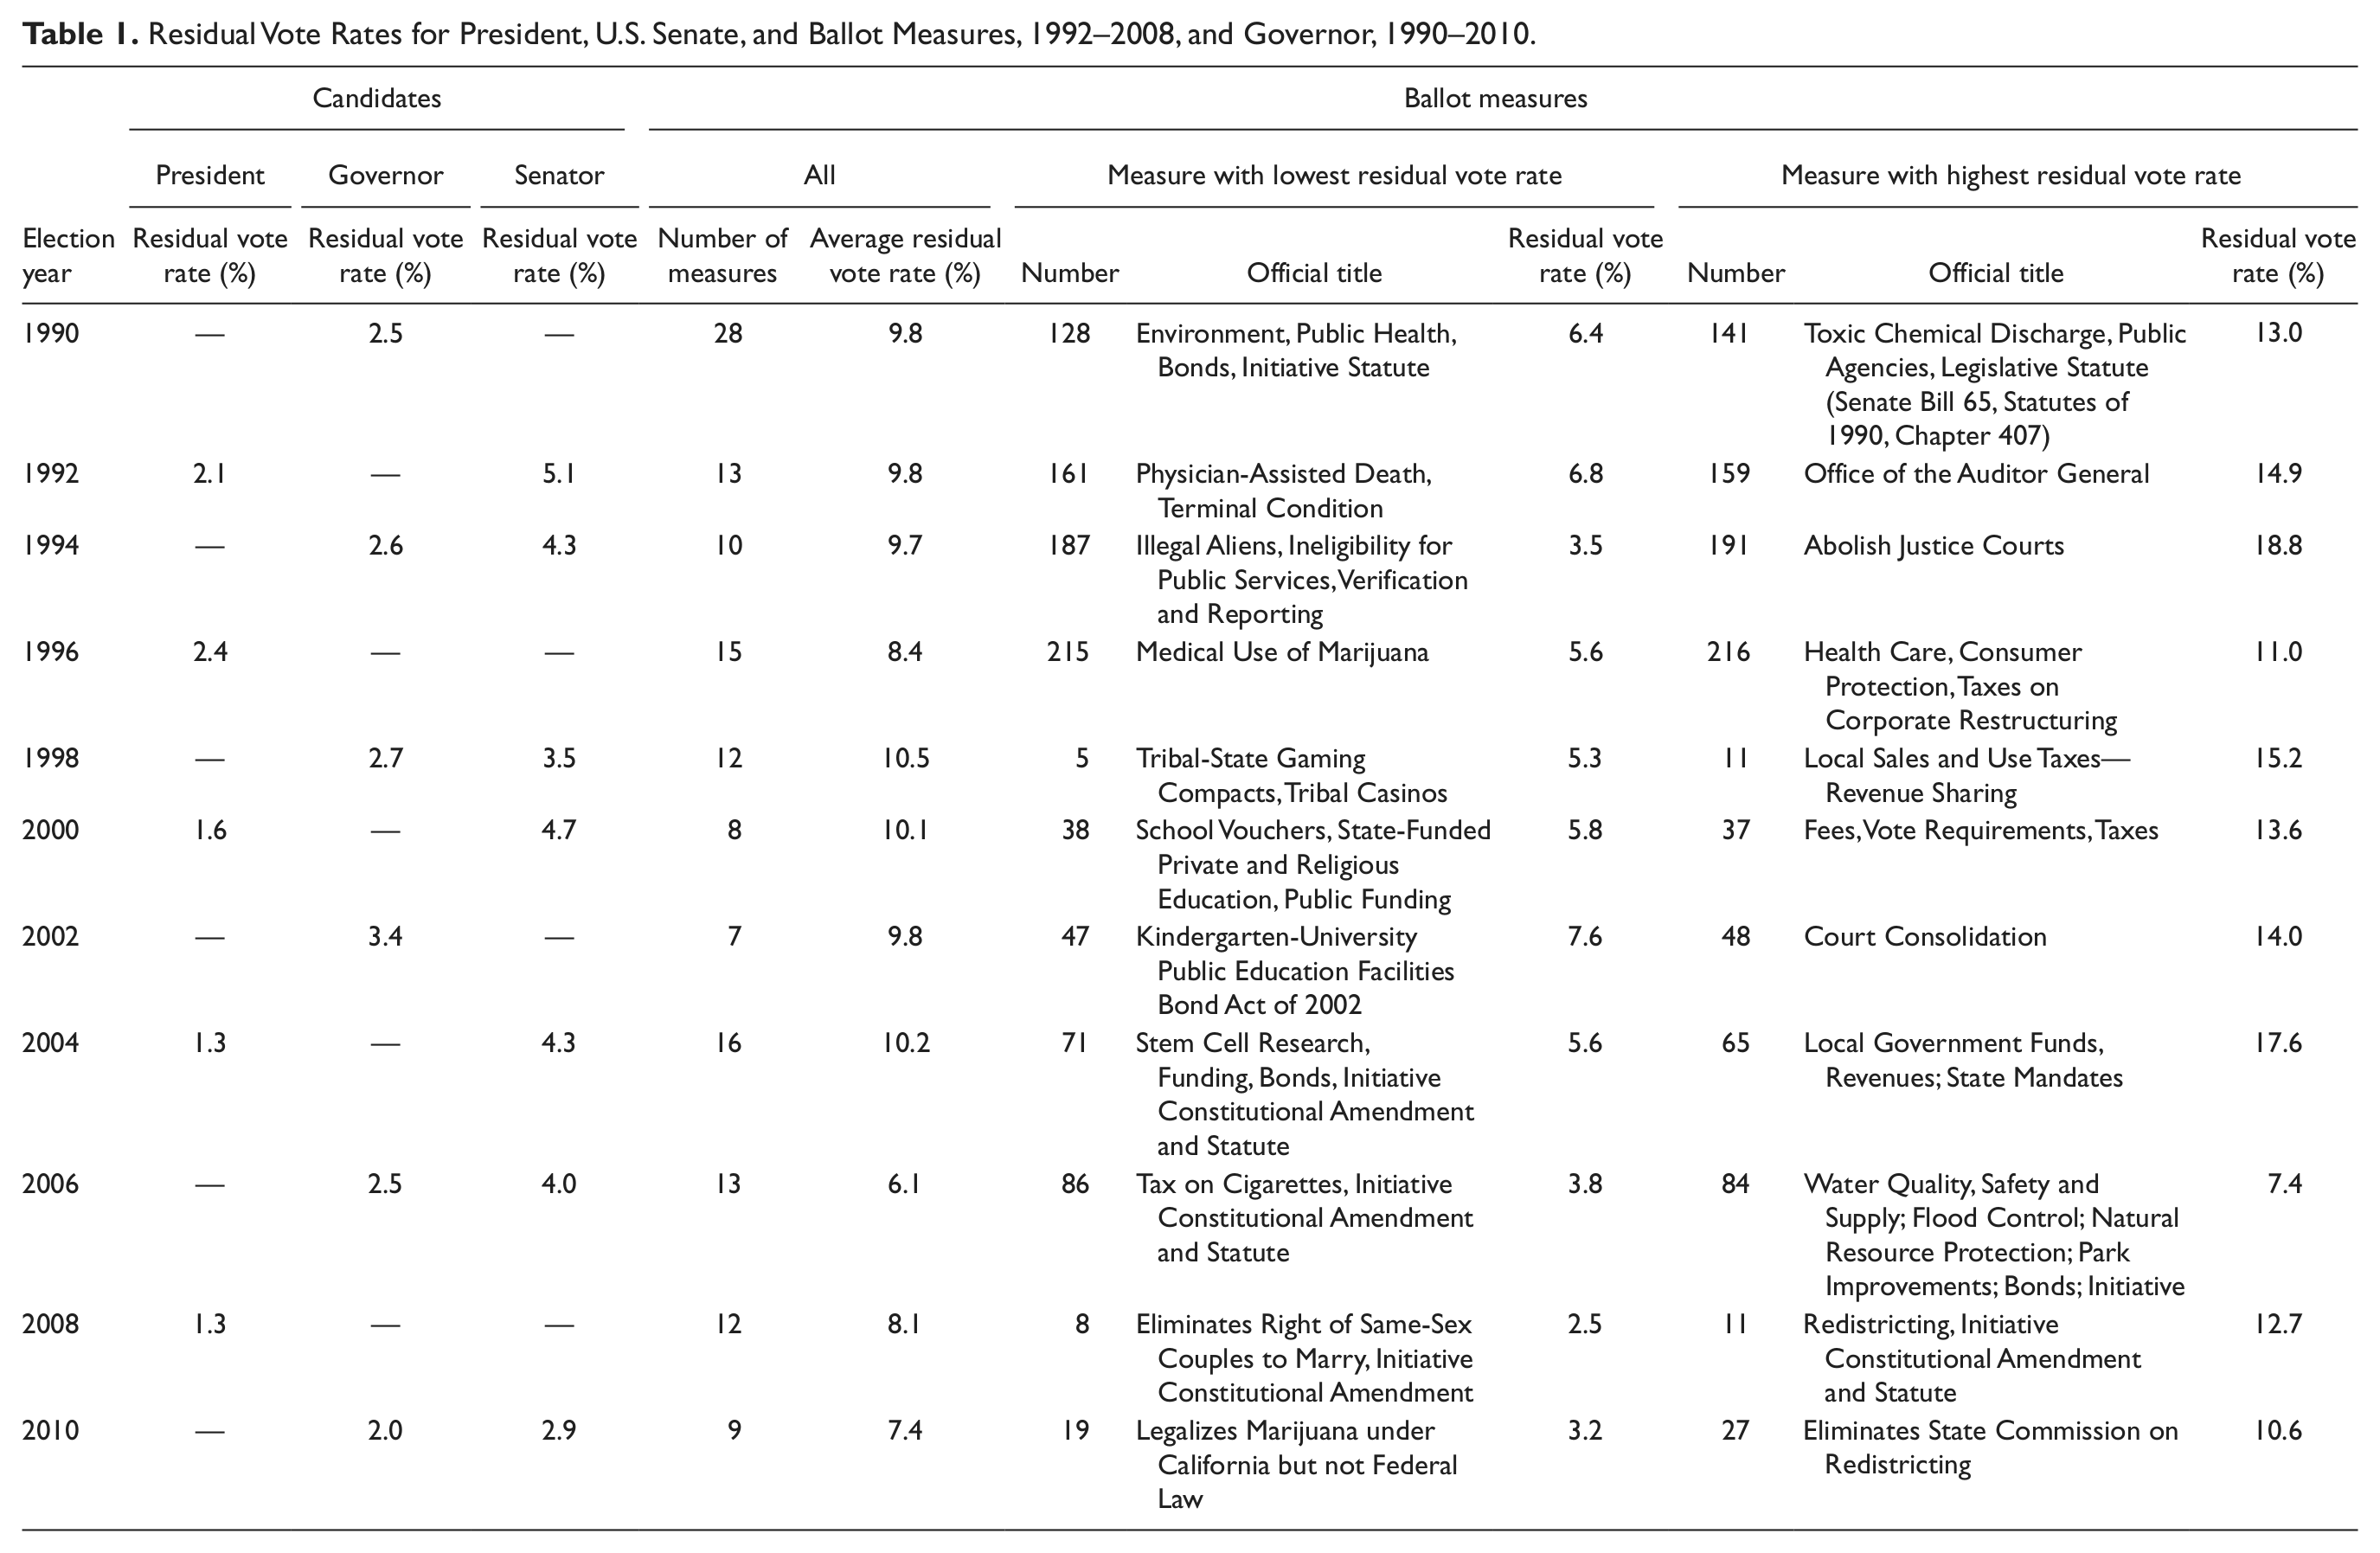
The overall residual vote rate for ballot propositions, 9.3 percent, is much higher than for the three statewide positions studied here, but there is considerable variability around this mean. While no proposition has ever had a lower statewide residual vote rate than the concurrent presidential or gubernatorial election, two propositions—187 (restricting public services provided to illegal immigrants) in 1994 and 8 (banning single-sex marriage) in 2008—had lower statewide residual vote rates than the concurrent senatorial election.
Method and Estimation
The focus in this paper is on the role that voting technologies play in determining the residual vote rate in California elections. The statistical technique used to quantify that role is fixed-effects regression, which is the technique used by Ansolabehere and Stewart (2005) and Stewart (2006) in studies of the residual vote rate nationwide. The idea behind fixed-effects regression is that much of the heterogeneity we observe in residual vote rates, both cross-sectional and longitudinal, can be explained by unobserved factors that are (assumed to be) constant for the period of the study.
In this study, we treat three factors as fixed, and account for them with a series of dummy variables: county, year, and ballot measure. This is in lieu of searching for measures of covariates specifically, which would leave some important confounding variables unmeasured, resulting in statistical bias. This strategy also helps with efficiency, which is important, because residual vote rates are highly variable, and the technology-related influences on them are generally small.
The county fixed effects take into account demographic and administrative practices that are associated with each county—factors that might lead to variations in residual vote rates across counties, even in the absence of technology variations. Counties that have a large number of residents who are poorly educated, are less politically engaged, or have poor eyesight are likely to have elevated residual vote levels. In addition, counties that regularly produce ballots that are confusing or that poorly inform their voters how to avoid making mistakes may also have elevated residual vote levels. Some of these factors, such as education, may be measurable, albeit imprecisely. However, most of these factors will be outside our practical ability to measure. If we do not control for them, we risk both bias and inefficiency. To minimize these risks, we include dummy variables for each county.
The year fixed effects take into account the many other factors specific to each election year that may influence the residual vote rate independently of voting technology. For instance, popular incumbents often run for reelection against low-quality challengers; the “disadvantaged” party in a year that is considered ex ante to be “bad” for that party (as 1974 was for Republicans and 2010 for Democrats) may be unable to attract high-quality challengers in those years. In these cases, the asymmetry in candidate quality may lead to partisans from the party of the low-quality candidate to abstain, rather than support, either a candidate whose views they do not endorse (the incumbent) or a candidate they do not believe can do the job (the challenger). In other cases, the presence of a strong third-party candidate may induce a few voters who would otherwise have abstained to make the unconventional choice. In each of these cases, the residual vote rate will expand and contract because of variations in deliberate abstentions. The inclusion of year-specific dummy variables will account for fluctuations in the residual vote rate that are due primarily to the candidates standing for election, making our estimates of the technology effects more precise.
The proposition effects similarly take into account factors specific to each ballot measure that influence the tendency to abstain. Previous research suggests that particular types of ballot measures tend to have higher residual vote rates than others. In particular, referenda placed on the ballot by state legislatures tend to have higher residual vote rates than citizen initiatives (Bowler, Donovan, and Happ 1992; Kimball and Kropf 2008; Magleby 1984; Mueller 1969). In addition, initiatives and referenda vary considerably in how easily they are understood by the average voter (Reilly and Richey 2011); they also differ considerably in the amount of attention they receive from the media, candidates, and political parties. These many factors may dictate how often voters abstain due to uncertainty or confusion. To take into account the tendency of some ballot measures to prompt more abstentions than others, we include a separate dummy variable for each measure. Because the ballot measure dummies are collinear with the year dummies, we omit the year dummies in the analysis of the ballot measures.
With the fixed effects providing estimates of the baseline residual vote rates, we focus on three other factors that vary across counties and across time—voting technology, turnout, and the prevalence of vote-by-mail.
Voting Technology
We measure voting technology two ways. First, we use a series of dummy variables to indicate whether county c used one of six different types of voting technology in year t. These technology types are central-count optical scanning, precinct-scan optical scanning, DRE, Votomatic punch card, DataVote punch card, and InkaVote. 8 Votomatic punch cards—the technology used by the most voters during this period—are the omitted category. 9
One technology type, the InkaVote, deserves special comment. 10 InkaVote was adopted by Los Angeles County beginning in 2003. Although technically an optical scan system, its design was an adaptation of the Votomatic punch card technology that Los Angeles County previously used. We have chosen not to fold the InkaVote into the central-count optical scan category for two reasons. First, the InkaVote really is a hybrid. Unlike the other optical scanning technologies, the InkaVote ballot is first placed in a vote recorder, like the Votomatic. The ballot is then marked like the old Votomatic system was, but with a felt-tipped pen replacing the stylus. Therefore, the InkaVote interface is fundamentally different from the other optical scan technologies. Second, because Los Angeles County has begun a process to assess whether the InkaVote system should be replaced, it is natural to ask how its unique system fares in comparison with the other standard voting technologies (Los Angeles Registrar-Recorder/County Clerk [LACRR] 2010).
We measure technology a second way, with a dummy variable equal to one in an election year in which a county first uses a particular voting machine, zero otherwise. Although intuition would suggest that the introduction of a new voting technology would tend to increase the residual vote rate, due to an increase in voter confusion, Ansolabehere and Stewart (2005) found that the effect was just the opposite—the introduction of new voting technologies tends to decrease the residual vote rate in top-of-the-ballot elections. However, there has been no research into whether the extra effort at voter education that usually surrounds the introduction of new voting equipment similarly leads to reduced residual vote rates among ballot propositions. Therefore, we enter this second dummy variable to test these effects in this context.
Turnout
One of the hypotheses to explain the longitudinal fluctuation in residual vote rates is that the surge of voters to the polls in particularly “hot” election years brings more inexperienced voters to the polls, thus producing more residual votes. Ansolabehere and Stewart (2005) found precisely this effect, when they controlled for the underlying size of the county or town administering elections. To control for the turnout surge effect on the residual vote rate, we include the natural logarithm of turnout for county c in election year t.
Vote-by-Mail
One factor that has been virtually overlooked in previous studies of the effect of voting technology on residual votes is the effect of voting by mail. Almost every study of residual vote rates has implicitly assumed that all voters are using the in-precinct voting machines to cast ballots, despite the fact that an increasing number of voters are using the mail to vote, rather than going to a polling place on Election Day (Gronke, Stewart, and Hicks 2010). 11 California is one state where the trend toward vote-by-mail has been swiftest. During the period covered by this paper, the percentage of ballots cast by mail has risen from 18 percent in 1990 to 48 percent in 2010. California has adopted a “permanent absentee” provision and has ceased using the term “absentee voting,” in favor of the label “voting by mail.” Alpine County has voted entirely by mail in general elections since 1994, as has Sierra County since 2004.
The assumption that all ballots in a county are cast in-precinct is problematic in estimating the effect of voting technology on the residual vote rate for several reasons. First, the voting technology used to cast and tabulate mail ballots can differ. This is particularly true when a county uses a DRE for its polling place method, because it must use an optical scanning technology to handle the absentee ballots. But this is also true when optical scanning is the in-precinct method; although the ballot interface for mail-in ballots may be the same as in-precinct ballots, absentee ballots that are scanned centrally are not subjected to the same check for accuracy as the ballots cast in-precinct. Keep in mind that in-precinct optical scanning of ballots typically will flag over- and undervotes, and voters whose ballots have such potential errors will be given the opportunity to resolve any errors. Even when the same technology is used for in-precinct and absentee voting, the election process in the two settings will be quite different in any event, and it would be a mistake to estimate the effect of machines on the residual vote rate without taking this into account.
It would be ideal to estimate the residual vote rate separately for voters using the two main voting modes in California, in-precinct and vote-by-mail. However, only a few counties report the residual vote rates for in-precinct versus vote-by-mail modes separately; none report this for the whole period covered by this paper. As an alternative, we have entered the percentage of ballots cast by mail for county c in election year t as a control variable into our estimates for the residual vote rate for in-precinct voters. This gives us an estimate for the effect of vote-by-mail on the total residual vote rate and controls for the use of absentee ballots in our estimation of the effects of other independent variables such as voting technology. 12
Results
Table 2 reports the results of the estimation, comparing residual vote rates of presidential, gubernatorial, and senatorial elections with those of the ballot measures voted on in these same statewide elections. 13 To help focus on the coefficients associated with voting technologies, Figure 1 graphs the values of the voting technology coefficients, along with error bars that depict the 95 percent confidence intervals. The top half of the graph groups the coefficients first by voting technology, then by election; the bottom half groups first by election, then by voting technology. The Votomatic punch card, the baseline category, is indicated with the horizontal line at zero along the y axis.
Fixed-Effects Regressions.
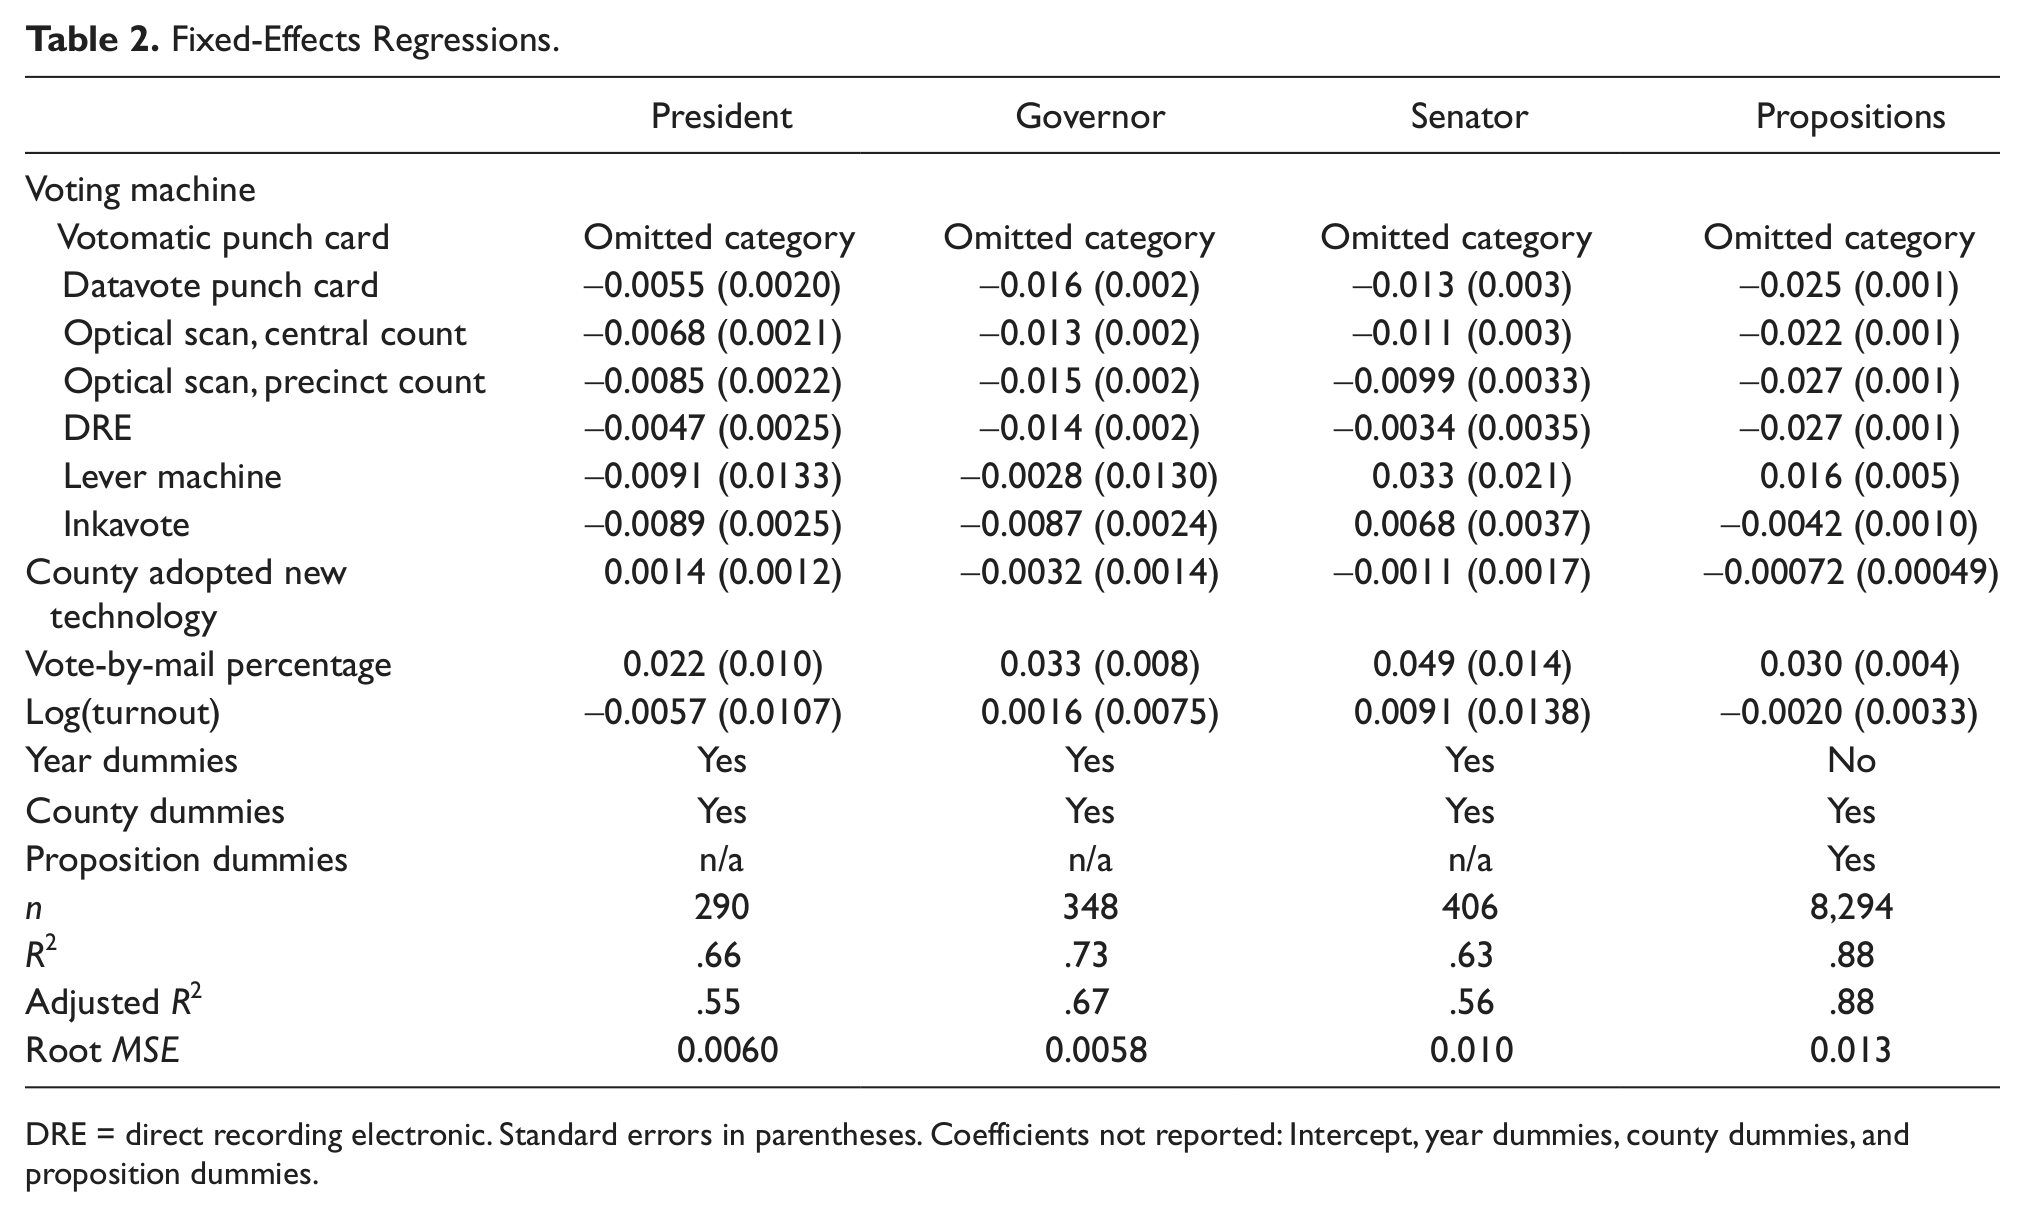
DRE = direct recording electronic. Standard errors in parentheses. Coefficients not reported: Intercept, year dummies, county dummies, and proposition dummies.
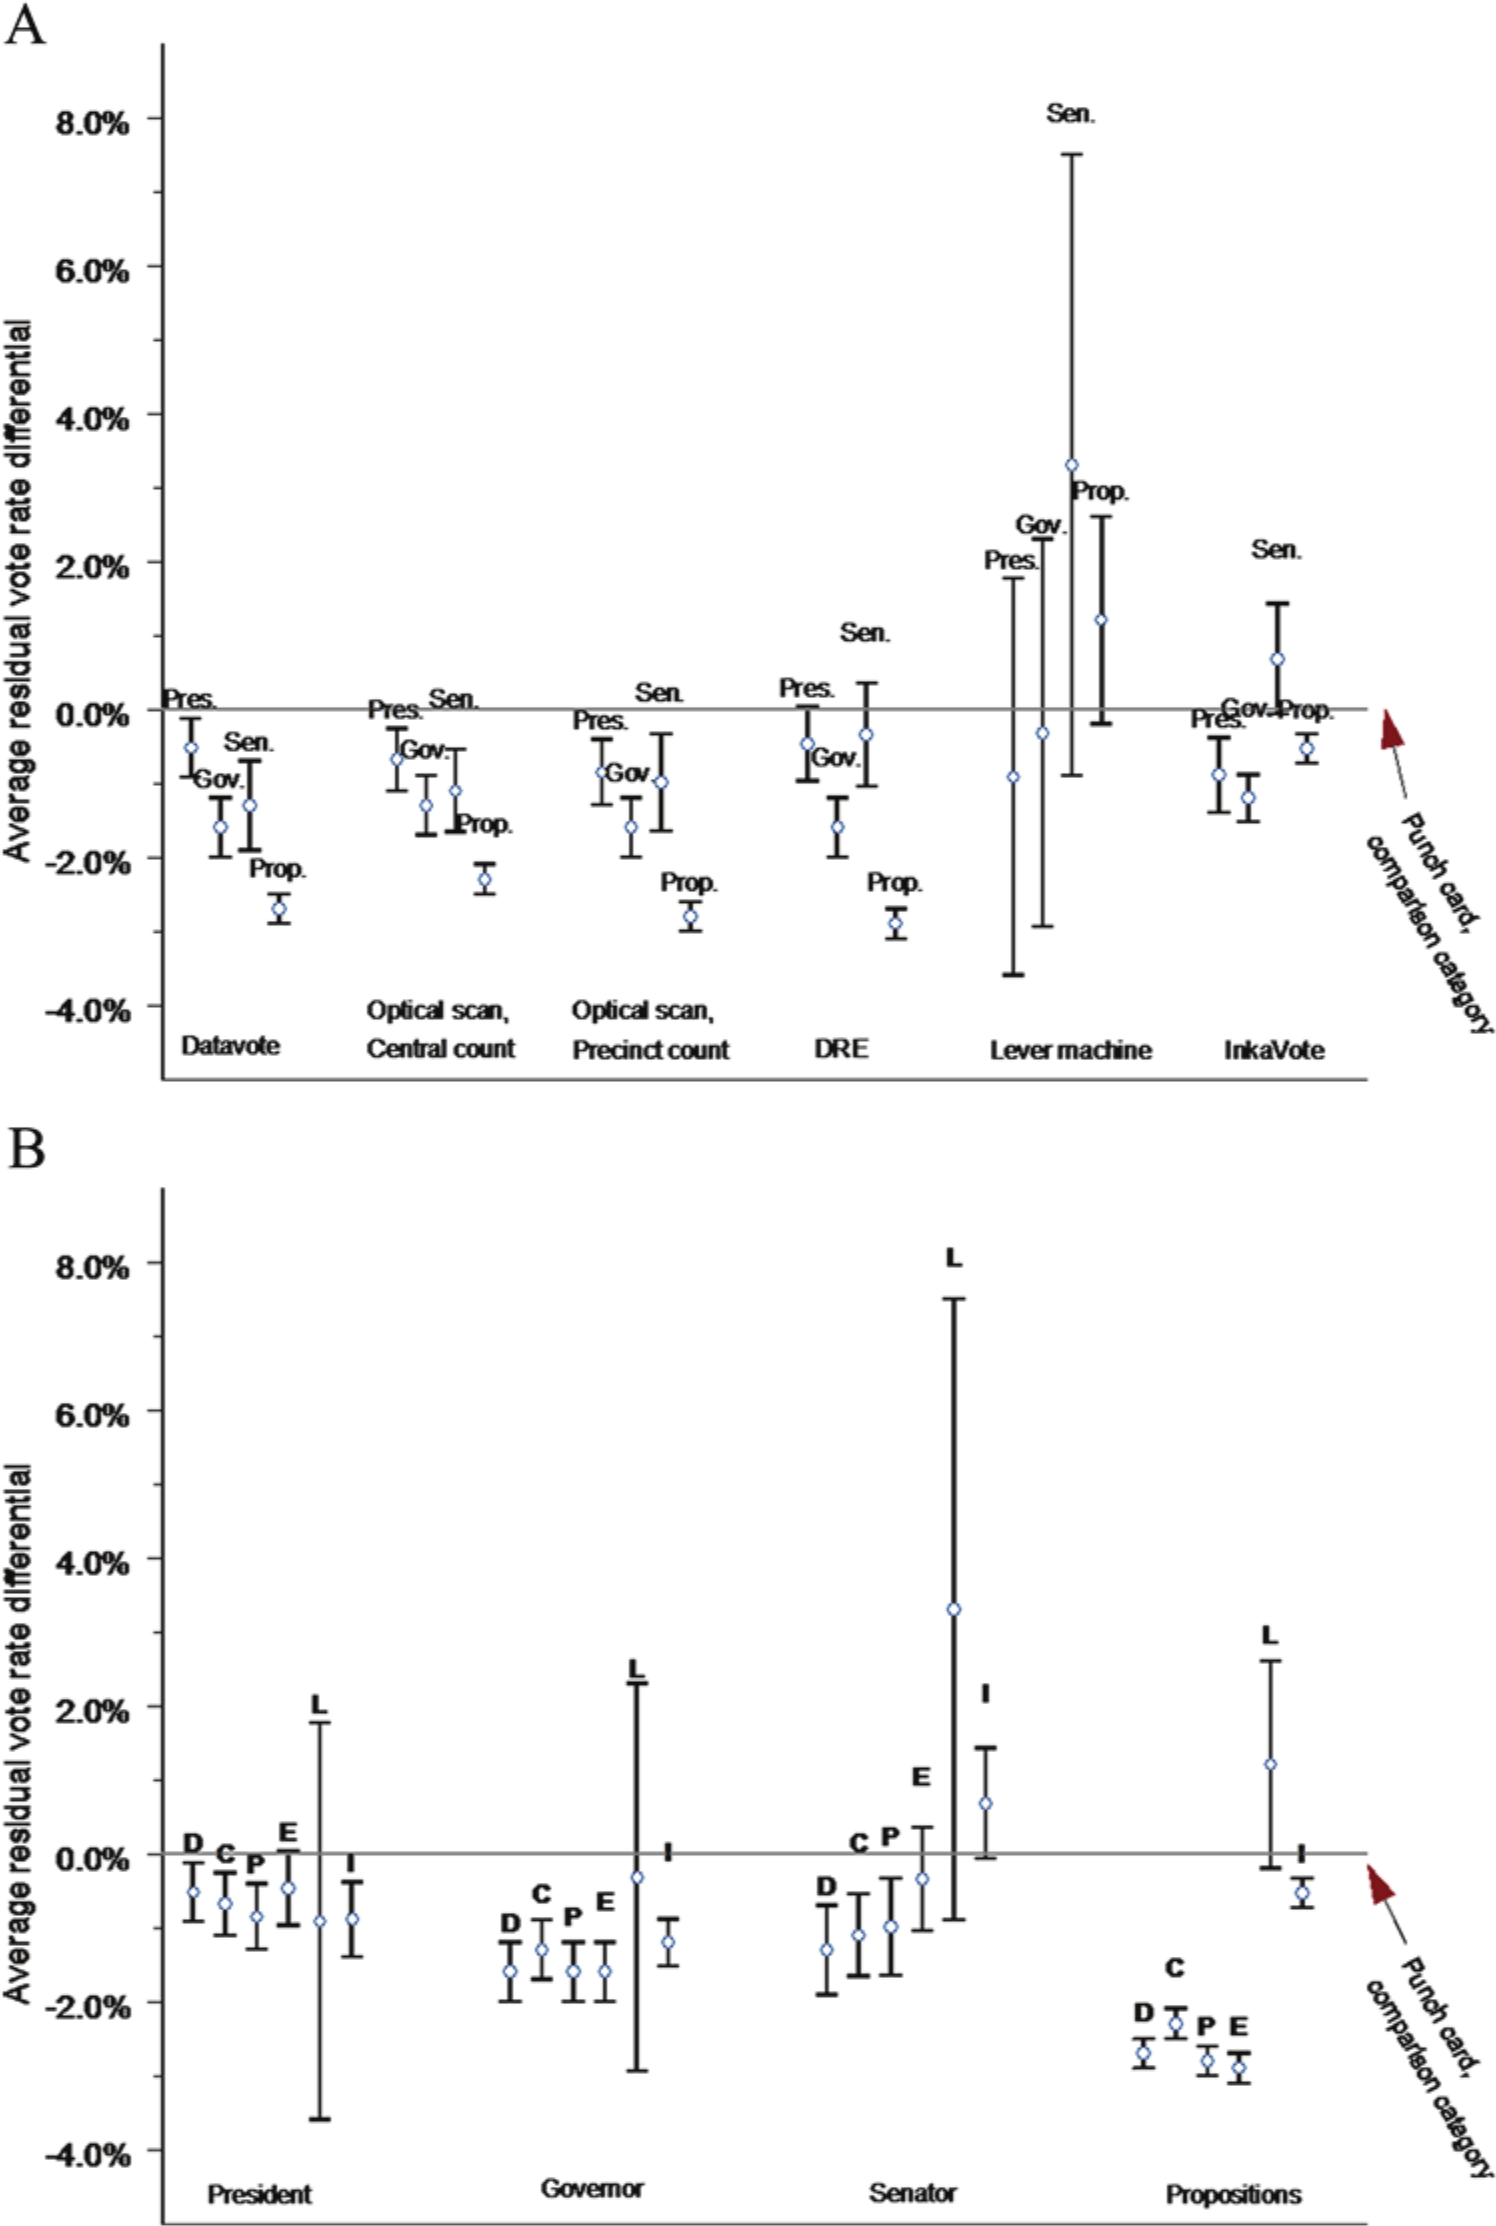
Comparison of voting-technology-related coefficients from Table 2. (A) By method. (B) By office.
The results for the three types of elections, president, governor, and senator, are similar to those found in other nationwide studies. A switch from Votomatic punch cards to central-count optical scanning resulted in a reduction in the residual vote rate of between 0.7 and 1.3 percentage points for presidential, gubernatorial, and senatorial elections. The effect of going from Votomatic punch cards to precinct-count optical scanning is quantitatively similar, resulting in a reduction in the residual vote rate of between 0.9 and 1.5 percentage points.
For counties that abandoned Votomatic punch cards in favor of DREs, the results are similar, although the residual vote rate reductions are on the whole smaller and less precisely estimated. The effect of moving from Votomatic punch cards to DREs is not statistically different from zero (at traditional levels of significance) in the case of presidential or senatorial elections, but resulted in a reduction of around 1.4 percentage points in gubernatorial elections.
The InkaVote system yielded improvements of 0.9 percentage points in the cases of presidential and gubernatorial elections. However, the results also suggest that InkaVote may be associated with an increase in the residual vote rate in senatorial elections, although the standard error is large enough that we could only reject the null hypothesis at p < .07.
As an aside, the coefficients associated with the DataVote punch cards also indicate that these machines, which were also phased out after the passage of HAVA, produced residual vote rates at roughly the same levels as optical scan systems and DREs. This is evidence that HAVA was a mixed blessing; for many counties newer technologies resulted in fewer lost votes, but for the voters in the twenty-one counties that were required to relinquish DataVote punch cards after 2000, the cost of adopting new machines yielded no significant reward, in terms of lost votes.
Overall, all the optical scanning technologies, including InkaVote, showed a significant residual vote rate improvement in the presidential and gubernatorial elections, whereas counties that adopted DREs to replace Votomatics only clearly showed improvements in the gubernatorial elections. Only the optical scanning technologies showed clear improvement with the down-ballot U.S. Senate elections, and, indeed, the InkaVote system did not perform better than the old Votomatic punch cards.
Turning now to the results pertaining to ballot measures, we see substantial improvements in residual vote rates from both types of optical scanning and DRE systems, and only a small improvement from InkaVote. Los Angeles County reduced its average proposition-related residual vote rate by 0.42 percentage points, an improvement only one-quarter to one-fifth the size of the improvement for counties that moved to the other new technologies.
Overall, the effects of the voting technology changes in California during the past decade have been consistent. Counties moving to optical scanning have seen a definite drop in the residual vote rate in top-of-the-ballot elections, and an even more significant drop in the residual vote rate for propositions, while having a mixed effect on the residual vote rate for senator—an election nearer the bottom of the ballot. For the InkaVote, the results have also been mixed, showing substantial improvements in presidential and gubernatorial elections, possible deterioration in U.S. Senate elections, and only a small improvement for ballot measures.
Table 2 also reports estimates for the effects of adopting new voting technology (regardless of the technology employed) and fluctuations in turnout. The adoption of new technologies was not related to any change in the residual vote rate in the case of president, senator, or propositions, only having the hypothesized effect in the case of governor. The turnout fluctuation effects are also statistically insignificant, a result that differs from previous research.
Table 2 also reports the vote-by-mail coefficient, which is positive and statistically significant in each estimation. The interpretation of the coefficient is straightforward—it represents the estimated change in the residual vote rate if a county moves from no voting by mail to complete vote-by-mail. The size of the vote-by-mail coefficient is larger than the size of the coefficient for any voting technology.
The vote-by-mail coefficient is always large and positive, whereas the coefficients associated with most new voting technologies in most settings are negative, and this suggests that the lost votes recovered by California through the modernization of voting technologies may be undone by the trend toward more voting by mail.
To test this supposition, we estimated, for each county, changes in the residual vote rate from the presidential elections of 1992 to 2008 due to changes in voting technologies, and due to the growth in voting by mail. The details of these calculations are contained in Table A1 of the online supplemental appendix. Here, we summarize those calculations.
We start by noting for each county turnout in the 1992 and 2008 presidential elections the percentage of ballots cast by mail in 1992 and 2008, along with the change across the two years, the type of voting equipment used in 1992 and 2008, and the estimated change in the residual vote rate from 1992 and 2008 based on changes in voting technology, using the coefficients from Table 2. We then calculate the estimated number of votes represented by this coefficient by multiplying it by turnout for 2008. Negative values indicate an estimated reduction in the residual vote in 2008 due to technology changes since 1992. For instance, for Alameda County, we estimate that the change from punch cards in 1992 to precinct-count optical scanning in 2008 resulted in a reduction in the number of residual votes in 2008 by 5,343 (≈ −0.85% × 628,545).
We then estimate the number of residual votes due to changes in the vote-by-mail rate in presidential elections by multiplying the relevant coefficient in Table 2 by the change in the vote-by-mail rate and the turnout for 2008. For instance, for Alameda County, we estimate that the growth in the vote-by-mail rate from 12.7 percent in 1992 to 48.3 percent in 2008 resulted in an increase in the number of residual votes in 2008 by 4,925 (≈.022 × [48.3% − 12.7%] × 628,545).
On net, improvements in voting technology roughly counterbalance the rise of residual votes due to the growth in vote-by-mail in presidential elections. The estimated effect of the voting technology improvements since 1992 is a reduction in the number of residual votes in the 2008 presidential election of 88,173; the vote-by-mail trend, on the other hand, has produced an increase in the number of residual votes of 73,868. That nets out to a decrease in residual votes in presidential elections of 14,305, or an overall decrease in the residual vote rate of 0.10 percentage points due to these two changes in election administration in California.
Discussion and Conclusion
This paper builds on prior research to estimate how voting technologies affected the number of lost votes in California over the past two decades. Like the studies that began the analysis of residual votes post-2000, we used a panel dataset to estimate the impact of changing voting technologies on the residual vote rate. Building on past studies, we added two wrinkles. First, we added analysis of the rise of vote-by-mail, which has been the other major change in how the electorate votes, especially in the west, since 2000. Second, we added analysis of elections beyond the presidential election, comparing across three major statewide elections (president, governor, and U.S. senate) and the very significant set of ballot propositions that also dominate the politics of the Golden State.
The part of this paper that is parallel with past research produced similar findings to that earlier research, particularly in answering the core question of whether changing voting technologies can help address the problem of lost votes due to voting technologies. In California’s presidential elections over the past two decades, counties that have abandoned punch cards in favor of optical scanning have enjoyed a significant improvement in the residual vote rate, which was the primary goal of the HAVA’s mandated retirement of these older technologies. Among these counties, the effect was the addition of almost 32,000 additional votes to the tally in 2008. The effect of Los Angeles County’s adoption of the InkaVote system can be credited with the addition of another 30,000 additional votes in the statewide tally. That increase is the equivalent of adding a county the size of Nevada County to California.
The added features of this paper bring greater nuance to past findings. First, we show that findings that pertain to the presidential election do not necessarily translate to other elections, neither the prominent ones near the top of the ballot nor potentially arcane ones among the ballot propositions. As far as voting technologies are concerned, there is a consistent finding that abandoning Votomatic punch cards in favor of optical scanning produced an unambiguous increase in counted votes. The InkaVote system for Los Angeles has been a mixed success, performing very well in presidential and gubernatorial elections, fairly well for ballot propositions, and poorly in Senate elections. Statistically speaking, DREs prove no better than Votomatic punch cards in presidential and senatorial elections but much better than them in gubernatorial elections and ballot propositions. 14
We also conducted the first analysis of the effects of the rise of vote-by-mail on residual votes and find trends that should cause election reformers pause. Regardless of the election, increasing the percentage of voters in a county using the mail to vote is associated with a rise in the residual vote rate in that county. The effect is so strong that we estimate that the rise of voting by mail has mostly wiped out all the reductions in residual votes that were due to improved voting technologies since the early 1990s.
These findings have implications for policymaking in California, of course, but they also have implications for thinking about the most important issues in how elections are run throughout the United States. In particular, they are relevant to considering the trade-off between accuracy and convenience. 15 Ever since election administration became more salient following the 2000 presidential election, the debate has often focused on accuracy and convenience. Because it was a key feature of the Florida controversy in 2000, the issue of the accuracy of voting machines, broadly considered, has been well-studied and the subject of important state, local, and federal legislation since 2000. As reported here and elsewhere, the result has been to improve significantly the accuracy of the voting experience for average voters since 2000. Greater convenience in voting, such as making vote-by-mail easier, clearly benefits existing voters if we measure the benefit in terms of time spent voting. And many studies have focused on the convenience of voting by mail. (See the summary of this literature in Alvarez, Levin, and Sinclair 2011.) The findings in this paper suggest that this convenience comes at a cost, which is a significantly greater chance that the vote will not be counted once it is received at the county election office. Yet the costs of convenience have not been subjected to the same degree of skeptical, scientific scrutiny, and the results here suggest they should be. If we combine this with the significantly greater likelihood that mail ballots may not be received by the county election office in time to be counted in the first place (Alvarez, Hall, and Sinclair 2008; Stewart 2011), there are serious questions about whether the cost of convenience is good for the functioning of the electoral system.
This is not to say that the rise of the vote-by-mail system is unambiguously bad, just that its full array of costs and benefits have not been subjected to the necessary scrutiny. If nothing else, we hope that this article will prompt further research into the matter.
While this article extends previous analysis in new directions, it opens up new research that should be done to verify and hone its findings. In particular, the effect of the rise of vote-by-mail has been estimated here using an aggregate measure of how many voters in each county vote absentee in each election. A more accurate way of estimating this effect would be to study separately the residual vote rate in each county, separating ballots received by mail from ballots cast in person (either on election day or in early voting). Unfortunately, few California counties currently report election returns this way, and we will be unable to make much more progress on this question until they do. In a related fashion, some studies (Bergman and Yates 2009; Kousser and Mullin 2007) attempt to take advantage of provisions in California law that require some voters in certain precincts to vote by mail in a quasi-random fashion to estimate the effect of vote-by-mail on turnout, using a “natural experiment” design. It would be quite possible to extend these studies to have the residual vote rates of these ballots compared with a matched sample of precincts in which voters were not required to vote by mail.
Finally, the results of this paper have implications for the current question in the largest electoral jurisdiction in America, Los Angeles County, about the future of its election system. First, InkaVote has had mixed results. It has reduced the number of lost votes in presidential elections, but considering the lopsided margins California has given Democratic presidential candidates over the past decade, this improvement has had little impact on the actual vote outcome. The statewide elections tend to be closer and, of course, are state offices. Therefore, Los Angeles County voters have more at stake. For these statewide elections, InkaVote ranges from being as good as conventional optical scanning systems to being no better than the discredited Votomatic punch cards.
Second, the results of this paper suggest that to fully assess the quality of a voting technology, it is important to assess it at various levels of the ballot. What one finds at the very top will not necessarily be found at the bottom. This suggests that as Los Angeles County assesses the usability of a new system, officials should not simply stop at making sure the new system helps voters cast their intended vote in high-profile elections.
Third, the results in this paper suggest that Los Angeles County, along with other counties, should hesitate before encouraging more residents to vote by mail. Admittedly, the results concerning voting by mail are preliminary and based on a blunt estimation technique, but the results are surprisingly clear nonetheless: more voting by mail is associated with more residual votes. If the goal is to ensure that every vote counts, measures that increase the convenience of in-precinct voting would be much superior to those that encourage a new surge in mail-in balloting.
Footnotes
Authors’ Note
The views, opinions, and estimates expressed in this paper are those of the authors.
Declaration of Conflicting Interests
The author(s) declared no potential conflicts of interest with respect to the research, authorship, and/or publication of this article.
Funding
The author(s) disclosed receipt of the following financial support for the research, authorship, and/or publication of this article: This research was conducted with financial support from the James Irvine Foundation and the John S. and James L. Knight Foundation.