



Abstract
The spread of Internet and mobile phone access around the world has implications for both the processes of contentious politics and subsequent reporting of protest, terrorism, and war. In this paper, we explore whether political violent events that occur close to modern communication networks are systematically better reported than others. Our analysis approximates information availability by the level of detail provided about the date of each political violent event in Africa from 2008 to 2010 and finds that although access to communication technology improves reporting, the size of the effect is very small. Additional investigation finds that the effect can be attributed to the ability of journalists to access more diverse primary sources in remote areas due to increased local access to modern communication technology.
Recent technological and methodological innovations offer improved access to information from conflict zones that previously were hidden from view. The ability to collect and analyze event data provides contemporary scholars with opportunities to explore micro-level mechanisms of repression, mobilization, and strategies of violence (K. Gleditsch, Metternich, and Ruggeri 2014).
Yet, we know little about possible bias in the data provided by projects such as the Uppsala Conflict Data Program (UCDP), Armed Conflict Location & Event Data Project (ACLED), or the Political Instability Task Force Worldwide Atrocities Dataset. In contrast to the extensive literature on bias in newspaper-sourced data (Earl et al. 2004; Fleeson 2003; Franzosi 1987; Galtung and Ruge 1965; Snyder and Kelly 1977; Woolley 2000), there have been few efforts to explore the quality of “Big Data” in the Internet age (notable exceptions include Price and Ball 2014; Weidmann 2015, 2016).
In this paper, we investigate whether access to communication technology can account for spatial variation with regard to the quality in conflict data. Drawing on the media studies literature (Domingo and Paterson 2011; Fenton 2010), we expect journalists who directly can be in contact with primary sources through Internet and mobile phones will be able to provide more detailed reports about political violence. Considering that details are essential for data collection projects to identify perpetrators, severity, and targets for political violence (Kreutz 2015b), we contend that even a marginal improvement in quality may substantially influence information used in much contemporary conflict scholarship. In particular, our study may be important for the growing interest in whether modern communication technology assists organized crime, terrorism, or insurgency (Andreas 2002; Pierskalla and Hollenbach 2013; Shapiro and Weidmann 2015; Weimann 2006). If, as we expect, information about violence is better reported in areas with developed communication structures, then we cannot know whether technological advancement actually does increase violence or if such correlations are spurious.
Empirically, we focus on the quality of reporting political violence in Africa from 2008 to 2010. There are three reasons for this. First, Africa is the region that, together with Asia, has experienced the most armed conflicts in the post–Cold War era. 1 Second, Africa is becoming known as “the mobile continent” due to its embrace of digital media over (previously under-developed) infrastructure, suggesting that communication technology may be particularly important in this region (Hersman 2013). Third, most published research on spatial variation in armed conflict is focusing on Africa, as the early version of UCDP Georeferenced Conflict Event Data (UCDP-GED; Sundberg and Melander 2013) and projects such as ACLED (Raleigh et al. 2010) and Social Conflict in Africa Database (SCAD; Salehyan et al. 2012) primarily provide data from this continent.
This paper differs from earlier work on event data quality as we are neither comparing information from different datasets (Eck 2012; Restrepo, Spagat, and Vargas 2006) nor data collected with competing methodologies (Davenport and Ball 2002; Price and Ball 2014; Weidmann 2015). Instead, we use the precision scores assigned to each event in the UCDP-GED (Sundberg and Melander 2013), which indicate the level of detail of available information. This measure is not produced following some estimation technique but represents the specific information in the coded material about when and where an event occurs. We focus on the temporal precision, approximating that events with information about the specific date are better reported than those reported as only within a given week, month, or year.
The next section outlines how new communication technology should facilitate more detailed reporting on political violence events, before we describe our research design. Following an analysis of 2,369 events in Africa from 2008 to 2010, we find a statistically significant and robust correlation between reporting quality and access to communication technology, although the size of the effect is relatively small. We then extend the analysis by exploring the original sources that offer information about political violence and find that contemporary reporting is less dependent on official statements and, instead, relies upon eyewitness accounts more than in the pre-Internet era. The final section concludes and discusses the implications of these findings for future scholarship.
Spatial Bias in Political Violence Data
Existing research on reporting contentious politics has identified two sources of bias. The first, which is the focus for this article, relates to the ability of media to access information about a given event while the second relates to the deliberate-strategic selection of which events are reported, and how these are described (Earl et al. 2004; Galtung and Ruge 1965). The spatial location may influence both the ability and the willingness to report about a particular event.
Most of the information provided by international media from conflict zones is collected by news bureaus with limited resources. This means that events that occur closer to major political centers are likely to receive more coverage simply because reporters have better access to witnesses, which should improve reporting both in terms of output and quality (Fleeson 2003; Weidmann 2015). This differs from distant sources . . . who . . . are less able to navigate the local terrain (physically but also politically and socially). Outsiders are less able to identify events, less able to understand who the combatants are, and less able to know where the best informants can be found. Distant sources may find themselves relying on the ones most readily available but farthest from the events of interest. (Davenport 2010, 70)
It has also been argued that access to information should be influenced by government censorship and other restrictions on free movement, although existing empirical evidence about this factor has so far been inconclusive. On one hand, studies show that terrorism is probably underreported in countries with limited press freedom (Drakos and Gofas 2006), and threats and violence on journalists reduced the coverage of human rights abuses in Guatemala (Davenport and Ball 2002). On the other hand, other findings indicate that dangerous security environments in general do not reduce news coverage (Urlacher 2009), and media in both Mexico and Uganda have refused to bow to government intimidation (Lawson 2002; Ocitti 2005).
The final factor that determines media content is decisions by news editors about what the audience is likely to be interested in. This is partly influenced by the nature of the story, where violent and unexpected developments usually are preferred, but also by the location of the event. The threshold for what is considered newsworthy increases with distance, meaning that minor protests close to the publication outlet may be given as much attention as exceptionally dramatic events far away (Myers and Caniglia 2004; Smith et al. 2001).
New Technology Brings New News Reporting
Communication scholars have suggested that the development of modern communication technology has fundamentally changed the nature of news media (Severin and Tankard 2010). What is important to remember, though, is that the “news media” are not a unified and coherent entity with consistent output across time and space, but a diverse set of actors and practices sensitive to competition and technological change (Fleeson 2003; Mitchelstein and Boczkowski 2009; Pavlik 2000). As in any competitive market, one of the most influential instigators of change is innovations that facilitate high-quality news gathering at a lower cost, such as the introduction of new communication technology. This influences both the means of news gathering (the input of information) and the means of publishing (the output). Therefore, as shown in Figure 1, it is not surprising that the amount of reports of violence does not perfectly correlate with the actual fluctuations of violent events.

Newswire articles on political violence in Africa (1989–2010) compared with total number of UCDP-GED events.
Journalistic practices have undergone a substantial shift following the development of Internet and mobile phone networks. Using modern communication technology, reporters can now faster and easier gather information through direct contact with witnesses rather than having to physically travel to the location of the event after-the-fact. Although this has influenced journalists everywhere, the impact of new technologies on reporting has been particularly profound in areas where access to information previously was restricted and difficult, such as in states characterized by lower economic development, where also political violence is more likely. Anecdotal evidence from Zambia and South Africa suggest that Internet access provides ordinary people with new channels to improve communication with centers of power, including the mainstream media (Goldfain and Van der Merwe 2006; Spitulnik 2002).
New technology also offer journalists access to new sources of information, as outlets such as Twitter, YouTube, wikis, and blogs provide opportunities for sources to anonymously provide documentation about events. This approach has, for example, been extensively used by civilians reporting atrocities by criminal gangs and government agents in Mexico in recent years (Kirchner 2014).
Increasing globalization and the spread of the Internet has not only influenced the ways that reporters collect information, it has also had a substantial impact on the process of publishing. The previous practice where stories were sold to and published by set-format media (newspapers, radio, and television) has been superseded in the era of Internet publishing by outlets without space constraints (Domingo and Paterson 2011). This has removed one of the most influential sources for systematic bias on whether political violence is reported, as the role of the news editor as a “gatekeeper” has been reduced (Schudson 1989).
Indeed, news agencies in the Internet age are no longer forced to exclude reports but on the contrary, encouraged to provide more output. In the contemporary news cycle, news bureaus compete about being the first to offer “breaking stories,” and journalists are expected to provide multiple versions of the same story, where the updates add details when these become available. This has led to an increased use of the Internet for information gathering from, for example, tweets, blogs, and social media, as this may provide more unique details than official press conferences (Farhi 2009).
We contend that the combined effect of all these different effects from the development of new communication technology has created variation in the quality of information available about political violence events. Reporting will be substantively better in areas where journalists easily can seek out information through Internet and mobile phone networks.
Empirical Investigation
Figure 2 visualizes the data we employ for our empirical analysis. It is worth noting that the use of modern communication technology in Africa is rarely limited by individual’s ownership of computers or mobile phones. In addition to commercial options for getting online, studies have shown that mobile phones and computers often are shared among members in the local community (Atton and Mabweazara 2011).

Map showing Internet access, UCDP-GED data, and road distances.
In this paper, we use information from events of all different types of violence covered by UCDP-GED (Sundberg and Melander 2013). This means that we are exploring the reporting of events regardless of whether these constitute part of an armed conflict between states and/or rebels (N. P. Gleditsch et al. 2002), non-state conflict (including communal violence; Sundberg, Eck, and Kreutz 2012), or one-sided violence against civilians (Eck and Hultman 2007). 2 As we are interested in the spatial variation in reporting quality, we need to focus on events for which the location is confidently reported. Thus, our analysis is restricted to the observations where we know that the report contains sufficient information to locate the event confidently at an exact town/village or within a 25 km radius from the exact location.
Dependent Variable
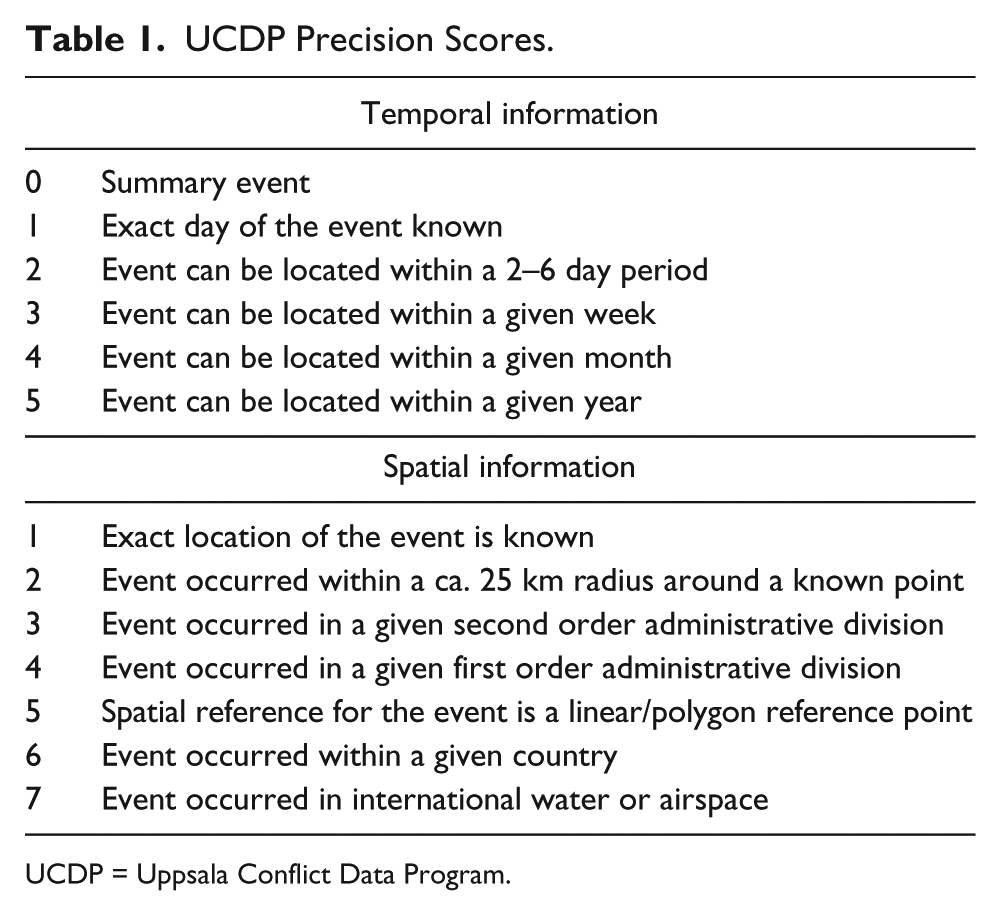
The dependent variable for our analysis consists of a previously underused facet of the UCDP-GED, namely, the precision score given to the quality of information provided about each event. The coding of this score is straightforward and directly based on the actual information provided in the news material. Table 1 summarizes the criteria for coding precision scores (Sundberg, Lindgren, and Padskocimaite 2011).
UCDP Precision Scores.
UCDP = Uppsala Conflict Data Program.
For our analysis, we recode the summary temporal precision score as 6, giving us a scale, with 1 as the most detailed information and 6 as the least specific. The information behind these scores comes from the following process. Every year, UCDP extract and collect information from a large amount of news media content, including (for Africa) outlets such as Africa Confidential and the African Research Bulletin, as well as reports from international and national nongovernmental organizations (NGOs) and other sources. However, many NGO investigations use the work of locally based journalists. For example, the sources used for the annual human rights reports by the U.S. State Department and Amnesty International are composed of a combination of stories reported in local media and onsite investigations (Kreutz 2015a).
For each political violent event coded into the UCDP-GED dataset, coders assign precision scores that reflect on the level of detail in the reports about where (where precision) and when (date precision) the event occurred. If there are multiple reports about the same event, UCDP always uses the most detailed and disaggregated information meaning that “poor” confidence scores should only be assigned for events where detailed reports are lacking.
Thus, our dependent variable is the confidence score for the temporal precision of the event. We consider reports on when an event occurred to constitute a cross-national comparable “hard fact” that we do not expect to be sensitive to political or editorial pressures that otherwise may influence the narrative of an event (Davenport 2010). Figure 3 shows the correlation matrix between spatial and temporal precision in our data, indicating substantial variation for the dependent variable in our sample.
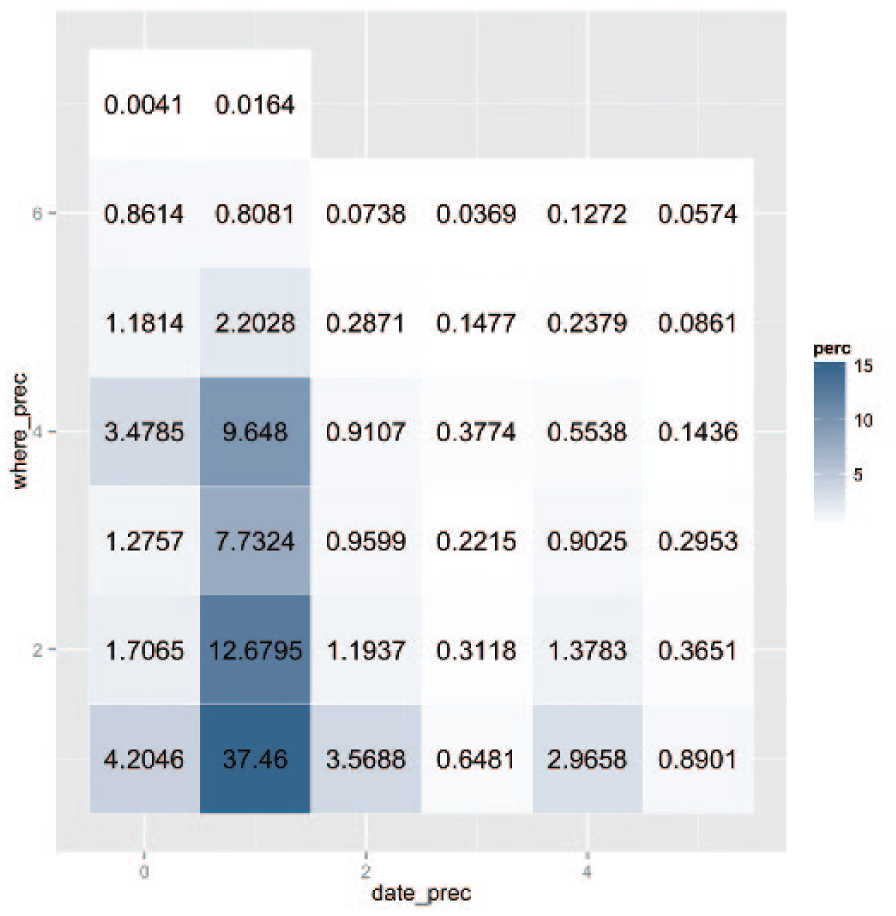
Proportions of events’ spatial and temporal precision.
Independent Variable: Internet Access
Internet access is determined by the local geography and the distance between an eyewitness and the nearest Internet node. For this, we use the Maxmind GeoIP database (the version released on December 1, 2010), which constitutes a global dataset assigning geographical information to every known Internet Protocol (IPv4) address in use. 3 These data are typically used by web-related industries for customizing or restricting content and advertising in various geographic areas.
The spatial resolution of the data is the city, while the best data point coarseness claimed is the individual IP address. Independent studies of the accuracy of IP geolocation databases has indicated a 40 percent to 60 percent accuracy rate in matching individual locations with an area (1:1 matching) within 100 km from the actual location of the assigned IP address. In Africa, Maxmind claims an accuracy of between 38 percent and 89 percent for 1:1 matching (MaxMind 2013; Poese et al. 2011; Shavitt and Zilberman 2011). We do not consider this seemingly low reliability a major concern because of the extremely demanding requirements of such tests, which are modeled on the typical commercial usage, that is, the ability to precisely identify the exact location of a random, individual IP address. As we are interested in the Internet point-of-presence (i.e., the location of Internet access), which is a much coarser measure (approximately 4 orders of magnitude) than the individual IP address, we assume that aggregation mitigates most identified 1:1 errors. 4
Calculating Distances
To link the location of a political violence event with Internet access, we measure the distance between event and Internet nodes in two ways. The first is the great circle distance (geodesic distance) calculated using PostGis 2.0.1 on the WGS84 spheroid and expressed in kilometers (i.e., the shortest possible straight-line route between event and Internet access point), while the second is the shortest possible road distance between event and the closest Internet node. 5 The two measures differ substantially, with different closest points of Internet access for more than 20 percent of events in our sample (483 out of 2,369).
To calculate road distances, we use gRoads dataset version 1 (CIESIN-ITOS-NASA SEDAC 2013), an open-source global road-network dataset. Distances between events and Internet nodes are calculated with Dijkstra’s algorithm using pgRouting 2.0 (pgRouting Project 2013) with a tolerance level of 0.01 decimal degrees (approximately 0.8–1.2 km, depending on latitude and longitude). This tolerance level is on the same magnitude as twice the stated standard error of the gRoads dataset (i.e., at least 2 × 300 m) to avoid misspecification due to potential gRoads coding errors. 6 For points not located on a road, the nearest road was used as a starting point, and the distance to that road added to the calculation. Furthermore, distances were not calculated for events located more than 50 km away from any road (excluding less than 5% of total events).
The gRoads data also provide information on the quality of the individual roads, which is useful for our purpose to measure individuals’ access to the Internet. We impose a penalty on roads classified as “trails” where we expect traveling speed to be ten times slower than on proper, even poor-quality, roads. 7 As distance calculations on a dataset as large as gRoads are computationally intensive, we identified potential closest nodes candidates through a sliding window approach with an expanding sub-setting buffer around each data point. The buffer grew by a radius of 1 decimal degree at a time, stopping when five suitable Internet nodes (to which distances could be calculated) were identified. For analysis purposes, the decimal logarithm was taken from all distances, as we expect the effect follows a logarithmic function rather than a linear one.
Statistical Technique
We model the relationship between the distance to Internet access and quality of information about political violence events as a proportional odds ordinal logistic regression (Fullerton 2009; Long and Cheng 2004). The probability of the temporal precision confidence score being a value m, with 1 ≤ m ≤ 6, is estimated as follows:
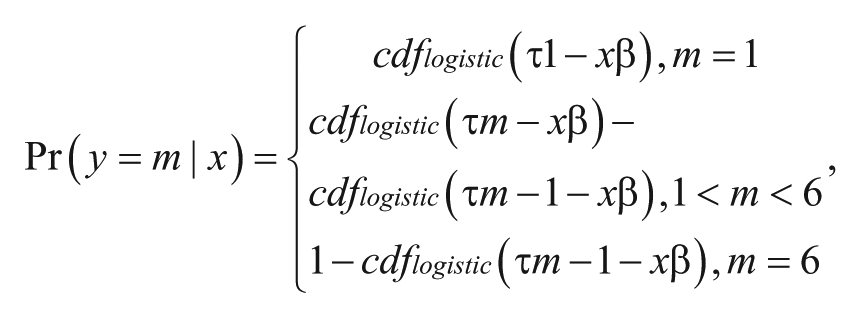
where x is the covariate vector, β is the associated coefficient vector for the covariates, τ is the unknown cutoff point between precision scores, and cdflogistic is the cumulative logistic density function (Fullerton 2009; Long and Cheng 2004). As we assume a single process determining the probabilities, the coefficient vector does not vary across the six equations, producing proportional slopes (Fullerton 2009).
As we only have one data point for Internet access locations, we subset the UCDP-GED to only include data for the 2008–2010 period, treating it as fully cross-sectional data. 8
Control Variables
A consistent finding in existing literature on media selection bias is that more violent events are given more attention (Price and Ball 2014). We, therefore, include a variable indicating the total annual intensity of the specific armed conflict, non-state conflict, one-sided violence interaction (or dyad), which the event belongs to, as well as the fatality estimate for the specific event. We are also interested in whether Internet access overlaps with other forms of modern communication technology, including mobile phones, which feature more prominently in existing research (Dafoe and Lyall 2015). 9 The data on mobile phone coverage are obtained from a high-quality print map produced by the GSM Association and Europa Technologies in January 2009 (GSM Association and Europa Technologies 2009), extracted through both geographic information systems (GIS) specific digitization and vectorization techniques (zones of coverage and lack of coverage), as well as a support vector machine-based algorithm. The support vector machine was used for categorization of pixels in buckets corresponding to coverage and lack of coverage. 10
Our dependent variable, temporal precision scores, exhibits a small degree of geographic auto-correlation with a clustering tendency (Moran’s I of .054***), 11 motivating the inclusion of a simple spatiotemporal lagged term consisting of the number of previously reported fatalities from events in the past seven days within a 25 km radius. 12 To control for local economic development, we include information on local gross domestic product (regional GDP; Nordhaus 2006), collected on a 1 × 1 degree cell (extracted from PrioGrid v.1.01; Tollefsen, Strand, and Buhaug 2012). We also control for country-level media censorship using the annual Freedom House (FH 2012) freedom of the press score. Finally, to control for the possibility that communication technology simply is a proxy for urban areas, we measure geographic features in two ways. The first is the distance in minutes to the nearest location with 50,000 inhabitants or more, using data provided by the European Commission (Nelson 2008), and the second is the proportion of mountainous terrain in a 0.5 × 0.5 degree cell where the political violence occurred (Tollefsen, Strand, and Buhaug 2012). Not surprisingly, we find a strong negative correlation between urbanization and mountainous terrain, so, to avoid multicollinearity, we include these variables in different estimations. 13
Results
Our expectation is that better access to communication technology correlates with more detailed reports of political violence. The dependent variable in all models in Table 2 is the quality in reporting the temporal location of an event, with 1 being the best and 6 being the worst. The explanatory variable (distance to closest Internet node) is measured as road distance in Models 1 to 5 and as geodesic distance in Models 6 to 10.
Quality of Reporting and Internet Access.

DV = dependent variable; GDP = gross domestic product. Output from ordinal logistic regression with standard errors in paranthesis.
p < .1. **p < .05. ***p < .01.
Across all models, we find that the quality of information, that is, the precision about events, decreases with distance from Internet nodes in line with our expectations. Results are similar regardless of how we calculate distance and consistently statistically significant on at least 95 percent confidence interval (CI). One benefit of the ordered logit is the possibility to interpret information about whether the correlation is statistically significant only in some part of the scale (i.e., potentially the best or worst reported events). We find, however, that the distance to Internet node is statistically significant for each single step. Our findings are robust when controlling for the severity of violence, both measured on a yearly basis and for the specific event, the local level of preceding violence, urbanization, mountainous terrain, local economic development, and press freedom.
In Models 4 and 9, we include the dichotomous measure of mobile phone coverage and find that the Internet distance remains statistically significant. However, a separate regression (see the appendix at http://prq.sagepub.com/supplemental/), where we replace Internet information with mobile phone coverage, also correlates with better reporting, suggesting that our finding, indeed, shows the effect of the communication process rather than the particular means used.
While our study identifies a robust statistically significant correlation, the size of the effect is relatively small. To estimate the size of the effect, we build on Model 4 in Table 1 and run 1,000 simulations for each 0.1 increase of logged road distance between 1.0 (10 km, the cutoff point in the data) and 3.2 (approx. 1,585 km, close to the maximum observed value in the data), giving us a total of 32,000 simulations. 14 The dyad severity is set to low (the most common observation type), with all other values in the model held at their observed means. 15
Figure 4 shows the simulated predicted probabilities of obtaining the best (single- day specified) and worst (summary event) precision confidence scores as a function of road distance to the closest Internet node. The blue (top) lines indicate the predicted probability that a given event is coded with the best temporal confidence, while the red lines show the predicted probability of the event given the least detailed precision. The reason that the predicted probability is much higher for getting the “best” precision is because our data consist of already coded and scrutinized events rather than all news articles. This means that our findings should be interpreted in light of the knowledge that even the “worst” reported data are still reports deemed sufficiently reliable to be coded into UCDP-GED.
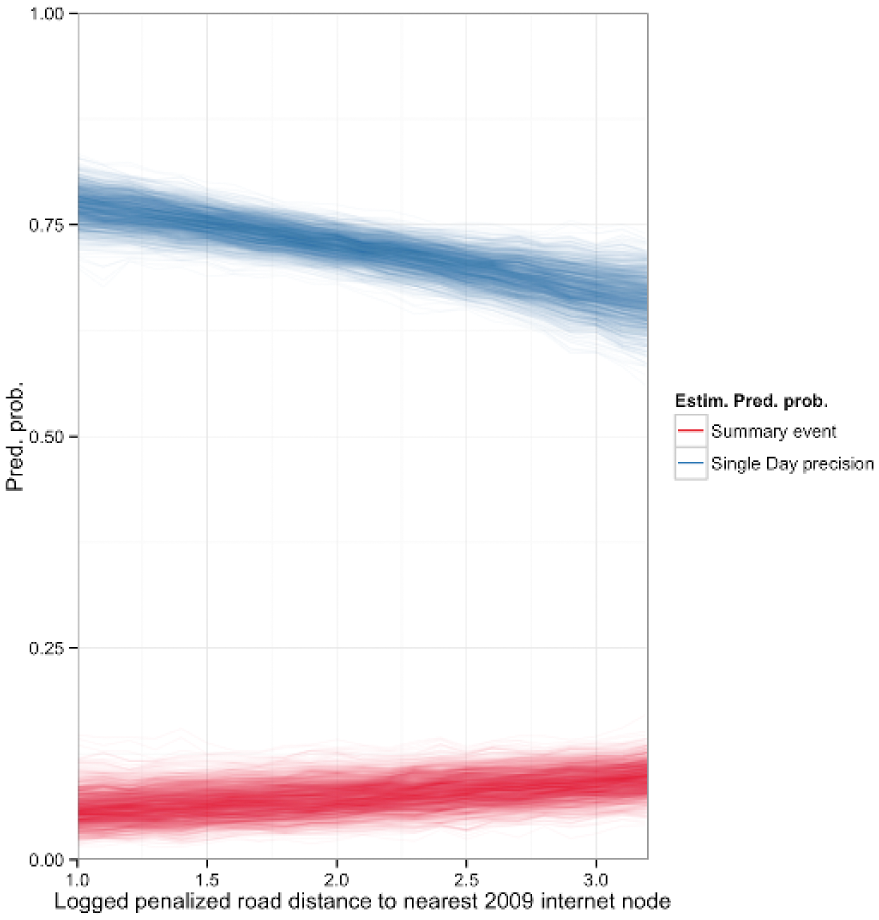
Predicted probabilities based on road distance.
For events that occur at 10 road km from an Internet node, the predicted probability that reports identify the day of the event (highest precision) is .774 (CI = [0.735, 0.811]). However, for events 100 road km away from an Internet node, the predicted probability of such detail reporting decreases to .727 (CI = [0.699, 0.753]). For events with the least precision, we identify the opposite trend as distance increases from the Internet nodes. The predicted probability of an event being reported in a summary (lowest possible precision) is .059 (CI = [0.029, 0.099]) close to Internet nodes but increases to .74 (CI = [0.041, 0.111]) at 100 km distance. 16
Turning to the control variables, some findings warrant discussion. First, there has—to our knowledge—not before been any systematic studies whether violence in more urban areas actually is better reported than in the countryside. There are claims of a consistent “urban bias” in identifying instances of political violence (Kalyvas 2004) although it has also been pointed out that insurgent activity in cities may be difficult to parse out from surrounding noise (Staniland 2010). Our study covers more forms of political violence than civil strife, but the findings in Table 2 provide mixed support regarding the effect of urbanization. Violence closer to major cities is reported with lower precision, but this is not consistently statistically significant.
The second notable finding is with regard to severity of violence and reporting quality, a factor regularly argued as making events more newsworthy and, hence, better reported (Galtung and Ruge 1965; Price and Ball 2014). In both of our tables, however, we find the opposite relationship—the precision of reporting decreases for more violent events as well as for conflicts where the overall interaction is more violent. We suspect that this may be caused by our focus solely on lethal violence, in contrast with much of the literature on newsworthiness that focuses on the size of protests (Earl et al. 2004; Herkenrath and Knoll 2011; Oliver and Myers 1999; Smith et al. 2001).
Is Communication Technology the Reason?
Our statistical analysis finds a small but statistically significant spatial variation regarding the quality of reporting of political violence, and that this correlates with distance to Internet access. To explore whether this variation can be explained by the suggested mechanism of better information provision through modern communication technology, we now take a closer, qualitative, look at the sources attributed to in the actual reports.
We revisited the background text of the UCDP-GED events and coded the collected information about original sources. To systematize these data, we group the sources into four broad categories. First, we refer to “official sources” when the original source was the government (e.g., military spokesperson, police, minister, local administration, etc.) or a dissident organization (e.g., rebel group or a media outlet controlled by a rebel group); second, “journalists” are reporters with unclear, neutral, or unknown allegiance (e.g., a national, private television or radio station; a Reuters correspondent, etc.); third, “other” sources include international organizations, NGOs, or foreign governments; and, finally, “eyewitnesses” (e.g., a local bystander).
We basically expect a greater risk of political bias when media reports are based on “official sources” while the use of “eyewitnesses” should improve the quality of reporting. To see if there has been a change over time that can be attributed to improved communication technology, we combine this information from 2008 to 2010 with UCDP-GED events from 1992–1993. In this period, access to the World Wide Web was basically nonexistent in Africa (or, for that matter, in most of the world). An additional advantage for our purposes is that the event data covering 1992–1993 were collected by UCDP-GED during 2008–2010, meaning the use of the same human coders, definitions, sources, and methodology, which means that inter-coder reliability issues are unlikely to affect the comparison.
Figure 5 shows the distribution of original sources for reports on political violence in 1993–1994 and 2008–2010. In the earlier period, the vast majority of events (67.9%) were reported by “official sources” directly linked to the belligerent parties. This contrasts with the paucity of information collected from eyewitnesses or locals, which only contributes to 16.4 percent of reports. In the post-Internet time period, we find a telling difference. In 2008–2010, the number of reports originating with eyewitnesses is almost equal to that originating from official sources (41.4% vs. 41.7%). This finding is consistent with a common claim with regard to the spread of communication technology across Africa: that it will offer opportunities for a wider range of citizens to provide information about local conditions (Aker and Mbiti 2010; Mudhai, Tettey, and Banda 2009; Ocitti 2005; Spitulnik 2002). We find a similar trend toward more detailed reporting over time in the UCDP-GED dataset overall as an increasing proportion of events are coded with higher precision scores. In 1989, only 57.4 percent of events are attributed to an individual day, while this was possible for 75.14 percent events in 2010. 17

Original sources for reporting in the 1992–1993 sample and the 2008–2010 sample.
If the spread of communication technology over time leads to data improvements, then we should expect a similar variation with regard to different types of original sources and data quality also within the modern data. We find this is the case. The data points situated near Internet nodes are almost exclusively reported using two types of primary sources. The first is extremely brief official notes and communiqués from actors involved in the violence, such as, for example, the military, the police, or rebel groups. The second, though, consists of more detailed, highly descriptive narratives that provide in-depth insights regarding the actions by different actors and the temporal ordering of the violence. Much of this latter type of information (more than 50% in areas under 150 km) is reported by sources identified as residents, protest participants, interviewees, local journalists writing opinion pieces, local community leaders, anonymous officials interviewed directly by the media, and even blogs, that is, informal, mostly independent, organizations and individuals.
As distance increases from Internet nodes, these types of in-depth narratives about specific events become less common, and the original sources for information are almost exclusively spokespersons of warring organizations, official communiqués, police and army officials, and so on, that is, actors directly involved in violence. When local narratives disappear, these “official” versions dominate available information. As a consequence of this lack of information from local sources, the quality of information decreases, including the ability to code such “hard facts” as the day of a given event.
Conclusion
Our study shows that there is variation in how well political violence is reported across space. Events that occur in areas where journalists with ease can receive information are better reported than events in the periphery. As modern communication technology has spread across the world, reporters are now able to easily access information directly from eyewitnesses and locals rather than rely solely on governmental press briefings. This means that media now provide richer, more detailed, narratives of events that offer a better understanding of the processes of political violence.
What implications do our findings have for interpreting existing scholarship or the design of new research projects? First, the heterogeneous nature of political violence data should be taken under serious consideration for analyses of event data with a long time span, as the quality of information is markedly different in the “before Internet” and “after (with) Internet” time periods. We, therefore, advise researchers to proceed with caution when using longitudinal samples of event data and to always account for temporal dependency in analyses. Our findings also suggest that studies exploring whether Internet connections or mobile phone networks facilitate violence need to acknowledge the possibility of selection bias.
Second, our investigation also provides some good news for the emerging field of cross-national micro-level studies of political violence and particularly for users of the UCDP data collection effort. The small effect size between reports where information is readily available and where it is not suggests that findings from inter-spatial (panel) studies using contemporary data generally should not be overly influenced by reporting bias. Considering that many studies aggregate violent events into district or grid-cell structures to merge with explanatory variables, a take-away from this exercise is in line with the recommendation of Weidmann (2015) that these data can be trusted as accurate at district level or within a 50 × 50 km radius.
Third, our study provides support for the claim that news media over time have improved in their capacity of capturing political violence. This may be relevant for the debate on a global decline of conflict and other forms of political violence. Our findings suggest that contemporary news data—at least in the last decade—capture sufficient information about minor instances of violence, which means that we can be relatively confident that conflict data sources are providing a good overview of current instances of global armed conflict. For earlier years, even just a few decades ago, then, information is more uncertain, and it is likely that even more cases of low-level conflict may be missing as we move farther back in time (Kreutz 2015b).
The fourth, and more worrying, implication of our findings is that we find that the quality of information declines in more violent conflicts. A possible reason for this is that in excessively violent settings, there are too many events to report, leaving less time to investigate the details of the violence. It could also be that the high risk of reporting and the destruction of infrastructure in such situations means that fewer reporters are in a position to even seek information. Case studies have alluded to this, including that news reports are particularly poor when violence escalates quickly (Davenport and Ball 2002; Restrepo, Spagat, and Vargas 2006), and influenced by which actor controls a certain territory (Price and Ball 2014). The current conflict in Syria has drawn attention to the important role of reporting for scholars’ access to conflict data (Powers and O’Loughlin 2015), and we hope that our findings can inspire further advances in this research field.
Fifth, and finally, this paper has added to what is starting to become compelling evidence in favor of treating data quality as equally important to theory and methodology in contemporary scholarship. This includes a continued attention toward identifying bias in the data employed for analysis, both through case-specific inquires and in cross-national settings. We think it is of particular importance that such studies explore countries more at risk for conflict, as well as censorship and poor working conditions, for journalists rather than only the United States or Western Europe.
Footnotes
Acknowledgements
The authors would like to thank Nils Weidmann, Suso Baleato, Mike Spagat, Erik Melander and the Uppsala Conflict Data Program, Han Dorussen and participants of the ENCoRe workshop in Konstanz 2013, editors, and anonymous reviewers for helpful comments and suggestions.
Declaration of Conflicting Interests
The author(s) declared no potential conflicts of interest with respect to the research, authorship, and/or publication of this article.
Funding
The author(s) disclosed receipt of the following financial support for the research, authorship, and/or publication of this article: Joakim Kreutz is grateful for support from the Swedish Institute of International Affairs.
Supplemental Material
Replication data and additional analyses are available at https://ucdp.uu.se and  .
.